Article

Driving Factors of Recent Vegetation Changes in Hexi Region, Northwest China Based on a New Classification Framework

1
College of Earth and Environment Sciences, Lanzhou University, Lanzhou 730000, China
2
The Key Laboratory of Western China’s Environmental Systems, Ministry of Education (MOE), Lanzhou 730000, China
*
Author to whom correspondence should be addressed.
Remote Sens. 2020, 12(11), 1758; https://doi.org/10.3390/rs12111758
Submission received: 17 April 2020 / Revised: 25 May 2020 / Accepted: 25 May 2020 / Published: 29 May 2020
(This article belongs to the Special Issue Remote Sensing of Vegetation Dynamics and Resilience)

Abstract

:
Since other factors (soil properties, topography, etc.) under natural conditions are relatively invariant over one or two decades, climate variables (precipitation and temperature) and human activities are the two fundamental factors driving vegetation changes in global or large-scale areas. However, the combined effects of either single climatic factor and human activities on vegetation changes and the role of human activities itself in a specific region has not been fully discussed. In this study, the Hexi region, a typical dryland consisting of three inland river basins in northwest China was selected as a case area. A new classification framework combining Pearson correlation analysis and residual trend approach was proposed to assess their individual and conjoint contributions of climate variables and human activities in areas of significant vegetation changes. Our results indicated that most of vegetation covered areas in the Hexi region experienced significant changes during the period 2001−2017, and vegetation improvements were widespread except the interior of oases; significant changes in vegetation caused by human activities, precipitation, the interactions of precipitation and human activities, temperature, the interactions of temperature and human activities, the interactions of temperature and precipitation, and the interactions of the three factors accounted for 50.46%, 16.39%, 19.90%, 4.33%, 2.32%, 2.11%, and 4.49% of the total change areas, respectively. Generally, the influence of temperature was relatively weaker than that of precipitation, and the contributions of the interactions of climate variables and human activities on vegetation changes were greater than that of climate contributions alone. Moreover, the results of various investigations, according to the trends and the time of vegetation changes, indicate that decreasing trends of the normalized difference vegetation index (NDVI) in the Hexi region were chiefly attributed to the adjustments of agricultural planting structure while the comprehensive treatment programs implemented in river basins supported a large proportion of vegetation improvements.

Graphical Abstract

1. Introduction

The remarkable change in processes of vegetation in the world, or in different regions of the world over the past decades, have been proved by modern remote sensing [1,2,3,4]. The significant changes in vegetation were mainly attributed to the ease of climate constraints and various human activities for survival and development. However, both the two types of driving factors may work individually or simultaneously and the relative role of climate variables and human activities in vegetation changes varies significantly from region to region. Understanding the interactions between vegetation changes and climate variations, and identifying the degree of human interventions on regional ecosystem, are important for exploring the mechanism of vegetation changes and are conducive to sustainable developments of regional ecosystems.
Monitoring long-term vegetation changes and establishing its relations to climate variations are fundamental to ascertain their potential interactions with human drivers [5]. Relationships between vegetation changes and climate variations have been measured globally and regionally by the correlation coefficients or parameters in linear regression models using remote sensing datasets and long-term meteorological observations since 1980. Generally, correlation analysis is the most widely used method [6]. Specifically, simple correlation analysis, e.g., Pearson could reveal the relationship between two variables [7,8,9,10]; partial correlation coefficient of each climate factor calculated by controlling other factors, represents the relationship between vegetation changes and the specific climate factor [11,12,13,14,15,16,17]; and multiple correlation analysis is applied to interpret the response of vegetation growth to variations of multiple climate factors [18,19]. Numerous studies had proved that vegetation growth is temperature-limited at high-latitudes and high-altitudes, but is water-limited in arid and semi-arid regions [20,21]. Generally, temperature and precipitation are two main climate factors affecting vegetation activities and the inter-annual changes of vegetation in arid and semi-arid regions are more sensitive to the fluctuations of precipitation [8,22,23,24,25].
Distinguishing and identifying areas influenced by climate variations and human activities is essential for driving factor analysis. Currently, several pixel-wise methods have been developed to distinguish drivers of climate variables and human activities based on the ascertained relationships between them. For example, a multiple regression model based on ordinary least square (OLS) is introduced to interpret relationships between vegetation changes and climate variations, the adjusted multiple coefficient of determination (adj-R2) in the model is then adopted to represent the overall effects of climate-driven vegetation changes and the remaining fractions are considered as the impacts of human drivers [11,26,27,28]. Rain use efficiency (RUE, the ratio of net primary production (NPP) to precipitation) [29] and the residual trend (RESTREND) method [30] were invented to distinguish human-induced vegetation changes from those driven by climate variations in arid and semi-arid regions. The RESTREND approach in which a significant trend in residuals derived from linear regression between the normalized difference vegetation index (NDVI) and climate variables presents human-induced vegetation changes [25,31,32,33], is more effective to do this work [34]. However, both the methods can only provide meaningful results when there is a strong linear correlation between vegetation changes and climate variations [35,36]. The NPP model-based method calculates climate-driven NPP and human-induced NPP by using the ideal NPP simulated by climate variables and the difference between ideal NPP and actual NPP, respectively [37,38,39,40,41]. Several researchers quantified the independent and conjoint relative effects of climate variations and human activities using the method by establishing several scenarios according to the trends in the three kinds of NPP timeseries [37,39,42]. However, numerous parameters and hypotheses are necessary for NPP calculations and the uncertainties in estimated NPPs will greatly affect the results of driving factor analysis [43]. Furthermore, combining trend analysis, correlation analysis, and the RESTREND approach, Leroux et al. [44] developed a classification scheme recently to categorize the factors of vegetation changes in the western Sahel zone into three types. However, precipitation was considered as an overriding climate factor in the scheme. In brief, the simultaneous actions of climate variables and the combined effects of climate variations and human activities are not fully discussed in the methods aforementioned above.
This study focused on analyzing the driving factors of vegetation changes in the Hexi region, a typical dryland area in northwest China with a highly vulnerable ecosystem due to insufficient precipitation but a dense population. For the purpose, a new framework by taking temperature and precipitation as the two cardinal climate factors was proposed to distinguish and assess the individual and conjoint effects of either climate variable or human activities on vegetation changes. The specific objectives of this paper are (1) to identify the areas, trends and time of recent vegetation changes in Hexi region; (2) to specify the role of climate variations on vegetation changes; (3) to propose a new framework to distinguish the drivers of precipitation, temperature and human activities; and (4) to further explore the underlying human drivers.

2. Materials

2.1. Study Area

The Hexi region, named for its location on the west of the Yellow River is a typical dryland area in northwest of China (Figure 1). It is selected as the study area following the objectives to investigate vegetation changes, and to distinguish and explore the driving factors of vegetation changes.
The study area has a complicated terrestrial ecosystem composed of deserts, oases, and alpine mountains. These geographic and meteorological factors (main mid-latitude westerly winds) produce a pattern of climate which changes markedly over the region. Annual average temperature ranges from 13.51 °C below zero in the Qilian mountains to 11.68 °C; in the northern plains (Figure 2a). Annual precipitation ranges from 1.66 mm to 527.82 mm over the region by gradually decreasing from south to north and from east to west (Figure 2b), and approximately 87% of the annual precipitation falls between May and September [45]. Impacted by the precipitation regime, vegetation coverage (as described by NDVI) follows a spatial gradient similar to the precipitation gradient (Figure 2c).
The main land cover types are bare land (76.65%), grassland (16.28%), cultivated land (4.96%), and forest (0.65%) according to the Global Land Cover dataset of 2010 [46]. Desert is the dominant landscape and vegetation covered areas are mainly concentrated in the southern Qilian mountains and oasis areas (Figure 1). Oases in the Hexi region have a total area of approximately 1.52 × 10⁴ km2 (2017) and a population of 4.5 million. Three inland rivers: Shiyang, Heihe, and Shule pass through the Hexi region and are the main available water resources for vegetation growth. All in all, the Hexi region clearly represent a typical dryland with complicated geographical environments and intensive human activities.

2.2. NDVI Timeseries

Moderate Resolution Imaging Spectroradiometer (MODIS) is the flagship of the Earth Observation System operated by the United States National Aeronautics and Space Administration (NASA). NASA had released several versions of MODIS products with improving data quality. The collection 6 released in February 2015 is the latest version with several improvements based on a new calibration approach [47]. MOD13Q1 datasets from April 2000 to December 2017, which had been temporally aggregated (16 days) from already processed daily data using maximum value compositing, were downloaded from the online data pool at the NASA Land Processes Distributed Active Archive Centre (LPDAAC) (https://lpdaac.usgs.gov/).
Owing to the good weather conditions for remote sensing observations and the processes of 16-day maximum value compositing, no procedure, e.g., Savitzky–Golay filter, was employed to reconstruct the original timeseries of NDVI extracted form MOD13Q1 datasets. Instead, the VI usefulness index in the VI quality detailed Quality Assessment (QA) layer of MOD13Q1 datasets was utilized to select pixels with good observations; that is, pixels with a VI usefulness index less than 4 were selected as candidate pixels. The year 2000 was excluded from the analyses in the study because the proportion of candidate pixels in images of 2000 was less than 90%. Subsequently, simple linear interpolation was adopted to fulfill the missing data in timeseries of NDVI for each candidate pixel. The 16-day maximum value NDVI composites over the growing seasons (gNDVI), which were defined by monthly temperature greater than 10 °C; (corresponding the period from May to September) were averaged for the period 2001−2017. Finally, a compiled 17-year timeseries of NDVI was generated to analyze the spatiotemporal patterns of vegetation changes, as well as their linkages to variations in temperature and precipitation.
It should be pointed out that to minimize the effects of noises and non-vegetation signals on NDVI, we only focused our study on vegetation covered areas defined as the maximum gNDVI over the period 2001–2017 not less than 0.2, which accounted for 19.42% of the Hexi region (Figure 2c).

2.3. Timeseries of Climate Variables

Monthly precipitation and temperature at 50 weather stations in and around the Hexi region were collected from the China Meteorological Data Sharing Service Systems (http://cd.cma.gov.cn). Consistent with the NDVI data time period, the monthly precipitation and temperature at each weather stations were summed and averaged over the growing season, respectively, for each year of the observation period (hereafter referred to gPRCP and gTEMP). Empirical Bayesian kriging interpolation method [48], which can automatically establish the variogram according to the spatial distribution characteristics of data itself, was then applied to generate annual gridded gPRCP and gTEMP datasets for the period from 2001 to 2017. Moreover, all the gridded datasets had a spatial resolution of 250 m to match the MODIS NDVI datasets.
The other datasets used in our study also included the ASTER GDEM (Advanced Spaceborne Thermal Emission and Reflection Radiometer Global Digital Elevation Model) dataset obtained from Geospatial Data Cloud (www.gscloud.cn), and the Global Land Cover dataset of 2010 was obtained from the National Geomatics Centre of China (http://www.globallandcover.com/).

3. Methods

3.1. Methods Involved in the Classification Framework of Driving Factor Analysis

3.1.1. Method for Detecting the Areas, Trends, and Time of Vegetation Changes

In order to disclose the potential disturbances (mainly human activities), a new method proposed in our previous study [49] was introduced in this study to identify the areas, the trends and the time of significant vegetation changes.
In previous study, we assumed that vegetation conditions are generally in a stable state or keeps gradual changing over time; once disturbed, it will change rapidly and shifts to an alternative state of changing until reaching a new equilibrium. Therefore, the timeseries of NDVI were first smoothed and prolonged according to the timepoint of the maximum change rate in timeseries. Subsequently, the non-linear patterns were determined by fitting the prolonged timeseries of NDVI using a logistic model (Equation (1)), and the remained pattern was fitted using a linear model (Equation (2)).
f ( t ) = a 1 + e b × ( t c ) + d
where t were serial numbers in the prolonged timeseries of NDVI, f(t) were values in the prolonged timeseries of NDVI, parameter a represented the change magnitude of NDVI, the symbol of b denoted the direction of vegetation change, c was the location where the fitting value was equal to (a+d)/2, and parameter d revealed the initial background NDVI value. The goodness-of-fitting was implemented by a standard F statistics test. Only the goodness-of-fitting of the part in the timeseries corresponding to the period 2001–2017 were taken into consideration.
NDVI i = s + s l o p e × i i = 1 , 2 , , 17
where i was the ith year in the smoothed timeseries of NDVI, s and slope were the parameters in the linear regression and were estimated based on OLS. The goodness-of-fitting was also tested by the standard F-test.
In this study, areas of significant vegetation changes were defined as pixels in which the fitting models had passed the statistical significance F-test, the trends of vegetation changes were identified by parameters b in Equation (1) and slope in Equation (2), and the time that vegetation conditions began to change was determined by the timepoint in timeseries at which the change rate of the curvature in the S-type curve of the logistic model exhibits the maximum or minimum.

3.1.2. Pearson Correlation Analysis

To investigate the sensitivities of vegetation changes to climate variations, pixel-wise Pearson correlation coefficients (R) between gNDVI (dependent variables) and gTEMP and gPRCP over the period 2001−2017 were calculated independently. Statistical significances of both correlations were tested at 95% confidence level and the threshold of significance was determined by a look-up table method (p-value < 0.05, corresponding to R = 0.482). If there was a significant gNDVI–gPRCP or gNDVI–gTEMP correlation (|R| ≧ 0.482), we assumed that vegetation changes were affected by precipitation or temperature; otherwise, the influences of human drivers on vegetation changes exceeded climate factors, underlying climate variables had little influences on vegetation changes.

3.1.3. RESTREND Analysis

The RESTREND approach was first introduced to discriminate between climate and human-induced dryland degradations [30]. Since vegetation growth in dryland areas is largely dependent on inter-annual rainfall, annual biomass production (NDVI as an indicator in our study) could be predicted by precipitation. Positive or negative deviations in biomass expressed in the residuals, which were defined as the differences between the observed NDVI and the predicted NDVI, are interpreted as parts induced by factors other than precipitation. The RESTREND approach is a useful method for detecting vegetation changes independent of precipitation in water-limited regions [50,51,52,53]. Currently, it is widely applied to separate human-induced vegetation changes from those driven by climate variables, followed by a deep discussion of the differentiated human activities [25,31,54,55].
In the study, gTEMP and gPRCP over the period 2001−2017, were chosen as the input climate dataset for RESTREND analyses, independently. The specific processes of RESTREND analysis at a pixel were (1) to calculate the relationship between vegetation growth and either climate factor using a linear regression between gNDVI and gTEMP or gPRCP, (2) to predict NDVI using this relationship, (3) to calculate the residuals of NDVI defined as differences between the predicted and observed NDVIs, and (4) to detect trend in residuals using a linear regression of the residuals against time. The goodness-of-fitting of the linear regressions was determined by the standard F-test (p-value < 0.05, corresponding to F = 4.543). It should be pointed out that the RESTREND approach only produces reliable results when there is a significant correlation between vegetation changes and climate variations [35]. Therefore, pixels with no significant gNDVI–gTEMP or gNDVI–gPRCP correlations were excluded in the RESTREND analyses.

3.2. A New Framework for Driving Factor Analysis

A new framework consisted of Pearson correlation analysis and the RESTREND approach was proposed in the study to address the question of separating the factors of climatic variables (temperature and precipitation) and human activities in areas of significant vegetation changes (Figure 3). Areas of significant vegetation changes were identified by the method described in Section 3.1.1. All procedures in the framework were implemented using ENVI software (version 5.1).
Since precipitation is the controlling climate factor affecting vegetation changes in arid and semi-arid regions [17,56], Pearson correlation analysis was first adopted to examine the linkages between vegetation changes and precipitation (RgNDVI–gPRCP). If there was no significant gNDVI–gPRCP correlation, the Pearson correlation analysis between vegetation changes and temperature (RgNDVI–gTEMP) was then conducted to infer if vegetation changes were closely related to temperature; where there were no significant gNDVI–gPRCP and gNDVI–gTEMP correlations, we assumed that vegetation changes only benefited from human activities; and for areas with a significant gNDVI–gPRCP correlation but a not significant gNDVI–gTEMP correlation, a significant trend in residuals derived from the linear regression between gNDVI and gTEMP (REgNDVI–gTEMP) indicated that vegetation changes were affected by temperature and human activities; otherwise, vegetation changes in those areas were only affected by temperature.
RESTREND analysis was also executed in areas where vegetation changes are closely related to precipitation to examine if a significant trend existed in residuals derived from the linear regression between gNDVI and gPRCP (REgNDVI–gPRCP). If there was no significant trend in the residuals, vegetation changes were considered to be caused only by precipitation; otherwise, changes in vegetation were caused by factors associated with precipitation. In areas where vegetation changes were affected by factors associated with precipitation, the Pearson correlation analysis between gNDVI and gTEMP was carried out to infer if vegetation changes were also affected by temperature; where there was no significant gNDVI–gTEMP correlation, it meant that vegetation changes only benefited from precipitation and human activities; and for areas with a good gNDVI–gTEMP correlation, a significant REgNDVI–gPRCP indicated that vegetation changes were affected by precipitation, temperature, and human activities; otherwise, vegetation changes in these areas are affected only by precipitation and temperature.

4. Results

4.1. Vegetation Changes in the Hexi Region

4.1.1. The Trends of Vegetation Changes in the Hexi Region

In the Hexi region, 88.72% of vegetation covered areas (gNDVImax ≧ 0.2) experienced significant changes during 2001−2017, among which 92.32% were positive while 7.67% were negative (Figure 4). Vegetation improvements were universal and mainly located in the southern Qilian mountains, the marginal areas of oases, and the downstream areas of the river basins. Moreover, vegetation conditions in the Qilian mountains had improved slightly while vegetation conditions at the edges of oases improved obviously. Areas with a decreasing trend in NDVI timeseries were concentrated in the interiors of oases, mainly in Liangzhou, Minqin, Ganzhou, Gaotai, Guazhou, and Dunhuang.

4.1.2. The Time at which Vegetation Began to Change

In order to further explore the potential human activities in the Hexi region, the time that vegetation began to increase or decrease were analyzed independently. The time that vegetation conditions began to improve are shown in Figure 5. In oasis areas (Figure 1), vegetation conditions inside the oases began to improve mainly at the early stage of the observation period (before 2005) while those in the marginal areas of oases started to improve in the years after 2007. In the upstream Qilian mountains, vegetation improvements in the middle-west of the Qilian mountains mainly took place at the early stage of the observation period while those in the eastern and the western parts of the Qilian mountains mainly took place in the years after 2009; the time of vegetation improvements at the junction zones of the Shiyang river basin and Heihe river basin were the latest (around 2013). The main periods that vegetation began to improve in the downstream areas of the Heihe river basin and Shiyang river basin were in years before 2006 and after 2010, respectively.
The time that NDVI began to decrease varied by different counties. Specifically, the time that NDVI began to decrease in Liangzhou and Minqin mainly ranged from 2006 to 2008 and 2006 to 2009, respectively (Figure 6a,b); the decrease of NDVI in Gaotai and Ganzhou mainly took place at three periods: 2001–2004, 2008–2010, and the years after 2013 (Figure 6c,d); the main periods that NDVI began to decrease in Guozhou and Dunhuang were in years after 2012 (Figure 6e,f).

4.2. Relationships between Vegetation Changes and Climate Variables

4.2.1. Relationships between Vegetation Changes and Precipitation

The Pearson correlations between gNDVI and gPRCP in the Hexi region over the period 2001−2017 are shown in Figure 7a. In the vegetation covered areas, 41.04% had a significant gNDVI–gPRCP correlation, among which 99.67% were positive. Spatially, the majority of the highly positive correlations were distributed in the Qilian mountains. Vegetation changes in agricultural oases where crops were irrigated periodically were independent of precipitation while that in wastelands in oases supported a contradictory conclusion. In addition, there were a few negative gNDVI–gPRCP correlations in oasis areas, indicating that increases in precipitation might lead to decreased trends of NDVI. More attention should be paid to better understand these anomalies.
In areas where vegetation changes were significantly related to precipitation, 57.45% of them had a significant trend in residuals and almost all of the trends were positive (99.35%), indicating that vegetation changes in nearly half of the areas affected by precipitation were also influenced by other factors (temperature or human activities) (Figure 7b).

4.2.2. Relationships between Vegetation Changes and Temperature

Correlation coefficients between vegetation changes and temperature in the Hexi region over the period 2001−2017 are shown in Figure 8a. Only 15.67% of vegetation covered areas had a significant relationship between vegetation changes and temperature, among which 86.64% were positive and 13.36% were negative. Areas with a significant positive gNDVI–gTEMP correlation were mainly distributed in the high-altitudes of the Qilian mountains. The gNDVI–gTEMP relationships in oases were negative. In other words, increase in temperature was conducive to the growth of subalpine vegetation in the Qilian mountains, but were unfavorable to vegetation growth in oases. In addition, most of vegetation changes affected by temperature were also affected by precipitation (Figure 7a).
In areas with a significant gNDVI–gTEMP correlation, 40.91% of them had a significant trend in residuals, among which 94.97% were positive and 5.03% were negative (Figure 8b). Specifically, trends in residuals in the Qilian mountains and the western oases were positive while those in the eastern oases were negative.

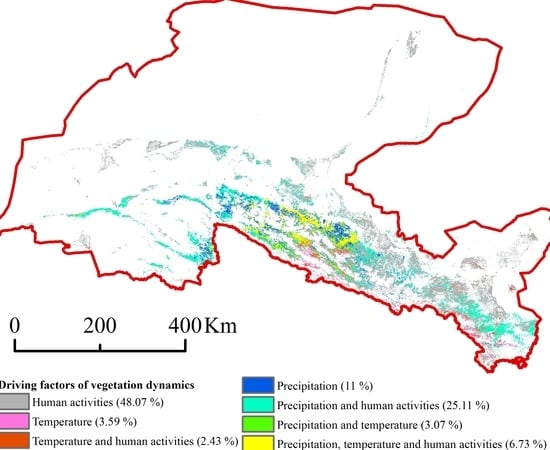
4.3. Mapping the Driving Factors Driving Based on the New Framework

The results of the driving factor analyses obtained by the new framework are shown in Figure 9. Significant changes in vegetation caused by human activities, precipitation, precipitation and human activities, temperature, temperature and human activities, precipitation and temperature, and all of the three factors accounted for 50.46%, 16.39%, 19.90%, 4.33%, 2.32%, 2.11%, and 4.49% of the total change areas, respectively. Obviously, human activities were the dominant factor affecting vegetation changes in the Hexi region. Vegetation changes driven by climate variations alone accounted for 22.83% of the total vegetation changes, and 26.71% of vegetation changes resulted from the interactions of human activities and climate variations. Spatially, human-induced vegetation changes were universal in the oasis areas and the downstream areas of the river basins; vegetation changes in the eastern and western parts of the Qilian mountains were largely attributed to the interactions of precipitation and human activities; meanwhile, vegetation changes affected by the interactions precipitation, temperature, and human activities were mainly concentrated in the upstream areas of the Heihe river basin where the driving factors of vegetation changes were more complicated than other places.

4.4. The Potential Human Activities

Combining the detected trends (Figure 4) and time of vegetation changes (Figure 5 and Figure 6), we further investigated and identified the specific human drivers in areas of vegetation changes caused by factors associated with human activities (Figure 9). Firstly, we counted the time that NDVI began to decrease in each individual year by counties and the times that vegetation conditions began to improve in each individual year in different geographical regions (Figure 10). Secondly, sample sites were selected in regions where the time of vegetation changes were same (Figure 5 and 6). Lastly, based on the trend and time of vegetation changes, various methods, e.g., high-resolution images from Google Earth Pro software (version 7.3.2) and field investigations were adopted to explore the underlying human driver at each sample site. If a specific human driver could lead to the detected increasing or decreasing trend of NDVI (Figure 4), and the time that the driver acted on vegetation was coincident with the detected vegetation change time, we considered the specific human driver as the cause of vegetation change at the sample site.
The results of various investigations indicated that urbanization, industrialization, and the constructions of infrastructure (roads or new rural settlements) has led to changes in natural land covers inside oases, causing significant decreasing trends in NDVI. Generally, the growth of urban areas, mainly distributed in areas surrounded cities or towns, accounted for a small fraction of the decreasing trends (Figure 6a–f). A total of 2323 pumping-wells in Minqin oasis were closed in the comprehensive treatment program of the Shiyang river basin (CTPSRB) (2005−2011) to reduce groundwater exploitation and irrigation consumptions [58], accompanied by nearly 512.66 km2 of farmland abandonment [59]; these initiatives led to large-scale NDVI decreasing trends in Minqin during 2006−2010 (Figure 10a). The majority of the decreasing trends in oases were due to the adjustments of agricultural planting structure (including the construction of greenhouses). There were several reasons for farmers to adjust the planting structure. Firstly, the construction of greenhouses, which was an important water-saving measure in CTPSRB, caused large-scale decreasing trends of NDVI in Liangzhou and Minqin during 2005−2008 (Figure 10a), which was confirmed by field investigation or observing the images on Google Earth (Figure 6a,b). Secondly, the agricultural industrialization aimed at integrating the agricultural lands of smallholders into agricultural cooperatives to promote large-scale specialized productions, has developed rapidly in the Hexi region along with the implementation of land transfer policies (since 2008). Crops shifted from traditional grain crops to cash crops of high profit, causing decreasing trends inside oases (Figure 6d,e). For example, traditional crops have been replaced by cotton (2007−2008) and muskmelon cultivations (since 2010) in Guazhou [60] (Figure 10b) while grain crops were replaced by various vegetables in Gaotai in 2008 (Figure 10b); the industrialized operations of land-scale greenhouses has kept increasing trends since 2008 (Figure 10c). Thirdly, in order to increase runoff to the downstream areas of the Heihe river basin, the adjustments of agricultural planting structure, e.g., reducing the planting of water-intensive crops (e.g., rice), the construction of greenhouses, and farmland abandonments involved in the short-term treatment program of the Heihe river basin (STPHRB) (2001−2010) (Figure 6c,d). These adjustments have led to universal decreasing trends of NDVI in Gaotai, Linze, and Ganzhou at the early stage of STPHRB (Figure 10c). Finally, surface mining in the Qilian mountains and farmland abandonments in the Dunhuang oasis since 2012 (Figure 10b), which were also identified by images from Google Earth Pro, have resulted in significant vegetation degradations (Figure 6f).
The vegetation improvements in the marginal areas of oases were largely attributed to the expansion of agricultural oases. A map of five-year interval changes of oasis from 1986 to 2014 in the Hexi region was analyzed in a previous study [57], in which the periods of oasis expansion agreed well with the time of vegetation improvements in oasis areas (Figure 5). Programs of grassland protection, e.g., returning grazing land to natural grassland implemented early in Subei and Sunan counties from 2003 [61,62], led to vegetation improvements in the upstream Heihe and Shule river basins at early stage of the observation period (Figure 10d). The human driver in the eastern part of Qilian mountains were attributed to the ecological projects of returning farmlands to forest or grasslands, returning grazing land to natural grassland [63], and ecological migration involved in CTPSRB, which encouraged peasants to do non-farm work through labor-export or moved out from the mountains. In addition, the main periods of vegetation greening in the downstream areas of the Heihe and Shiyang river basins (Figure 10e) were consistent with the continuous runoff in CTPSRB since 2001 and the oasis dynamics in Minqin during the observation periods [59], respectively.

5. Discussion

As a typical dryland consists of deserts, oases, and alpine mountains, vegetation changes in the Hexi region are evidently affected by climate variations. Responses of vegetation changes to climate variations in the Hexi region were ascertained in the study and have been also discussed precisely in previous studies using timeseries of remote sensing datasets and climate measurements from weather stations. Our study has further confirmed the findings in previous studies that precipitation was the absolute dominant climate factor influencing vegetation changes in the Hexi region [64,65,66]. Specifically, vegetation changes in the upper Shiyang river basin and Shule river basin were more sensitive to precipitation than temperature [19]; areas affected only by factors associated with temperature were scarce, mainly distributed in high altitudes where increasing temperature facilitated vegetation growth [67]; nevertheless, temperature was found not to correlate as highly as precipitation in the Qilian mountains where vegetation changes were influenced significantly by both temperature and precipitation [19,64,66]. In addition, we also found that approximately half of the vegetation changes in temperature-related and precipitation-related areas in the Hexi region were also affected by other factors due to a significant trend in residuals derived from the linear regression between gNDVI and gPRCP or gTEMP over the period 2001−2017 (Figure 7b and Figure 8b).
According to the findings above, a new classification framework by taking temperature and precipitation as the two cardinal climate factors was proposed in the study to distinguish and assess the respective and the combined effects of either climate variables or human activities. It is a universal method consisting of several traditional statistical approaches. Any complicated calculations and man-made parameters were not necessary, which made the method suitable for most regions in the globe, especially the arid and semi-arid regions. In addition, areas of significant vegetation changes in the framework (Figure 3) could be identified using a widely used method, e.g., linear regression based on ordinary least squares, Theil–Sen slope estimation, and Mann–Kendall test, so as to simplify the analysis.
However, the new classification framework of driving factor analysis was premised on the assumptions of linear relationships between vegetation changes and climate variables. For example, Pearson correlation analysis in the framework was adopted to measure the linear relationships between vegetation changes and either climate factor; RESTREND analyses were carried out based on the linear correlations between gNDVI and gTEMP or gPRCP. We conducted our study based on the fact that annual precipitation in the Hexi region is generally below 500 mm (Figure 2b) because several studies have demonstrated that annually-integrated NDVI was linearly related to annual precipitation when annual precipitation was below 500 mm in arid and semi-arid areas [68,69,70]. However, responses of vegetation changes to climate variations may be non-linear, seasonal, and different among plant functional types; there is also a time lag between temperature, precipitation, and response of vegetation ranging from one to several months. The form (linear, log-linear, quadratic, or others) of the functional relationship between vegetation changes and climate variations (temperature and precipitation), as well as the lagged responses of vegetation to precipitation in the Hexi region, both of which deserve further understanding, is still blurry and has not yet been investigated in great depth.
The results of driving factor analysis based on the new classification framework demonstrated that factors associated with human activities accounted for 72.34% of the significant vegetation changes. Human activities had profoundly affected vegetation changes in the Hexi region, especially in the oasis areas and the downstream areas of the river basins where vegetation changes could not be fully interpreted by climate variations. The findings in the study agreed with the standpoints in previous local studies [27,66].
The potential human drivers in the Hexi region have been explored in numerous local studies. Guan et al. [27] confirmed that the decreasing trends in NDVI observed in vicinity areas of cities were attributed to urbanization, industrialization, or the construction of rural settlements, which increased rapidly by mainly encroaching on croplands or grasslands [71]. The expansion of agricultural oases was identified as an important factor for promoting vegetation greening in northwest China (including the Hexi region) [57,72]. Owing to insufficient precipitation and high evaporation, vegetation conditions in dryland regions were largely constrained by available water resources and the treatment programs of the river basin, e.g., STPHRB and CTPSRB contributed greatly to vegetation changes. Specifically, the continuous discharges of runoffs and a series of countermeasures, e.g., the banning of grazing, afforestation, and the returning farmlands to forest or grassland involved in STPHRB and CTPSRB, has been proved to directly promote vegetation restorations in downstream areas of the Heihe river basins [73,74,75] and Shiyang river basins [73,76,77] at the early stage of the programs (Figure 10e); Diao et al. [59] and Zhang et al. [74] also found that there were a lot of newly reclaimed agricultural oases in the downstream areas, which benefited from the increased water discharge; apart from climate variations and various ecological restoration programs, several local newspapers or studies [63,78,79,80] have reported that vegetation improvements in the upstream Qilian mountains were also partly attributed to the treatment programs of river basins; furthermore, we also testified in the study that large-scale decreasing trends of NDVI inside oases resulted from various water-saving measures in STPHRB and CTPSRB. In addition, our findings demonstrated that the adjustments of agricultural planting structure were the main reason for the large-scale decreasing trends of NDVI; however, the effects of planting structure adjustments on vegetation improvements were not discussed in the study. Liu et al. [81] found that summer harvest crops (e.g., wheat and barley) were replaced by autumn harvest crops (e.g., corn and rapeseed) in Minle County, causing a reason for the greening trends in oases. The influences of the adjustments of agricultural planting structure on vegetation changes in oases deserves more attentions in future works.

6. Conclusions

We analyzed nearly two decades of vegetation changes in the Hexi region and explored the relationships between vegetation changes and climate variations. Consequently, an alternative procedure that could distinguish the individual and conjoint influences of climate variables (precipitation and temperature) and human activities on vegetation changes was proposed in the study. The method is a general approach for driving factor analysis and could categorize the factors driving vegetation changes into seven types. Our results indicated that changes in vegetation covered areas of the Hexi region were remarkable; significant changes in vegetation caused by human activities, precipitation, the interactions of precipitation and human activities, temperature, the interactions of temperature and human activities, the interactions of temperature and precipitation, and the interactions of the three factors accounted for 50.46%, 16.39%, 19.90%, 4.33%, 2.32%, 2.11%, and 4.49% of the total change areas, respectively. Obviously, human activities were undoubtedly the dominant factor driving vegetation changes in the Hexi region, especially in the oasis areas and the downstream areas of the river basins. Compared with temperature, vegetation changes were more sensitive to precipitation; moreover, nearly half of the vegetation changes in climate-related areas were caused by the interactions of climate variations and human activities rather than that of climate variations alone. Furthermore, the driving factors in the upstream areas of Heihe river basins were complicated.
Human drivers in areas of vegetation changes induced by human activities or the interactions of climate variations and human activities were disclosed according to the time and trends of vegetation changes. The results indicated that urbanization, industrialization, and the construction of infrastructure caused a small proportion of the decreasing NDVI trends, the majority of which were attributed to the adjustments of the agricultural planting structure. Vegetation improvements in the marginal areas of oases were mainly due to the expansion of agricultural oases while those in the upstream areas and downstream areas of the river basins were directly or indirectly affected by ecological restoration projects, especially the comprehensive treatment programs implemented in the river basins. In general, the comprehensive treatment programs of the river basins contributed greatly to vegetation changes in the Hexi region and the effects of human activities have shifted from negative to positive recently. Our findings provide new insights for better management and vegetation restoration in the Hexi region and other dryland basins in northwest of China or the globe.

Author Contributions

Conceptualization, J.W. and Y.X.; methodology, J.W.; software, J.W.; formal analysis, J.W., Y.X., and X.W.; investigation, J.W.; resources, J.W. and K.G.; data curation, J.W. and X.W.; writing—original draft preparation, J.W.; writing—review and editing, J.W. and K.G.; visualization, J.W.; supervision, J.W.; project administration, J.W.; and funding acquisition, Y.X., J.W., and X.W. All authors have read and agreed to the published version of the manuscript.

Funding

This work was funded by the Strategic Priority Research Program of Chinese Academy of Sciences; Pan-Third Pole Environment Study for a Green Silk Road (Pan-TPE) [NO. XDA2009000001]; the National Key Research and Development Program of China entitled, “The impacts of climate change and the civilization change of Silk Road in arid region of central Asia” [NO. 2018YFA0606404-03]; and the Fundamental Research Funds for the Central Universities [NO. lzujbky-2019-it27, lzujbky-2020-71].

Acknowledgments

The authors would like to thank the reviewers for their constructive comments.

Conflicts of Interest

The authors declare no conflict of interest.

References

  1. Fensholt, R.; Proud, S.R. Evaluation of earth observation based global long term vegetation trends—comparing GIMMS and MODIS global NDVI time series. Remote Sens. Environ. 2012, 119, 131–147. [Google Scholar] [CrossRef]
  2. De Jong, R.; Verbesselt, J.; Schaepman, M.E.; De Bruin, S. Trend changes in global greening and browning: Contribution of short-term trends to longer-term change. Glob. Chang. Boil. 2011, 18, 642–655. [Google Scholar] [CrossRef]
  3. Potter, C.; Boriah, S.; Steinbach, M.; Kumar, V.; Klooster, S. Terrestrial vegetation dynamics and global climate controls. Clim. Dyn. 2007, 31, 67–78. [Google Scholar] [CrossRef]
  4. Nemani, R.; Running, S.W.; Pielke, R.; Chase, T. Global vegetation cover changes from coarse resolution satellite data. J. Geophys. Res. Atmos. 1996, 101, 7157–7162. [Google Scholar] [CrossRef] [Green Version]
  5. Coppin, P.; Jonckheere, I.; Nackaerts, K.; Muys, B.; Lambin, E. Review ArticleDigital change detection methods in ecosystem monitoring: A review. Int. J. Remote. Sens. 2004, 25, 1565–1596. [Google Scholar] [CrossRef]
  6. Xie, J.; Mao, D.; Ren, C. An overview of researches in relations between vegetation and climate based on remote sensing (in Chinese with English Abstract). J. Northeast Norm. Univ. (Nat. Sci. Ed.) 2011, 43, 145–150. [Google Scholar]
  7. Hua, T.; Wang, X. Temporal and spatial variations in the climate controls of vegetation dynamics on the Tibetan Plateau during 1982–2011. AdAtS 2018, 35, 1337–1346. [Google Scholar] [CrossRef]
  8. Wang, J.; Price, K.P.; Rich, P.M. Spatial patterns of NDVI in response to precipitation and temperature in the central Great Plains. Int. J. Remote. Sens. 2001, 22, 3827–3844. [Google Scholar] [CrossRef]
  9. Pang, G.; Wang, X.; Yang, M. Using the NDVI to identify variations in, and responses of, vegetation to climate change on the Tibetan Plateau from 1982 to 2012. Quat. Int. 2017, 444, 87–96. [Google Scholar] [CrossRef]
  10. Deng, C. Research on Vegetation Changing and Reaction to Climate in Northwest China in the Past 22 years (in Chinese with English Abstract). Master’s Thesis, Lanzhou University, Lanzhou, China, 2006. [Google Scholar]
  11. Wen, Z.; Wu, S.; Chen, J.; Lü, M. NDVI indicated long-term interannual changes in vegetation activities and their responses to climatic and anthropogenic factors in the Three Gorges Reservoir Region, China. Sci. Total Environ. 2017, 574, 947–959. [Google Scholar] [CrossRef]
  12. Yang, X.; Liu, S.; Yang, T.; Xu, X.; Kang, C.; Tang, J.; Wei, H.; Ghebrezgabher, M.; Li, Z.; Kang, Q. Spatial-temporal dynamics of desert vegetation and its responses to climatic variations over the last three decades: A case study of Hexi region in Northwest China. J. Arid Land 2016, 8, 556–568. [Google Scholar] [CrossRef] [Green Version]
  13. Xu, H.-J.; Wang, X.-P.; Zhang, X.-X. Impacts of climate change and human activities on the aboveground production in alpine grasslands: A case study of the source region of the Yellow River, China. Arab. J. Geosci. 2017, 10, 1–14. [Google Scholar] [CrossRef]
  14. Sun, H.; Wang, C.; Niu, Z.; Bukhosor; Li, B. Analysis of the vegetation cover change and the relationship between NDVI and environmental factors by using NOAA time series data (in Chinese with English Abstract). J. Remote Sens. 1998, 2, 204–210. [Google Scholar]
  15. Gao, Z.; Liu, J. The study on driving factors and models of NDVI change based on remote sensing and GIS in China (in Chinese with English Abstract). Clim. Environ. Res. 2000, 5, 155–164. [Google Scholar]
  16. Suzuki, R.; Tanaka, S.; Yasunari, T. Relationships between meridional profiles of satellite-derived vegetation index (NDVI) and climate over Siberia. Int. J. Clim. 2000, 20, 955–967. [Google Scholar] [CrossRef] [Green Version]
  17. Nemani, R.R.; Keeling, C.D.; Hashimoto, H.; Jolly, W.M.; Piper, S.C.; Tucker, C.; Myneni, R.; Running, S.W. Climate-Driven Increases in Global Terrestrial Net Primary Production from 1982 to 1999. Science 2003, 300, 1560–1563. [Google Scholar] [CrossRef] [Green Version]
  18. Lamchin, M.; Lee, W.-K.; Jeon, S.W.; Wang, S.W.; Lim, C.-H.; Song, C.; Sung, M. Long-term trend and correlation between vegetation greenness and climate variables in Asia based on satellite data. Sci. Total Environ. 2018, 618, 1089–1095. [Google Scholar] [CrossRef]
  19. Tang, Z.; Ma, J.; Peng, H.; Wang, S.; Wei, J. Spatiotemporal changes of vegetation and their responses to temperature and precipitation in upper Shiyang river basin. Adv. Space Res. 2017, 60, 969–979. [Google Scholar] [CrossRef]
  20. Zhao, L.; Dai, A.; Dong, B. Changes in global vegetation activity and its driving factors during 1982–2013. Agric. For. Meteorol. 2018, 249, 198–209. [Google Scholar] [CrossRef]
  21. Churkina, G.; Running, S.W. Contrasting Climatic Controls on the Estimated Productivity of Global Terrestrial Biomes. Ecosystems 1998, 1, 206–215. [Google Scholar] [CrossRef]
  22. Fensholt, R.; Langanke, T.; Rasmussen, K.; Reenberg, A.; Prince, S.D.; Tucker, C.; Scholes, R.J.; Le, Q.B.; Bondeau, A.; Eastman, R.; et al. Greenness in semi-arid areas across the globe 1981–2007—an Earth Observing Satellite based analysis of trends and drivers. Remote Sens. Environ. 2012, 121, 144–158. [Google Scholar] [CrossRef]
  23. Zhu, Y.; Zhang, J.; Zhang, Y.; Qin, S.; Shao, Y.; Gao, Y. Responses of vegetation to climatic variations in the desert region of northern China. Catena 2019, 175, 27–36. [Google Scholar] [CrossRef]
  24. Liu, Y.; Lei, H. Responses of Natural Vegetation Dynamics to Climate Drivers in China from 1982 to 2011. Remote. Sens. 2015, 7, 10243–10268. [Google Scholar] [CrossRef] [Green Version]
  25. Fang, X.; Zhu, Q.; Ren, L.; Chen, H.; Wang, K.; Peng, C. Large-scale detection of vegetation dynamics and their potential drivers using MODIS images and BFAST: A case study in Quebec, Canada. Remote. Sens. Environ. 2018, 206, 391–402. [Google Scholar] [CrossRef]
  26. Xu, H.-J.; Wang, X.-P.; Yang, T. Trend shifts in satellite-derived vegetation growth in Central Eurasia, 1982–2013. Sci. Total Environ. 2017, 579, 1658–1674. [Google Scholar] [CrossRef] [PubMed]
  27. Guan, Q.; Yang, L.; Pan, N.; Lin, J.; Xu, C.; Wang, F.; Liu, Z. Greening and Browning of the Hexi Corridor in Northwest China: Spatial Patterns and Responses to Climatic Variability and Anthropogenic Drivers. Remote. Sens. 2018, 10, 1270. [Google Scholar] [CrossRef] [Green Version]
  28. Chen, Y.; Li, X.; Shi, P. Variation in NDVI driven by climate factors across China, 1983-1992 (in Chinese with English Abstract). Acta Phytoecol. Sin. 2001, 25, 716–720. [Google Scholar]
  29. Le Houérou, H.N. Rain use efficiency—A unifying concept in arid-land ecology. J. Arid Environ. 1984, 7, 213–247. [Google Scholar]
  30. Evans, J.; Geerken, R. Discrimination between climate and human-induced dryland degradation. J. Arid Environ. 2004, 57, 535–554. [Google Scholar] [CrossRef]
  31. Qu, S.; Wang, L.; Lin, A.; Zhu, H.; Yuan, M. What drives the vegetation restoration in Yangtze River basin, China: Climate change or anthropogenic factors? Ecol. Indic. 2018, 90, 438–450. [Google Scholar] [CrossRef]
  32. Zhou, X.; Yamaguchi, Y.; Arjasakusuma, S. Distinguishing the vegetation dynamics induced by anthropogenic factors using vegetation optical depth and AVHRR NDVI: A cross-border study on the Mongolian Plateau. Sci. Total Environ. 2018, 730–743. [Google Scholar] [CrossRef] [PubMed]
  33. Xie, B. Vegetation Dynamics and Climate Change on the Loess Plateau, China: 1982–2014 (in Chinese with English Abstract). Ph.D. Thesis, Northwest Agriculture & Forestry University, Yangling, China, 2016. [Google Scholar]
  34. Wessels, K.; Prince, S.; Malherbe, J.; Small, J.; Frost, P.; Vanzyl, D. Can human-induced land degradation be distinguished from the effects of rainfall variability? A case study in South Africa. J. Arid Environ. 2007, 68, 271–297. [Google Scholar] [CrossRef]
  35. Wessels, K.; Bergh, F.V.D.; Scholes, R.J. Limits to detectability of land degradation by trend analysis of vegetation index data. Remote. Sens. Environ. 2012, 125, 10–22. [Google Scholar] [CrossRef]
  36. Kuenzer, C.; Dech, S.; Wagner, W. Remote Sensing Time Series Revealing Land Surface Dynamics: Status Quo and the Pathway Ahead; Springer: Berlin, Germany, 2015; Volume 22, pp. 1–24. [Google Scholar]
  37. Liu, Y.; Zhang, Z.; Tong, L.; Khalifa, M.; Wang, Q.; Gang, C.; Wang, Z.; Li, J.; Sun, Z. Assessing the effects of climate variation and human activities on grassland degradation and restoration across the globe. Ecol. Indic. 2019, 106, 105504. [Google Scholar] [CrossRef]
  38. Liu, Y.; Wang, Q.; Zhang, Z.; Tong, L.; Wang, Z.; Li, J. Grassland dynamics in responses to climate variation and human activities in China from 2000 to 2013. Sci. Total Environ. 2019, 690, 27–39. [Google Scholar] [CrossRef] [PubMed]
  39. Zhou, W.; Gang, C.; Zhou, F.; Li, J.; Dong, X.; Zhao, C. Quantitative assessment of the individual contribution of climate and human factors to desertification in northwest China using net primary productivity as an indicator. Ecol. Indic. 2015, 48, 560–569. [Google Scholar] [CrossRef]
  40. Chen, T.; Bao, A.; Jiapaer, G.; Guo, H.; Zheng, G.; Jiang, L.; Chang, C.; Tuerhanjiang, L. Disentangling the relative impacts of climate change and human activities on arid and semiarid grasslands in Central Asia during 1982–2015. Sci. Total Environ. 2019, 653, 1311–1325. [Google Scholar] [CrossRef]
  41. Xu, D. Quantitative Assessment of the Relative Role of Climate Change and Human Activities in Sandy Desertification—A Case Study in Ordos Plateau, China (in Chinese with English Abstract). Ph.D. Thesis, Nanjing Agricultural University, Nanjing, China, 2009. [Google Scholar]
  42. Zhao, P.; Chen, T.; Wang, Q.; Yu, R. Quantitative analysis of the impact of climate change and human activities on grassland ecosystem NPP in Xinjiang (in Chinese with English Abstract). J. Univ. Chin. Acad. Sci. 2020, 37, 51–62. [Google Scholar]
  43. Ma, Q.; Jia, X.; Wang, H.; Li, Y.; Li, S. Recent advances in driving mechanisms of climate and anthropogenic factors on vegetation change (in Chinese with English Abstract). J. Desert Res. 2019, 39, 48–55. [Google Scholar]
  44. Leroux, L.; Bégué, A.; Seen, D.L.; Jolivot, A.; Kayitakire, F. Driving forces of recent vegetation changes in the Sahel: Lessons learned from regional and local level analyses. Remote. Sens. Environ. 2017, 191, 38–54. [Google Scholar] [CrossRef] [Green Version]
  45. National Science & Technology Infrastructure. Multi-Year Monthly Averaged Meteorological Gridded Datasets. Available online: http://www.cnern.org.cn. (accessed on 12 May 2019).
  46. Jun, C.; Ban, Y.; Li, S. Open access to Earth land-cover map. Nature 2014, 514, 434. [Google Scholar] [CrossRef] [PubMed] [Green Version]
  47. Didan, K.; Munoz, A.B.; Solano, R.; Huete, A. MODIS Vegetation Index User’s Guide (MOD13 Series) Version 3.00 (Collection 6). Available online: https://vip.arizona.edu/ (accessed on 12 May 2019).
  48. Krivoruchko, K. Empirical Bayesian Kriging Implemented in ArcGIS Geostatistical Analyst. Available online: http://www.esri.com/NEWS/ARCUSER/1012/files/ebk.pdf (accessed on 12 May 2019).
  49. Wang, J.; Xie, Y.; Wang, X.Y.; Dong, J.; Bie, Q. Detecting Patterns of Vegetation Gradual Changes (2001–2017) in Shiyang River Basin, Based on a Novel Framework. Remote. Sens. 2019, 11, 2475. [Google Scholar] [CrossRef] [Green Version]
  50. Ibrahim, Y.Z.; Balzter, H.; Kaduk, J.; Tucker, C. Land Degradation Assessment Using Residual Trend Analysis of GIMMS NDVI3g, Soil Moisture and Rainfall in Sub-Saharan West Africa from 1982 to 2012. Remote. Sens. 2015, 7, 5471–5494. [Google Scholar] [CrossRef] [Green Version]
  51. Brinkmann, K.; Dickhoefer, U.; Schlecht, E.; Buerkert, A. Quantification of aboveground rangeland productivity and anthropogenic degradation on the Arabian Peninsula using Landsat imagery and field inventory data. Remote. Sens. Environ. 2011, 115, 465–474. [Google Scholar] [CrossRef]
  52. Burrell, A.; Evans, J.; Liu, Y. Detecting dryland degradation using Time Series Segmentation and Residual Trend analysis (TSS-RESTREND). Remote. Sens. Environ. 2017, 197, 43–57. [Google Scholar] [CrossRef]
  53. Andela, N.; Liu, Y.Y.; Van Dijk, A.I.J.M.; De Jeu, R.A.M.; McVicar, T.R. Global changes in dryland vegetation dynamics (1988–2008) assessed by satellite remote sensing: Comparing a new passive microwave vegetation density record with reflective greenness data. Biogeosciences 2013, 10, 6657–6676. [Google Scholar] [CrossRef] [Green Version]
  54. Liu, Z.; Liu, Y.; Li, Y. Anthropogenic contributions dominate trends of vegetation cover change over the farming-pastoral ecotone of northern China. Ecol. Indic. 2018, 95, 370–378. [Google Scholar] [CrossRef]
  55. Jiang, L.; Guli·jiapaer; Bao, A.; Guo, H.; Ndayisaba, F. Vegetation dynamics and responses to climate change and human activities in Central Asia. Sci. Total Environ. 2017, 599, 967–980. [Google Scholar] [CrossRef]
  56. Di, L.; Rundquist, D.C.; Han, L. Modelling relationships between NDVI and precipitation during vegetative growth cycles. Int. J. Remote. Sens. 1994, 15, 2121–2136. [Google Scholar] [CrossRef]
  57. Xie, Y.; Bie, Q.; Lu, H.; He, L. Spatio-Temporal Changes of Oases in the Hexi Corridor over the Past 30 Years. Sustainability 2018, 10, 4489. [Google Scholar] [CrossRef] [Green Version]
  58. Hao, Y.; Xie, Y.; Ma, J.; Zhang, W. The critical role of local policy effects in arid watershed groundwater resources sustainability: A case study in the Minqin oasis, China. Sci. Total Environ. 2017, 601, 1084–1096. [Google Scholar] [CrossRef] [PubMed]
  59. Diao, W.; Zhao, Y.; Zhai, J.; He, F.; Sui, B.; Zhu, Y. Temporal saptial evolution and driving force analysis of Minqin Oasis during 1987–2017 (in Chinese with English Abstract). J. Irrig. Drain. 2019, 38, 106–113. [Google Scholar]
  60. Zhang, G. Muskmelon Plannting Improved People’s life. Gansu Daily 2012. Available online: http://gsrb.gansudaily.com.cn/system/2012/07/24/012616591.shtml (accessed on 4 March 2020).
  61. Wang, G. The Achievements in the Program of Returning Grazing Land to Natural Grass. Zhangye Daily 2006. Available online: http://zy.gansudaily.com.cn/system/2006/11/10/010180113.shtml (accessed on 4 March 2020).
  62. Bao, L. On grassland protections in a pasturing area. Agric. Dev. Equlpment 2016. (In Chinese) [Google Scholar]
  63. Mei, S. The Achievements of the Treatment Programs of Shiyang River Basins in the Headstream Areas. Wuwei Daily 2011. Available online: http://wwrb.gansudaily.com.cn/system/2011/05/31/012013603.shtml (accessed on 4 March 2020).
  64. Ma, Q.; Zhang, F.; Xu, X.; Su, Y.; Wei, Y. Dynamics of vegetation and its response to climatic factors in Pan-Hexi region (in Chinese with English Abstract). Chin. Agric. Sci. Bull. 2014, 30, 101–106. [Google Scholar]
  65. Qi, J.; Niu, S.; Ma, L.; He, H. Spatial-temporal variation of vegetation cover in Shule River Valler during 2000–2014 (in Chinese with English Abstract). J. Ecol. Rural Environ. 2016, 32, 77–766. [Google Scholar]
  66. Zhang, L. On Vegetation Cover Change and Its Influencing Factors in Typical Inland River Basin of Northwest Ecological Environment Fragile Regions (in Chinese with English Abstract). Ph.D. Thesis, Lanzhou Jiaotong University, Lanzhou, China, 2017. [Google Scholar]
  67. Liu, P.; Hao, L.; Pan, C.; Zhou, D.; Liu, Y.; Sun, G. Combined effects of climate and land management on watershed vegetation dynamics in an arid environment. Sci. Total Environ. 2017, 589, 73–88. [Google Scholar] [CrossRef] [PubMed]
  68. Kaptué, A.T.; Prihodko, L.; Hanan, N. On regreening and degradation in Sahelian watersheds. Proc. Natl. Acad. Sci. USA 2015, 112, 12133–12138. [Google Scholar] [CrossRef] [Green Version]
  69. Hsu, J.S.; Powell, J.; Adler, P.B. Sensitivity of mean annual primary production to precipitation. Glob. Chang. Biol. 2012, 18, 2246–2255. [Google Scholar] [CrossRef]
  70. Nicholson, S.E.; Davenport, M.L.; Malo, A.R. A comparison of the vegetation response to rainfall in the Sahel and East Africa, using normalized difference vegetation index from NOAA AVHRR. Clim. Chang. 1990, 17, 209–241. [Google Scholar] [CrossRef]
  71. Liu, Y.; Song, W.; Deng, X. Understanding the spatiotemporal variation of urban land expansion in oasis cities by integrating remote sensing and multi-dimensional DPSIR-based indicators. Ecol. Indic. 2019, 96, 23–37. [Google Scholar] [CrossRef]
  72. Guli·jiapaer; Liang, S.; Yi, Q.; Liu, J. Vegetation dynamics and responses to recent climate change in Xinjiang using leaf area index as an indicator. Ecol. Indic. 2015, 58, 64–76. [Google Scholar] [CrossRef]
  73. Feng, Q.; Miao, Z.; Li, J.; Li, J.; Si, J.; S, Y.; Chang, Z. Public perception of an ecological rehabilitation project in inland river basins in northern China: Success or failure. Environ. Res. 2015, 139, 20–30. [Google Scholar] [CrossRef] [PubMed]
  74. Zhang, M.; Shuai, W.; Fu, B.; Gao, G.; Shen, Q. Ecological effects and potential risks of the water diversion project in the Heihe River Basin. Sci. Total. Environ. 2018, 619, 794–803. [Google Scholar] [CrossRef] [PubMed]
  75. Jin, X.; Hu, G.; Li, W. Hysteresis Effect of Runoff of the Heihe River on Vegetation Cover in the Ejina Oasis in Northwestern China. Earth Sci. Front. 2008, 15, 198–203. [Google Scholar] [CrossRef]
  76. Zhu, Q.; Li, Y. Environmental Restoration in the Shiyang River Basin, China: Conservation, Reallocation and More Efficient Use of Water. Aquat. Procedia 2014, 2, 24–34. [Google Scholar] [CrossRef]
  77. Ren, L.; Ran, Y.; Ren, L.; Tan, M. Temporal-spatial characteristics of vegetation change in Shiyang River Basin during 2001 to 2018 and its implication for intergrated watershed management (in Chinese with English Abstract). J. Glaciol. Geocryol. 2019, 41, 1–10. [Google Scholar]
  78. Hu, Q.; Zhang, Z. The Seventh Report on the Comprehensive Treatment Program of Shiyang River Basin. Wuwei Daily 2007. Available online: http://ww.gansudaily.com.cn/system/2007/05/29/010363124.shtml (accessed on 4 March 2020).
  79. Li, J.; Li, L. The effectiveness and strategies of the treatment program of Shiyang river basin in the headstream areas. Agric. Technol. 2016, 36, 73–75. (In Chinese) [Google Scholar]
  80. Zhang, Y.; Tang, D.; Zhu, X.; Sun, L. Evaluation the effectiveness of short-term treatment program of Heihe river basin in the upstream areas. Yellow River 2009, 31, 23–24. (In Chinese) [Google Scholar]
  81. Liu, Y.; Song, W.; Mu, F. Changes in ecosystem services associated with planting structures of cropland: A case study in Minle County in China. Phys. Chem. Earth Parts A/B/C 2017, 102, 10–20. [Google Scholar] [CrossRef]
Figure 1. The study area in northwest China and its main features.
Remotesensing 12 01758 g001
Figure 2. The spatial patterns of annual average temperature (a) and annual precipitation (b) in the Hexi region. The multi-year monthly precipitation and temperature gridded datasets over the period 1961–2000 obtained from the National Science and Technology Infrastructure [45] were summed and averaged, respectively, to generate the precipitation and temperature dataset shown in (a) and (b), respectively. (c) represents the maximum gNDVI (normalized difference vegetation index average over the growing season) for the period 2001−2017.
Remotesensing 12 01758 g002
Figure 3. The flowchart of the new classification framework.
Remotesensing 12 01758 g003
Figure 4. Trends of vegetation changes in the Hexi region of northwest China detected by the method proposed in our previous study [49]. Only vegetation covered areas with the maximum gNDVI over the period 2001−2017 with not less than 0.2 were discussed in our study.
Remotesensing 12 01758 g004
Figure 5. The time that vegetation conditions began to improve in the Hexi region. Areas in the black dotted frames represent the main regions of oasis expansion obtained from previous local study [57].
Remotesensing 12 01758 g005
Figure 6. The time that NDVI began to decrease in the oases where decreasing trends were concentrated (as showed in Figure 4). (a)–(f) represent the time that NDVI began to decrease in Liangzhou (a), Minqin (b), Gaotai (c), Ganzhou (d), Guazhou (e), and Dunhuang (f), respectively. The human drivers of the decreasing trends in the sample sites obtained from various investigations according to the trends and time of vegetation changes were further classified and are shown in the figure.
Remotesensing 12 01758 g006
Figure 7. Correlation coefficients between gNDVI and gPRCP in the Hexi region over the period 2001−2017 (a) and trends in residuals derived from the linear regression between gNDVI and gPRCP over the period 2001−2017 (b).
Remotesensing 12 01758 g007
Figure 8. Correlation coefficients between gNDVI and gTEMP in the Hexi region over the period 2001−2017 (a) and trends in residuals derived from the linear regressions between gNDVI and gTEMP (b).
Remotesensing 12 01758 g008
Figure 9. The results of driving factors analysis in the Hexi region based on the new framework proposed. Percentages in the legend were the proportion of vegetation changes caused by the each driving factors to the total vegetation changes.
Remotesensing 12 01758 g009
Figure 10. The statistics on the time that NDVI began to decrease in different counties of Wuwei Prefecture (a), Jiuquan Prefecture (b), and Zhangye Prefecture (c); and the statistics on time that vegetation conditions began to improve in the upstream areas (d) and the downstream areas (e) of the river basins. Values in the Y axes of each histogram were the number of pixels in each individual year. Only the pixels where vegetation changes were driven by the factors associated with human activities (Figure 9) were counted in the histograms.
Remotesensing 12 01758 g010

