Article

Transforming Unmanned Aerial Vehicle (UAV) and Multispectral Sensor into a Practical Decision Support System for Precision Nitrogen Management in Corn

by
Laura J. Thompson
1,* and
Laila A. Puntel
2
1
University of Nebraska Extension, University of Nebraska-Lincoln, 116 W 19th Street, Falls City, NE 68355, USA
2
Department of Agronomy and Horticulture, University of Nebraska-Lincoln, Keim Hall, 1825 N 38th Street, Lincoln, NE 68583-0915, USA
*
Author to whom correspondence should be addressed.
Remote Sens. 2020, 12(10), 1597; https://doi.org/10.3390/rs12101597
Submission received: 6 April 2020 / Revised: 14 May 2020 / Accepted: 15 May 2020 / Published: 17 May 2020
(This article belongs to the Special Issue Remote Sensing for Sustainable Agriculture and Smart Farming)

Abstract

:
Determining the optimal nitrogen (N) rate in corn remains a critical issue, mainly due to unaccounted spatial (e.g., soil properties) and temporal (e.g., weather) variability. Unmanned aerial vehicles (UAVs) equipped with multispectral sensors may provide opportunities to improve N management by the timely informing of spatially variable, in-season N applications. Here, we developed a practical decision support system (DSS) to translate spatial field characteristics and normalized difference red edge (NDRE) values into an in-season N application recommendation. On-farm strip-trials were established at three sites over two years to compare farmer’s traditional N management to a split-application N management guided by our UAV sensor-based DSS. The proposed systems increased nitrogen use efficiency 18.3 ± 6.1 kg grain kg N−1 by reducing N rates by 31 ± 6.3 kg N ha−1 with no yield differences compared to the farmers’ traditional management. We identify five avenues for further improvement of the proposed DSS: definition of the initial base N rate, estimation of inputs for sensor algorithms, management zone delineation, high-resolution image normalization approach, and the threshold for triggering N application. Two virtual reference (VR) methods were compared with the high N (HN) reference strip method for normalizing high-resolution sensor data. The VR methods resulted in significantly lower sufficiency index values than those generated by the HN reference, resulting in N fertilization recommendations that were 31.4 ± 10.3 kg ha−1 higher than the HN reference N fertilization recommendation. The use of small HN reference blocks in contrasting management zones may be more appropriate to translate field-scale, high-resolution imagery into in-season N recommendations. In view of a growing interest in using UAVs in commercial fields and the need to improve crop NUE, further work is needed to refine approaches for translating imagery into in-season N recommendations.

Graphical Abstract

1. Introduction

Nitrogen (N) fertilizer management in cereal crop production remains a critical issue. Because insufficient N fertilization can lead to significant yield loss [1], producers in the US Midwest commonly apply high amounts of N to ensure high yields [2,3]. Unfortunately, only one-third to one-half of the N fertilizer input is recovered in the harvested product [4,5,6,7], suggesting both low N use efficiency (NUE; the ratio of N recovered in harvested products relative to N inputs) and high potential N losses to the environment, resulting in negative impacts [7,8,9]. Nitrogen losses by leaching are proportional to N rates applied, increasing rapidly at rates greater than the economic optimum N rate (EONR) [10,11].
Low NUE has been attributed to several factors, including: (1) poor synchrony between N fertilizer applications and crop N demand and (2) unaccounted-for spatial and temporal variability in soil-available N and crop N need [4,12,13]. Improvements in NUE may be achieved by applying a portion of the N fertilizer in-season, thereby allowing N availability to coincide more closely with crop N demand [14]. For modern corn hybrids, 25% to 42% of N uptake may occur after R1 [15,16,17,18], further demonstrating the value of mid- and late-season N applications.
Crop sensors and remote sensing technologies that provide an estimate of crop N status during the season have been used extensively for in-season management [19,20,21,22,23,24,25,26,27,28]. In particular, proximal active sensing technologies have been used in variable-rate N recommendations for corn and were able to increase NUE and improve upon farmer’s N management strategies [22,24,29,30,31]. These sensors are considered “on-the-go” when mounted on an applicator with variable rate capabilities; crop sensing and N application can occur simultaneously, resulting in a rapidly implemented system as post-processing of sensor data is not required in order to make N recommendations [32].
Although promising as an N diagnostic tool there are several limitations to “on-the-go” active canopy sensing which contribute to the its low adoption (9%) [33]. Active sensors need close proximity to the target, which limits their use to earlier in the growing season. Generally, the tractor-mounted active sensor is only used once during the growing season and results in low temporal resolution. This increases the risk of misdiagnosing crop N need for the growing season: if the system is deployed too early, N stress may not yet be detected, resulting in no N application (even though N fertilizer may be needed later in the season); conversely, if the crop sensing occurs too late, irrecoverable yield loss may occur [26]. In addition, existing “on-the-go” systems are unable to incorporate site-specific information such as yield data, soil mapping, and other spatial data layers to further refine the N rate within a determined management zone (MZ) [34,35]. To maximize the benefits of in-season application, systems which dynamically determine the optimal N rate in response to spatial variability and within-year growing season conditions would have better likelihood to match the site-specific EONR [35,36,37,38].
With the growing UAV market and numerous demonstrated UAV applications in production agriculture such as weed detection, disease monitoring, crop biomass estimations, crop yield loss estimations, and plant phenotyping [39,40,41,42,43,44,45,46,47,48,49,50], there is an increasing opportunity to use sensors to inform producers about the crop N status and its within-field variability in order to make data-driven N management decisions. While active sensors have been tested on UAVs, in order for the active sensors to operate effectively, the UAV needs to maintain a range of 0.5 to 1.5 meters above the crop [51,52], limiting their applicability in field-scale sensing. At this altitude, UAV operation would be difficult in rolling topography, and current battery operating constraints would limit the data collection. Therefore, there is great opportunity in using passive, multispectral sensors, as these have commonly been used at a greater distance, such as on airplanes, and have been miniaturized, allowing them to be used on UAVs [53].
A UAV system mounted with a passive sensor could be used multiple times during the growing season providing greater temporal resolution, thus more opportunities to timely detect N stress and translate it into a more targeted prescription map. Although this implies image post-processing, the user has more control of the factors (e.g., MZ) that could be incorporated into the final prescription and has the opportunity to do a data-driven review of the recommendation prior to the application.
A central piece of a remote sensor-based N decision system relies on the ability of sensor algorithms to relate reflectance values and derived vegetation indexes (VIs) to crop N need [26]. One such algorithm developed by Holland and Schepers [54] has been simplified for commercial use and requires the user to input the user-predicted EONR for the whole field, the amount of N applied prior to sensing, and a sufficiency index (SI). The SI relates the VIs of the target crop to an area of the field that is not N-limiting [54,55] and serves to normalize data, effectively allowing crop N status to be compared across fields, hybrids, and sampling dates [56]. However, applying a high N rate to establish this high N (HN) reference may be undesirable due to environmental concerns and the possibility of inducing crop sulfur deficiencies which would be undetectable from N deficiency by the sensor [26]. Therefore, to avoid these negative outcomes, a statistical approach, known as a virtual reference (VR), was proposed by Holland and Schepers [57] (here referred to as VR_HS), which utilizes the 95th cumulative percentile of a histogram of VI data to generate the reference value, rather than an actual, physical reference strip. Sensor algorithms have been developed primarily for active crop canopy sensors [26]. Thus, it is critical to evaluate the performance of HN and VR methods when using passive multispectral sensors with high-resolution data. In our field experiments, we used a simplified version of the VR approach (VR_simp) and we quantified the impact of using VR_HS and HN methods on the recommended N rate.
While much work has been done demonstrating that a UAV with passive multispectral sensors can detect N stress in cereal crops [53,58,59,60], little has been done to transform these multispectral sensor readings into a practical N recommendation system to be applied in commercial farming operations [61], thereby further contributing to the limited adoption of this technology. Therefore, the present work developed, implemented, and evaluated a practical system for transforming passive multispectral imagery collected with a UAV into a spatially variable, in-season N prescription. The proposed DSS also enables the incorporation of spatially variable field characteristics when data are available. The particular objectives of this research were:
  • Determine if a UAV mounted with a passive multispectral sensor and available N recommendation algorithms could improve NUE (as measured by partial factor productivity of N [PFPN]) by optimizing yield and N rates compared to farmers’ traditional management;
  • Quantify the impact of HN and VR sensor normalization approaches on in-season N recommendations when utilizing high spatial resolution data;
  • Evaluate implications and limitations of the proposed UAV-sensor-based DSS for N recommendations.

2. Materials and Methods

2.1. Experimental Sites and Design

The study was conducted during the periods 2017 (17) and 2018 (18) on a total of three field sites in Richardson County in southeast Nebraska. All three sites were non-irrigated, planted in 0.762 m rows and had soybeans as the previous crop. Soil texture was predominantly silt loam and average site organic matter (OM) was 2.5 to 3.2 g kg−1. Soil characteristics and agronomic practices for the sites are provided in Tables S1 and S2. The cumulative precipitation from January 1 to flowering (4–5 July) in 2018 was only 235 mm, while in 2017 precipitation was 453 mm, similar to the corresponding long-term average (2006 to 2016) of 447 mm (Figure 1). Monthly air temperature is provided is Table S3.
Each site contained four replications arranged in a randomized complete block design. Experimental units were the length of the field. Experimental units ranged from 1.9 to 2.6 ha (45.7 m wide) for ZP17, 1.2 to 1.7 ha (27.4 m wide) for DA18, and 0.64 ha (27.4 m wide) for YL18. For ZP17, three treatments were tested: (1) the cooperating farmer’s traditional N management, (2) UAV and passive sensor based method with a base rate of 84 kg ha−1 (UAV_84), and (3) UAV and passive sensor based method with a base rate of 112 kg ha−1 (UAV_112). Additionally, high N (HN) reference blocks were established at the time the base rate was applied, ensuring that a portion of the field would have sufficient N, and allowing for the evaluation of reference methods. At ZP17, the two HN blocks were 0.2 ha in area and received a rate of 252 kg ha−1. For YL18 and DA18, two treatments were tested: (1) the cooperating farmer’s traditional N management and (2) UAV_112. The two HN blocks at DA18 were 0.1 ha in area with a rate of 252 kg ha−1 N; the HN blocks at YL18 were of area 0.07 and 0.03 ha and 252 kg ha−1 N.
The rates for the cooperating farmer’s traditional N management treatments were determined by the farmer and their crop advisors. For ZP17, the farmer elected to apply 179 kg ha−1 initially on 15 February 2017 as anhydrous ammonia and then, due to anticipated high yields, applied an additional 45 kg ha−1 on 29 June 2017 as aerially applied stabilized urea. For YL18, 179 kg ha−1 was applied on 30 November 2017 as anhydrous ammonia. For DA18, 202 kg ha−1 was applied on 1 December 2017 as anhydrous ammonia. For the 2018 sites, no additional N was applied to the farmer’s traditional N management strips during the growing season due to poor anticipated yield potential due to drought. The sensor-based treatments (UAV_84 and UAV_112) follow the decision support system for in-season N management described in Section 2.2.

2.2. Sensor-Based In-Season N Rate Decision System

A generalized approach used to transform high-resolution data from a passive sensor into an in-season N rates is shown in Figure 2.
The sensor algorithm (Equation (1); Figure 2l) utilized in this work was a simplified version of the Holland-Schepers algorithm [26,54,57] and requires three inputs (noted where they correspond in Figure 2 with a bold outline and notation as sensor algorithm input): (1) user-predicted EONR (Figure 2a,d), (2) SI (Figure 2j), and (3) base N rate and N credits (Figure 2k).
N   Rate = ( User   predicted   EONR Base   N   Rate N   Credits ) 2 0.30 × ( 1 SI )
ArcGIS raster calculator was used to generate the spatial in-season N prescription on a grid basis (Figure 2m) based on these variables. The method used to obtain each of these inputs is described as follows:
1.
User-predicted EONR. The EONR was determined using a corn nitrogen recommendation algorithm developed by the University of Nebraska-Lincoln [62] to standardize the user-predicted EONR [24,63]. The N recommendation algorithm requires expected yield (EY), OM, N credits, and soil nitrate-N concentration as follows:
N   Recommendation = ( 35 + ( 1.2 EY ) ( 8 NO 3 N   ppm ) ( 0.14 EY OM ) N   credits )
Many of the inputs could be spatially variable, and, as such, EONR can be calculated site-specifically within the field. For ZP17, the zonal approach was used; for YL18 and DA18, due to lack of available spatial data, the simplified approach was used. Additional details on how the values used in Equation (2) were obtained are included in Table S4.
2.
SI. Imagery was acquired using a DJI™ Inspire 1 multi-rotor UAV (DJI, Shenzhen, China) in 2017 and a DJI™ Inspire 2 multi-rotor UAV (DJI, Shenzhen, China) in 2018 (Figure 3; Figure 2e). Each were equipped with a MicaSense® RedEdge® five-band multispectral sensor (MicaSense, Inc., Seattle, WA, USA) (Figure 3, inset). The spectral resolution of the RedEdge® sensor includes five bands: a blue band with 475 nm center and 20 nm bandwidth FWHM (full width at half maximum), a green band with 560 nm center and 20 nm bandwidth, a red band with 668 nm center and 10 nm bandwidth, a red edge band with 717 nm center and 10 nm bandwidth, and a near-infrared band with 840 nm center and 40 nm bandwidth.
Imagery was acquired at 120 m above ground level (AGL), resulting in a ground sample distance of 8.2 cm pixel−1. The radiometric resolution was 16-bit with pixel dimensions of 1280 by 960. Flights were conducted using autonomous flight planning software which allowed the study area to be flown in a systematic, serpentine path. All flights were conducted with a minimum of 75 percent overlap in images in both the forward and side-to-side direction and imagery was acquired within three hours of solar noon. ZP17 study area was approximately 30 ha, which resulted in approximately 4600 images being captured per flight, DA18 study area was approximately 11 ha, resulting in approximately 1725 images being captured per flight, and YL18 study area was 9.3 ha, resulting in approximately 1700 images being captured per flight.
Imagery was acquired at multiple dates to produce a high temporal resolution so that N deficiencies could be detected and corrected with an in-season N application before unrecoverable yield loss occurred. Following image acquisition, images were transferred to a computer hard drive and pre-processed to create a complete mosaic of the field (Figure 2f). Imagery pre-processing and stitching was completed using MicaSense Atlas (MicaSense, Inc., Seattle, WA, USA) in 2017. This service was discontinued after the 2017 growing season, therefore Pix4Dmapper (Pix4D, S.A., Prilly, Switzerland) was utilized in 2018. A downwelling light sensor (installed on top of the aircraft) and calibrated reflectance panel were used for calibration (Figure 2g). The downwelling light sensor provides a record of the light conditions during the flight and information is embedded in an XMP tag for each image; this information is used within the imagery processing and stitching software to normalize the images captured during the flight. Reflectance targets were also imaged prior to each flight and used within the imagery processing and stitching software to do an additional radiometric calibration for in field conditions. The NDRE index was used (Figure 2h) rather than the normalized difference vegetation index (NDVI), as NDRE has more sensitivity to increasing chlorophyll levels, particularly for crops with leaf area index values greater than two [64,65,66,67]. The NDRE equations were calculated on the stitched raster image on a per-pixel basis using ESRI® ArcMap (ESRI, Redlands, CA, USA) GIS software [68] raster calculator process as follows
Normalized   difference   red   edge   index   ( NDRE ) : NDRE = NIR Red   Edge NIR + Red   Edge
Each stitched mosaic was inspected as both an RGB image and NDRE display to visually detect any anomalies or issues. Such issues may occur as a result of changing light conditions due to clouds, which create light and dark spots on the stitched image, windy conditions which move the crop canopy and can result in the middle portion of the field not being stitched, or due to the bidirectional reflectance distribution function. If issues were detected, the imagery was reprocessed, and if anomalies could not be corrected, the imagery was reacquired at the next opportunity. For ZP17, usable imagery was acquired on 5 June, 16 June, 24 June, 14 July, and 4 September. For YL18 and DA18, usable imagery was acquired on 3 June, 10 June, 18 June, 22 June, 27 June, 8 July, 21 July, and 9 August.
Background reflectance from soil is one of the most challenging obstacles to detecting maize N deficiencies early in the growing season [20]. In 2017, the imagery was further processed using ESRI® ArcMap GIS software (ESRI, Redlands, CA, USA) Iso Cluster Unsupervised Classification tool with three classes. The Iso Cluster Unsupervised Classification tool combines the functionalities of the Iso Cluster and Maximum Likelihood Classification tools. These classes were examined and labeled as plant, soil, or shadow. A mask was applied to remove pixels that were representing soil or shadow, so that only plant pixels would be used in further processing (Figure 2i); 73% of the pixels were retained as plant pixels at the V12 growth stage. In contrast, at the V6 to V7 growth stage, only 25% to 40% of pixels may be considered to be plant material [69]. In 2018, the unsupervised classification and masking was not conducted due to concern that the high computer processing requirements may cause delays in prescription development; therefore, whole images were used for analysis. This limits the comparisons which can be made between 2017 and 2018.
The SI (Figure 2j) for the field experiments was calculated by dividing the vegetation index values in the area to be fertilized by the reference value. For the field experiment, reference values were calculated using the VR_simp method. VR_simp utilizes the NDRE value located at the 95th percent point on the pixel frequency NDRE value histogram, whereas VR_HS utilizes the cumulative 95th percentile of the pixel frequency NDRE value histogram. VR_simp was proposed as it can be calculated more feasibly by practitioners using commercially available, agriculture-specific geospatial software (such as Ag Leader SMS [70]) or ESRI ArcMap (the software used for this study), while VR_HS required the use of R 3.6.2 [71] software to calculate. For ZP17, SI was calculated on a per pixel basis, then averaged to a grid of 24.38 by 60.96 m which corresponded to the spatial resolution usable by the variable rate controller on the airplane. For DA18 and YL18, the NDRE values were first averaged to the grid of 24.38 by 60.96 m, then divided by the reference value to obtain an SI for each grid. Both approaches produce the same result. The N rates recommended by VR_simp were compared with the N rates recommended by the traditional HN reference method and VR_HS (details are in Section 2.4).
3.
Base N rate and N credits. The amount of N fertilizer applied before crop sensing was 84 or 112 kg ha−1 depending on the base rate treatment. Base rates were established using anhydrous ammonia (82% N) applied on 15 February 2017 for ZP17, 30 November 2017 for YL18, and 1 December 2017 for DA18. Additional credits may be taken for irrigation water N, soil N test, or previous crop credits; however, we accounted for these (where relevant) in sensor input 1 (user-predicted EONR) therefore they were not accounted for again here.

2.3. Timing of In-Season N Recommendation

The original protocol identified 0.95 SI as the threshold to trigger in-season N application [23,25,56,65,72]. The SI threshold allows N application to be dictated by crop N need as expressed by the plant. The SI threshold for triggering application is preferred to identifying a phenological trigger, as phenology is not a reliable indicator of N need due to numerous environmental factors impacting plant-available N [4,12,13]. Regardless, practical constraints, such as equipment available for in-season N application (high-clearance applicator versus low-clearance applicator) may dictate that N application must occur before the crop reaches a specific height. In the field experiments in the present work, the VR_simp method resulted in UAV treatments that were always below 0.95, even early in the growing season, before N deficiency would be expected. For that reason, this method of determining when to trigger the timing of N application was abandoned. In 2017, the N application was initiated when a visual difference in the NDRE raster imagery could be seen between UAV_84, UAV_112, and the HN reference. In 2018, a visual difference between UAV_112 and the HN reference was not seen, therefore application was triggered at the latest possible time to ensure the application was made prior to tasseling. The variable rate N recommendation was averaged into 24.38 by 60.96 m grids to match the spatial resolution useable by the variable rate controller on the airplane. For ZP17, the rates to apply to each grid in-season ranged from 101 to 134 kg N ha−1 for UAV_84 and 67 to 101 kg N ha−1 for UAV_112 and application was made on 29 June 2017 at V12 using urea coated with Gavilon Nitrolock Technology™ NBPT stabilizer. For YL18 and DA18, the range of in-season rates to apply to each grid for UAV_112 was much smaller, 20 to 29 kg N ha−1 for YL18 and 53 to 62 kg N ha−1 for DA18. These recommended rate ranges did not warrant a variable rate application; therefore, a single rate of 28 and 59 kg N ha−1 was applied to all UAV_112 strips for YL18 and DA18, respectively. The in-season applications were made on June 28, 2018 at V17 using urea coated with Gavilon Nitrolock Technology™ NBPT stabilizer. Following N application, on 30 June 2018, YL18 received a 2.7 cm rainfall and DA18 received a 1.1 cm rainfall.

2.4. Data Analysis

After application, log files from the airplane application were examined to ensure the accuracy of product placement. Corn yield data were collected using a combine with a calibrated yield monitor. Yield data were post-processed using Yield Editor [73] and adjusted to 15.5% moisture content. Partial factor productivity for N was calculated by dividing grain yield by total fertilizer N rate (kg grain kg −1 N). A comparison of net profit across the N strategies was made. Marginal net return was calculated using actual costs incurred by the cooperating farmers and included both the price of N fertilizer and the price of the N application. For ZP17, anhydrous cost USD 0.625 kg−1 N, anhydrous application was USD 34.59 ha−1, coated urea cost USD 0.783 kg−1 N, flat rate aerial application of urea was USD 29.65 ha−1, and variable rate aerial application of urea was USD 33.98 ha−1. For DA18 and YL18, anhydrous cost USD 0.450 kg−1 N, anhydrous application was USD 37.07 ha−1, coated urea cost USD 0.803 kg−1 N, and flat rate aerial application of urea was USD 39.29 ha−1. Assumptions for corn selling price were USD 0.124 kg−1 for ZP17 and USD 0.127 kg−1 for DA18 and YL18.
Imagery data was post-processed to only include the areas that corresponded to the cleaned and buffered yield monitor data. The buffered imagery was used so that a comparison could be made representing the same area across all dates, before and after N application. Each raster image was processed to determine the SI. Delta SI was calculated as SI after in-season N application minus the SI before in-season N application. Three methods to determine SI were compared: i) HN, which is the traditional method relying on NDRE values obtained from an area with high N fertilizer application, ii) VR_HS, outlined by Holland and Schepers [57], which utilizes the cumulative 95th percentile of the pixel frequency NDRE value histogram, and iii) VR_simp, which is more feasibly calculated by practitioners and utilizes the NDRE value located at the 95th percent on the pixel frequency NDRE value histogram. We compared the SI and resulting N rate recommendation for HN, VR_HS, and VR_simp using UAV_112 strips for all sensing dates and sites. Data were analyzed for treatment strips using the GLIMMIX procedure with mean separation with Fisher’s LSD in in Statistical Analysis System (SAS) 9.4 [74].

3. Results

3.1. Yield, N Rate, PFPN, and Marginal Net Return Responses to N Management Treatments

On average, yield was 3.5 Mg ha−1 lower during 2018 than 2017 growing season due to water stress conditions (Table 1, Figure 1). Thus, in-season and total N rates were lower in 2018 than in 2017. For example, when comparing UAV_112, in-season N application during 2018 season was on average nearly 50% lower than the rates applied during 2017.
Applied in-season N rates proportionally decreased as we increased the base N rate applied at planting (~30 kg N ha−1 between UAV_84 and UAV_112; Table 1). The UAV-sensor-based N management increased NUE as measured by PFPN by 18.3% ± 6.1%, optimizing N rates compared to the traditional farmer management across years and sites. Higher NUE resulted from lower total N applications compared to the farmer management (31 ± 6.3 kg N ha−1) and no yield differences, demonstrating the benefit of a reactive N management strategy which is possible when split applying N (Table 1). There were no significant differences in marginal net return across treatments.

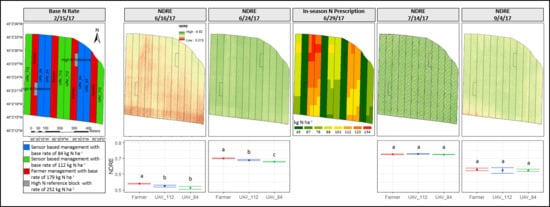
3.2. Changes in Crop Canopy Reflectance During the Growing Season and its Response to N Rate

Time series imagery data were able to capture crop maturity and senescence, N stress, crop response to N, and spatial variability in crop vigor (Figure 4). Maximum NDRE values occurred in late June and early July, and then decreased as the crop matured and senesced (Figure 4). In all cases, the end-of-season imagery captured within field variability in crop performance indicated by a greater range of NDRE values (Figure 4).
Imagery was able to capture the response to the base N application. For ZP17, treatment differences in NDRE were most visually apparent and statistically significant (Figure 4, Figure S5) in the 16 June and 24 June imagery (pre in-season N application). This is expected, as these treatments had lower initial N rates (84 and 112 N kg ha−1) compared to the farmer managed strips which had 179 kg N ha−1. Treatment differences were no longer present in the 14 July and 4 September imagery (Figure 4; post in-season N application). For DA18 and YL18, there were no differences in NDRE between the farmer managed treatment and the UAV_112 treatment prior to in-season N application (Figure 4). At DA18, following the 28 June in-season N application to the UAV_112 treatments, the UAV_112 treatments had lower NDRE values than the farmer-managed treatments. This was not the case at YL18, where there continued to be no differences in NDRE between treatments following in-season N application to UAV_112 treatments.

3.3. VR vs. HN Reference Sensor Normalization Approach

Reference values for the three reference methods evaluated (VR_simp, VR_HS, and HN) are identified in relation to the entire histogram for UAV_112 and UAV_84 strips at the imagery date preceding in-season N application (Figure 5). Patterns between resulting reference values were consistent across years and sites. The HN method always produced the lowest reference value, often near the histogram peak. The VR_HS method was higher than the HN reference for each site, and the VR_simp method produced the highest reference value. Similarly, sufficiency indices calculated with the three reference methods evaluated (VR_simp, VR_HS, and HN) were statistically different from each other within each date and site for UAV_112 (Figure 6). Both VR methods resulted in lower SI values than the HN reference method the entire season (Figure 6), resulting in higher in-season N recommendations. On average, across all sites, in-season N recommendations were 19.7 ± 14.4 kg N ha−1 for the HN reference method, 44.4 ± 18.6 kg N ha−1 for the VR_HS method, and 57.7 ± 23.5 kg N ha−1 for the VR_simp method. Additionally, when using the HN approach, SI was, in most cases, higher than 0.95; therefore, if using this value as a trigger for application, no N would be recommended at any time, except for DA18 at the end of the season.

4. Discussion

4.1. UAV Sensor-Based N Recommendations

Sensor-based, in-season N application reduced the total N applications 31 ± 6.3 kg N ha−1 compared to the farmer management with no associated yield differences. Similar results were found in Nebraska and Missouri when using in-season applications directed by active crop canopy sensors. In these studies, average N reductions were 16 kg N ha−1 (n = 55) and 32.3 kg N ha−1 (n = 48) compared to traditional farmer management [30,75].
In 2018, cumulative precipitation from planting to silking was nearly 50% lower than 2017 (Figure 1), resulting in lower yields (~3.5 Mg ha−1; Table 1). Sensor-based, in-season N rates for UAV_112 were 24.6 to 55.6 kg ha−1 lower in 2017 than they were in 2018, and resulted in greater N savings relative to the farmer method in 2018 (34.7 kg N ha−1) than in 2017 (27.3 kg N ha−1, Table 1). In dry years, N management strategies which rely on all N being applied pre-plant or at planting can lead to excessive N application and reduced NUE as a result of not accounting for decreased yields and lower than normal N losses [76,77]. Recommended in-season N rates during 2017 were more variable than the drier year 2018; the ZP17 field had a 34 kg N ha−1 range compared to only a 9 kg N ha−1 range for YL18 and DA18. This supports the need for having an N recommendation tool that combines both temporal and spatial variability to better predict the EONR [5,78,79].
For ZP17, imagery was able to capture the response to the base N application, prior to in-season N application [23,25,53,59,80]. Imagery obtained after in-season N application (14 July and 4 September; Figure 4) indicated that the in-season application adequately addressed crop N needs as treatment differences were no longer present [24,25,80]. However, at DA18, following in-season N application on 28 June, UAV_112 treatments had lower NDRE values than the farmer managed treatments. It is not clear why UAV_112 treatments decreased in NDRE value compared to the farmer treatments and the phenomenon was not observed at YL18. Rainfall was more limiting at DA18; YL18 received 16 mm more rain after N application than DA18, potentially better incorporating N [81] and providing more moisture during the sensitive tasseling and cob formation stages [82].
Sensor-based N applications delay a portion of the N application until the plant N status can be reliably determined. Thus, selection of an optimal base N rate (the portion of N applied before or at planting) is critical to reduce the risk of not being able to apply in-season N (e.g., wet weather preventing in-season application) and to minimize the cost of in-season N application which may utilize more expensive forms of N [26,83,84,85]. Sensor-based in-season N application was lower when using a base N rate of 112 kg N ha−1 than when using 84 kg N ha−1 in ZP17; however, total N use did not differ (Table 1). This suggests that a range of base N rates may be acceptable for in-season crop sensing and application [24,30,86]. In 2017, the base rate was 42% and 57% of the total N rate for UAV_84 and UAV_112, respectively. In 2018, due to lower total N applications, and the use of the higher base rate evaluated in 2017 (112 kg N ha−1), base rates constituted 80% and 65% of the total N for YL18 and DA18, respectively. This greater percentage of the total N applied as a base rate potentially reduced the ability to capture within field variability with crop sensing. A higher N base rate also increases the risk that crop sensing will not detect N differences until after the target N application window (VT to R2 corn stages) [23,80,87]. Significant soil N mineralization could also occur, resulting in base N rates which exceed the EONR [24,88]. However, a higher base N rate in a normal year (such as 2017) or a wetter year, would reduce the risk of yield losses due to early season N deficiency and the possibility of not being able to apply in-season N, and it allows a greater percentage of the total N to be applied as a potentially cheaper N source such as anhydrous ammonia [85]. These findings highlight the need for further investigation into base N rate selection; base N rates could be selected based on soil types and growing season conditions up to the time of base rate application.

4.2. Impact of Sensor Normalization Approach on N Recomendations

Our results demonstrated that the normalization approach selected to derive in-season N recommendation can affect the resulting benefits from the proposed practical system (Figure 2, Figure 5 and Figure 6). In this study, N applications determined by the VR_simp method produced the highest in-season N recommendations of the three reference methods evaluated (13.3 ± 5.1 kg ha−1 higher than VR_HS and 38.0 ± 9.8 kg ha−1 higher than HN). Both VR approaches resulted in higher in-season N recommendations than the HN method (VR_HS resulted in 24.7 ± 5.0 kg ha−1 more N recommended than HN), similar to findings by Ward [28]. Although HN and VR_HS methods were not tested in the field experiments, lower N recommendations for these methods would result in greater N savings compared to the farmer’s management. However, to conclude further on their effect on yield, NUE, and profit, field testing is needed.
Consistently higher in-season N rates recommended with a VR method could reduce the potential benefit of sensor-based, in-season N application [28]. Use of the VR method may reduce the risk of yield losses caused by under applying N, however, environmental consequences to applying excess N must be considered [7,8,9]. Both VR methods were consistently below the recommended 0.95 sufficiency threshold [23,65] even after in-season N application occurred (Figure 6). Conversely, using the 0.95 sufficiency threshold, there was no date or site that would have recommended additional in-season N prior to tasseling using the HN method (Figure 6). The differing results with VR and HN methods are in contrast to Bastos [25], who concluded that reference SI values calculated with VR_HS and HN reference were negligible (~0.6%) [25]; the difference in findings may be due to the scale of implementation, small research plots vs. whole commercial fields which would contain greater spatial variability [89]. Our study quantified the impact of the reference methods (VR_simp, VR_HS, and HN) on the recommended N rate at a larger field-scale. The larger spatial variability of crop conditions at a field level may be the cause of the greater discrepancy between SI methods (Figure 6), and thus further research on how to implement this method on a field scale is warranted.
Differences in SI values between reference methods were seen at all dates (Figure 6); therefore, the VR method may not be suitable, even late in the season with nearly complete canopies, when using high-resolution imagery. To correct this, imagery could be further processed to remove or account for background pixel influence. The results in Figure 5 and Figure 6 used the whole image scene and background soil pixels were not removed. The presence of shadows can lead to the corruption of VIs [90]. Visual examination of the pixels selected to generate the VR indicate the reference may be largely constituted of background, non-plant pixels which have high NDRE values (Figure S6). This may contribute to reduced SI values, and consequently increased N recommendations when using the VR method. For the field experiment portion of this study, background pixel masking was conducted for the ZP17 site, but not the 2018 sites. This may have resulted in a higher VR value, lower SI value, and consequently higher N rate recommendation for the 2018 sites. Faster and more accurate background pixel masking methods are needed to more feasibly incorporate image masking into the DSS workflow. In contrast, using the HN reference may reduce the impact of mixed pixels or background pixels as both the HN reference and target area will likely have similar influence of background pixels or mixed pixels. In order to avoid problems with using a VR method for high-resolution imagery, we propose establishing small high N plots as references in contrasting management zones [34].
Water stress, which was observed during 2018, may have confounded NDRE values obtained with the multispectral sensor [91]. Water stress increases leaf reflectance at the visible and near infrared wavelengths [92,93], underestimating plant chlorophyll content [93] and decreasing the crop vigor and greenness [94]. Thus, we expect that incorporating other vegetative indices which are more responsive under water stress conditions (e.g., DATT) [95] or methods which incorporate canopy temperature would help isolate variable N sufficiency from optical canopy-sensing data in the presence of variable water sufficiency [23]. Further research on this approach is needed in light of recent commercial passive sensors offering both multispectral and thermal data simultaneously using a UAV (e.g., MicaSense® Altum™). Errors may also be introduced if an area of interest is compared to a HN reference that is more water-sufficient, leading to underestimation of SI values and to the application of N fertilizer for plants that are water-stressed but N-sufficient [23]. It is possible that the discrepancy between reference water status and area of interest water stress may be accentuated due to the use of a VR method. The VR method will likely identify plants that are experiencing the least amount of water stress for the reference, and therefore may result in the application of N fertilizer for plants that are water-stressed but N-sufficient. In the present work, it is likely that prolonged dry conditions and fairly uniform soils for the 2018 sites were a unifying factor, lessening this concern due to uniformly water stressed conditions.

4.3. Implications and Limitations of the UAV Sensor-Based N Recommendation System

To our knowledge, this is the first paper that successfully translated N stress detected by UAV-based multispectral images and incorporated field spatial characteristics, to develop a more informed, dynamic N recommendation system for application in commercial fields (Figure 2). Previous work has only related vegetative indices to crop N status and crop yield [53,58,59,60,61]. We believe the proposed practical systems could support increased adoption of in-season, sensor-based N application by farmers, as it has the potential to be developed into an automated system [5,30,88]. In addition, we provided a zone-based and field-based recommendation system. This allows incorporation of spatial field characteristics and enables the proposed system to be adapted to farm operations with different levels of existing field data (Figure 2).
The challenge in managing N and estimating the optimum N fertilization rate comes from the complex interactions that exist in the dynamic soil–plant–atmosphere system and uncertainty in weather [84,96,97]. By utilizing a remote sensing approach to make N management decisions, we integrated three important and dynamic components which define the optimum N rate: soil N mineralization from OM, crop N uptake, and N losses [78,98]. The integration of multiple layers of information representing the complexity of the cropping system may greatly improve the site- and year-specific EONR estimates [99,100,101,102].
The cost of multiple N applications and the ability to optimize N rates are important considerations when assessing barriers to adoption of technologies and management strategies [85]. Marginal net return did not statistically differ between farmer- and sensor-based approaches (Table 1). At DA18, the cost of the more expensive N source used for the in-season application of UAV_112 (USD 0.803 kg−1 N for stabilized urea compared to USD 0.450 kg−1 for anhydrous ammonia) was not offset by the reduction in rate, resulting in a USD 6.65 ha−1 additional fertilizer cost, despite the lower rate. The second application also added an additional cost (USD 39.28 ha−1) for the UAV_112 treatment compared to the farmer’s management which used only one application. At YL18, the cost of the more expensive N source was offset by the reduction in rate, resulting in a USD 7.78 ha−1 savings on fertilizer for the UAV_112 treatment. However, the savings attributed to the reduction in N fertilizer were negated by the additional cost for the in-season N application (USD 39.28 ha−1) for UAV_112. In contrast, in 2017 application costs were similar (USD 68.58 ha−1 for the UAV-based treatments and USD 64.25 ha−1 for the farmer’s treatment) as the farmers management in 2017 involved two applications. Nitrogen fertilizer costs were reduced for the UAV sensor-based management (USD 11.73 ha−1 lower for the UAV_112 treatment and USD 5.53 ha−1 lower for the UAV_84 treatment compared to the farmers fertilizer costs). This suggests that the adoption of UAV-sensor-based management may be more appealing to farmers who are already utilizing split-application N management. If a ground based applicator would be used rather than an aerial applicator, the reduction in N rate required to offset the cost of a second, in-season application may be lower (approximate cost of ground based applicator is USD 23.88 ha−1 [103] while approximate cost of aerial applicator is USD 29.65 ha−1 to USD 39.29 ha−1). The reduction in N rate required to offset the cost of a second, in-season application would also be lower when N fertilizer costs are higher. Our results suggest that greater benefits from this technology could be obtained from fields with greater spatial variability as our decision system utilizes both spatial field data and detailed imagery to address spatial variability in N need [12,34,88]. Lastly, it is important to note that this marginal net return analysis did not take into account the cost of imagery acquisition for the UAV management treatments because industry costs for acquisition of imagery and expected number of flights required to implement this method have not yet been established [104].
We believe that better capturing the potential to reduce N application (e.g., in a dry year) or increase yield through increased N application (e.g., in a wet year) would offset the additional cost of application required for a split-application N management strategy. Reducing uncertainty around some of the inputs of our proposed system, such as the prediction of attainable yields, available soil nitrates, EONR, and the integration of weather, could take this practical system to the next level [34,38,105]. Existing commercialized software based on crop simulation models that integrate the effect of weather, initial conditions, and soil–crop dynamics could be a promising alternative to better estimate yields and optimal N rates to inform sensor-based management [5,34,36,105].
There are still numerous challenges associated with acquiring passive sensor imagery with a UAV for in-season N management [5,106]. For example, within the present work, we were not able to take full advantage of the potential of the high-resolution imagery as the in-season application method (aerial) was only capable of lower resolution applications. Therefore, considerations need to be made for selecting imagery resolutions that better match the resolution of the application method and within-field variability. It may be of interest to explore alternative data collection methods such as satellite or aerial imagery, particularly when in-season applications methods are only capable of lower resolutions. Existing agriculture data management systems which store and process data layers used in our DSS (such as fertilizer application maps, historic yield data, soil sample data, and others) may be integrated with a drone imagery processing service to develop an application to scale the adoption of the proposed DSS. Alternative image sources such as satellite- or airplane-acquired imagery may provide a rapid solution to scale the DSS using a commercial platform and needs further investigation. We expect that such an integrated system would allow the proposed DSS to be adapted for practical use by farmers.

5. Conclusions

To our knowledge, this is the first paper that successfully translated N stress detected by UAV-based multispectral images into a more informed dynamic N recommendation system in commercial fields, considering soil and crop spatial variability. The proposed systems improved NUE 18.3% ± 6.1% by reducing N rates 31 ± 6.3 kg N ha−1 with no yield differences compared to the farmers’ traditional management. Economically, the adoption of UAV sensor-based management may be more appealing when farmers are already utilizing split-application N management, when fertilizer costs are higher, or when greater N losses may occur, such as in a wet year. Greater benefits from this technology could be obtained from fields with greater spatial variability as our DSS utilizes both spatial field data and detailed imagery to address spatial variability in N need. In-season, sensor-based N recommendations are already promising and have potential for realizing further improvement. The initial base N rate, the prediction of required inputs (e.g., EONR, expected yield, and available soil N), management zone delineation, the normalization approach, and the threshold for triggering N application were identified as potential avenues for further improvement. We found that, for high-resolution, field-scale imagery, the VR methods resulted in higher reference values, lower SI values, and potential over-application of N fertilizer, thus, reducing the economic and environmental benefits of this technology. Additionally, the 0.95 SI threshold for triggering N application was not useful with the VR methods, as SI values for these methods were consistently below the 0.95 threshold, even very early in the growing season and after in-season N was applied. Further comparison of these reference methods is needed to determine the impact on yield, NUE, and economics and to determine if VR methods are suitable with field scale, high-resolution imagery. In view of a growing interest in using UAVs in commercial fields and the need to improve crop NUE, further validation of the utility of UAVs and multispectral sensor is needed, in particular, under extreme weather conditions. In order for the proposed DSS to be replicated at a larger scale and be adopted by farmers, a computer application is needed to efficiently store and process the data layers used in the DSS.

Supplementary Materials

The following are available online at https://www.mdpi.com/2072-4292/12/10/1597/s1, Table S1. Soil characteristics for one site in 2017 (ZP17) and two sites in 2018 (YL18 and DA18), located in Richardson County, Nebraska. Cropping information including soil subgroup and texture, soil pH, organic matter, extractable P and K, residual NO3-N and field location are provided, Table S2. Agronomic practices including hybrid planting, planting date, harvest date, planting population, and tillage for one site in 2017 (ZP17) and two sites in 2018 (YL18 and DA18), Table S3. Mean monthly air temperature and long-term averages. Annual and long-term average data was obtained from High Plains RCC CLIMOD for Falls City Brenner Field, Neb, NOAA weather station, Table S4. Description of how values were obtained for UNL algorithm used to calculate EONR for use in the sensor algorithm, Figure S5. NDRE imagery for the ZP17 site before (24 June) and after (14 July) N application. Image display was set to standard deviation, and was applied independently for each image date, Figure S6. 24 June 2017 imagery from ZP17 showing a close up view of the corn crop canopy as RGB imagery (top left), RGB imagery with white highlighted pixels corresponding to those selected for the VR_HS reference (top right), NDRE imagery (bottom left), and NDRE imagery with white highlighted pixels corresponding to those selected for the VR_HS reference (bottom right). Examination of the two images reveals that pixels selected for the VR_HS are primarily composed of non-plant pixels.

Author Contributions

Conceptualization, methodology, investigation, formal analysis, and writing—original draft preparation L.J.T.; writing—review and editing, L.A.P. All authors have read and agreed to the published version of the manuscript.

Funding

This research was funded by North Central SARE, grant number FNC17-1100.

Acknowledgments

We would like to thank Dean and Deb Stevens and Richard, Dale, and Ronda Yoesel for their interest, cooperation, and generosity in allowing this work to be conducted on their farms. Thanks to John Lueger and Heinen Bros AgriServices for their assistance and cooperation in applying aerial treatments. We are grateful to Nathan Thompson for his contributions to UAV modifications and imagery acquisition.

Conflicts of Interest

The authors declare no conflict of interest. The funders had no role in the design of the study; in the collection, analyses, or interpretation of data; in the writing of the manuscript, or in the decision to publish the results.

References

  1. Scharf, P.C. Understanding Nitrogen. In Managing Nitrogen in Crop Production; American Society of Agronomy, Inc.: Madison, WI, USA; Crop Science Society of America, Inc.: Madison, WI, USA; Soil Science Society of America, Inc.: Madison, WI, USA, 2015; pp. 1–24. [Google Scholar]
  2. Mueller, N.D.; Gerber, J.S.; Johnston, M.; Ray, D.K.; Ramankutty, N.; Foley, J.A. Closing yield gaps through nutrient and water management. Nature 2012, 490, 254–257. [Google Scholar] [CrossRef] [PubMed]
  3. Tenorio, F.A.M.; Mclellan, E.L.; Eagle, A.J.; Cassman, K.G.; Andersen, D.; Krausnick, M.; Oaklund, R.; Thorburn, J.; Grassini, P. Benchmarking impact of nitrogen inputs on grain yield and environmental performance of producer fields in the western US Corn Belt. Agric. Ecosyst. Environ. 2020, 294, 106865. [Google Scholar] [CrossRef]
  4. Cassman, K.G.; Dobermann, A.R.; Walters, D.T. Agroecosystems, Nitrogen-use Efficiency, and Nitrogen Management Agroecosystems, Nitrogen-use Efficiency. AMBIO 2002, 31, 132–140. [Google Scholar] [CrossRef] [PubMed]
  5. Morris, T.F.; Murrell, T.S.; Beegle, D.B.; Camberato, J.J.; Ferguson, R.B.; Grove, J.; Ketterings, Q.; Kyveryga, P.M.; Laboski, C.A.M.; Mcgrath, J.M.; et al. Strengths and Limitations of Nitrogen Rate Recommendations for Corn and Opportunities for Improvement. Agron. J. 2018, 110, 1–37. [Google Scholar] [CrossRef] [Green Version]
  6. Mueller, N.D.; Lassaletta, L.; Runch, B.C.; Billen, G.; Garnier, J.; Gerber, J.S. Declining spatial efficiency of global cropland nitrogen allocation. Glob. Biogeochem. Cycles 2017, 31, 245–257. [Google Scholar] [CrossRef]
  7. Zhang, X.; Davidson, E.A.; Mauzerall, D.L.; Searchinger, T.D.; Dumas, P.; Shen, Y. Managing nitrogen for sustainable development. Nature 2015, 528, 51–59. [Google Scholar] [CrossRef] [PubMed] [Green Version]
  8. Ravishankara, A.R.; Daniel, J.S.; Portmann, R.W. Nitrous oxide (N2O): The dominate ozone-depleting substance emitted in the 21st century. Science 2009, 326, 123–125. [Google Scholar] [CrossRef] [Green Version]
  9. Tilman, D.; Isbell, F. Biodiversity: Recovery as nitrogen declines. Nature 2015, 528, 336–337. [Google Scholar] [CrossRef] [Green Version]
  10. Hong, N.; Scharf, P.C.; Davis, J.G.; Kitchen, N.R.; Sudduth, K.A. Economically Optimal Nitrogen Rate Reduces Soil Residual Nitrate. J. Environ. Qual. 2007, 36, 354–362. [Google Scholar] [CrossRef] [Green Version]
  11. Zhao, X.; Christianson, L.E.; Harmel, D.; Pittelkow, C.M. Assessment of drainage nitrogen losses on a yield-scaled basis. Field Crop. Res. 2016, 199, 156–166. [Google Scholar] [CrossRef]
  12. Mamo, M.; Malzer, G.L.; Mulla, D.J.; Huggins, D.R.; Strock, J. Spatial and temporal variation in economically optimum nitrogen rate for corn. Agron. J. 2003, 95, 958–964. [Google Scholar] [CrossRef] [Green Version]
  13. Schmidt, J.P.; Dejoia, A.J.; Ferguson, R.B.; Taylor, R.K.; Young, R.K.; Havlin, J.L. Corn Yield Response to Nitrogen at Multiple In-Field Locations. Agron. J. 2002, 94, 798–806. [Google Scholar]
  14. Mueller, S.M.; Camberato, J.J.; Messina, C.; Shanahan, J.; Zhang, H.; Vyn, T.J. Late-split nitrogen applications increased maize plant nitrogen recovery but not yield under moderate to high nitrogen rates. Agron. J. 2017, 109, 2689–2699. [Google Scholar] [CrossRef] [Green Version]
  15. Ciampitti, I.A.; Vyn, T.J. Physiological perspectives of changes over time in maize yield dependency on nitrogen uptake and associated nitrogen efficiencies: A review. Field Crop. Res. 2012, 133, 48–67. [Google Scholar] [CrossRef]
  16. Benjamin, J.G.; Porter, L.K.; Duke, H.R.; Ahuja, L.R. Corn growth and nitrogen uptake with furrow irrigation and fertilizer bands. Agron. J. 1997, 89, 609–612. [Google Scholar] [CrossRef]
  17. Woli, K.P.; Boyer, M.J.; Elmore, R.W.; Sawyer, J.E.; Abendroth, L.J.; Barker, D.W. Corn era hybrid response to nitrogen fertilization. Agron. J. 2016, 108, 473–486. [Google Scholar] [CrossRef] [Green Version]
  18. Haegele, J.W.; Cook, K.A.; Nichols, D.M.; Below, F.E. Changes in nitrogen use traits associated with genetic improvement for grain yield of maize hybrids released in different decades. Crop Sci. 2013, 53, 1256–1268. [Google Scholar] [CrossRef] [Green Version]
  19. Schmidt, J.; Beegle, D.; Zhu, Q.; Sripada, R. Improving in-season nitrogen recommendations for maize using an active sensor. Field Crop. Res. 2011, 120, 94–101. [Google Scholar] [CrossRef] [Green Version]
  20. Sripada, R.P.; Schmidt, J.P.; Dellinger, A.E.; Beegle, D.B. Evaluating multiple indices from a canopy reflectance sensor to estimate corn N requirements. Agron. J. 2008, 100, 1553–1561. [Google Scholar] [CrossRef]
  21. Bean, M.; Kitchen, N.R.; Camberato, J.J.; Ferguson, R.B.; Fernandez, F.G.; Franzen, D.; Laboski, C.A.M.; Nafziger, E.D.; Sawyer, J.E.; Scharf, P.C.; et al. Active-Optical Reflectance Sensing Corn Algorithms Evaluated over the United States Midwest Corn Belt. Agron. J. 2018, 110, 2552–2565. [Google Scholar] [CrossRef] [Green Version]
  22. Shaver, T.M.; Khosla, R.; Westfall, D.G. Evaluation of two crop canopy sensors for nitrogen variability determination in irrigated maize. Precis. Agric. 2011, 12, 892–904. [Google Scholar] [CrossRef]
  23. Lo, T.H.; Rudnick, D.R.; Krienke, B.T.; Heeren, D.M.; Ge, Y.; Shaver, T.M. Water effects on optical canopy sensing for late-season site-specific nitrogen management of maize. Comput. Electron. Agric. 2019, 162, 154–164. [Google Scholar] [CrossRef] [Green Version]
  24. Thompson, L.J.; Ferguson, R.B.; Kitchen, N.; Frazen, D.W.; Mamo, M.; Yang, H.; Schepers, J.S. Model and sensor-based recommendation approaches for in-season nitrogen management in corn. Agron. J. 2015, 107, 2020–2030. [Google Scholar] [CrossRef] [Green Version]
  25. Bastos, L.M. Evaluation of Stabilized Fertilizer and Crop Canopy Sensors as Next-Generation Nitrogen Management Technologies in Irrigated Corn; University of Nebraska-Lincoln: Lincoln, NE, USA, 2019. [Google Scholar]
  26. Franzen, D.; Kitchen, N.; Holland, K.; Schepers, J.; Raun, W. Algorithms for In-Season Nutrient Management in Cereals. Agron. J. 2016, 108, 1775–1781. [Google Scholar] [CrossRef] [Green Version]
  27. Raun, W.R.; Solie, J.B.; Johnson, G.V.; Stone, M.L.; Mutten, R.W.; Freeman, K.W.; Thomason, W.E.; Lukina, E.V. Improving nitrogen use efficiency in cereal grain production with optical sensing and variable rate application. Agron. J. 2002, 94, 815–820. [Google Scholar] [CrossRef] [Green Version]
  28. Ward, N.C. Nitrogen and Water Effects on Canopy Sensor Measurements for Site-Specific Management of Crops; University of Nebraska-Lincoln: Lincoln, NE, USA, 2015. [Google Scholar]
  29. Barker, D.W.; Sawyer, J.E. Using active canopy sensors to quantify corn nitrogen stress and nitrogen application rate. Agron. J. 2010, 102, 964–971. [Google Scholar] [CrossRef]
  30. Scharf, P.C.; Shannon, D.K.; Palm, H.L.; Sudduth, K.A.; Drummond, S.T.; Kitchen, N.R.; Mueller, L.J.; Hubbard, V.C.; Oliveira, L.F. Sensor-based nitrogen applications out-performed producer-chosen rates for corn in on-farm demonstrations. Agron. J. 2011, 103, 1683–1691. [Google Scholar] [CrossRef]
  31. Shaver, T.; Khosla, R.; Westfall, D. Evaluation of Two Crop Canopy Sensors for Nitrogen Recommendations in Irrigated Maize. J. Plant Nutr. 2014, 37, 406–419. [Google Scholar] [CrossRef]
  32. Daniel, I.; Raj, K.; Ted, M. On-the-go active remote sensing for efficient crop nitrogen management. Sens. Rev. 2005, 25, 209–214. [Google Scholar]
  33. Erickson, B.; Lowenberg-DeBoer, J.; Bradford, J. 2017 Precision Agriculture Dealership Survey; Purdue University: West Lafayette, IN, USA, 2017. [Google Scholar]
  34. Crowther, J.D. Integrating Management Zones and Canopy Sensing to Improve Nitrogen Recommendation Algorithms. Master’s Thesis, University of Nebraska-Lincoln, Lincoln, NE, USA, 2018; pp. 1–186. [Google Scholar]
  35. Bean, G.M.; Kitchen, N.R.; Camberato, J.J.; Ferguson, R.B.; Fernandez, F.G.; Franzen, D.W.; Laboski, C.A.M.; Nafziger, E.D.; Sawyer, J.E.; Scharf, P.C.; et al. Improving an active-optical reflectance sensor algorithm using soil and weather information. Agron. J. 2018, 110, 2541–2551. [Google Scholar] [CrossRef] [Green Version]
  36. Puntel, L.A.; Sawyer, J.E.; Barker, D.W.; Dietzel, R.; Poffenbarger, H.; Castellano, M.J.; Moore, K.J.; Thorburn, P.; Archontoulis, S.V. Modeling Long-Term Corn Yield Response to Nitrogen Rate and Crop Rotation. Front. Plant Sci. 2016, 7, 1–18. [Google Scholar] [CrossRef] [PubMed]
  37. Kitchen, N.R.; Shanahan, J.F.; Ransom, C.J.; Bandura, C.J.; Bean, G.M.; Camberato, J.J.; Carter, P.R.; Clark, J.D.; Ferguson, R.B.; Fernández, F.G.; et al. A public–industry partnership for enhancing corn nitrogen research and datasets: Project description, methodology, and outcomes. Agron. J. 2017, 109, 2371–2388. [Google Scholar] [CrossRef] [Green Version]
  38. Ransom, C.J.; Kitchen, N.R.; Camberato, J.J.; Carter, P.R.; Ferguson, R.B.; Fernandez, F.G.; Franzen, D.W.; Laboski, C.A.M.; Myers, D.B.; Nafziger, E.D.; et al. Statistical and machine learning methods evaluated for incorporating soil and weather into corn nitrogen recommendations. Comput. Electron. Agric. 2019, 164, 104872. [Google Scholar] [CrossRef] [Green Version]
  39. Zheng, H.; Cheng, T.; Zhou, M.; Li, D.; Yao, X.; Tian, Y.; Cao, W.; Zhu, Y. Improved estimation of rice aboveground biomass combining textural and spectral analysis of UAV imagery. Precis. Agric. 2019, 20, 611–629. [Google Scholar] [CrossRef]
  40. Wang, T.; Alex Thomasson, J.; Yang, C.; Isakeit, T.; Nichols, R.L. Automatic Classification of Cotton Root Rot Disease Based on UAV Remote Sensing. Remote Sens. 2020, 12, 1310. [Google Scholar] [CrossRef] [Green Version]
  41. Campos, J.; Llop, J.; Gallart, M.; García-Ruiz, F.; Gras, A.; Salcedo, R.; Gil, E. Development of canopy vigour maps using UAV for site-specific management during vineyard spraying process. Precis. Agric. 2019, 20, 1136–1156. [Google Scholar] [CrossRef] [Green Version]
  42. Barrero, O.; Perdomo, S.A. RGB and multispectral UAV image fusion for Gramineae weed detection in rice fields. Precis. Agric. 2018, 19, 809–822. [Google Scholar] [CrossRef]
  43. Jang, G.J.; Kim, J.; Yu, J.K.; Kim, H.J.; Kim, Y.; Kim, D.W.; Kim, K.H.; Lee, C.W.; Chung, Y.S. Review: Cost-effective unmanned aerial vehicle (UAV) platform for field plant breeding application. Remote Sens. 2020, 12, 998. [Google Scholar] [CrossRef] [Green Version]
  44. Millan, V.E.G.; Rankine, C.; Sanchez-Azofeifa, G.A. Crop loss evaluation using digital surface models from unmanned aerial vehicles data. Remote Sens. 2020, 12, 981. [Google Scholar] [CrossRef] [Green Version]
  45. Zheng, H.; Ma, J.; Zhou, M.; Li, D.; Yao, X.; Cao, W.; Zhu, Y.; Cheng, T. Enhancing the nitrogen signals of rice canopies across critical growth stages through the integration of textural and spectral information from unmanned aerial vehicle (UAV) multispectral imagery. Remote Sens. 2020, 12, 957. [Google Scholar] [CrossRef] [Green Version]
  46. Ye, H.; Huang, W.; Huang, S.; Cui, B.; Dong, Y.; Guo, A.; Ren, Y.; Jin, Y. Recognition of banana Fusarium wilt based on UAV remote sensing. Remote Sens. 2020, 12, 938. [Google Scholar] [CrossRef] [Green Version]
  47. Martinez-Guanter, J.; Agüera, P.; Agüera, J.; Pérez-Ruiz, M. Spray and economics assessment of a UAV-based ultra-low-volume application in olive and citrus orchards. Precis. Agric. 2020, 21, 226–243. [Google Scholar] [CrossRef]
  48. López-Granados, F.; Torres-Sánchez, J.; Serrano-Pérez, A.; de Castro, A.I.; Mesas-Carrascosa, F.J.; Peña, J.M. Early season weed mapping in sunflower using UAV technology: Variability of herbicide treatment maps against weed thresholds. Precis. Agric. 2016, 17, 183–199. [Google Scholar] [CrossRef]
  49. Louargant, M.; Villette, S.; Jones, G.; Vigneau, N.; Paoli, J.N.; Gée, C. Weed detection by UAV: Simulation of the impact of spectral mixing in multispectral images. Precis. Agric. 2017, 18, 932–951. [Google Scholar] [CrossRef] [Green Version]
  50. Comba, L.; Biglia, A.; Ricauda Aimonino, D.; Tortia, C.; Mania, E.; Guidoni, S.; Gay, P. Leaf Area Index evaluation in vineyards using 3D point clouds from UAV imagery. Precis. Agric. 2019, 1–16. [Google Scholar] [CrossRef] [Green Version]
  51. Krienke, B.T.; Ferguson, R.B.; Maharjan, B. Using an unmanned aerial vehicle to evaluate nitrogen variability and distance effect with an active crop canopy sensor. In Precision Agriculture ‘15; Stafford, J.V., Ed.; Wageningen Academic Publishers: Gelderland, The Netherlands, 2015; pp. 143–150. ISBN 978-90-8686-267-2. [Google Scholar]
  52. Krienke, B.; Ferguson, R.B.; Schlemmer, M.; Holland, K.; Marx, D.; Eskridge, K. Using an unmanned aerial vehicle to evaluate nitrogen variability and height effect with an active crop canopy sensor. Precis. Agric. 2017, 18, 900–915. [Google Scholar] [CrossRef] [Green Version]
  53. Maresma, Á.; Lloveras, J.; Martínez-Casasnovas, J.A. Use of multispectral airborne images to improve in-season nitrogen management, predict grain yield and estimate economic return of maize in irrigated high yielding environments. Remote Sens. 2018, 10, 543. [Google Scholar] [CrossRef] [Green Version]
  54. Holland, K.H.; Schepers, J.S. Derivation of a variable rate nitrogen application model for in-season fertilization of corn. Agron. J. 2010, 102, 1415–1424. [Google Scholar] [CrossRef]
  55. Scharf, P.C.; Lory, J.A. Calibrating reflectance measurements to predict optimal sidedress nitrogen rate for corn. Agron. J. 2009, 101, 615–625. [Google Scholar] [CrossRef]
  56. Blackmer, T.M.; Schepers, J.S. Use of a chlorophyll meter to monitor nitrogen status and schedule fertigation for corn. J. Prod. Agric. 1995, 8, 56–60. [Google Scholar] [CrossRef]
  57. Holland, K.H.; Schepers, J.S. Use of a virtual-reference concept to interpret active crop canopy sensor data. Precis. Agric. 2013, 14, 71–85. [Google Scholar] [CrossRef]
  58. Guan, S.; Fukami, K.; Matsunaka, H.; Okami, M.; Tanaka, R.; Nakano, H.; Sakai, T.; Nakano, K.; Ohdan, H.; Takahashi, K. Assessing correlation of high-resolution NDVI with fertilizer application level and yield of rice and wheat crops using small UAVs. Remote Sens. 2019, 11, 112. [Google Scholar] [CrossRef] [Green Version]
  59. Maresma, Á.; Ariza, M.; Martínez, E.; Lloveras, J.; Martínez-Casasnovas, J.A. Analysis of vegetation indices to determine nitrogen application and yield prediction in maize (zea mays l.) from a standard uav service. Remote Sens. 2016, 8, 973. [Google Scholar] [CrossRef] [Green Version]
  60. Zheng, H.; Cheng, T.; Li, D.; Zhou, X.; Yao, X.; Tian, Y.; Cao, W.; Zhu, Y. Evaluation of RGB, color-infrared and multispectral images acquired from unmanned aerial systems for the estimation of nitrogen accumulation in rice. Remote Sens. 2018, 10, 824. [Google Scholar] [CrossRef] [Green Version]
  61. Padilla, F.M.; Gallardo, M.; Peña-Fleitas, M.T.; De Souza, R.; Thompson, R.B. Proximal optical sensors for nitrogen management of vegetable crops: A review. Sensors 2018, 18, 2083. [Google Scholar] [CrossRef] [Green Version]
  62. Shapiro, C.A.; Ferguson, R.B.; Hergert, G.W.; Wortmann, C.S.; Walters, D.T. Fertilizer Suggestions for Corn; University of Nebraska-Lincoln: Lincoln, NE, USA, 2008; pp. 1–6. [Google Scholar]
  63. Thompson, L.J.; Glewen, K.L.; Ingram, T.; Krienke, B.; Lesoing, G.; Melvin, S.; Mueller, N.; Nygren, A.; Ohnesorg, W.; Proctor, C.; et al. Nebraska Extension on-Farm Research: 2017 Growing Season Results; University of Nebraska-Lincoln: Lincoln, NE, USA, 2018. [Google Scholar]
  64. Gitelson, A.A.; Kaufman, Y.J.; Merzlyak, M.N. Use of a green channel in remote sensing of global vegetation from EOS-MODIS. Remote Sens. Environ. 1996, 58, 289–298. [Google Scholar] [CrossRef]
  65. Blackmer, T.M.; Schepers, J.S. Techniques for monitoring crop nitrogen status in corn. Commun. Soil Sci. Plant Anal. 1994, 25, 1791–1800. [Google Scholar] [CrossRef]
  66. Gitelson, A.A.; Gritz, Y.; Merzlyak, M.N. Relationships between leaf chlorophyll content and spectral reflectance and algorithms for non-destructive chlorophyll assessment in higher plant leaves. J. Plant Physiol. 2003, 160, 271–282. [Google Scholar] [CrossRef]
  67. Viña, A.; Gitelson, A.A.; Nguy-Robertson, A.L.; Peng, Y. Comparison of different vegetation indices for the remote assessment of green leaf area index of crops. Remote Sens. Environ. 2011, 115, 3468–3478. [Google Scholar] [CrossRef]
  68. ESRI ArcGIS Desktop 2017. Available online: https://desktop.arcgis.com/ (accessed on 6 April 2020).
  69. Scharf, P.C.; Lory, J.A. Calibrating corn color from aerial photographs to predict sidedress nitrogen need. Agron. J. 2002, 94, 397–404. [Google Scholar] [CrossRef]
  70. Ag Leader Technology Ag Leader SMS Advanced. Available online: https://www.agleader.com/farm-management/sms-software/ (accessed on 6 April 2020).
  71. R Core Team R: A Language and Environment for Statistical Computing. Available online: https://www.r-project.org/ (accessed on 6 April 2020).
  72. Varvel, G.E.; Schepers, J.S.; Francis, D.D. Ability for In-Season Correction of Nitrogen Deficiency in Corn Using Chlorophyll Meters. Soil Sci. Soc. Am. J. 1997, 61, 1233–1239. [Google Scholar] [CrossRef]
  73. USDA-ARS Yield Editor. Available online: https://www.ars.usda.gov/research/software/?modeCode=50-70-10-00 (accessed on 6 April 2020).
  74. SAS Institute SAS/STAT User’s Guide 2013; SAS Institute Inc.: Carry, NC, USA, 2013.
  75. Thompson, L.J.; Glewen, K.L.; Bartels, M.; Ingram, T.; Krienke, B.; Lesoing, G.; Melvin, S.; Mueller, N.; Nygren, A.; Proctor, C.; et al. Nebraska Extension on-Farm Research: 2018 Growing Season Results; University of Nebraska-Lincoln: Lincoln, NE, USA, 2019. [Google Scholar]
  76. Earl, H.J.; Davis, R.F. Effect of drought stress on leaf and whole canopy radiation use efficiency and yield of maize. Agron. J. 2003, 95, 688–696. [Google Scholar] [CrossRef]
  77. Mulla, D.J.; Strock, J.S.; Schepers, J.S.; Raun, W.R. Nitrogen Transport Processes in Soil. In Nitrogen in Agricultural Systems; American Society of Agronomy, Inc.: Madison, WI, USA; Crop Science Society of America, Inc.: Madison, WI, USA; Soil Science Society of America, Inc.: Madison, WI, USA, 2008; pp. 367–406. [Google Scholar]
  78. Puntel, L.A.; Pagani, A.; Archontoulis, S.V. Development of a nitrogen recommendation tool for corn considering static and dynamic variables. Eur. J. Agron. 2019, 105, 189–199. [Google Scholar] [CrossRef] [Green Version]
  79. Banger, K.; Yuan, M.; Wang, J.; Nafziger, E.D.; Pittelkow, C.M. A vision for incorporating environmental effects into nitrogen management decision support tools for U.S. maize production. Front. Plant Sci. 2017, 8, 1–7. [Google Scholar] [CrossRef] [PubMed] [Green Version]
  80. Krienke, B.T. Assessing Factors Influencing Maize Yield Response To Nitrogen Using Remote Sensing Technologies. Ph.D. Dissertation, University of Nebraska-Lincoln, Lincoln, NE, USA, 2015. [Google Scholar]
  81. Holcomb, J.C.; Sullivan, D.M.; Horneck, D.A.; Clough, G.H. Effect of Irrigation Rate on Ammonia Volatilization. Soil Sci. Soc. Am. J. 2011, 75, 2341–2347. [Google Scholar] [CrossRef]
  82. Çakir, R. Effect of water stress at different development stages on vegetative and reproductive growth of corn. Field Crop. Res. 2004, 89, 1–16. [Google Scholar] [CrossRef]
  83. Van Es, H.M.; Kay, B.D.; Melkonian, J.J.; Sogbedji, J.M.; Bruulsma, T.W. Nitrogen management for maize in humid regions: Case for a dynamic modeling approach. In Proceedings of the Integrating Weather Variability into Nitrogen Recommendations, Indianapolis, IN, USA, 15 November 2006. [Google Scholar]
  84. Tremblay, N.; Bouroubi, Y.M.; Bélec, C.; Mullen, R.W.; Kitchen, N.R.; Thomason, W.E.; Ebelhar, S.; Mengel, D.B.; Raun, W.R.; Francis, D.D.; et al. Corn response to nitrogen is influenced by soil texture and weather. Agron. J. 2012, 104, 1658–1671. [Google Scholar] [CrossRef] [Green Version]
  85. Gramig, B.M.; Massey, R.; Yun, S. Do Nitrogen application decision-making under climate risk in the U.S. Corn Belt. Clim. Risk Manag. 2017, 15, 82–89. [Google Scholar] [CrossRef] [Green Version]
  86. Roberts, D.F. An Integrated Crop- and Soil- Based Strategy for Variable-Rate Nitrogen Management in Corn. Ph.D. Thesis, University of Nebraska-Lincoln, Lincoln, NE, USA, 2009; p. 242. [Google Scholar]
  87. Shapiro, C.A.; Ferguson, R.B.; Wortmann, C.S.; Maharjan, B.; Krienke, B. Nutrient Management Suggestions for Corn; University of Nebraska-Lincoln: Lincoln, NE, USA, 2019; pp. 1–7. [Google Scholar]
  88. Roberts, D.F.; Kitchen, N.R.; Scharf, P.C.; Sudduth, K.A. Will variable-rate nitrogen fertilization using corn canopy reflectance sensing deliver environmental benefits? Agron. J. 2010, 102, 85–95. [Google Scholar] [CrossRef] [Green Version]
  89. Maestrini, B.; Basso, B. Drivers of within-field spatial and temporal variability of crop yield across the US Midwest. Sci. Rep. 2018, 8, 1–9. [Google Scholar] [CrossRef]
  90. Wu, T.; Zhang, L.; Huang, C. An analysis of shadow effects on spectral vegetation indices using a ground-based imaging spectrometer. Work. Hyperspectral Image Signal Process. Evol. Remote Sens. 2015, 2015, 2188–2192. [Google Scholar]
  91. Shiratsuchi, L.; Ferguson, R.; Shanahan, J.; Adamchuk, V.; Rundquist, D.; Marx, D.; Slater, G. Water and nitrogen effects on active canopy sensor vegetation indices. Agron. J. 2011, 103, 1815–1826. [Google Scholar] [CrossRef] [Green Version]
  92. Schepers, J.S.; Blackmer, T.M.; Wilhelm, W.W.; Resende, M. Transmittance and reflectance measurements of corn leaves from plants with different nitrogen and water supply. J. Plant Physiol. 1996, 148, 523–529. [Google Scholar] [CrossRef] [Green Version]
  93. Schlemmer, M.R.; Francis, D.D.; Shanahan, J.F.; Schepers, J.S. Remotely Measuring Chlorophyll Content in Corn Leaves with Differing. Agron. J. 2005, 97, 106–112. [Google Scholar] [CrossRef] [Green Version]
  94. Clay, D.E.; Kim, K.I.; Chang, J.; Clay, S.A.; Dalsted, K. Characterizing water and nitrogen stress in corn using remote sensing. Agron. J. 2006, 98, 579–587. [Google Scholar] [CrossRef]
  95. Datt, B. Visible/near infrared reflectance and chlorophyll content in eucalyptus leaves. Int. J. Remote Sens. 1999, 20, 2741–2759. [Google Scholar] [CrossRef]
  96. Havlin, J.; Tisdale, S.; Nelson, W.; Beaton, J. Soil Fertility and Fertilizers, 8th ed.; Pearson: London, UK, 2013. [Google Scholar]
  97. Brady, N.C.; Weil, R.R. The Nature and Properties of Soils, 15th ed.; Pearson: London, UK, 2017. [Google Scholar]
  98. Meisinger, J.J.; Calderon, F.J.; Jenkinson, D.S.; Schepers, J.S.; Raun, W.R. Soil Nitrogen Budgets. In Nitrogen in Agricultural Systems2; Schepers, J.S., Raun, W.R., Eds.; American Society of Agronomy, Inc.: Madison, WI, USA; Crop Science Society of America, Inc.: Madison, WI, USA; Soil Science Society of America, Inc.: Madison, WI, USA, 2008. [Google Scholar]
  99. Dumont, B.; Basso, B.; Bodson, B.; Destain, J.P.; Destain, M.F. Assessing and modeling economic and environmental impact of wheat nitrogen management in Belgium. Environ. Model. Softw. 2016, 79, 184–196. [Google Scholar] [CrossRef] [Green Version]
  100. Batchelor, W.D.; Basso, B.; Paz, J.O. Examples of strategies to analyze spatial and temporal yield variability using crop models. Eur. J. Agron. 2002, 18, 141–158. [Google Scholar] [CrossRef]
  101. Basso, B.; Sartori, L.; Cammarano, D.; Fiorentino, C.; Grace, P.R.; Fountas, S.; Sorensen, C.A. Environmental and economic evaluation of N fertilizer rates in a maize crop in Italy: A spatial and temporal analysis using crop models. Biosyst. Eng. 2012, 113, 103–111. [Google Scholar] [CrossRef]
  102. Basso, B.; Dumont, B.; Cammarano, D.; Pezzuolo, A.; Marinello, F.; Sartori, L. Environmental and economic benefits of variable rate nitrogen fertilization in a nitrate vulnerable zone. Sci. Total Environ. 2016, 545–546, 227–235. [Google Scholar] [CrossRef] [Green Version]
  103. McClure, G.A.; Jansen, J.A. 2018 Nebraska Farm Custom Rates; University of Nebraska-Lincoln: Lincoln, NE, USA, 2018. [Google Scholar]
  104. Matese, A.; Toscano, P.; Di Gennaro, S.F.; Genesio, L.; Vaccari, F.P.; Primicerio, J.; Belli, C.; Zaldei, A.; Bianconi, R.; Gioli, B. Intercomparison of UAV, aircraft and satellite remote sensing platforms for precision viticulture. Remote Sens. 2015, 7, 2971–2990. [Google Scholar] [CrossRef] [Green Version]
  105. Ransom, C. Improving Corn Nitrogen Rate Recommendations Through Tool Fusion. In Proceedings of the 14th International Conference on Precision Agriculture, Montreal, QC, Canada, 24–27 June 2018. [Google Scholar]
  106. Hunt, E.R.; Daughtry, C.S.T. What good are unmanned aircraft systems for agricultural remote sensing and precision agriculture? Int. J. Remote Sens. 2018, 39, 5345–5376. [Google Scholar] [CrossRef] [Green Version]
Figure 1. Rainfall data from a nearby National Oceanic and Atmospheric Administration (NOAA) weather station for 2017 and 2018. The gray line represents 10 year average. Data obtained from High Plains Regional Climate Center for the Falls City Brenner Field, Nebraska station.
Remotesensing 12 01597 g001
Figure 2. Framework for transforming field characteristics and passive sensor imagery into a decision support system for in-season nitrogen management in corn when spatial data are available (zone-based approach) and when supporting spatial data is limited (simplified approach). Examples for each step are given; those used in this field study are in bold.
Remotesensing 12 01597 g002
Figure 3. DJI Inspire 2 multi-rotor UAV with MicaSense® RedEdge® five-band multispectral sensor and downwelling light sensor. Inset image is a close up of the five-band multispectral sensor.
Remotesensing 12 01597 g003
Figure 4. Normalized difference red edge (NDRE) data for UAV_84 (sensor-based treatment with 84 kg ha−1 base rate), UAV_112 (sensor-based treatment with 112 kg ha−1 base rate), and farmer-managed treatments at sites ZP17, YL18, and DA18. Top panel is NDRE imagery displayed with minimum-maximum stretch on a color ramp that encompasses the minimum and maximum value across imagery dates for that site. Bottom panel are NDRE means; different letters indicate means are significantly different from each other at p-value < 0.05. Vertical bars represent standard deviation. The vertical dashed line separates imagery collected before and after in-season application.
Remotesensing 12 01597 g004
Figure 5. Histogram of frequency of NDRE values for UAV_112 and UAV_84 treatment strips for the imagery date immediately preceding the in-season N application. Histograms include all pixels (plant, soil, and shadow) in the image. Reference values for each reference method evaluated (VR_simp, VR_HS, and HN) are indicated in the histogram.
Remotesensing 12 01597 g005
Figure 6. Comparison of sufficiency index (SI) calculated with two virtual reference (VR) methods (one utilizing the NDRE value at the 95 percent in the histogram [VR_simp], the other utilizing the cumulative 95th percentile [VR_HS]) and the high N reference (HN) method for UAV_112 treatment strips at three sites across numerous sensing dates. The 0.95 SI threshold is indicated with a solid black horizontal line. The date of in-season N application is represented with a vertical dashed line. Means denoted with different letters are significantly different within a sensing date at p-value < 0.0001.
Remotesensing 12 01597 g006
Table 1. Yield, base and in-season N rates, partial factor productivity of N (PFPN), marginal net return, and delta SI mean and standard deviation for farmer and unmanned aerial vehicle (UAV) sensor-based N management across years and locations.
ZP17YL18DA18
FarmerUAV_84UAV_112FarmerUAV_112FarmerUAV_112
Base N (kg ha−1)17984112179112202112
In-Season N (kg ha−1)4511483.6028059
Total N (kg ha−1)224 ± 0198 ± 6.1196 ± 5.2179 ± 0140 ± 0202 ± 0171 ± 0
Yield (Mg ha−1)15.5 ± 0.5 a †15.5 ± 0.4 a15.4 ± 0.8 a12.7 ± 0.3 a12.6 ± 0.2 a11.5 ± 0.3 a11.5 ± 0.1 a
PFPN (kg grain kg N−1)68.9 ± 2.3 a78.3 ± 3.9 b78.9 ± 3.2 b70.9 ± 1.7 a90.1 ± 1.6 b56.9 ± 1.5 a67.0 ± 0.4 b
Marginal Net Return (USD ha−1)1704.6 ± 63.4 a1711.2 ± 55.7 a1711.5 ± 97.8 a1498.6 ± 39.5 a1455.5 ± 29.0 a1331.6 ± 38.5 a1286.6 ± 7.8 a
Delta SI−0.041 ± 0.92 b−0.018 ± 0.004 a−0.026 ± 0.01 a−0.020 ± 0.008 a−0.027 ± 0.004 a0.003 ± 0.004 a−0.007 ± 0.008 a
† Within site, means followed by different letters are significantly different at p-value < 0.05. SI was calculated with a simplified version of the virtual reference approach (VR_simp).

