Article

Spatial and Temporal Variations in the Extent and Thickness of Arctic Landfast Ice

1
Key Laboratory of Physical Oceanography/Institute for Advanced Ocean Studies, Ocean University of China and Qingdao National Laboratory for Marine Science and Technology, Qingdao 266100, China
2
Key Laboratory of Research on Marine Hazards Forecasting, National Marine Environmental Forecasting Center, Beijing 100081, China
3
Finnish Meteorological Institute, 00101 Helsinki, Finland
4
School of Geospatial Engineering and Science, Sun Yat-Sen University, Zhuhai 519082, China
5
Southern Marine Science and Engineering Guangdong Laboratory (Zhuhai), Zhuhai 519082, China
6
School of Atmospheric Sciences and Guangdong Province Key Laboratory for Climate Change and Natural Disaster Studies, Sun Yat-Sen University, Zhuhai 519082, China
7
Key Laboratory of Digital Earth Science, Institute of Remote Sensing and Digital Earth, Chinese Academy of Sciences, Beijing 100094, China
*
Author to whom correspondence should be addressed.
Remote Sens. 2020, 12(1), 64; https://doi.org/10.3390/rs12010064
Submission received: 30 October 2019 / Revised: 6 December 2019 / Accepted: 18 December 2019 / Published: 23 December 2019
(This article belongs to the Special Issue Polar Sea Ice: Detection, Monitoring and Modeling)

Abstract

:
Analyses of landfast ice in Arctic coastal areas provide a comprehensive understanding of the variations in Arctic sea ice and generate data for studies on the utilization of the Arctic passages. Based on our analysis, Arctic landfast ice mainly appears in January–June and is distributed within the narrow straits of the Canadian Archipelago (nearly 40%), the coastal areas of the East Siberian Sea, the Laptev Sea, and the Kara Sea. From 1976–2018, the landfast ice extent gradually decreased at an average rate of −1.1 ± 0.5 × 10⁴ km2/yr (10.5% per decade), while the rate of decrease for entire Arctic sea ice was −6.0 ± 2.4 × 10⁴ km2/yr (5.2% per decade). The annual maximum extent reached 2.3 × 10⁶ km2 in the early 1980s, and by 2018, the maximum extent decreased by 0.6 × 10⁶ km2, which is an area approximately equivalent the Laptev Sea. The mean duration of Arctic landfast ice is 44 weeks, which has gradually been reduced at a rate of −0.06 ± 0.03 weeks/yr. Regional landfast ice extent decreases in 16 of the 17 subregions except for the Bering Sea, making it the only subregion where both the extent and duration increases. The maximum mean landfast ice thickness appears in the northern Canadian Archipelago (>2.5 m), with the highest increasing trend (0.1 m/yr). In the Northeast Passage, the mean landfast ice thickness is 1.57 m, with a slight decreasing trend of −1.2 cm/yr, which is smaller than that for entire Arctic sea ice (−5.1 cm/yr). The smaller decreasing trend in the landfast ice extent and thickness suggests that the well-known Arctic sea ice decline largely occurred in the pack ice zone, while the larger relative extent loss indicates a faster ice free future in the landfast ice zone.

Graphical Abstract

1. Introduction

The Arctic is sensitive to global climate change. Sea ice is a crucial indicator of Arctic climate change, as it is an important part of the climate system [1,2]. Since the 1970s, the global temperature has continued to rise, which has had a profound impact on the Arctic region, leading to the gradual warming of the Arctic [3]. Since the 21st century, Arctic warming has been twice the mean global warming rate [4,5,6]. In 2012, the area covered by sea ice was 45% less than the average area covered by sea ice during the previous 30 years [7,8]. Similarly, observations show that the amount of multiyear ice decreased from 75% in the mid-1980s to 45% in 2011 [9]. The amount of multiyear ice has decreased dramatically and has been replaced by thinner first-year ice [10,11]. Models have shown that the decrease in Arctic sea ice not only occurs in the summer but also during other seasons [12,13]. As Arctic sea ice retreats to the north, the feasibility of shipping along the Arctic coast increases [14]. The possibility of ships passing through the Northeast Passage in September from 1979–2005 was 40%, but it has risen to 61–71% in 2006–2015 [15].
In the Arctic, landfast ice responses to the global warming. It is important to determine the future potential of Arctic passage navigation in the summer months. Unlike the large amount of pack ice in the Arctic Ocean, landfast ice is immobile and attached to the coastlines or icebergs. In some regions, landfast ice can be grounded to form stamukha [16]. Landfast ice generally covers the shallow continental shelves in high-latitude Arctic regions and seasonal sea-ice-covered areas, ranging from 2–3 km along the Baltic Sea to 100–200 km along the East Siberian Sea, the Laptev Sea, and the Kara Sea [17]. The growth and disappearance of landfast ice are mainly influenced by thermodynamics, and the increase in thickness in a given year usually reaches 1–2 m [18,19]. The area covered by landfast ice in the Arctic varies greatly with season. The annual duration of landfast ice is usually 7–9 months. Due to regional differences in the atmospheric and oceanic conditions, landfast ice may persist for the entire summer generating multiyear landfast ice such as that in the Canadian Archipelago, where landfast ice can persist for several years [20].
Due to the lack of observational data, few studies have focused on areas covered by landfast ice. Previous studies on the distribution of and variation in landfast ice have mainly been conducted on the local scale. For example, using sea ice analysis maps and satellite images of the Kara Sea, Divine et al. [21] concluded that landfast ice extent decreased by approximately 12% from 1953–1990. Polyakov et al. [11] found that the thickness of landfast ice on the coast of eastern Siberia decreased by approximately 0.3 m since the 1990s. Galley et al. [22] analyzed sea ice analysis maps of the Canadian Archipelago for the period from 1980–2009 and found that, in most areas, the landfast ice duration significantly decreased by 2–5 weeks/10a, while the duration in the Viscount Melville Sound, which is southwest of Cornwallis Island, the western part of the M’Clure Strait, and the Gulf of Boothia, increased at a rate of 1–3 weeks/10a. In the Chukchi Sea and Beaufort Sea, the duration was found to have decreased by 1 week/10a [23], while the southeastern Laptev Sea showed a significant decrease in the duration: up to 7 weeks/10a from 1999 to 2013 [24]. In the northern Queen Elizabeth Islands, the Robeson Channel, and the northeastern part of Smith Sound, the landfast ice duration decreased by 7–10 weeks/10a. Based on the sea ice analysis maps, Yu et al. [25] studied the variations in landfast ice in the Arctic and found that the landfast ice extent decreased at a rate of −12.3 ± 2.8 × 10³ km2/yr from 1976 to 2007, with the most significant decrease occurring in the northern waters of the Canadian Archipelago. In recent years, Synthetic Aperture Radar (SAR) images have started to be used in the study of Arctic landfast ice, which may improve the accuracy of extent statistics [26,27].
In this study, a dataset of weekly landfast ice extent for the entire Arctic from 1976 to 2018 was extracted based on Arctic ice charts provided by the U.S. National Ice Center (NIC). To our knowledge, this is the longest publicly available landfast ice dataset. Monthly sea ice thickness retrieved from the National Snow and Ice Data Center (NSIDC) CryoSat-2 dataset for the entire Arctic from 2010 to 2018 is used to analyze the landfast ice thickness. The analysis of the landfast ice extent is an extension to the study of Yu et al. [25] while the analysis of the landfast ice thickness was a new trial. This new analysis can provide insights on an Arctic landfast ice change in the recent ten years. The study area and subregions are introduced in Section 2.1, and the dataset used is introduced in Section 2.2. The seasonal, interannual, and interdecadal variations in the landfast ice extent and thickness of the entire Arctic and its subregions are analyzed in Section 3, and the discussion and conclusion are given in Section 4 and Section 5, respectively.

2. Study Area and Data
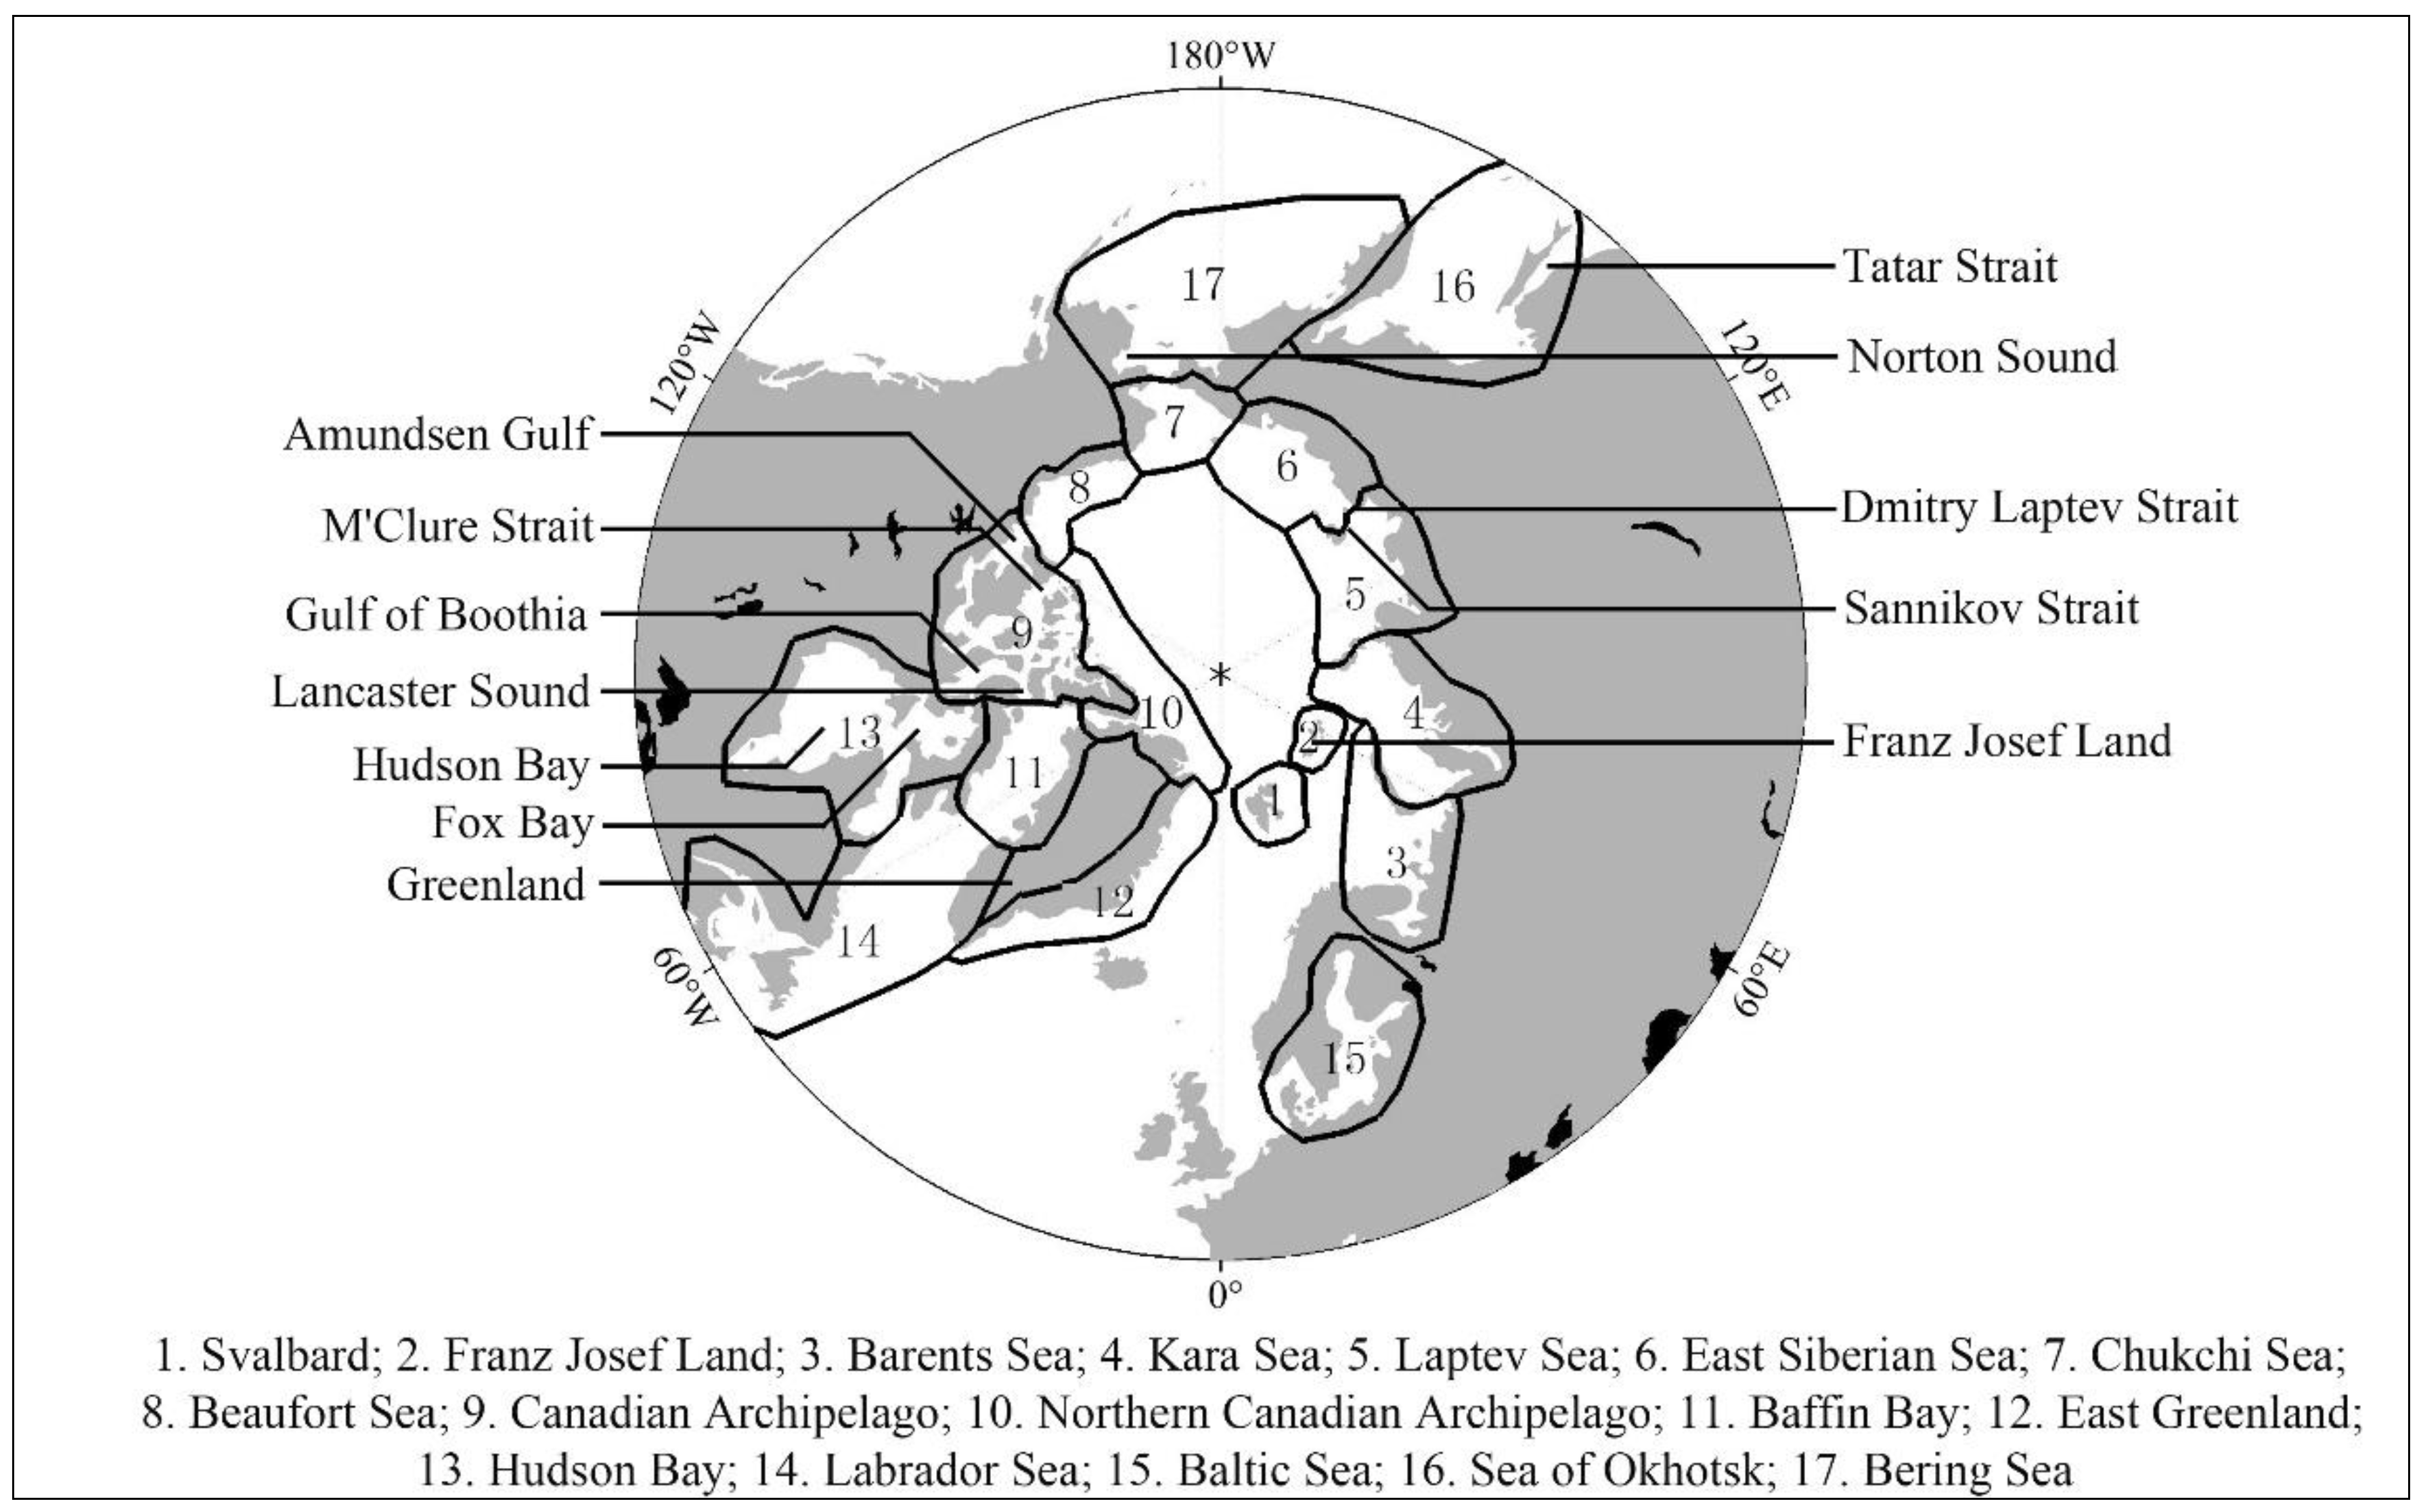
2.1. Study Area

The study area includes the Arctic and sub-Arctic waters north of 55° N, where landfast ice commonly appears in the winter. To further verify the regional differences in the landfast ice extent, the Arctic and sub-Arctic waters were divided into 17 subregions following the criterion used by Yu et al. [25] as shown in Figure 1. The main gulfs, straits, and bays are marked in the figure. The combination of subregion 3 (Barents Sea), subregion 4 (Kara Sea), subregion 5 (Laptev Sea), and subregion 6 (East Siberian Sea) was defined as the Northeast Passage, and the combination of subregion 8 (Beaufort Sea), subregion 9 (Canadian Archipelago), and subregion 10 (Northern Canadian Archipelago) was defined as the Northwest Passage.

2.2. Data

2.2.1. Landfast Ice Extent Dataset

Two sources of landfast ice extent data were used in this study. The first dataset was obtained from a weekly/biweekly gridded Arctic sea ice product stored as binary files [28]. This product was released by the U.S. National Ice Center (NIC) and includes data for 1976–2007. The second dataset was obtained by analyzing weekly/biweekly Arctic sea ice charts stored as image files. This product was also released by the NIC [29] and includes data for 2008–2018. These two datasets were produced by experienced sea ice experts from NIC by integrating and analyzing field observation data, satellite remote sensing data, and numerical simulations. Ice that remained motionless for the duration of the weekly/biweekly ice charts was marked as landfast ice. In this study, the processing technique introduced by Yu et al. [25] was used to process the image-formatted ice charts from the second dataset to obtain the same binary-formatted ice product as the first dataset for 2008–2018. A detailed description can be found in a paper by Li and Zhao [30].

2.2.2. Landfast Ice Thickness Dataset

The ice thickness datasets used in this study are archived at NSIDC [31], which was obtained based on the ESA CryoSat-2 Synthetic Aperture Interferometric Radar Altimeter. These products have ever been assessed with airborne observations [32] and would be further compared with NOAA’s Operation IceBridge data in the discussion part of this study. The datasets have a spatial resolution of 25 km × 25 km. We used 30-day averaged values. The data covers a period from January to April during 2011 to 2018.

2.2.3. ECMWF Air Temperature Reanalysis

In order to access the landfast sea ice mass balance, we used a simple analytical model forced by air temperature to calculate inter-annual ice thickness. The 2-m air temperature (T2M) reanalysis extracted from European Center for Medium-Range Weather Forecast (ECMWF) from 1976 to 2018 was used in this study. The time series includes three years (1976–1978) from the ERA-20C and 40 years (1979–2018) from the ERA-Interim. The ECWMF T2M is available with 6 h intervals and nested in a fixed grid of 0.125°. The overall ECWMF products are of comparatively high quality [33], while T2M often has a warm bias in high latitude [34,35]. For example, the daily mean warm bias for ERA-Interim and new ERA5 on Arctic sea ice was reported to be 3.4 and 5.4 °C, compared with in situ buoy observations [36].

3. Results

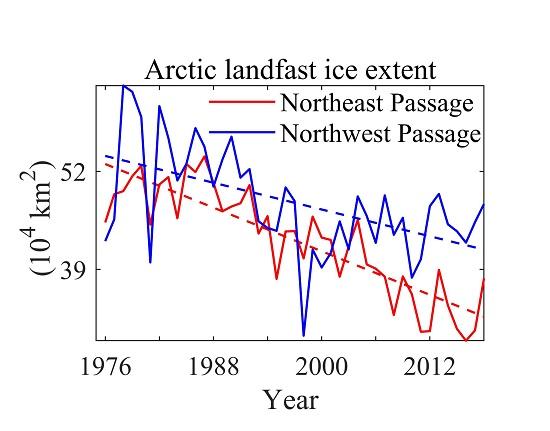
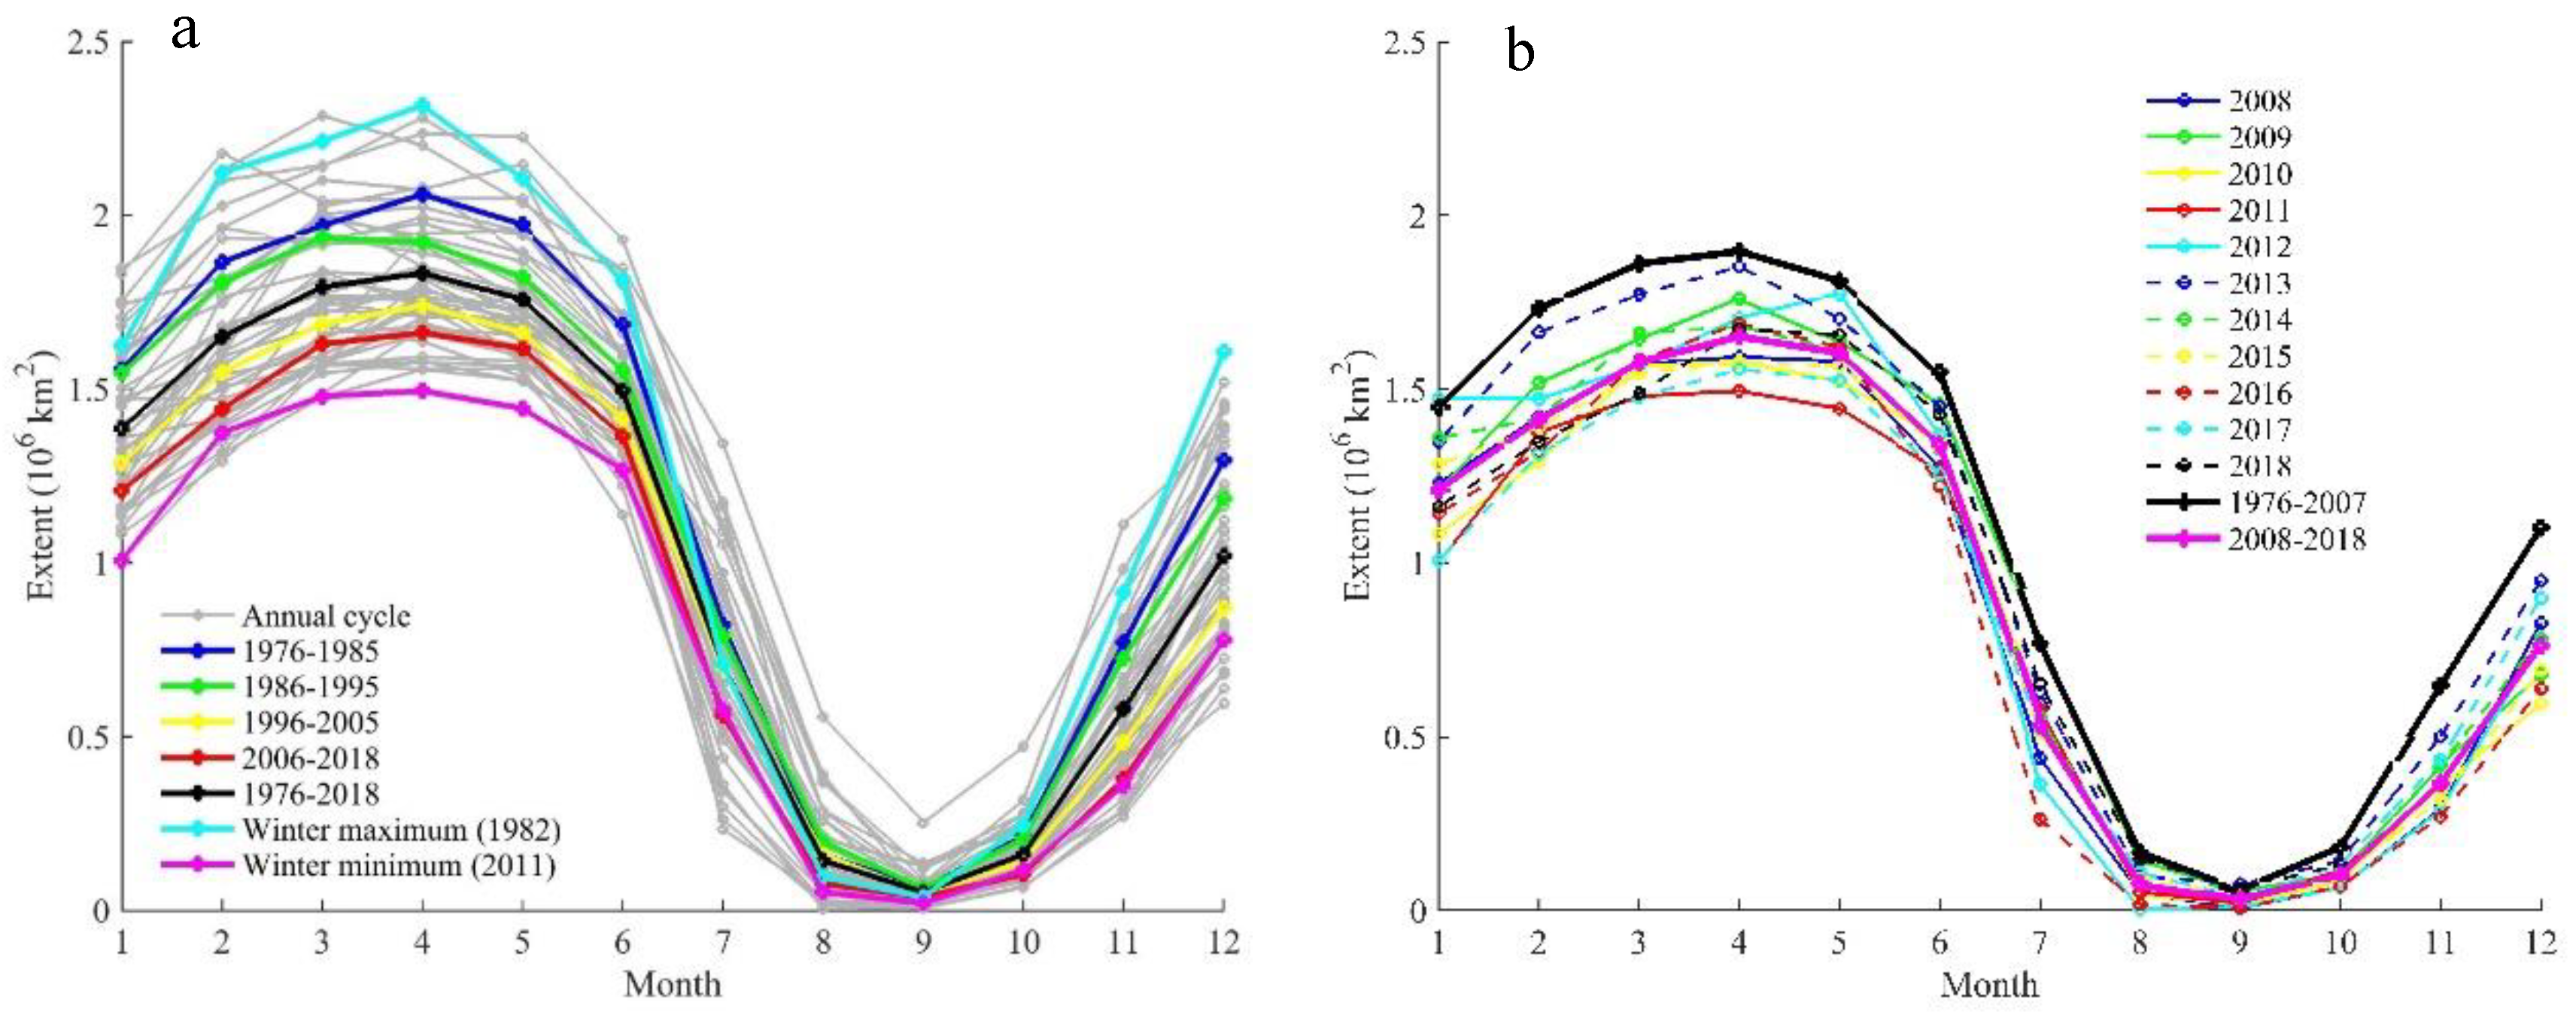
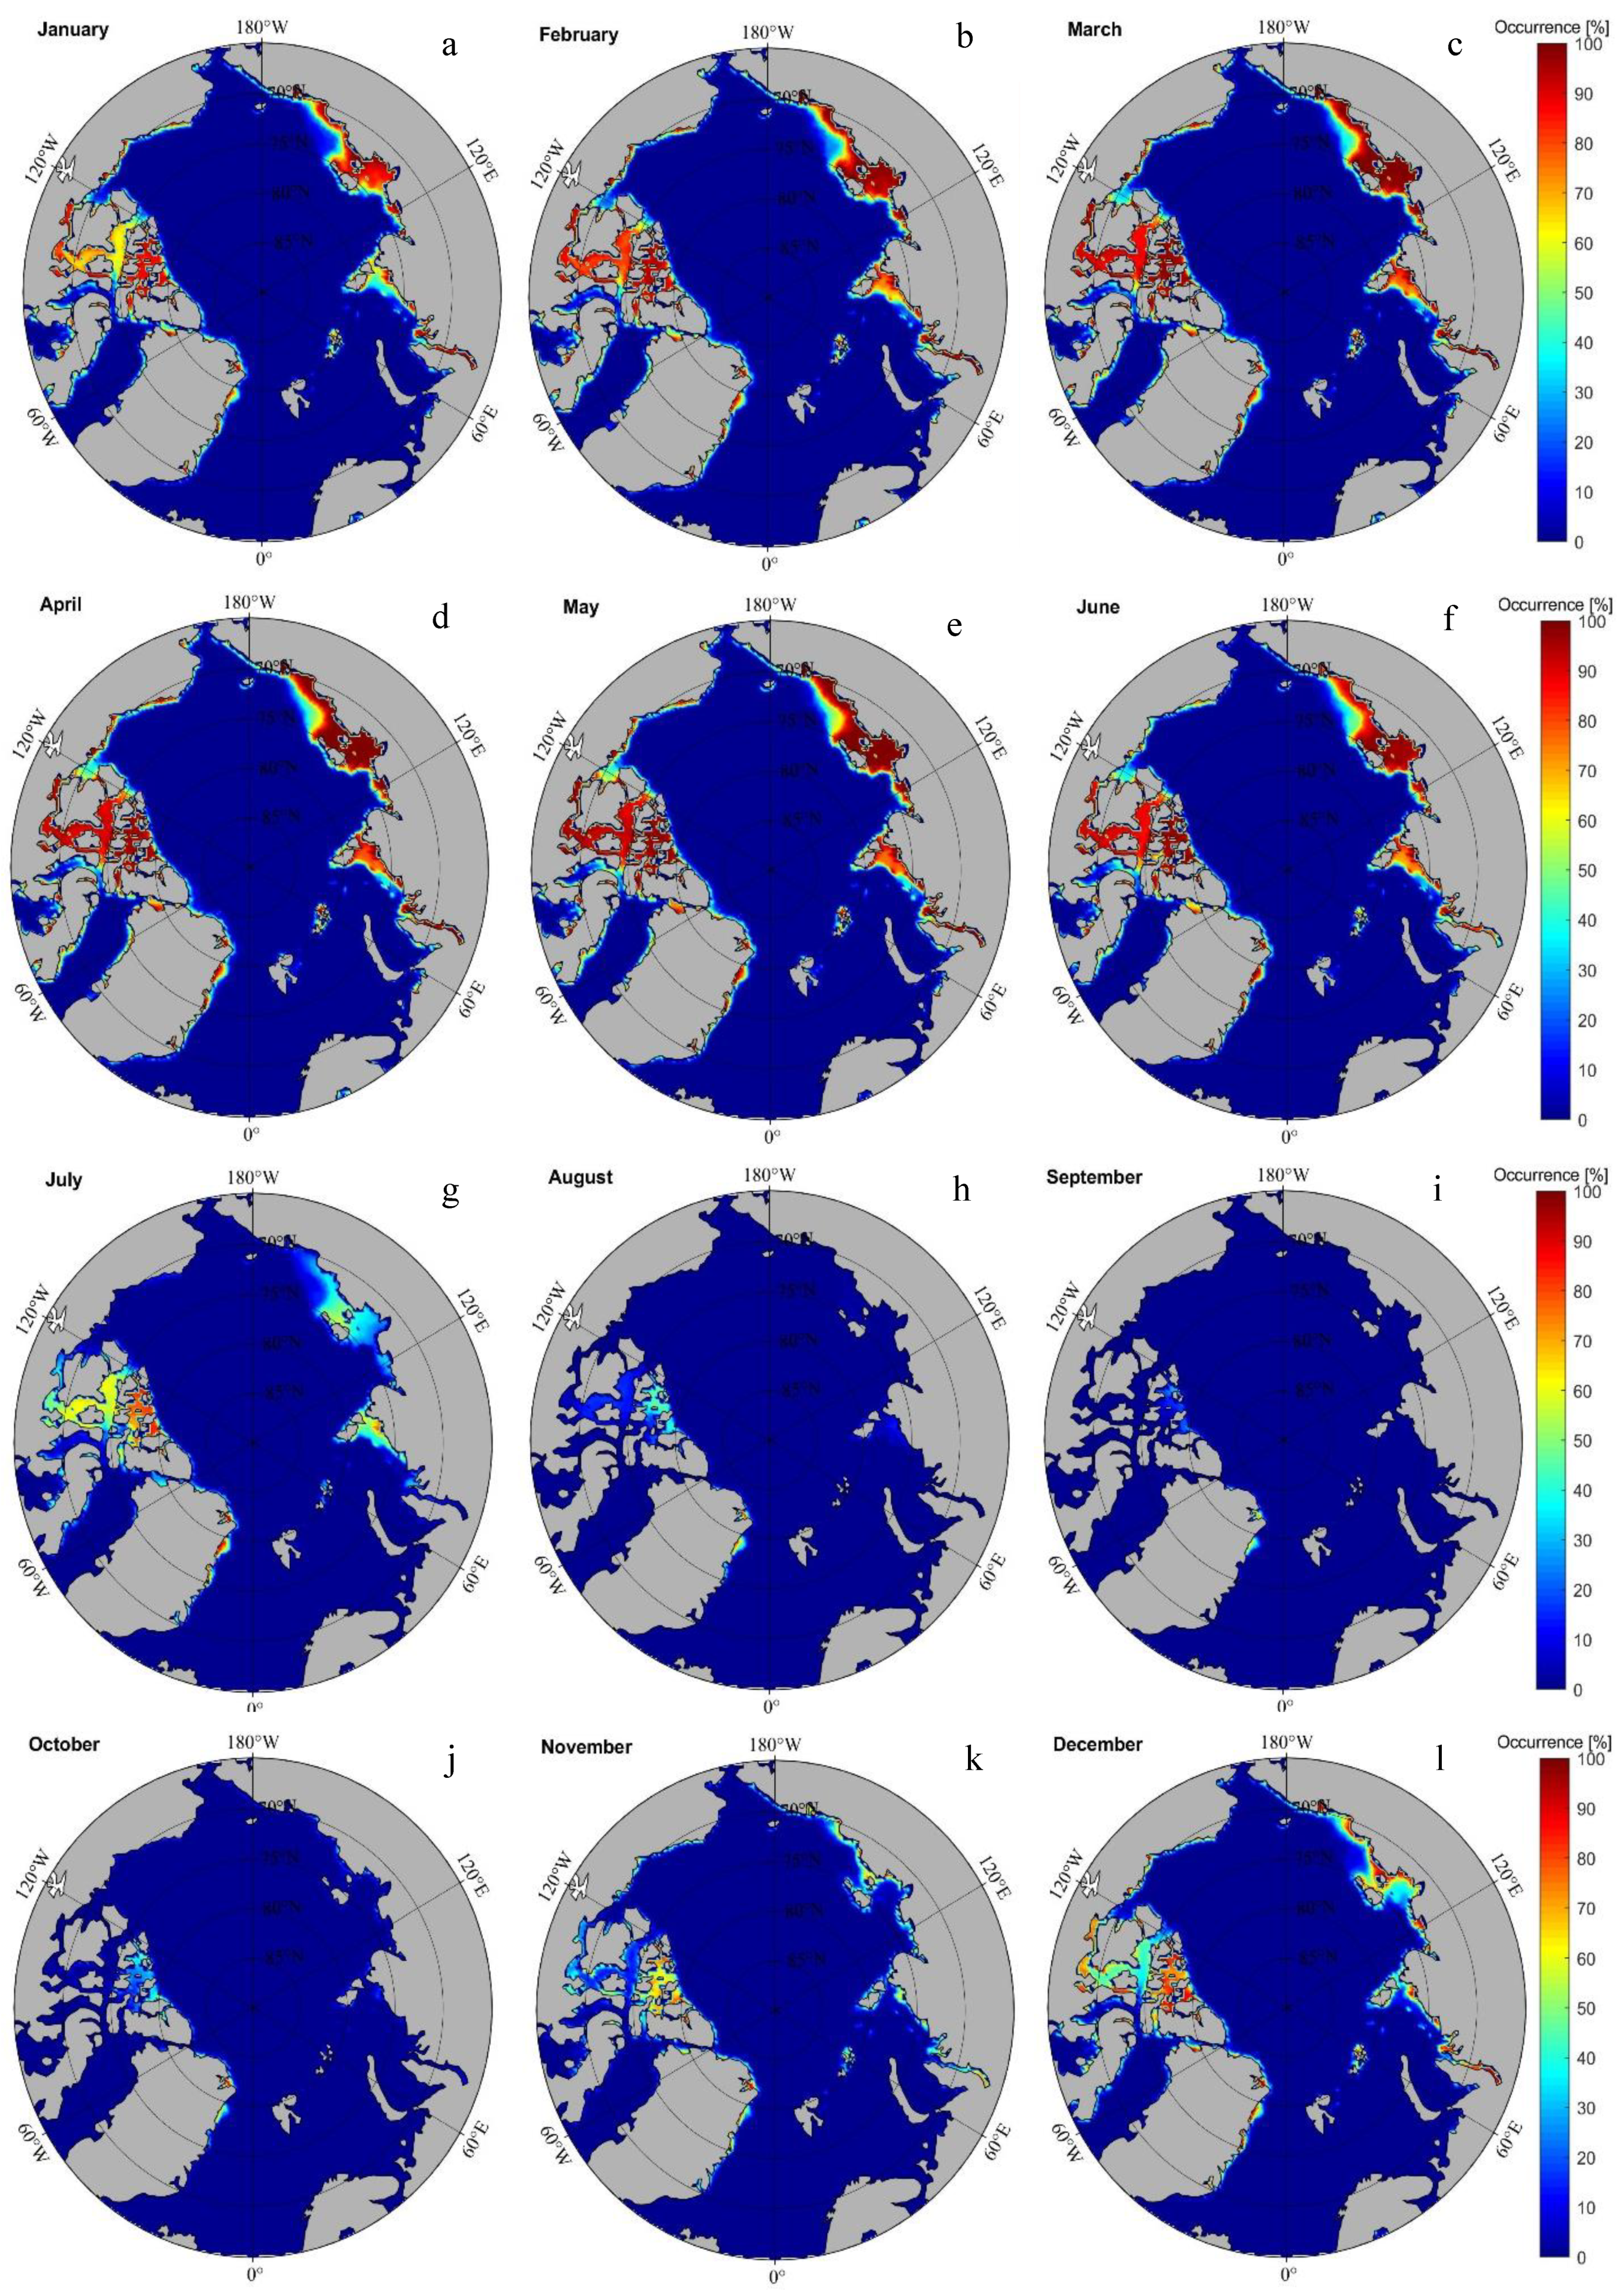
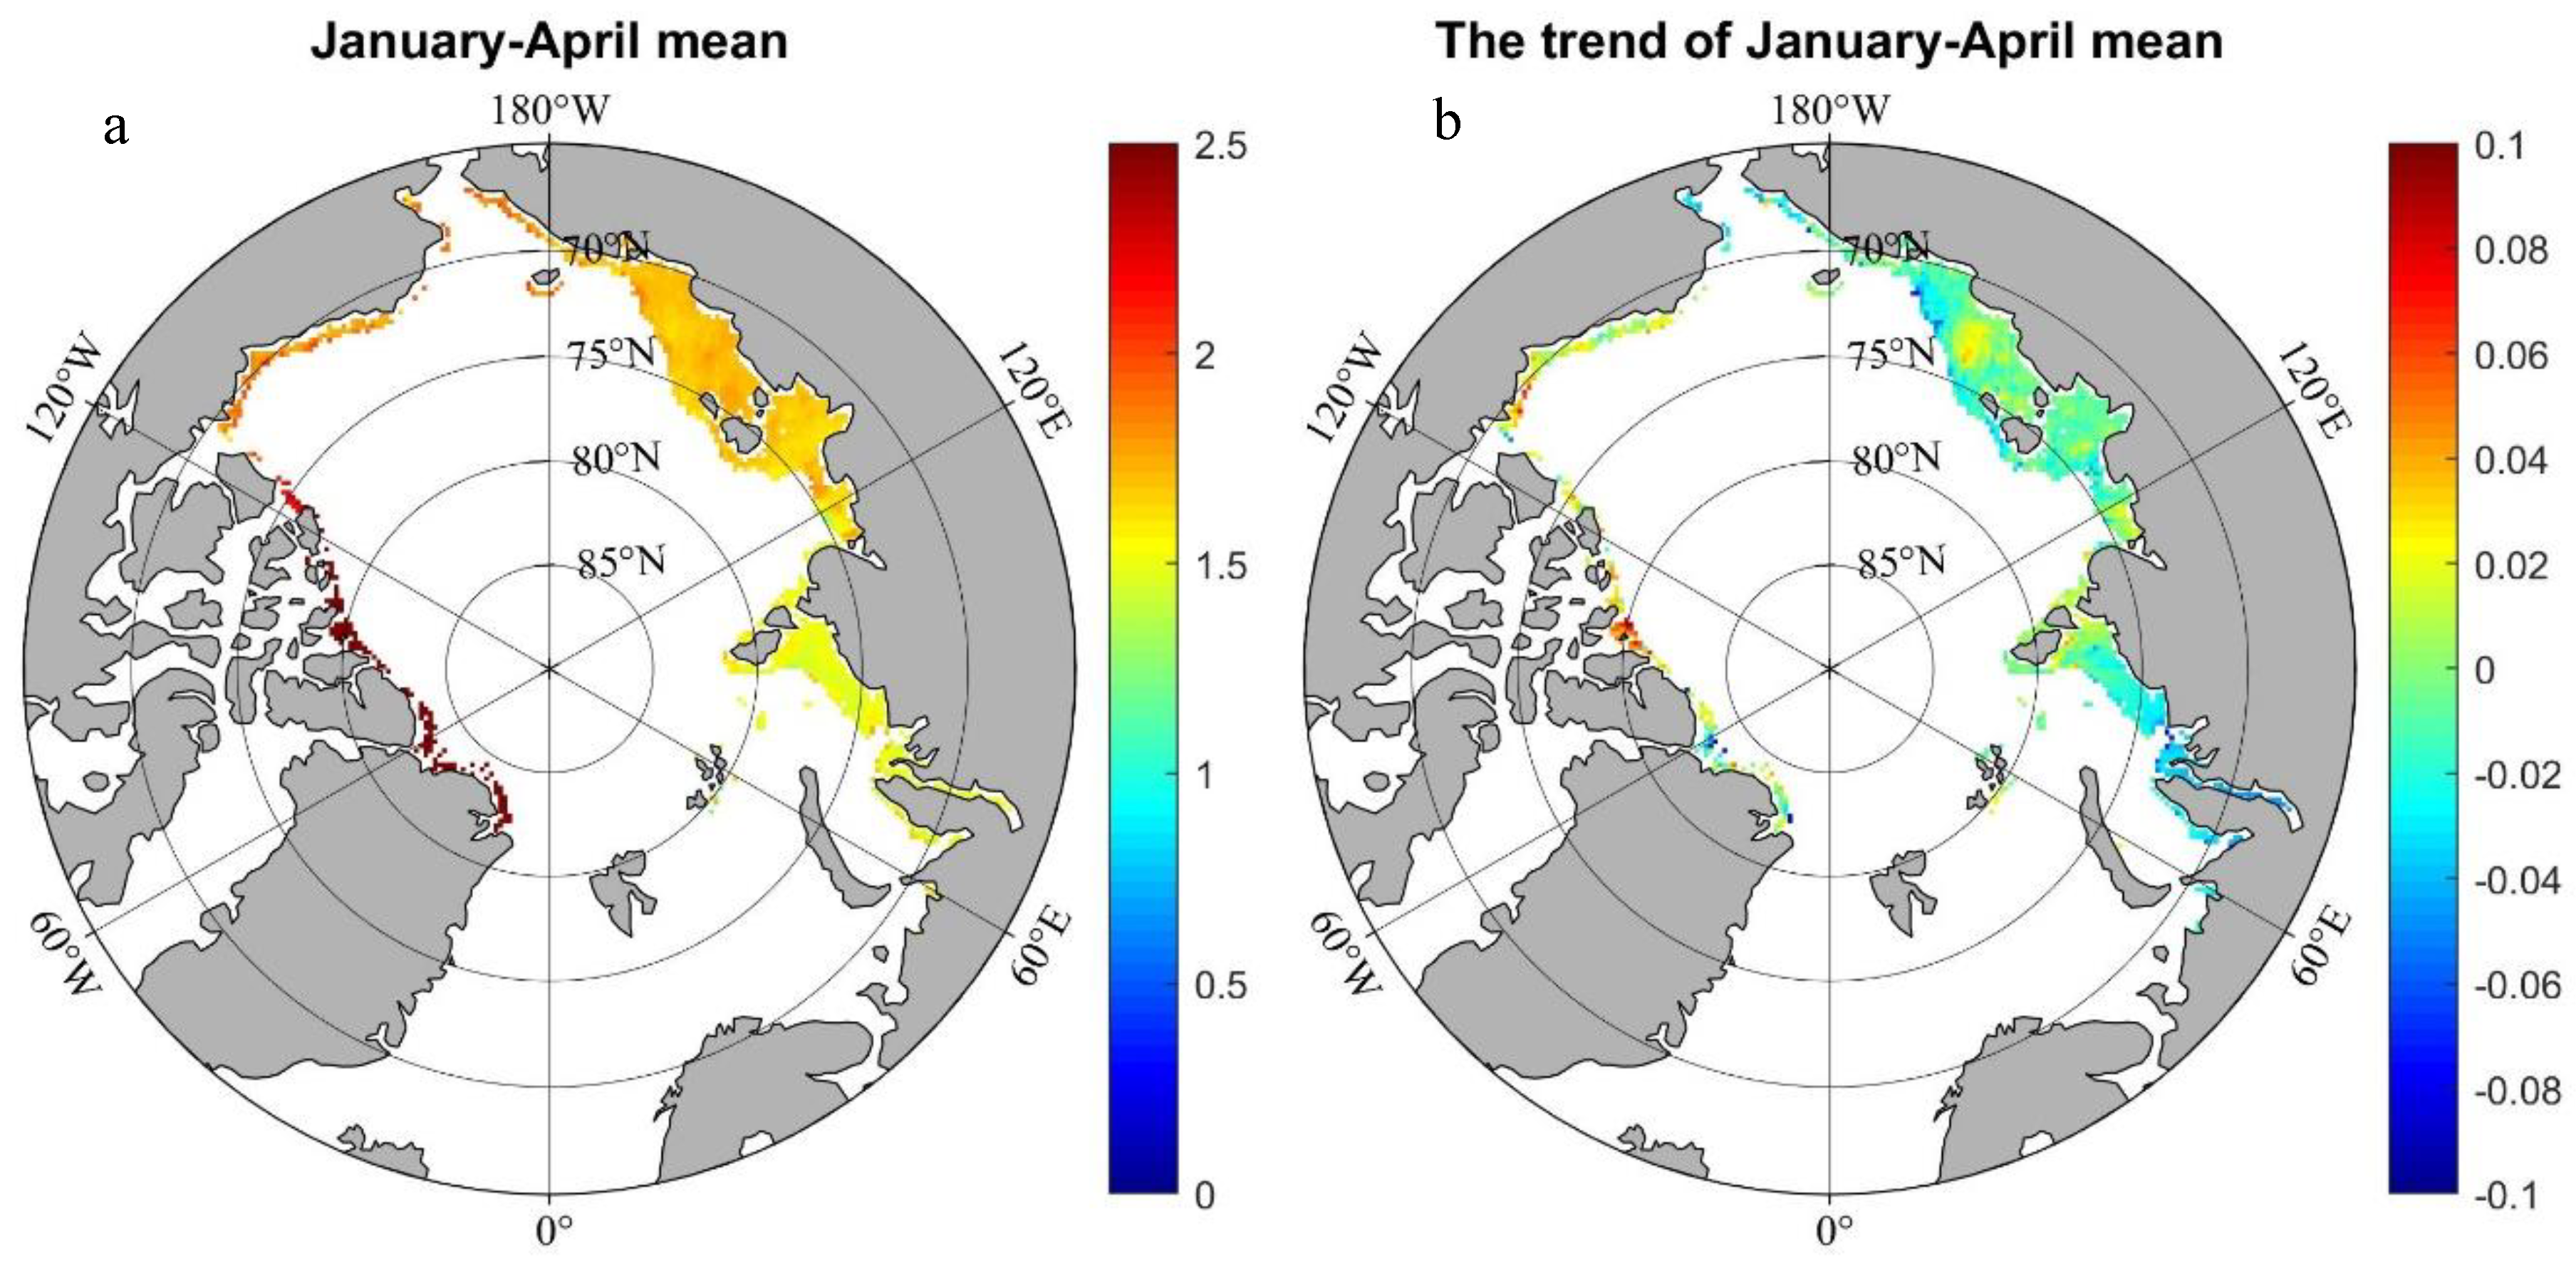
3.1. Landfast Ice Extent

The interannual variation of landfast ice extent is given in Figure 2. It was obtained based on the entire area covered by Arctic landfast ice. The Arctic landfast ice extent exhibits clear seasonal variations. The extent begins to increase in October and reaches its maximum in late April. The multiyear annual mean extent of landfast ice in the entire Arctic is 1.1 ± 0.7 × 10⁶ km2, and the multiyear mean maximum extent in April is 1.8 × 10⁶ km2. January–June are the significant months, when the landfast ice extent exceeded 1.0 million km2. Landfast ice decreases rapidly in July and disappears completely in most areas in September. The maximum extent exhibited significant interannual variations, with the peak extent occurring in 1982 (2.3 × 10⁶ km2) and the minimum extent occurring in 2011 (1.5 × 10⁶ km2).
The landfast ice extent was averaged every ten years to analyze the interdecadal variation, as shown in Figure 2a. In the 1976–1985 interval, the maximum extent was 2.1 × 10⁶ km2, which decreased to 1.9 × 10⁶ km2 in the 1986–1995 interval, to 1.74 × 10⁶ km2 in the 1996–2005 interval and to 1.66 × 10⁶ km2 in the 2006–2018 interval, which showed that the winter extent suffered a continuous decrease in the last decade compared to the study period (1976–2007) of Yu et al. [25]. The maximum extent for 2008–2018 interval in the Figure 2b was 15% smaller than that for 1976–2007 interval. Every single year in the extended time series during 2008–2018 showed a smaller extent than the mean for 1976–2007 interval, both in winter and summer. The occurrence of almost landfast ice free summers were becoming regular, and the decrease trend indicated that landfast ice may disappear in the next half century during summer and autumn.
As Table 1 shows, a significant area loss occurred in early winter, November and December, when 13.87~17.92 × 10³ km2 (17–24% per decade) disappeared every year, approximately 1.5–2 times the area of Iceland. In October, the area lost every year was smaller (3.87× 10³ km2), while the percentage was large and significant (about 24% per decade). From January to July, the area lost every year remained at a high level of approximately 10 × 103 km2, but the percentage was small because of the larger base extent.
Figure 3 shows the occurrence of landfast ice in the Arctic during January to December from 1976 to 2018. The occurrence for one single month was defined as the ratio of the number of months landfast ice existed and the number of total months in the time series. The results show that landfast ice is mainly distributed along the inner edge of the continental shelf around the Arctic Basin, such as the region in the Russian coastal areas (the Northeast Passage) and the waterways of the Canadian Archipelago (the Northwest Passage) during January–June, while occupying only narrow straits in the Canadian Archipelago during August–October.
As shown in Figure 4, the monthly mean landfast ice extent remained relatively vast from the late 1970s to the mid-1980s, and the maximum monthly extent occurred in April 1982 (2.3 × 10⁶ km2). The trend since 2008 in the extended time series after Yu et al. [25] showed a continuation decreasing trend, both for Arctic sea ice extent and landfast ice extent. The annual mean landfast ice extent had more interannual variability compared with that of sea ice extent, which was lined with the subregional variation. During 1976–2018, the monthly mean extent of the landfast ice in the Arctic showed a significant decreasing trend at a rate of −1.1 ± 0.5 × 10⁴ km2/yr (10.5% per decade), while the monthly mean extent of all sea ice in the Arctic showed a much larger decreasing trend at a rate of −6.0 ± 2.4 × 10⁴ km2/yr (5.2% per decade). Considering the fact that the extent of all Arctic sea ice is approximately ten times that of landfast ice, and the relative change in the landfast ice is approximately double that in the Arctic sea ice, which indicates that the landfast ice located in the lower latitude is more sensitive to global warming and suffers a faster change.

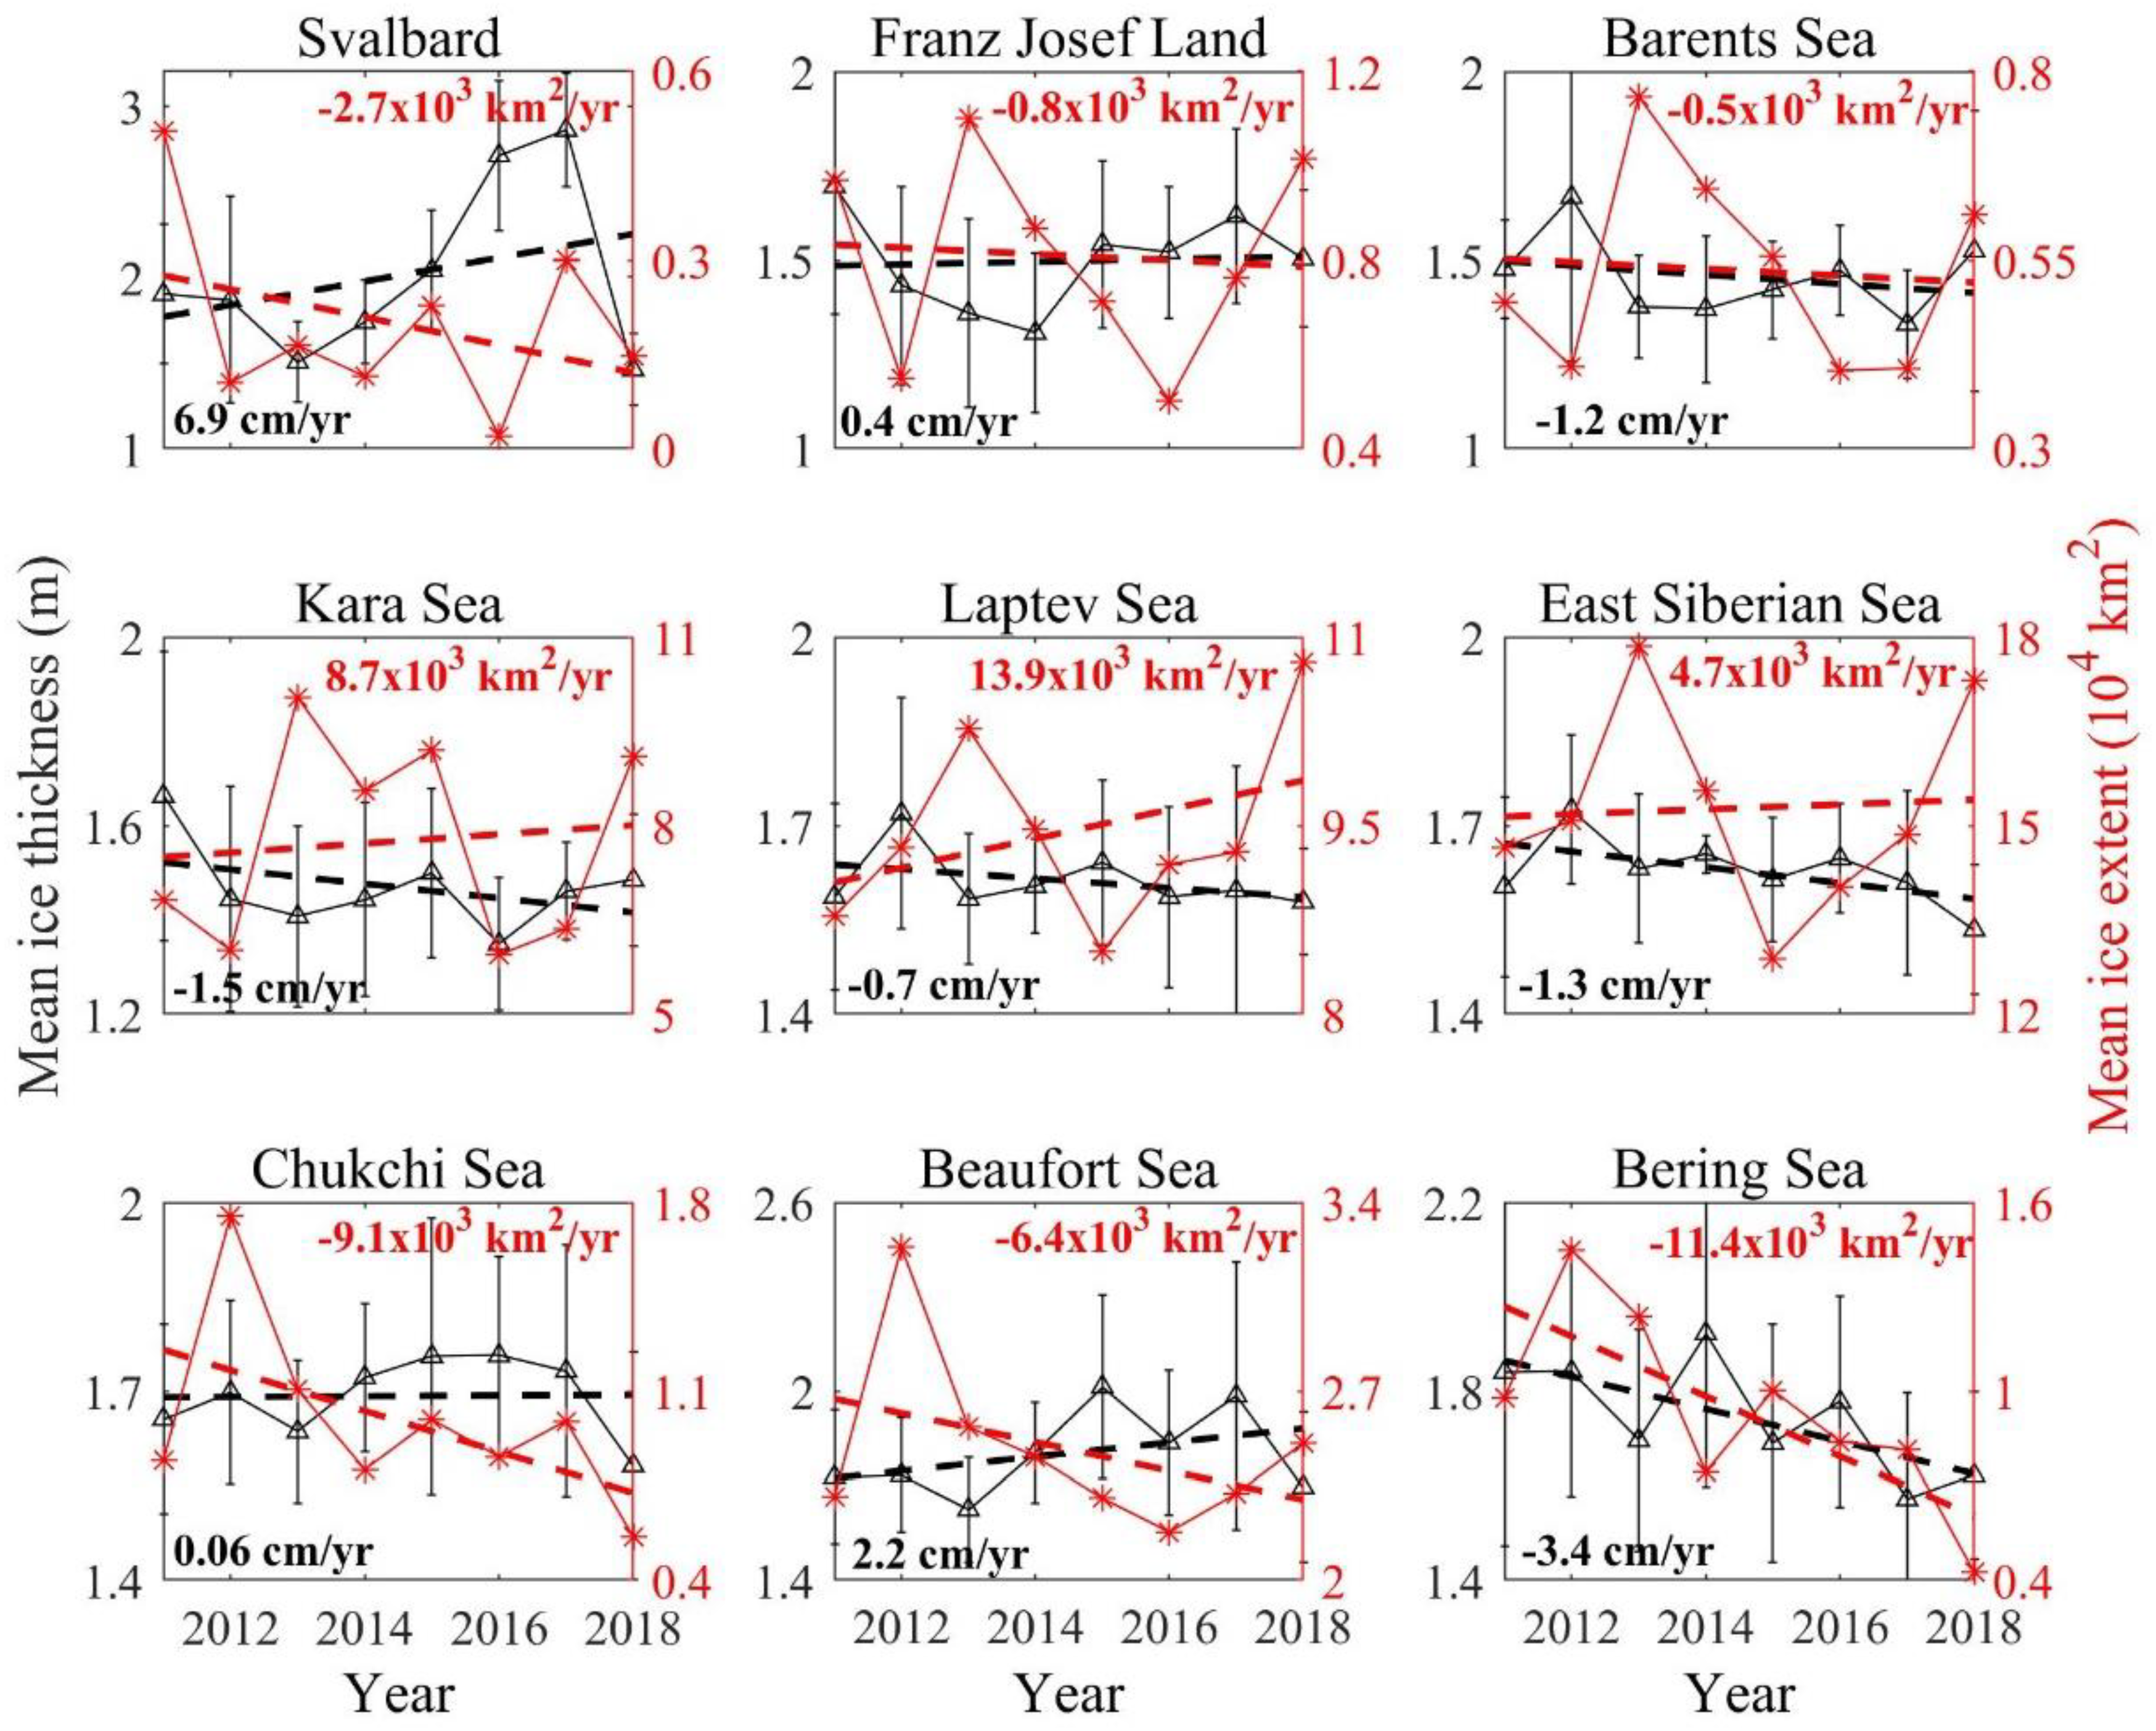
3.2. Regional Landfast Ice

The landfast ice interannual variabilities in various sub-regions are large. Figure 5 shows the statistical analysis of the annual mean extent of landfast ice in the subregions. Of the 17 subregions, the landfast ice extent in the Canadian Archipelago is the largest, about 347 × 103 km2, accounting for approximately 30% of the entire Arctic landfast ice. As Table 2 shows, the landfast ice extent decreases in 16 of the 17 subregions, except for the Bering Sea. The annual rate of decrease in the East Siberian Sea is the largest (−20.3 ± 9.4 × 10² km2/yr), and the annual rate of decrease for the Barents Sea is the smallest (−0.4 ± 0.6 × 10² km2/yr). For those regional seas, like Baltic Sea, Hudson Bay, Labrador Sea, Kara Sea, and the Canadian Archipelago, which connect with coastal inlets or with rich confined coastal lines, the interannual variabilities are large because the coastal climate conditions may be subject to large variabilities, especially for the Baltic Sea that is surrounded by the Nordic countries. For those subregions that connect with open oceans, the interannual variability is reduced because the landfast ice in those regions is more closed linked with the climate changes of Arctic oceans.
For the comparisons to the Jan–May trend during 1976–2007 from Yu et al. [25], we calculated the Jan–May trend and the Jan–Dec trend during 1976–2018. Thirteen of the 17 subregions in this study showed the same decreasing trend as that observed by Yu et al. [25]. However, in the Kara Sea and Baffin Bay, the decreasing trend was twice that observed by Yu el at. [25], and in the Canadian Archipelago and northern Canadian Archipelago, the decreasing trend was half that observed by Yu el at. [25], which indicates that the decrease experienced an intense change from 2008–2018. One of the 17 subregions (the Bering Sea) showed the same increasing trend, but the amount decreased by half. A significant decrease trend up to −7.5 × 10³ km2/yr in the Bering Sea was obtained for the extended time series 2008–2018, which was responsible for the weakening of an increasing trend. Two of the 17 subregions (the Barents Sea and the Okhotsk Sea) shifted the trend from increasing to decreasing, suggesting a significant extent reduction in the last ten years.
There was similar interannual variability in the Northeast Passage and Northwest Passage, but the former declined a bit faster than the latter, especially in recent years (Figure 5f). The annual mean extent in the entire Northeast Passage is 4.3 × 10⁵ km2, with a rate of decrease of 4.8 × 10³ km2/yr, and the entire Northwest Passage had a similar extent of 4.8 × 10⁵ km2, but with a smaller rate of decrease of 3.0 × 10³ km2/yr. The larger decrease rate of landfast ice in the Northeast Passage may be related to its open boundary next to the vast pan-Arctic ocean, while landfast ice in the Northwest Passage was mainly located in the narrow straits of Canadian Archipelago [37]. The faster decline of landfast ice extent in the Northeast Passage made it more attractive for maritime shipping. For examples, China have carried out 31 Arctic commercial cruises through Northeast Passage to Europe during the summer since 2013.

3.3. Landfast Ice Duration

Long-term decreases in the thickness and area of sea ice are usually accompanied by a shortening of the duration of sea ice [38,39]. Similar changes are observed in the Arctic landfast ice. According to the method proposed by Yu et al. [25], the onset of the ice freeze-up period was regarded as the time when the area covered by landfast ice exceeded 15% of the peak area for that year. The end of the breakup period was regarded as the time when the area covered by landfast ice was lower than 15% of the peak area for that year. As such, the time between the two thresholds represents the duration of landfast ice for that year.
In the 1980s, the ice freeze-up period began in the 42nd week (mid-October). Since the 1990s, the freeze-up period has been delayed and occurs in the 45th week (early November). Over the past 43 years, the onset of ice freeze-up has been delayed by nearly three weeks, which corresponds to a rate of 0.07 weeks/yr (0.5 days/yr) (Figure 6). The duration of extents exceeding 1.0 million km2 was approximately 30 weeks in the early 1980s, while it decreased to approximately 25 weeks in the past ten years.
Influenced by local large-scale weather and climatic conditions, the time of formation and duration of sea ice varies in different regions of the Arctic. The results of the statistical analysis of the duration of landfast ice in the Arctic, and its subregions are shown in Table 3. The mean duration of landfast ice in the Arctic subregions is 41 weeks, which varies from the lowest value in the Svalbard Islands (34 weeks) to the highest value in the northern Canadian Archipelago (48 weeks). There are significant regional differences in the duration of landfast ice. Because the onset of ice freeze-up in these two areas occurs earlier in the autumn at a rate of 0.15 weeks/yr and 0.17 weeks/yr, respectively, in the Barents Sea and Baltic Sea, the duration of landfast ice is increasing (Figure 7).
Since landfast ice freezes near the coast, and the water depth is usually shallow, so the atmosphere boundary layer condition dominates the duration of landfast ice. Model experiments showed that the albedo, oceanic heat flux, air temperature, and snow accumulation affected the date of ice breakup in summer [40]. The increase of air temperature by 1 °C may reduce the ice duration of 13 days [41]. The dynamic breakup can change the duration of landfast ice, and usually occurs for landfast ice between 0.5 m and 1 m [42], highly related to the local weather processes, like cyclones and strong wind [43].
Due to the significant delay in the onset of ice freeze-up, the landfast ice duration in the Svalbard Islands, Franz Josef Land, Laptev Sea, East Siberian Sea, Chukchi Sea, Baffin Bay, and the Labrador Sea has decreased significantly. For example, the duration of landfast ice in the Svalbard Islands decreased significantly at a rate of −0.26 weeks/yr because the onset of ice freeze-up in Svalbard was delayed 0.26 weeks/yr. Compared to the mean duration results of Yu et al. [25], 16 of 17 subregions showed the same trend direction, except for the Okhotsk Sea, which shifted its duration trend from positive to negative.

3.4. Landfast Ice Thickness

The NSIDC CryoSat-2 monthly ice thickness dataset covers January to April from 2011 to 2018. The mean landfast ice thickness during January to April is illustrated in Figure 8a. The landfast ice thickness in the Northeast Passage showed clear spatial variations and is thicker (1.5~2.0 m) in the Laptev Sea and East Siberian Sea, and thinner (1.0–1.5 m) in the Kara Sea. In the northern Canadian Archipelago and the coast of the Beaufort Sea, the large ice thickness, up to 2.0–2.5 m, corresponded to multi-year ice and showed an obvious increasing trend from 2011 to 2018 (Figure 8b). The trend in the January–April mean ice thickness in the Northeast Passage along the Russian coast was dominated by a decreasing trend. Considering the fact that sea surface temperature in the Northeast Passage experienced a cooling trend in the past 30 years [44], the gradual warming of surface air temperature should be responsible for the decreasing trend of landfast ice thickness.
The change in the mean ice thickness in 9 of the 17 subregions was analyzed and illustrated in Figure 9. The subregions of the Northeast Passage, such as the Barents Sea, Kara Sea, Laptev Sea, and East Siberian Sea, showed a decreasing trend (−0.7~−1.5 cm/yr), and only the Chukchi Sea showed a slight increasing trend (0.06 cm/yr). For the entire Northeast Passage, the mean landfast ice thickness for Jan–Apr from 2011 to 2018 was 1.57 m and had a slight decreasing trend of −1.2 cm/yr. The ice thickness in Svalbard and the Beaufort Sea showed a significant increasing trend, up to 6.9 cm/yr. The mean Arctic sea ice thickness for Jan–Apr from 2014 to 2018 showed a decreasing trend of −5.1 cm/yr, much larger than the decreasing trend shown in the Northeast Passage, indicating that a much more drastic change occurred in the pack ice area.
The interannual variation of mean ice extent shown in Figure 9 was larger than that of mean ice thickness. The trend in Kara Sea, Laptev Sea, and East Siberian Sea was positive during 2011–2018, different to the results for 1976–2018, which indicated that the calculated trend for a short time series may be misleading when the temporal variation was large. Two of the nine subregions (Barents Sea and Bering Sea) showed decreasing trends both for ice thickness and extent, while seven of the nine subregions showed trends with opposite directions.

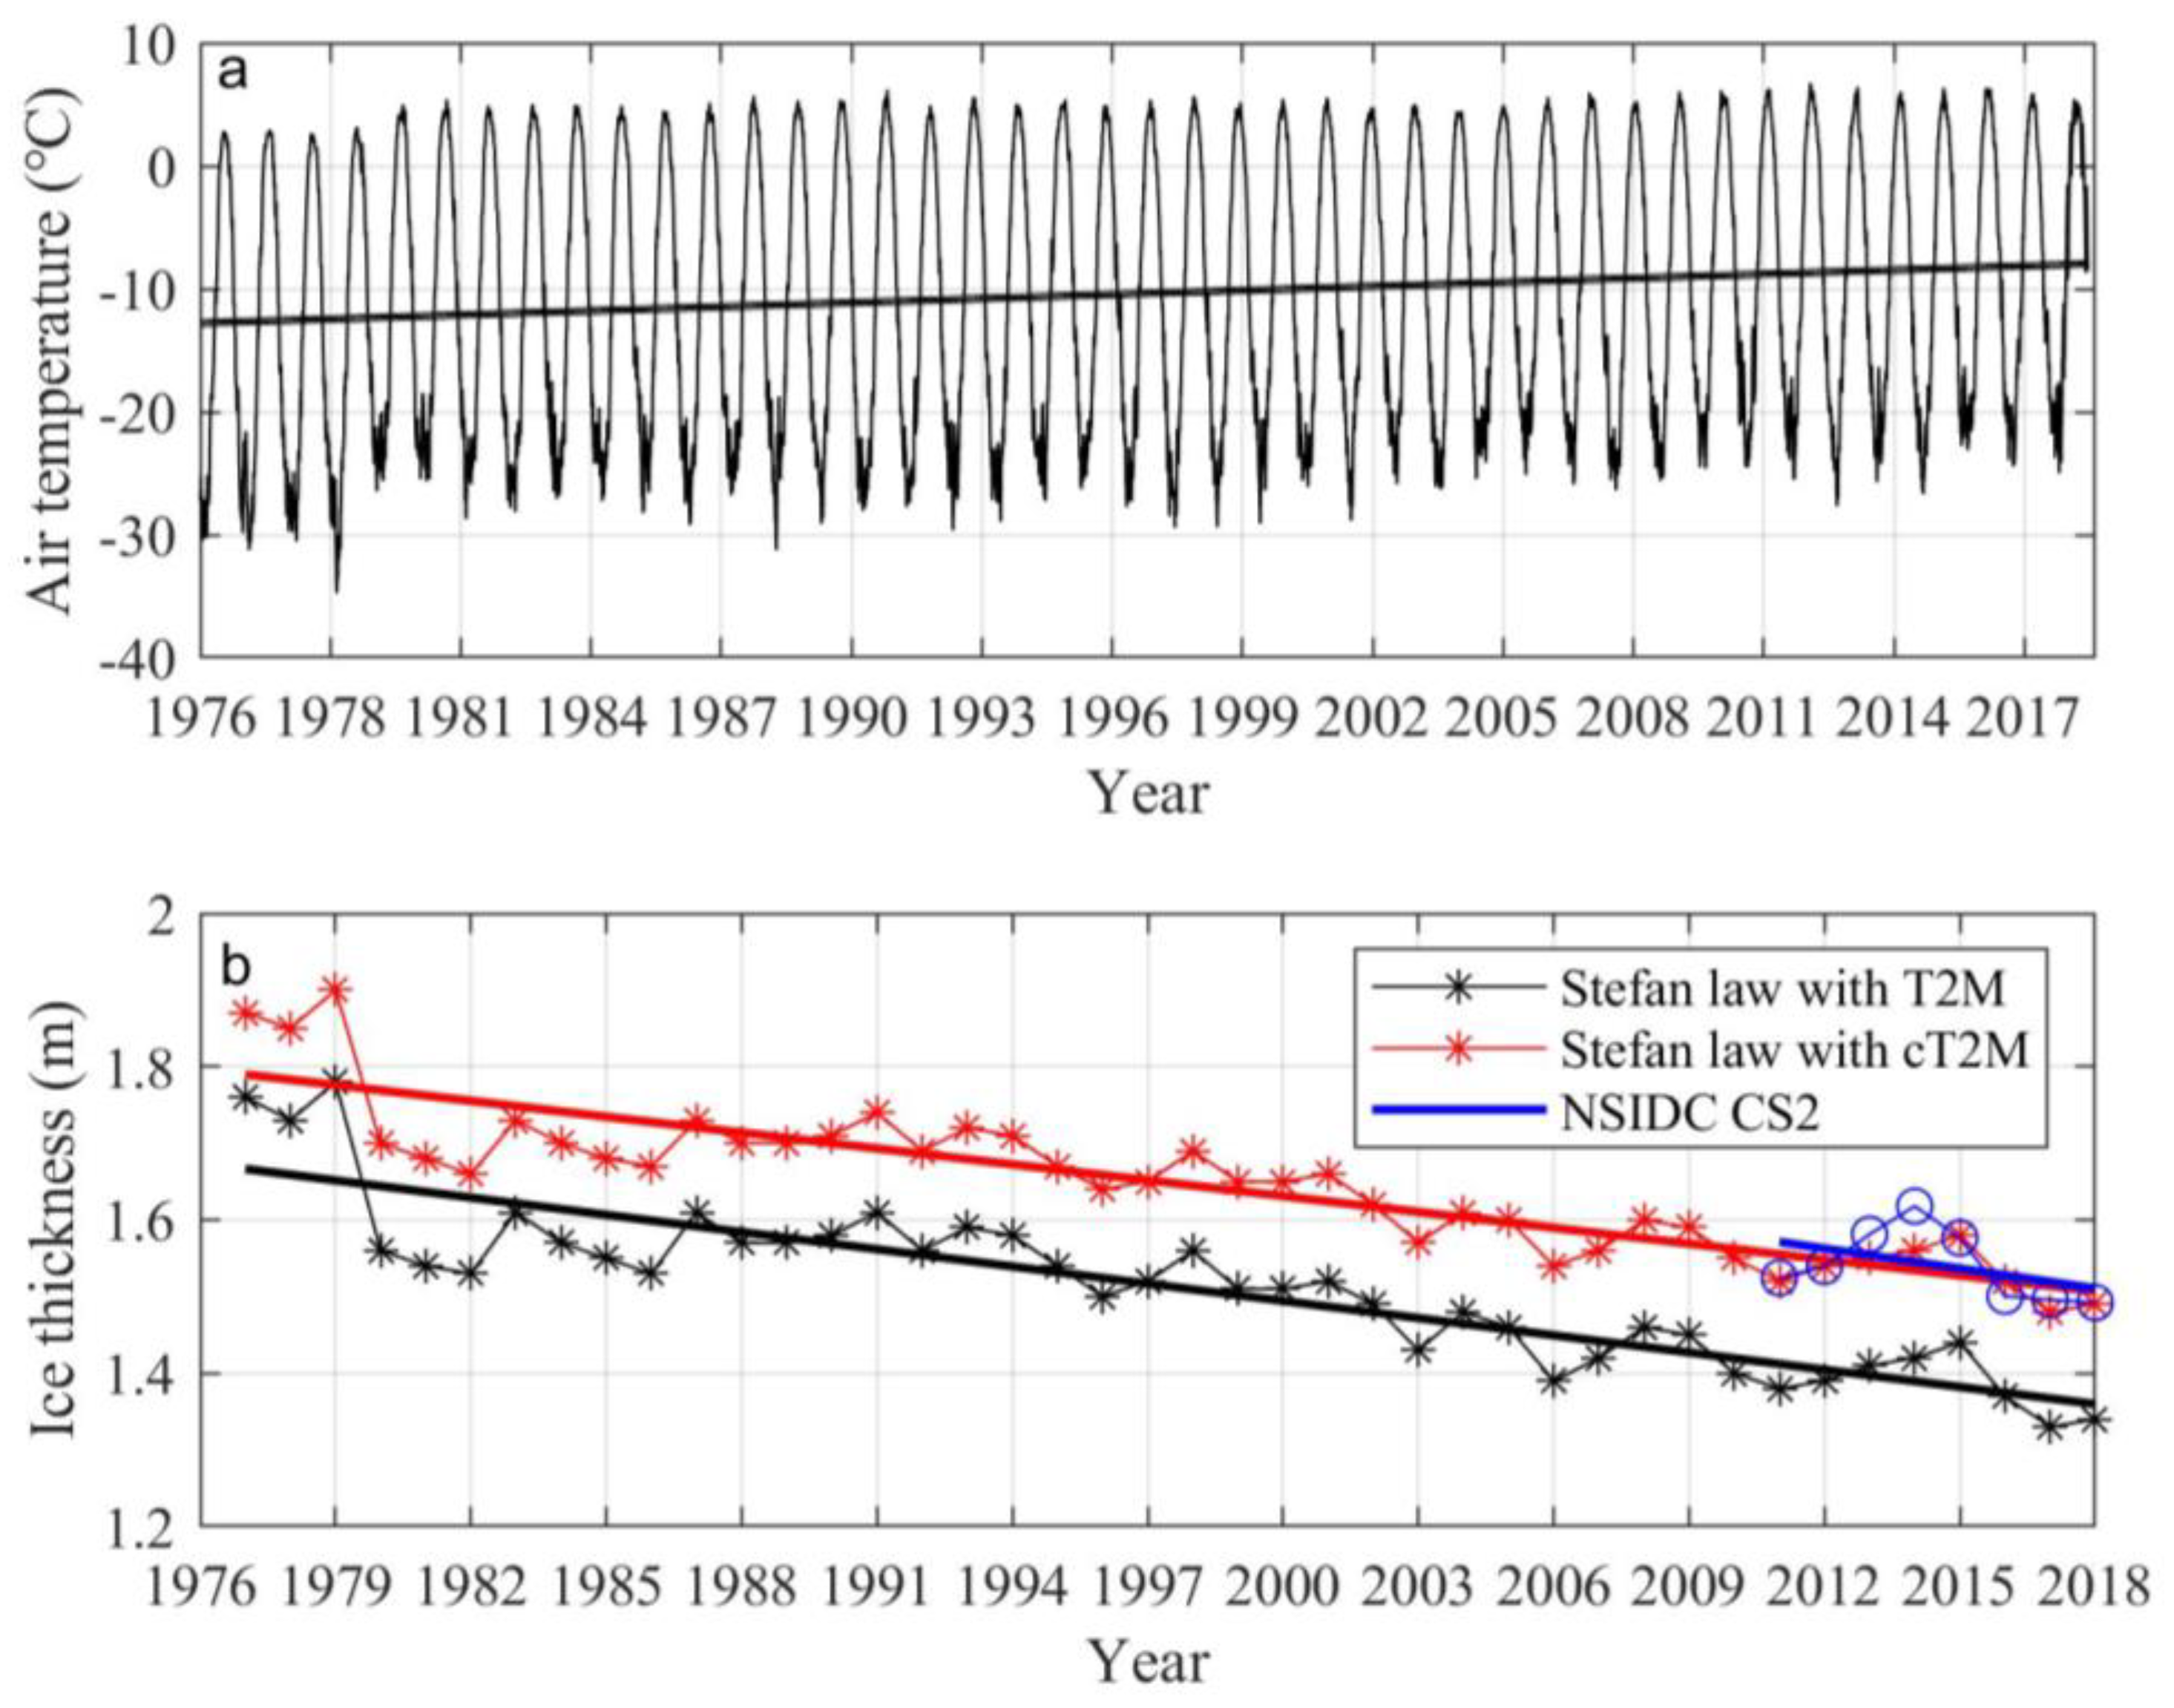
3.5. Stefan’s Law Calculation

Stefan’s law was applied in this study to investigate the long-term trend in the Arctic landfast ice thickness, dating back to 1976. Assuming a linear ice temperature profile and no heat flux conducted from the ocean, the ice growth rate can be considered a function of the conductive flux at the ice base. The ice growth rate can be calculated by
ρ i L f dH / dt = k i ( T f T o ) / H .
This equation is the traditional version of Stefan’s law [45]. Because of a lack of direct measurements of the snow/ice surface temperature, the air temperature was primarily used as the ice surface temperature, as in the previous thermodynamic modeling study [46,47]. Given the initial condition H = H0 at t = 0, the analytical solution can be expressed as
H = H 0 2 + a 2 S ,
where
S = 0 t ( T f T o ) dt ,   a 2 = 2 k i / ρ i L f   .
Here, S is the freezing degree days (°C · day ), and the time interval in this study is one day. ρ i is the sea ice density at the basal layer (910 kg/m3) [48]; L f is the sea ice latent heat of freezing (0.33 × 10⁶ J/kg) [49], H is the ice thickness, dH / dt is the ice growth rate, k i is the thermal conductivity of sea ice (2.03 W/m K) [43], T f is the seawater freezing point (−1.9 °C) [48,49], and T o is the ice surface temperature and is read as external forcing.
The calculations started with October 1 of each year in 1976–2018 and covered one year. The initial ice thickness was set to 0.01 m according to the thermodynamic ice model setup in the Kara Sea by Cheng et al. [50], who indicated that these calculations only referred to seasonal first-year landfast ice. The ECMWF daily T2M shown in Figure 10a was used as atmospheric forcing ( T o ). From 1976–2018, the monthly T2M in the landfast ice grid cells increased by 112.2 ± 76.2 × 10⁻³ K/yr, slightly larger than the trend in the sea ice grid cells in the entire Arctic (99.8 ± 73.4 × 10⁻³ K/yr). The calculated ice thickness, ranging from 1.3–1.8 m increased from Oct 1 and reached a maximum in April, which was consistent with the study results in the Kara Sea [50]. Here we compared mean ice thickness in April. From 1976 to 2018, mean ice thickness calculated by Stefan’s law decreased by −0.75 cm/yr using T2M as forcing (Figure 10b, black line with stars), A similar trend can be obtained from NSIDC CS2 products during 2011–2018 (−0.87 cm/a). However, the mean ice thickness was systematically underestimated by 0.2 m probably due to the warm bias of T2M over sea ice in the Arctic [36]. A new calculation was made using an offset of 3 °C on T2M as forcing. The results (red line with stars in Figure 10b) are in good agreement with NSIDC CS2 products. The Stefan’s law calculation captured the magnitude and trend of the landfast ice thickness evolution.

4. Discussion

4.1. Uncertainty in the Landfast Ice Extent

The landfast ice datasets used in this paper were originally derived from Arctic sea ice charts, which may include uncertainties from at least three factors: the mixture of different data sources, human error from each skilled analyst and the transformation of charts to gridded binary files [51,52,53]. Yu et al. [25] compared the landfast ice extent from the first datasets with SAR imagery along the Beaufort Sea coast and concluded that the entire mean bias of the chart-derived landfast ice edge was 6.5 ± 13.6 km, and the extent uncertainty ranged from 5% to 25%. We try to evaluate the uncertainty by comparing the chart-derived landfast ice extent with that from MODIS imagery (Figure 11). The comparison in the different subregions showed that the gridded data captured the landfast ice coverage very well. The mean bias of the landfast ice boundary between the gridded data and MODIS imagery was 5.3 ± 3.6 km, and the uncertainty in the extent was 2–13%. Both comparisons mentioned above for the SAR and MODIS images suggested that the mean bias of chart-derived landfast ice extent was within one grid size of 25 km. Considering the uncertainty in the datasets, the landfast ice extent was averaged over space and time in this paper to analyze the large-scale patterns and the long-term trend to minimize the effect of the uncertainty.

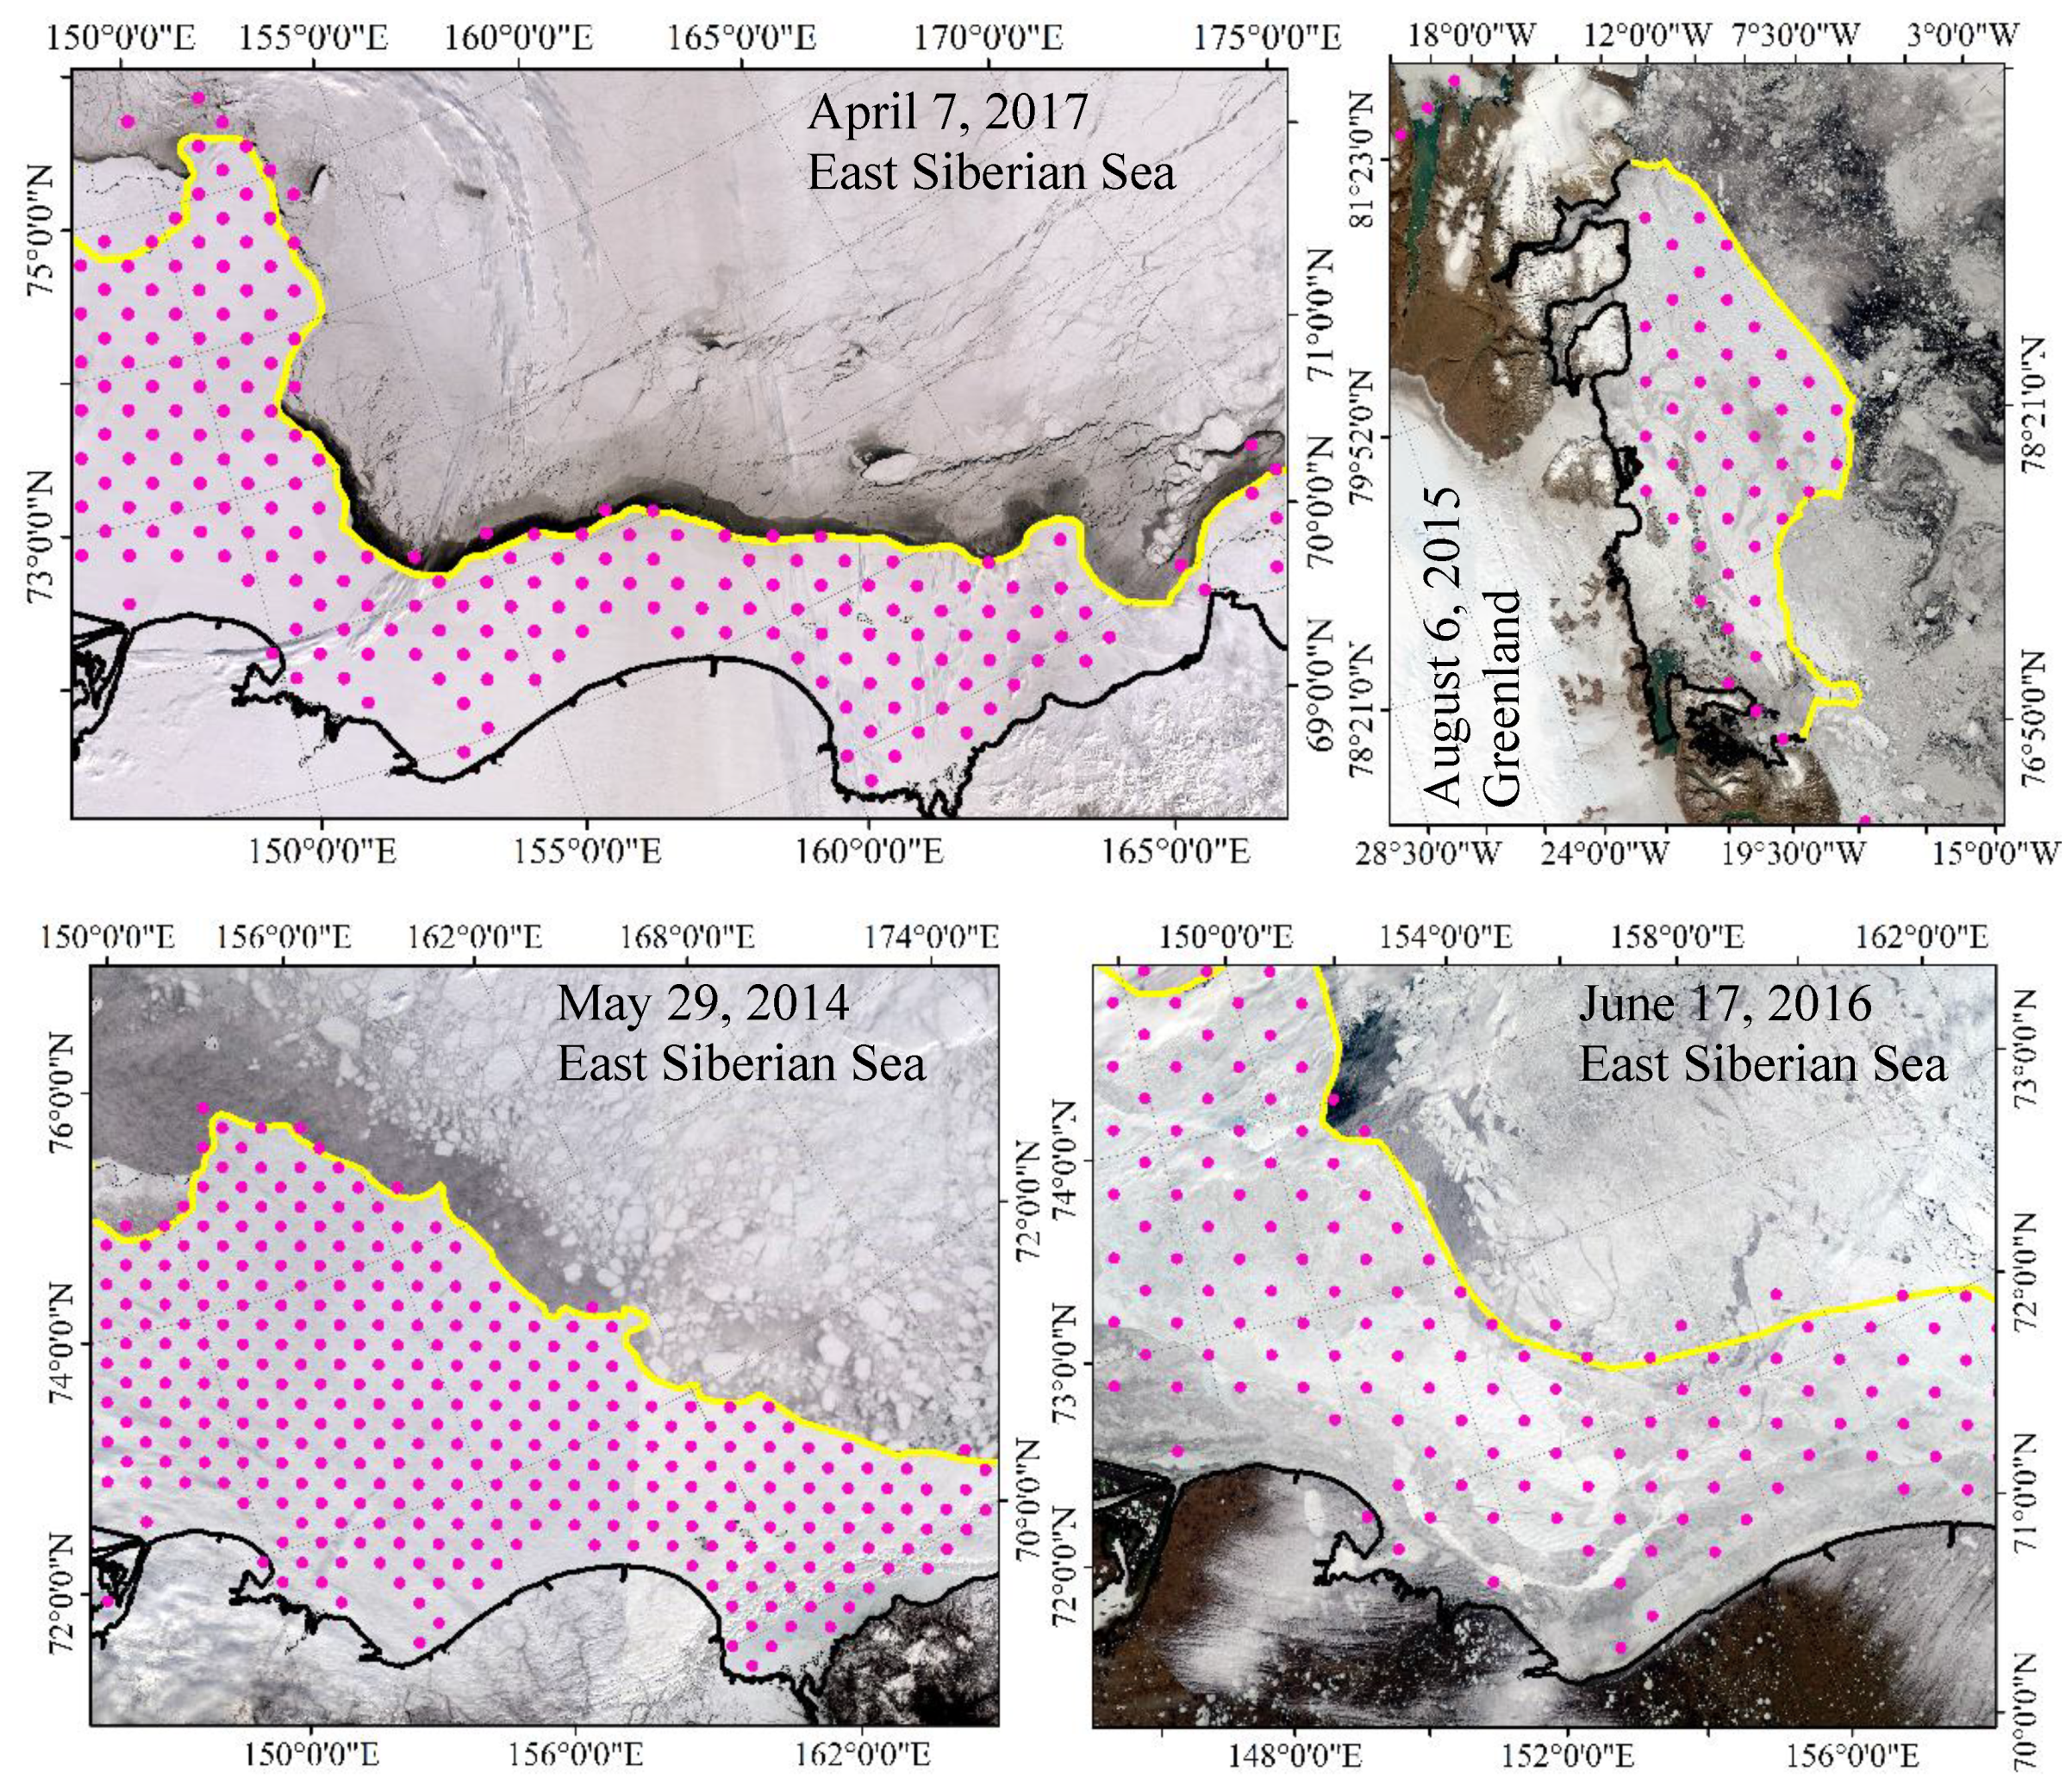
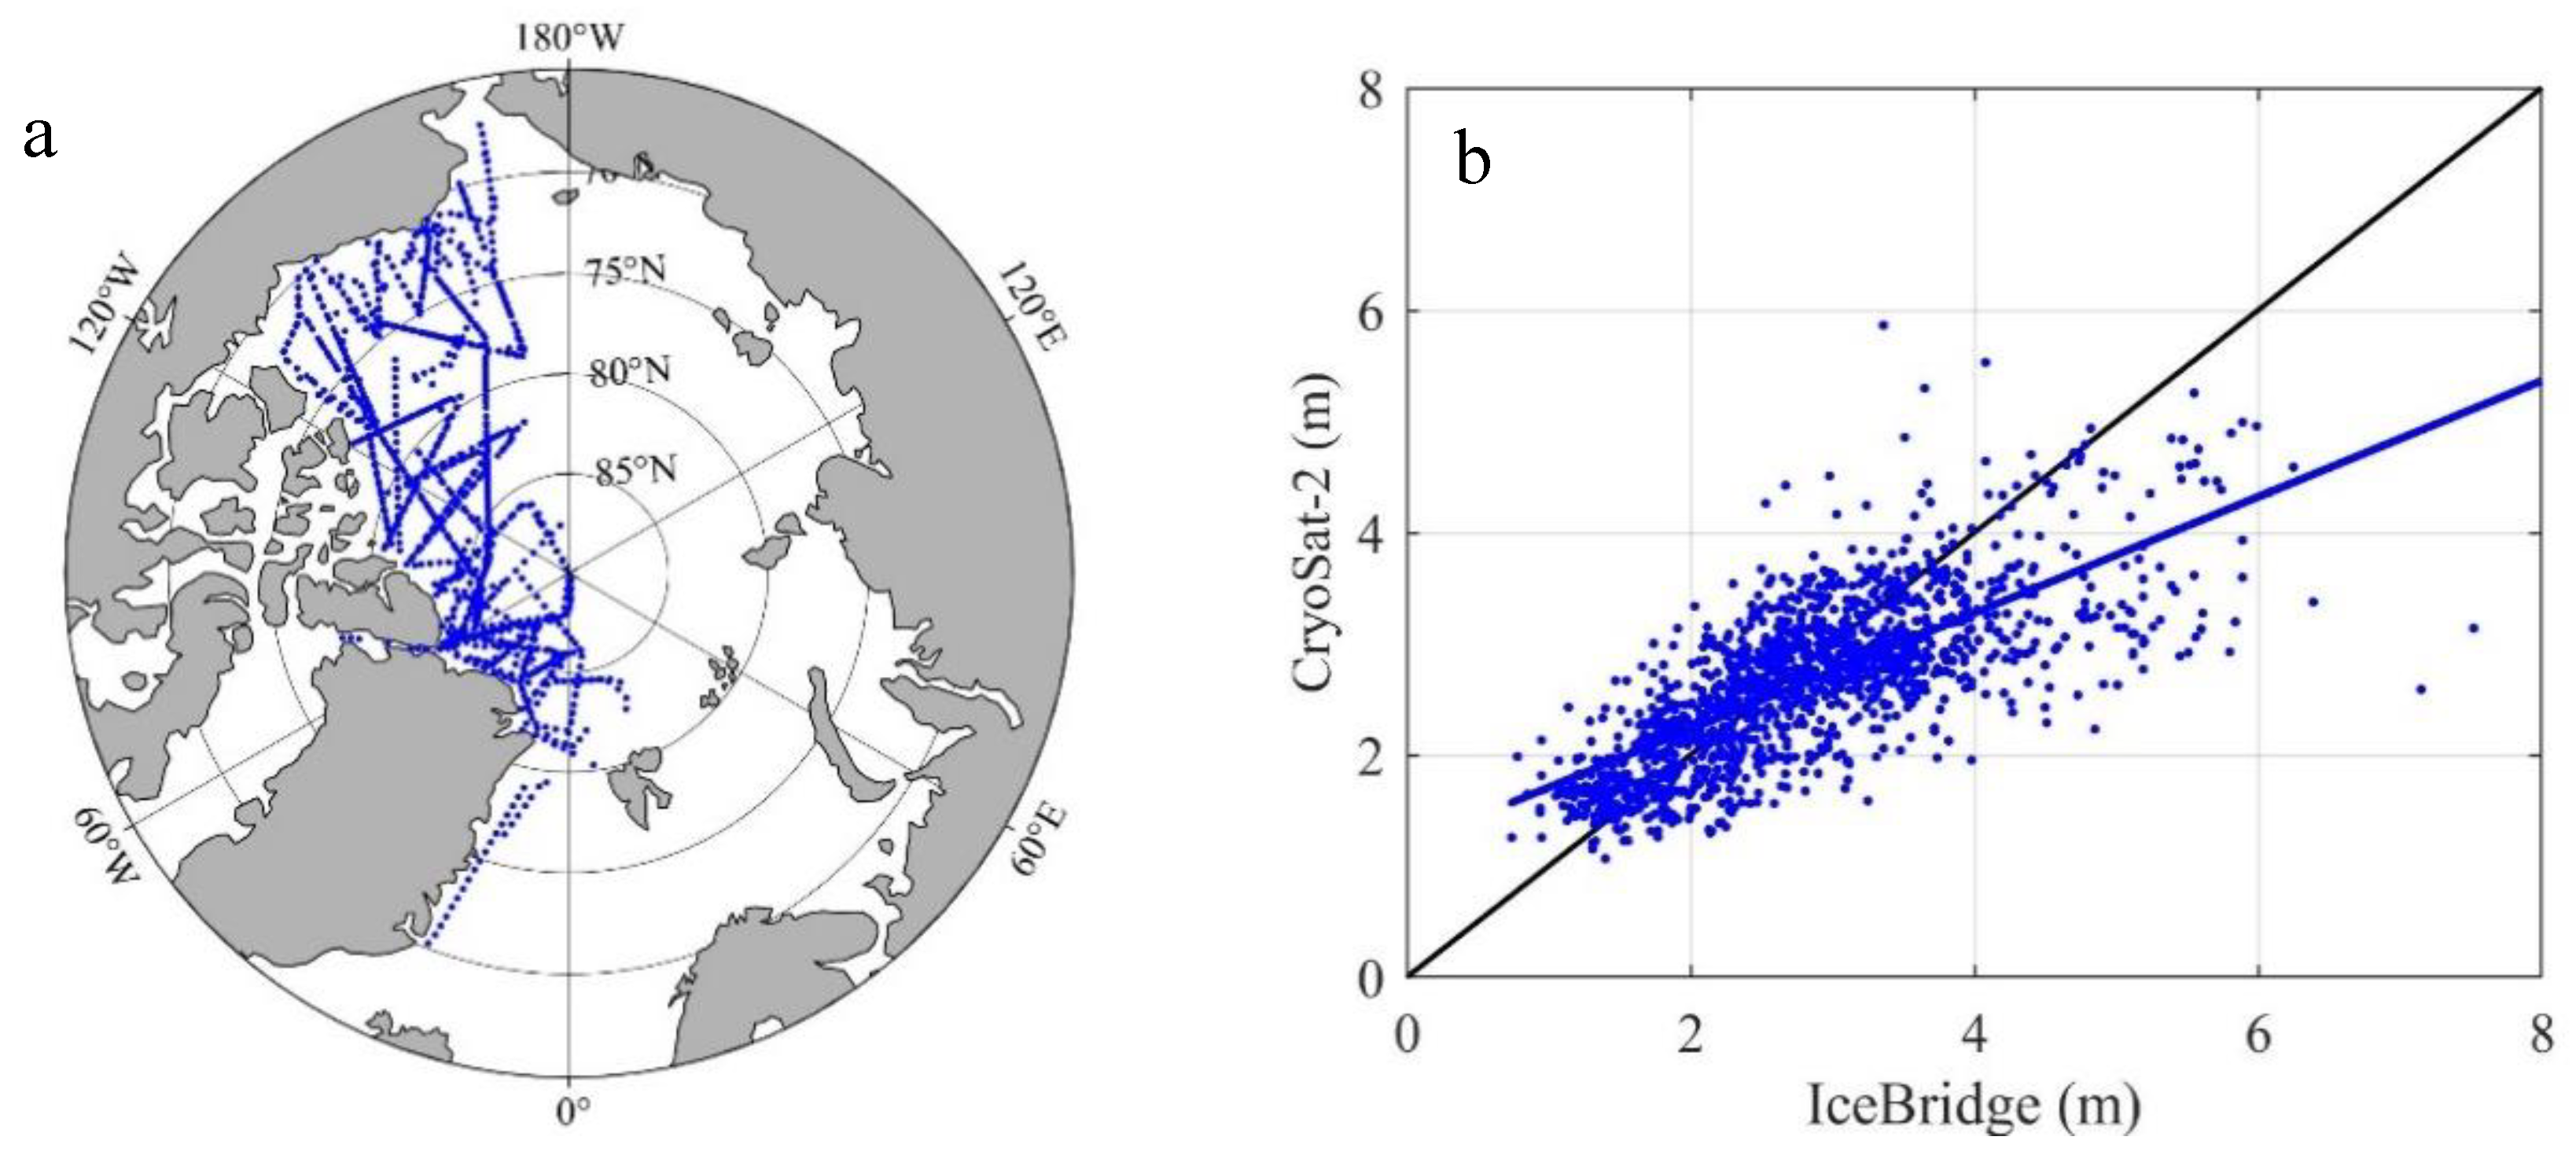
4.2. Uncertainty in the Landfast Ice Thickness

The CryoSat-2 sea ice thickness product had ever been assessed. In [54], the performance of the CryoSat-2 sea ice thickness product was assessed using sea ice thicknesses derived from multiple sources. Another independent comparison of the CryoSat-2 sea ice thickness product with BGEP ULS moorings showed a higher correlation (R = 0.886) and a similar mean difference in the ice draft (−8.2 ± 23.7 cm) [1].
An independent assessment was carried out in this study. A longer time series dataset from NOAA’s Operation IceBridge from the Unified Sea Ice Thickness Climate Data Record of NSIDC was used as the baseline data [55]. In total, 1523 pairs of IceBridge data over March and April from 2011 to 2015 was available, as shown in Figure 12a. The corresponding sea ice thickness from CryoSat-2 was retrieved from the nearest grid cell to the IceBridge footprint. The mean bias was 0.16 ± 0.69 m, and the correlation coefficient was 0.73. For ice thinner than 2 m, which is the typical maximum thickness for landfast ice, the mean bias was 0.10 ± 0.48 m. The comparison in this study indicated that the CryoSat-2 data agreed well with IceBridge data, especially for the typical thickness of landfast ice (Figure 12b).

4.3. Relationship of Extent and Thickness Trends

Landfast ice extent in all the subregions, expect for Bering Sea, showed a decrease trend (Figure 5). The increase trend of landfast ice extent in the Bering Sea during 1976–2018 in this study was half of that during 1976–2007 in Yu et al. [25], suggesting a significant decrease trend in the last decade (Figure 5 and Figure 9). Combined with the fact that the mean landfast ice thickness in the Bering Sea showed an obvious decrease trend during 2011–2018, we concluded that landfast ice there suffered a drastic change in the last ten years. The positive trend of landfast ice extent during 2011–2018 for three of the nine subregions shown in Figure 9 indicated that landfast ice changes had large regional and interannual variations.
The trend of landfast ice thickness showed obvious regional differences (Figure 8), where a decrease trend dominated the Northeast Passage, while an increase trend dominated the coast of Northwest Passage (coast of Northern Canada Archipelago and Beaufort Sea). In the Northeast Passage, ice melted or broke up in the summer and refroze from October to be the first-year ice and the maximum ice thickness was tightly related to freezing degree days, which was significantly affected by surface air temperature. The surface air temperature increased, leading to the freezing degree days decreased, and then the first-year ice thickness decreased.

5. Conclusions

In this paper, the landfast ice extent in the Arctic during 1976–2018 was analyzed as a continuation of the study (1976–2007) by Yu et al. [25]; in particular, the landfast ice thickness from 2011–2018 was retrieved from ESA CryoSat-2 satellite products to systematically evaluate changes under the background of global warming. The results show that Arctic landfast ice mainly exists in January–June and is mainly present in the Canadian Archipelago, East Siberian Sea, East Siberian Islands, Severnaya Zemlya, and Laptev Sea. The annual mean extent of landfast ice in the Arctic is 1.1 ± 0.7 × 10⁶ km2. The maximum extent usually occurs in late April (1.8 × 10⁶ km2), and landfast ice almost disappears in the summer. The Arctic landfast ice extent has significantly decreased at a rate of −1.1 ± 0.5 × 10⁴ km2/yr (significance level of 99%). The mean maximum extent in the 1976–1985 interval was 2.1 × 10⁶ km2, and it decreased to 1.66 × 10⁶ km2 in the 2006–2018 interval.
Of the 17 subregions, the landfast ice extent in the Canadian Archipelago is the largest, accounting for approximately 30% of entire Arctic landfast ice. Landfast ice extent decreases in 16 of 17 subregions, except for the Bering Sea, similar to the results of Yu et al. [25]. The rate of decrease in the East Siberian Sea is the largest (−20.3 ± 9.4 × 10² km2/yr). The annual mean extent in the Northeast Passage is 4.3 × 10⁵ km2, similar to that in the Northwest Passage (4.8 × 10⁵ km2). However, the rate of decrease in the Northeast Passage is -4.8 × 10³ km2/yr, 60% larger than that in the Northwest Passage (−3.0 × 10³ km2/yr), which indicates a more promising future for summer navigation in the Northeast Passage. The decreasing trend in this paper was twice the trend observed during 1976–2007 of by Yu et al. [25] in the Kara Sea and Baffin Bay and was half the trend observed during 1976–2007 of by Yu et al. [25] in the Canadian Archipelago and the northern Canadian Archipelago, which indicates that the decrease experienced an intense change from 2008–2018. Two of the 17 subregions (the Barents Sea and Okhotsk Sea) experienced a trend shift from increasing to decreasing, suggesting a significant reduction in the last ten years.
The duration of landfast ice in the Arctic exhibits clear spatial variations. The duration of landfast ice decreased in 14 of the 17 subregions, except for the Barents Sea, Baltic Sea, and Bering Sea. The reduction in the landfast ice duration was the greatest in Svalbard, reaching a rate of −0.26 ± 0.19 weeks/yr. In some marginal waters, e.g., the Barents Sea, Baltic Sea, and Bering Sea, the duration of landfast ice increased, with the highest rate of increase in the Baltic Sea at 0.17 ± 0.12 weeks/yr. The duration of landfast ice in the entire Arctic decreased at a rate of −0.06 ± 0.03 weeks/yr. A new algorithm based on high resolution satellite data will provide us with more accurate knowledge on landfast ice extent and duration in the future [56].
The largest landfast ice thickness appeared in the northern Canadian Archipelago, reaching 2.5 m, and had the largest increasing trend, up to 10 cm/yr, which may be attributed to the transport and accumulation of multiyear ice in this region. The mean landfast ice thickness in the Northeast Passage is 1.57 m with a clear spatial variation: the mean thickness is thicker in the Laptev Sea and East Siberian Sea (1.60 m) and thinner in the Kara Sea (1.47 m). A slight decrease trend of −1.2 cm/yr was apparent in the Northeast Passage and is approximately four times smaller than that in the entire Arctic sea ice (−5.1 cm/yr).
Considering the motionlessness of landfast ice, thermodynamic processes dominate its growth, and the melt and air temperature are some of the main external forces in the upper boundary of landfast ice. A long-term trend of the landfast ice thickness from 1976 to 2018 was calculated by Stefan’s law with the ECMWF T2M as external forcing. The calculated trend of −0.75 cm/yr was consistent with the observed trend obtained from the CryoSat-2 dataset and suggested an averaged 25% loss of landfast ice thickness during 1976–2018.
Compared to the entire sea ice in the Arctic, the decreasing trend of monthly extent for coastal landfast ice was five times smaller, but the relative change was double. Therefore, a landfast ice zone suffered a larger area loss in the past 40 years and the landfast ice free summer will become more regular, while landfast ice suffered little thickness reduction based on this study and occupied the main coastal seas, islands, and straits, making the observation of landfast ice increasingly important for passage navigation in the future.

Author Contributions

Z.L. and J.Z. conceived and designed the experiments, processed the data, and wrote the manuscript; J.S., C.L., and Q.Y. discussed the results; F.H. and B.C. investigated the results and revised the manuscript; L.S. processed and analyzed the data; J.Z. and B.C. investigated the results, revised the manuscript, and supervised this study. All authors have read and agreed to the published version of the manuscript.

Funding

This study is financially supported by the National Key Research and Development Program of China (2018YFA0605901; 2018YFC1407206; 2017YFE0111700), the Academy of Finland (Grant No. 317999), the National Natural Science Foundation of China (41976214, 41922044), the Fundamental Research Funds for the Central Universities (Grant No. 19lgzd07), and the Key Research Program of Frontier Sciences of CAS (QYZDY-SSW-DQC021).

Acknowledgments

We greatly thank the U.S. National Ice Center (NIC) for providing the weekly/biweekly gridded Arctic sea ice product (https://nsidc.org/data/G02172) and the weekly/biweekly Arctic sea ice charts (https://www.natice.noaa.gov/products/weekly_products.html), and the National Snow and Ice Data Center (NSIDC) for providing CryoSat-2 sea ice thickness dataset (https://nsidc.org/data/RDEFT4/) and European Center for Medium-Range Weather Forecast (ECMWF) for providing air temperature reanalysis (https://www.ecmwf.int/en/forecasts/datasets/reanalysis-datasets/era-interim). We are grateful to two anonymous reviewers for their construction comments that helped to improve the manuscript significantly.

Conflicts of Interest

The authors declare no conflict of interest.

References

  1. Laxon, S.W.; Giles, K.A.; Ridout, A.L.; Wingham, D.J.; Willatt, R.; Cullen, R.; Kwok, R.; Schweiger, A.; Zhang, J.L.; Haas, C.; et al. CryoSat-2 estimates of Arctic sea ice thickness and volume. Geophys. Res. Lett. 2013, 40, 732–737. [Google Scholar] [CrossRef] [Green Version]
  2. Zhang, X.; Walsh, J.E. Toward a seasonally ice-covered Arctic Ocean: Scenarios from the IPCC AR4 model simulations. J. Clim. 2006, 19, 1730–1747. [Google Scholar] [CrossRef]
  3. Pachauri, R.K.; Allen, M.R.; Barros, V.R.; Broome, J.; Cramer, W.; Christ, R.; Church, J.A.; Clarke, L.; Dahe, Q.; Dasgupta, P.; et al. Climate Change 2014: Synthesis Report. Contribution of Working Groups I, II and III to the fifth Assessment Report of the Intergovernmental Panel on Climate Change; Pachaurl, R., Meyer, L., Eds.; IPCC: Geneva, Switzerland, 2014; p. 151. ISBN 978-92-9169-143-2. [Google Scholar]
  4. Serreze, M.C.; Barrett, A.P.; Stroeve, J.C.; Kindig, D.N.; Holland, M.M. The emergence of surface-based Arctic amplification. Cryosphere 2009, 3, 11–19. [Google Scholar] [CrossRef] [Green Version]
  5. Cohen, J.; Screen, J.A.; Furtado, J.C.; Barlow, M.; Whittleston, D.; Coumou, D.; Francis, J.; Dethloff, K.; Entakhabi, D.; Overland, J.; et al. Recent Arctic amplification and extreme mid-latitude weather. Nat. Geosci. 2014, 7, 627. [Google Scholar] [CrossRef] [Green Version]
  6. Screen, J.A.; Simmonds, I. The central role of diminishing sea ice in recent Arctic temperature amplification. Nature 2010, 464, 1334. [Google Scholar] [CrossRef] [PubMed] [Green Version]
  7. Perovich, D.K.; Grenfell, T.C.; Richter-Menge, J.A.; Light, B.; Tucker, W.B.; Eicken, H. Thin and thinner: Sea ice mass balance measurements during SHEBA. J. Geophys. Res. Ocean. 2003, 108, 8050. [Google Scholar] [CrossRef]
  8. Lei, R.; Xie, H.; Wang, J.; Leppäranta, M.; Jónsdóttir, I.; Zhang, Z. Changes in sea ice conditions along the Arctic Northeast Passage from 1979 to 2012. Cold Reg. Sci. Technol. 2015, 119, 132–144. [Google Scholar] [CrossRef]
  9. Maslanik, J.; Stroeve, J.; Fowler, C.; Emery, W. Distribution and trends in Arctic sea ice age through spring 2011. Geophys. Res. Lett. 2011, 38, L13502. [Google Scholar] [CrossRef]
  10. Cavalieri, D.J.; Parkinson, C.L. Arctic sea ice variability and trends, 1979–2010. Cryosphere 2012, 6, 881. [Google Scholar] [CrossRef] [Green Version]
  11. Polyakov, I.V.; Walsh, J.E.; Kwok, R. Recent changes of Arctic multiyear sea ice coverage and the likely causes. Bull. Am. Meteorol. Soc. 2012, 93, 145–151. [Google Scholar] [CrossRef]
  12. Mahoney, A.R.; Barry, R.G.; Smolyanitsky, V.; Fetterer, F. Observed sea ice extent in the Russian Arctic, 1933–2006. J. Geophys. Res. Ocean. 2008, 113, C11005. [Google Scholar] [CrossRef] [Green Version]
  13. Xia, W.; Xie, H.; Ke, C. Assessing trend and variation of Arctic sea-ice extent during 1979–2012 from a latitude perspective of ice edge. Polar Res. 2014, 33, 21249. [Google Scholar] [CrossRef] [Green Version]
  14. Aksenov, Y.; Popova, E.E.; Yool, A.; Nurser, A.J.G.; Williams, T.D.; Bertino, L.; Bergh, J. On the future navigability of Arctic sea routes: High-resolution projections of the Arctic Ocean and sea ice. Mar. Policy 2017, 75, 300–317. [Google Scholar] [CrossRef] [Green Version]
  15. Overland, J.E.; Wood, K.R.; Wang, M. Warm Arctic-cold continents: Climate impacts of the newly open arctic sea. Polar Res. 2011, 30 (Suppl. 1), 1–14. [Google Scholar] [CrossRef]
  16. Howell, S.E.; Laliberté, F.; Kwok, R.; Derksen, C.; King, J. Landland-fast ice thickness in the Canadian Arctic Archipelago from observations and models. Cryosphere 2016, 10, 1463–1475. [Google Scholar] [CrossRef] [Green Version]
  17. Reimnitz, E.; Toimil, L.; Barnes, P. Arctic continental shelf morphology related to sea-ice zonation, Beaufort Sea, Alaska. Mar. Geol. 1978, 28, 179–210. [Google Scholar] [CrossRef]
  18. Brown, R.D.; Cote, P. Interannual variability of landland-fast ice thickness in the Canadian High Arctic, 1950–1989. Arctic 1992, 45, 273–284. [Google Scholar]
  19. Barry, R.G.; Moritz, R.E.; Rogers, J.C. The land-fast ice regimes of the Beaufort and Chukchi Sea coasts, Alaska. Cold Reg. Sci. Technol. 1979, 1, 129–152. [Google Scholar] [CrossRef]
  20. Melling, H. Sea ice of the northern Canadian Arctic Archipelago. J. Geophys. Res. Ocean. 2002, 107, 3181. [Google Scholar] [CrossRef]
  21. Divine, D.; Korsnes, R.; Makshtas, A. Variability and climate sensitivity of land-fast ice extent in the north-eastern Kara Sea. Polar Res. 2003, 22, 27–34. [Google Scholar] [CrossRef] [Green Version]
  22. Galley, R.J.; Else, B.G.; Howell, S.E.; Lkovich, J.V.; Barber, D.J. Landfast sea ice conditions in the Canadian Arctic: 1983–2009. Arctic 2012, 65, 133–144. [Google Scholar] [CrossRef] [Green Version]
  23. Mahoney, A.R.; Eicken, H.; Gaylord, A.G.; Gens, R. Landfast sea ice extent in the Chukchi and Beaufort Seas: The annual cycle and decadal variability. Cold Reg. Sci. Technol. 2014, 103, 41–56. [Google Scholar] [CrossRef]
  24. Selyuzhenok, V.; Krumpen, T.; Mahoney, A.; Janout, M.; Gerdes, R. Seasonal and interannual variability of fast ice extent in the southeastern Laptev Sea between 1999 and 2013. J. Geophys. Res. Ocean. 2015, 120, 7791–7806. [Google Scholar] [CrossRef] [Green Version]
  25. Yu, Y.; Stern, H.; Fowler, C.; Fetterer, F. Interannual variability of Arctic landland-fast ice between 1976 and 2007. J. Clim. 2014, 27, 227–243. [Google Scholar] [CrossRef]
  26. Dammann, D.; Eriksson, L.; Mahoney, A.; Stevens, C.; van der Sanden, J.; Eicken, H.; Meyer, F.; Tweedie, C. Mapping Arctic bottomfast sea ice using SAR interferometry. Remote Sens. 2018, 10, 720. [Google Scholar] [CrossRef] [Green Version]
  27. Dammann, D.O.; Eriksson, L.E.; Mahoney, A.R.; Eicken, H.; Meyer, F.J. Mapping pan-Arctic landfast sea ice stability using Sentinel-1 interferometry. Cryosphere 2019, 13, 557–577. [Google Scholar] [CrossRef] [Green Version]
  28. National Ice Center. National Ice Center Arctic Sea Ice Charts and Climatologies in Gridded Format, Version 1; Fetterer, F., Fowler, C., Eds.; NSIDC, National Snow and Ice Data Center: Boulder, CO, USA, 2006; updated 2009; Available online: https://nsidc.org/data/G02172 (accessed on 16 May 2019).
  29. US National Ice Center Weekly/Bi-Weekly Ice Analysis Products. Available online: https://www.natice.noaa.gov/products/weekly_products.html (accessed on 16 May 2019).
  30. Li, Z.X.; Zhao, J.C. Study on the method of extracting arctic landfast ice distribution based on sea ice analysis charts. J. Glaciol. Geocryol. 2019, in press. [Google Scholar]
  31. Kurtz, N.; Harbeck, J. CryoSat-2 Level-4 Sea Ice Elevation, Freeboard, and Thickness, Version 1. Available online: https://nsidc.org/data/RDEFT4/ (accessed on 16 May 2019).
  32. Kurtz, N.T.; Galin, N.; Studinger, M. An improved CryoSat-2 sea ice freeboard retrieval algorithm through the use of waveform fitting. Cryosphere 2014, 8, 1217–1237. [Google Scholar] [CrossRef] [Green Version]
  33. Cheng, B.; Zhang, Z.; Vihma, T.; Johansson, M.; Bian, L.; Li, Z.; Wu, H. Model experiments on snow and ice thermodynamics in the Arctic Ocean with CHINARE 2003 data. J. Geophys. Res. Ocean. 2008, 113, C09020. [Google Scholar] [CrossRef] [Green Version]
  34. Jakobson, E.; Vihma, T.; Palo, T.; Jakobson, L.; Keernik, H.; Jaagus, J. Validation of atmospheric reanalyses over the central Arctic Ocean. Geophys. Res. Lett. 2012, 39, L10802. [Google Scholar] [CrossRef] [Green Version]
  35. Merkouriadi, I.; Gallet, J.C.; Graham, R.M.; Liston, G.E.; Polashenski, C.; Rösel, A.; Gerland, S. Winter snow conditions on Arctic sea ice north of Svalbard during the Norwegian young sea ICE (N-ICE2015) expedition. J. Geophys. Res. Atmos. 2017, 122, 10–837. [Google Scholar] [CrossRef]
  36. Wang, C.; Graham, R.M.; Wang, K.; Gerland, S.; Granskog, M.A. Comparison of ERA5 and ERA-Interim near-surface air temperature, snowfall and precipitation over Arctic sea ice: Effects on sea ice thermodynamics and evolution. Cryosphere 2019, 13, 1661–1679. [Google Scholar] [CrossRef] [Green Version]
  37. Timmermans, M.L.; Toole, J.; Krishfield, R. Warming of the interior Arctic Ocean linked to sea ice losses at the basin margins. Sci. Adv. 2018, 4, eaat6773. [Google Scholar] [CrossRef] [PubMed] [Green Version]
  38. Smith, D.M. Recent increase in the length of the melt season of perennial Arctic sea ice. Geophys. Res. Lett. 1998, 25, 655–658. [Google Scholar] [CrossRef]
  39. Markus, T.; Stroeve, J.C.; Miller, J. Recent changes in Arctic sea ice melt onset, freezeup, and melt season length. J. Geophys. Res. Ocean. 2009, 114, C12024. [Google Scholar] [CrossRef]
  40. Yang, Y.; Lepparanta, M.; Li, Z.; Cheng, B.; Zhai, M.; Demchev, D. Advances in Polar Science Model simulations of the annual cycle of the landfast ice thickness in the East Siberian Sea. Adv. Polar Sci. 2015, 26, 168–178. [Google Scholar]
  41. Yang, Y.; Leppäranta, M.; Cheng, B.; Li, Z. Numerical modelling of snow and ice thicknesses in Lake Vanajavesi, Finland. Tellus Dyn. Meteorol. Oceanogr. 2012, 64, 17202. [Google Scholar] [CrossRef] [Green Version]
  42. Zhai, M. Study on Polar Coastal Sea Ice Evolution and Fragmentation Mechanisms by Integrated Remote Sensing and Numerical Modeling. Ph.D. Thesis, Beijing Normal University, Beijing, China, May 2019. [Google Scholar]
  43. Yang, Y.; Li, Z.; Leppäranta, M.; Cheng, B.; Shi, L.; Lei, R. Modelling the thickness of land-fast sea ice in Prydz Bay, East Antarctica. Antarct. Sci. 2015, 28, 59–70. [Google Scholar] [CrossRef]
  44. Singh, R.K.; Maheshwari, M.; Oza, S.R.; Kumar, R. Long-term variability in arctic sea surface temperatures. Polar Sci. 2013, 7, 233–240. [Google Scholar] [CrossRef] [Green Version]
  45. Stefan, J. Über die Theorie der Eisbildung, insbesondere über die Eisbildung im Polarmeere. Ann. Phys. 1891, 278, 269–286. [Google Scholar] [CrossRef] [Green Version]
  46. Lei, R.; Li, Z.; Cheng, B.; Zhang, Z.; Heil, P. Annual cycle of land-fast sea ice in Prydz Bay, East Antarctica. J. Geophys. Res. 2010, 115, C02006. [Google Scholar] [CrossRef] [Green Version]
  47. Cheng, B.; Vihma, T.; Pirazzini, R.; Granskog, M.A. Modeling of superimposed ice formation during spring snowmelt period in the Baltic Sea. Ann. Glaciol. 2006, 44, 139–146. [Google Scholar] [CrossRef] [Green Version]
  48. Wang, C.; Cheng, B.; Wang, K.; Gerland, S.; Pavlova, O. Modelling snow ice and superimposed ice on landfast sea ice in Kongsfjorden, Svalbard. Polar Res. 2015, 34, 20828. [Google Scholar] [CrossRef] [Green Version]
  49. Yen, Y.C. Review of Thermal Properties of Snow, Ice and Sea Ice; No. CRREL-81-10; Cold Regions Research and Engineering Lab: Hanover, NH, USA, 1981. [Google Scholar]
  50. Cheng, B.; Makynen, M.; Simila, M.; Rontu, L.; Vihma, T. Modelling snow and ice thickness in the coastal Kara Sea, Russian Arctic. Ann. Glaciol. 2013, 54, 105–113. [Google Scholar] [CrossRef] [Green Version]
  51. Partington, K.; Flynn, T.; Lamb, D.; Bertoia, C.; Dedrick, K. Late twentieth century Northern Hemisphere sea-ice record from US National Ice Center ice charts. J. Geophys. Res. Ocean. 2003, 108, 3343. [Google Scholar] [CrossRef]
  52. Dedrick, K.R.; Partington, K.; Van Woert, M.; Bertoia, C.A.; Benner, D. US National/Naval Ice Center digital sea ice data and climatology. Can. J. Remote Sens. 2001, 27, 457–475. [Google Scholar] [CrossRef]
  53. Mahoney, A.; Eicken, H.; Gaylord, A.G.; Shapiro, L. Alaska landfast sea ice: Links with bathymetry and atmospheric circulation. J. Geophys. Res. Ocean. 2007, 112, C02001. [Google Scholar] [CrossRef] [Green Version]
  54. Tilling, R.L.; Ridout, A.; Shepherd, A. Estimating Arctic sea ice thickness and volume using CryoSat-2 radar altimeter data. Adv. Space Res. 2018, 62, 1203–1225. [Google Scholar] [CrossRef]
  55. Schweiger, A.J. Unified Sea Ice Thickness Climate Data Record. Available online: http://psc.apl.uw.edu/sea_ice_cdr/ (accessed on 16 May 2019).
  56. Karvonen, J. Estimation of Arctic land-fast ice cover based on dual-polarized Sentinel-1 SAR imagery. Cryosphere 2018, 12, 2595–2607. [Google Scholar] [CrossRef] [Green Version]
Figure 1. Map showing the locations mentioned in this paper. The criteria for the 17 subregions is from Yu et al. [25].
Remotesensing 12 00064 g001
Figure 2. The interannual variation of the landfast ice extent during the entire time series 1976–2018 (a) and the new extended time series 2008–2018 (b) for the entire Arctic.
Remotesensing 12 00064 g002
Figure 3. Monthly landfast ice occurrence from January to December. The different colors represent the percentage of the number of yearly landfast ice existing during the 43-year time series from 1976–2018.
Remotesensing 12 00064 g003
Figure 4. Comparison of long-term trends in the Arctic sea ice extent and landfast ice extent.
Remotesensing 12 00064 g004
Figure 5. Long-term trend of landfast ice extent in the 17 subregions (ae), Northeast Passage and Northwest Passage (f) during 1976–2018.
Remotesensing 12 00064 g005
Figure 6. The duration of Arctic landfast ice during 1976–2018.
Remotesensing 12 00064 g006
Figure 7. The decadal changes of the landfast ice duration in the 17 subregions.
Remotesensing 12 00064 g007
Figure 8. (a) multiyear mean landfast ice thickness (m) for January–April from 2011 to 2018 and (b) its trend (m/yr). These data are derived from the NSIDC CryoSat-2 products. The edge of landfast ice was defined by the corresponding 10% of occurrence in Figure 3.
Remotesensing 12 00064 g008
Figure 9. The January–April mean landfast ice thickness for the nine subregions (black triangles) and its linear trend (black dashed line) during 2011–2018. The red stars and dashed line represented the annual mean landfast ice extent and its linear trend for the corresponding period.
Remotesensing 12 00064 g009
Figure 10. (a) T2M averaged in the landfast ice grid cells and the (b) mean April landfast ice thickness calculated by Stefan’s law with T2M (black stars), by Stefan’s law with corrected T2M (cT2M) (red stars) and obtained from the NSIDC CS2 product (blue circles). The lines represent the linear trends.
Remotesensing 12 00064 g010
Figure 11. Comparison of the landfast ice extent between the gridded data (pink points) and the MODIS images, which were modified from [30]. The yellow lines represent the boundary of landfast ice detected from the MODIS images.
Remotesensing 12 00064 g011
Figure 12. The distribution of the IceBridge data over March and April from 2011 to 2015 (a) and the comparison between the IceBridge and satellite data (b).
Remotesensing 12 00064 g012
Table 1. Monthly landfast ice extent for the period from 1976 to 2018. The F-test is used to determine the significance of the trend independent of the statistical data, and bold numbers indicate that the trends are significant at the 0.01 level.
MonthMean (103 km2)Trend (103 km2/yr)% Decade−1
Jan1386 ± 228.04−11.98 ± 4.318.64 ± 3.11
Feb1650 ± 245.49−13.79 ± 4.378.36 ± 2.65
Mar1794 ± 218.70−11.42 ± 4.156.37 ± 2.31
Apr1833 ± 202.55−12.05 ± 3.386.57 ± 1.84
May1758 ± 189.59−10.79 ± 3.336.14 ± 1.89
Jun1495 ± 183.79−10 ± 3.376.69 ± 2.25
Jul708 ± 261.44−9.56 ± 5.8413.50 ± 8.25
Aug143.37 ± 118.64−3.39 ± 2.78−23.65 ± 19.39
Sep52.31 ± 46.53−1.07 ± 1.12−20.45 ± 21.41
Oct161.30 ± 80.44−3.87 ± 1.6123.99 ± 9.98
Nov579.62 ± 212.12−13.87 ± 3.323.93 ± 5.69
Dec1020 ± 271.07−17.92 ± 4.1317.57 ± 4.05
Table 2. Annual trend (103 km2/yr) of the landfast ice extent in the 17 subregions. The F-test is used to estimate the significance of the trend independent of the statistical data, and bold numbers indicate that the trends are significant at the 0.01 level. Note that the trend reported by Yu et al. [25] was based on the time series from 1976 to 2007, while the trend in our study was based on the time series from 1976 to 2018. The subregions highlighted in gray represent trends with obvious changes.
No.SubregionJan–May Trend
in Yu et al. [25]
Jan–May Trend
in This Study
Jan–Dec Trend
in This Study
1Svalbard−0.28 ± 0.09−0.26 ± 0.11−0.18 ± 0.05
2Franz Josef Land−0.19 ± 0.10−0.25 ± 0.11−0.27 ± 0.07
3Barents Sea0.24 ± 0.100.04 ± 0.12−0.04 ± 0.06
4Kara Sea0.91 ± 0.491.91 ± 0.68−1.46 ± 0.55
5Laptev Sea−1.88 ± 0.31−1.95 ± 0.39−1.70 ± 0.64
6East Siberian Sea−2.36 ± 0.87−2.02 ± 0.46−2.03 ± 0.94
7Chukchi Sea−0.60 ± 0.11−0.53 ± 0.14−0.37 ± 0.09
8Beaufort Sea−0.39 ± 0.16−0.35 ± 0.20−0.27 ± 0.16
9Canadian Archipelago2.12 ± 1.140.96 ± 1.41−1.82 ± 1.48
10Northern Canadian Archipelago2.48 ± 0.591.32 ± 0.73−1.07 ± 0.29
11Baffin Bay0.35 ± 0.330.77 ± 0.41−0.53 ± 0.23
12Greenland Sea−0.04 ± 0.370.06 ± 0.44−0.09 ± 0.20
13Hudson Bay−1.34 ± 0.53−1.25 ± 0.65−0.67 ± 0.42
14Labrador Sea−0.17 ± 0.17−0.26 ± 0.24−0.17 ± 0.13
15Baltic Sea−0.25 ± 0.21−0.25 ± 0.30−0.12 ± 0.10
16Sea of Okhotsk0.11 ± 0.060.10 ± 0.07−0.06 ± 0.04
17Bering Sea0.22 ± 0.120.10 ± 0.150.03 ± 0.07
Arctic−12.27 ± 2.71−12.01 ± 3.47−10.67 ± 4.78
Table 3. Landfast ice duration in 17 regions and the entire Arctic during 1976–2018. The F-test is used to determine the significance of the trend independent of the statistical data, and bold numbers indicate that the trends are significant at the 0.01 level.
No.RegionMean (week)Trend(Weeks/Decade) (%Decade−1)F
1Svalbard34.1−2.6 ± 1.9 (−7.7 ± 5.7)7.4
2Franz Josef Land41.4−0.8 ± 1.6 (−2.0 ± 3.9)1.1
3Barents Sea37.21.5 ± 1.2 (3.9 ± 3.1)6.4
4Kara Sea43.1−0.2 ± 0.5 (−0.5 ± 1.1)1.0
5Laptev Sea42.3−1.0 ± 0.4 (−2.3 ± 1.0)22.4
6East Siberian Sea43.1−0.9 ± 0.3 (−2.1 ± 0.7)39.2
7Chukchi Sea42.6−1.2 ± 0.5 (−2.7 ± 1.1)24.3
8Beaufort Sea43.7−0.5 ± 0.5 (−1.2 ± 1.1)5.0
9Canadian Archipelago44.6−0.7 ± 0.4 (−1.5 ± 0.9)12.3
10N. Canadian Archipelago48.4−0.0008 ± 0.4 (−0.002 ± 0.009)1.6 × 10⁻⁵
11Baffin Bay41.2−1.0 ± 0.6 (−2.5 ± 1.4)12.9
12Greenland Sea43.7−0.5 ± 2.8 (−1.1 ± 6.3)0.1
13Hudson Bay38.8−0.2 ± 0.5 (−0.6 ± 1.3)0.9
14Labrador Sea37.7−0.8 ± 0.5 (−2.1 ± 1.2)13.0
15Baltic Sea37.31.7 ± 1.2 (4.7 ± 3.3)8.0
16Sea of Okhotsk39.1−0.1 ± 0.5 (−0.2 ± 1.2)0.2
17Bering Sea39.50.4 ± 0.5 (1.1 ± 1.3)2.9
Arctic44.0−0.6 ± 0.3 (−1.4 ± 0.6)23.0

