Letter

On Extreme Winds at L-Band with the SMAP Synthetic Aperture Radar

Jet Propulsion Laboratory, California Institute of Technology, 4800 Oak Grove Dr., Pasadena, CA 91109, USA
*
Author to whom correspondence should be addressed.
The authors are with the Jet Propulsion Laboratory, California Institute of Technology, Pasadena, CA 91109, USA. Copyright 2019 California Institute of Technology. Government sponsorship acknowledged.
Remote Sens. 2019, 11(9), 1093; https://doi.org/10.3390/rs11091093
Submission received: 11 April 2019 / Revised: 30 April 2019 / Accepted: 5 May 2019 / Published: 8 May 2019
(This article belongs to the Special Issue Tropical Cyclones Remote Sensing and Data Assimilation)

Abstract

:
In this letter, we discuss some observations of the Soil Moisture Active Passive (SMAP) mission’s high-resolution synthetic aperture radar (SAR) for extreme winds and tropical cyclones. We find that the L-band cross-polarized backscatter is far more sensitive to wind speed at extreme winds than the co-polarized backscatter and it is essential to observations of extreme winds with L-band SAR. We introduce a cyclone wind speed retrieval algorithm and apply it to the limited SMAP SAR dataset of cyclones. We show that the SMAP SAR instrument is capable of measuring extreme winds up to the category 5 (70 m/s) wind speed regime providing unique capabilities as compared to traditional scatterometers with C and Ku-band radars.

Graphical Abstract

1. Introduction

Soil Moisture Active Passive (SMAP) is a mission designed to observe the soil moisture over land using a combined active/passive L-band system [1]. SMAP has three types of radar observations: a full-aperture measurement with approximately 36 km resolution, a range-sliced measurement with 5 × 36 km resolution, and a synthetic aperture radar (SAR) mode for selected portions of the Earth with a 1 × 1 km resolution. The SAR data is generally only available over land, however, a small amount was collected over the ocean for the descending portion of the orbit, only on the fore look, and only within 1000 km of coast. These constraints severely limited the quantity of SAR mode data available over the ocean and were driven by downlink capacity considerations. SMAP is groundbreaking in many ways: for example it is the first scanning SAR instrument and it is the first active/passive L-band instrument that is conically-scanning and thus able to estimate Ocean Vector Winds (OVW).
Unfortunately the SMAP radar failed in early July 2015, after having provided only two months of data. Though short, this dataset is sufficient to explore the vast potential of this type of system for ocean remote sensing of extreme wind events.

2. L-Band Remote Sensing of Ocean Surface

L-band active/passive remote sensing of the ocean has been proven to be a reliable means for retrieval of sea surface salinity, ocean wind speed, and ocean wind direction. Aquarius was the first combined active/passive L-band sensor flown in space and developed the field of L-band active/passive remote sensing of the ocean surface [2]. Geophysical Model Functions (GMFs) have been generated for Aquarius [3,4] and are directly applicable to SMAP after accounting for slight changes to incidence angle and resolution. Aquarius enabled combined estimates of Sea Surface Salinity (SSS) as well as ocean wind speeds [5], and we have directly modified these algorithms as well as QuikSCAT algorithms [6,7,8] to the retrieval of Ocean Vector Winds (OVW), SSS, and radiometer-only extreme winds with SMAP in previous work [9,10,11,12]. In that work we show that the active/passive low resolution data, which is available for all of the time for SMAP before the radar failed, enables retrieval of OVW and SSS to accuracies approaching RapidScat and QuikSCAT for OVW and nearing but not quite as good as Aquarius for SSS. Additionally there has been some work using the SMAP SAR for retrieval of ocean surface winds [13], however, we specifically explore extreme winds. While much work has been done with C-band SAR wind estimation for both normal and extreme wind speed regimes [14,15], little has been done with L-band SAR at extreme winds.
It is known that L-band has potential for remote sensing of extreme wind events due to the longer wavelength as compared to traditional scatterometery with C and Ku-band, whereas Ku-band is significantly impacted by rain [16] and both have significant saturation or even non-monotonicity of wind speed- σ 0 relationship [17,18,19,20] at high wind speeds for the co-polarizations. L-band is not significantly affected by attenuation due to rain, and in this study we will show that the cross-polarization in particular remains sensitive to wind at the wind speeds of tropical cyclones/hurricanes, even up to category 5/70 m/s wind speeds.

3. Datasets

3.1. SMAP Data

We use the version 3 R13080 version of the SMAP L1C SAR data, available from the Alaska Satellite Facility. The L1C data were posted on a 1km grid and data was only downlinked for regions within 1000 km of coastlines, only on the descending pass, and only for the fore portion of the conical antenna scan.

3.2. Model Function

We use the GMFs derived in [3] for Aquarius for SMAP data processing. In Figure 1 we show the GMF for HH on left, VV in middle, and HV on right. Note the very large directional modulation of the L-band σ 0 for co-polarizations while the cross-polarization has much less modulation. The large directional modulation for co-polarization can cause larger speed errors due to errors in wind direction while the much smaller modulation for cross-polarization may have less errors in retrieved wind speed due to wind direction.
Also note the change in sign of the A2 term of the GMF, which for the VV polarization causes non-monotonic relation between wind speed and σ 0 for particular azimuth angles.

4. SMAP Observations of Extreme Winds

Due to the downlink constraints of SMAP there is precious little SAR data downlinked from over the ocean, and with only two months of radar data we have found very few hits on tropical cyclones. Using tropical cyclone vitals files from the National Hurricane Center (NHC) and Joint Typhoon Warning Center (JTWC) we are able to automatically collocate and extract all SMAP observations of hurricane-force winds contained in the 2 month data record. While the time of year (May-June) was not optimal for Atlantic hurricanes, the Pacific basin was quite active during 2015 and we have found about five high-quality hits on hurricane-force winds of which we show three in Figure 2. Each one clearly shows the cyclone eye, visible most easily in the cross-polarization channel. Three of the 5 hits were from East Pacific hurricanes, however, there is no collocated data available from Stepped Frequency Microwave Radiometer (SFMR) to use for validation.
For each of the scenes shown, we extract the data over each of these hits and we oversample the L1C SAR data to a 0.01 ° grid in latitude and longitude, with a resolution of 0.03 ° using a sliding window filter. Next we retrieve a wind speed from each SAR image, using a hybrid algorithm. First we perform the combined active/passive (CAP) ocean vector wind processing introduced in [9] to generate the low-resolution ocean vector winds. Then we estimate the eye location from the HV polarized σ 0 , compute the cyclonic wind direction, and linearly combine it with the wind directions from the low resolution CAP processing to generate the cyclone prior direction. This is the wind direction that is used for the subsequent high-wind speed retrieval. Finally we retrieve the wind speed on the high-resolution grid assuming the cyclone prior wind direction using the following objective function:
F ( s p d ) = σ 0 , h h σ 0 , h h m v a r σ 0 , h h 2 + σ 0 , v v σ 0 , v v m v a r σ 0 , v v 2 + w ( a n c _ s p d ) σ 0 , h v σ 0 , h v m v a r σ 0 , h v 2 .
Here σ 0 , i is the observed SAR σ 0 for polarization i, σ 0 , i m is the model NRCS for polarization i, v a r σ 0 , i is the expected variance of the NRCS for polarization i, and the HV weight w varies linearly from zero to one between ancillary speeds of 15 to 20 m/s, is zero below 15 m/s, and is one above 20 m/s.
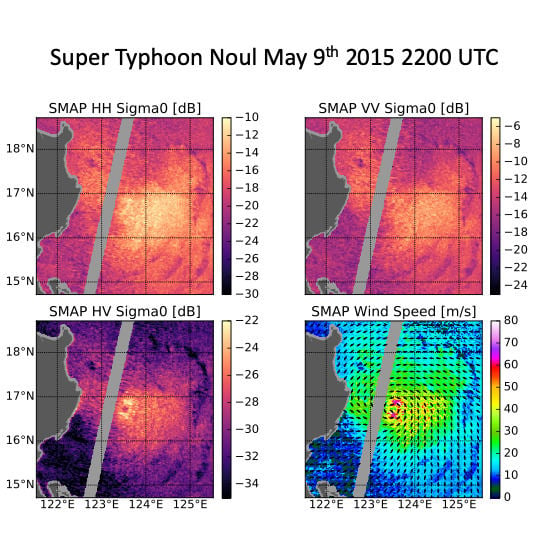
In Figure 2 we show the HH σ 0 , the HV σ 0 , and the SAR wind speed retrieval for super typhoon Noul when it was a category 5 storm, cyclone Quang as a category 4 storm, and hurricane Blanca as a category 2 storm. The excluded line down the middle of the swath is the nadir region where the SAR data processing is not possible due to geometry. In each of the HH σ 0 images we see the typical hour-glass shape which is due to the high directional modulation of the HH σ 0 , in particular the second cosine harmonic; in contrast, the HV σ 0 does not display such large directional modulation. At upwind and downwind the σ 0 for HH is significantly larger than the cross-wind directions, giving rise to the hour-glass type of shape in the images on the left side of Figure 2. The HH image also does not show a clearly identifiable eye-wall location; however, the HV σ 0 does allow us to clearly delineate the eye-wall location. The eye-wall structure in Quang is tighter and better defined than in the Noul image indicating a more tightly organized storm, whereas the eye-wall in the Blanca image is quite large, somewhat disorganized, and an interesting feature of larger σ 0 directly in the middle of the eye. Also note that the somewhat odd looking wind field in the Blanca SAR wind plot does not align with the hour-glass shape in the corresponding HH image; in fact it better aligns with gradations in the HV image indicating that these may be the real winds and not an artifact due to the GMF.
Using our SAR wind speed retrieval algorithm we find wind speeds in the eye-wall between 60 and 80 m/s for Noul agreeing reasonably well with the JTWC estimates. Estimates in Quang are slightly less, perhaps overestimating as compared to the JTWC estimates, and those for Blanca seem right in line with the NHC estimates.

5. Discussion and Implications on L-Band Remote Sensing of Extreme Winds

5.1. Is the HV Signal Real or Is It Leakage from Co-Polarizations?

When calibrating a cross-polarization channel, especially over the ocean where the expected cross-polarization response is very small compared to the co-polarization response, one has to be very careful to remove various cross-talk sources or at least determine if they are driving the observed signal in the cross-polarization. We would expect two main sources of cross-talk: first, due to Faraday rotation and, second, due to leakage in the instrument itself. We do not think Faraday rotation is significant for the data considered here due to two main factors: SAR data over ocean is only collected on the descending pass (6 am local time) when the total electron content (TEC) is minimal and even then a Faraday rotation correction is performed on the SAR data using a model TEC data product. Secondly, examination of the HH and HV σ 0 in Figure 2 shows distinct differences between the HV and HH channels, in particular the clear delineation of the eye wall and the hour-glass shape in the HH not being replicated in the cross-pol. In addition the cross-pol does not show nearly as much directional modulation as the co-polarizations, thus we conclude that there is significant signal in the cross-pol that cannot be due to leakage from the co-pols.

5.2. Implications on L-Band Remote Sensing of Extreme Winds

The images of the various storms in Figure 2 would seem to indicate that the HV polarization is essential to retrieval of wind speed for these extreme wind events. In Figure 3 we plot the ratio of the HV σ 0 to the geometric average of the HH and VV σ 0 . Noul had category 5 winds and Quang was nearly as strong as Noul when observed by the SMAP SAR, however it was classified as a category 4. In comparison Blanca was a category 2 storm with a much larger eye and covered a much larger area. We cannot know the exact structure of the true winds as a function of distance from the eye, however, we can assert some basic assumptions and see what conclusions may be drawn. Firstly, the maximum speed of the cyclones will typically be in the eye wall, where we observe the maximum HV backscatter in Figure 2a,b in the middle plot of each. Secondly, we can assume that for at least a small distance from the eye that the azimuthally-averaged wind speed is monotonically decreasing as a function of distance from eye, for distances larger than the eye radius. From these two assumptions and the data shown in Figure 3 we can conclude that the HV σ 0 has an increasing sensitivity as compared to the HH or VV σ 0 as wind speeds approach and exceed the category 4 and 5 wind speed regimes. For normal wind speeds, the Aquarius GMF derived in [3] gives a cross-pol to co-pol ratio of −16.6 dB at 7 . 5 m/s wind speeds (see green curves in Figure 1). We conclude that this increase in sensitivity of the cross-pol channel as compared to the co-pol channels is about 4–5 dB in magnitude from the normal wind speed to category 5 wind speed regimes. This effect is consistent in both of the SMAP SAR observations of category 4 and 5 wind speeds in Noul and Quang.
There is also some evidence of possible saturation of the co-polarization σ 0 channels for these extreme winds. We see that the images of Noul and Quang (Figure 2a,b) that the cross-pol σ 0 clearly shows the eye-wall locations while the HH σ 0 does not. In both cases the co-pol channel also does not show a strong increase in σ 0 in the vicinity of the eye-wall, but rather a much weaker relative change as compared to further away. In contrast, in the images of Blanca (Figure 2c) the HH σ 0 and HV σ 0 both clearly illustrate the eye-wall location. Perhaps somewhere between the category 2 and category 4–5 scale the co-polarization σ 0 starts to lose sensitivity to changes in the wind speed. Combined, these observations demonstrate that HV will be a necessity to observe extreme winds with L-band SAR.

6. Conclusions

We have found collocations of SMAP SAR data with a few tropical cyclones/hurricanes. We show that the L-band SAR signal shows strong sensitivity to extreme winds up to the category 2 wind speed regime for the co-polarizations and up to the category 5 regime for the cross-polarizations. The cross-polarization increases in sensitivity as compared to the co-polarizations as winds increase from the normal to extreme wind regimes. It is unclear if the HH polarization saturates between the category 2 and 5 wind regimes, however, the HV clearly does not. We have devised a wind speed retrieval method for the SMAP SAR data and shown it seems to give reasonable agreement with what data are available. With precious little data, it is impossible to validate these hurricane-force wind retrievals, however, the data clearly show that L-band is capable of measuring these extreme winds in a way that other Ku and C-band scatterometers cannot.

Author Contributions

Data curation, A.G.F., W.T., and A.K.H.; Analysis, A.G.F., W.T. and S.H.Y.; Investigation, A.G.F., W.T., B.W.S., and S.H.Y.; Writing, A.G.F.; Visualization, A.G.F.

Funding

The research described in this paper was carried out at the Jet Propulsion Laboratory, California Institute of Technology, under a contract with the National Aeronautics and Space Administration.

Acknowledgments

The research described in this paper was carried out at the Jet Propulsion Laboratory, California Institute of Technology, under a contract with the National Aeronautics and Space Administration.

Conflicts of Interest

The authors declare no conflict of interest.

References

  1. Entekhabi, D.; Njoku, E.; O’Neill, P.; Kellogg, K.; Crow, W.; Edelstein, W.; Entin, J.; Goodman, S.; Jackson, T.; Johnson, J.; et al. The Soil Moisture Active Passive (SMAP) Mission. Proc. IEEE 2010, 98, 704–716. [Google Scholar] [CrossRef]
  2. Le Vine, D.; Lagerloef, G.; Colomb, F.; Yueh, S.; Pellerano, F. Aquarius: An Instrument to Monitor Sea Surface Salinity From Space. IEEE Trans. Geosci. Remote Sens. 2007, 45, 2040–2050. [Google Scholar] [CrossRef]
  3. Yueh, S.; Tang, W.; Fore, A.; Neumann, G.; Hayashi, A.; Freedman, A.; Chaubell, J.; Lagerloef, G. L-Band Passive and Active Microwave Geophysical Model Functions of Ocean Surface Winds and Applications to Aquarius Retrieval. IEEE Trans. Geosci. Remote Sens. 2013, 51, 4619–4632. [Google Scholar] [CrossRef]
  4. Meissner, T.; Wentz, F.J.; Ricciardulli, L. The emission and Scattering of L-band Microwave Radiation from Rough Ocean Surfaces and Wind Speed Measurements from the Aquarius sensor. J. Geophys. Res. Oceans 2014, 119, 6499–6522. [Google Scholar] [CrossRef]
  5. Yueh, S.; Chaubell, J. Sea Surface Salinity and Wind Retrieval Using Combined Passive and Active L-Band Microwave Observations. IEEE Trans. Geosci. Remote Sens. 2012, 50, 1022–1032. [Google Scholar] [CrossRef]
  6. Fore, A.; Stiles, B.; Chau, A.; Williams, B.; Dunbar, R.; Rodríguez, E. Point-Wise Wind Retrieval and Ambiguity Removal Improvements for the QuikSCAT Climatological Data Set. IEEE Trans. Geosci. Remote Sens. 2014, 52, 51–59. [Google Scholar] [CrossRef]
  7. Shaffer, S.; Dunbar, R.; Hsiao, S.; Long, D. A Median-Filter-Based Ambiguity Removal Algorithm for NSCAT. IEEE Trans. Geosci. Remote Sens. 1991, 29, 167–174. [Google Scholar] [CrossRef]
  8. Stiles, B.; Pollard, B.; Dunbar, R. Direction Interval Retrieval with Thresholded Nudging: A Method for Improving the Accuracy of QuikSCAT Winds. IEEE Trans. Geosci. Remote Sens. 2002, 40, 79–89. [Google Scholar] [CrossRef]
  9. Fore, A.G.; Yueh, S.H.; Tang, W.; Stiles, B.W.; Hayashi, A.K. Combined Active/Passive Retrievals of Ocean Vector Wind and Sea Surface Salinity With SMAP. IEEE Trans. Geosci. Remote Sens. 2016, 54, 7396–7404. [Google Scholar] [CrossRef]
  10. Yueh, S.H.; Fore, A.G.; Tang, W.; Hayashi, A.; Stiles, B.; Reul, N.; Weng, Y.; Zhang, F. SMAP L-Band Passive Microwave Observations of Ocean Surface Wind During Severe Storms. IEEE Trans. Geosci. Remote Sens. 2016, 54, 7339–7350. [Google Scholar] [CrossRef]
  11. Reul, N.; Chapron, B.; Zabolotskikh, E.; Donlon, C.; Mouche, A.; Tenerelli, J.; Collard, F.; Piolle, J.F.; Fore, A.; Yueh, S.; et al. A New Generation of Tropical Cyclone Size Measurements from Space. Bull. Am. Meteorol. Soc. 2017, 98, 2367–2385. [Google Scholar] [CrossRef]
  12. Fore, A.G.; Yueh, S.H.; Stiles, B.W.; Tang, W.; Hayashi, A.K. SMAP Radiometer-Only Tropical Cyclone Intensity and Size Validation. IEEE Geosci. Remote Sens. Lett. 2018, 15, 1480–1484. [Google Scholar] [CrossRef]
  13. Zhou, X.; Chong, J.; Yang, X.; Li, W.; Guo, X. Ocean Surface Wind Retrieval Using SMAP L-Band SAR. IEEE J. Sel. Top. Appl. Earth Obs. Remote Sens. 2017, 10, 65–74. [Google Scholar] [CrossRef]
  14. La, T.V.; Khenchaf, A.; Comblet, F.; Nahum, C. Exploitation of C-Band Sentinel-1 Images for High-Resolution Wind Field Retrieval in Coastal Zones (Iroise Coast, France). IEEE J. Sel. Top. Appl. Earth Obs. Remote Sens. 2017, 10, 5458–5471. [Google Scholar] [CrossRef]
  15. La, T.V.; Khenchaf, A.; Comblet, F.; Nahum, C. Assessment of Wind Speed Estimation From C-Band Sentinel-1 Images Using Empirical and Electromagnetic Models. IEEE Trans. Geosci. Remote Sens. 2018, 56, 4075–4087. [Google Scholar] [CrossRef]
  16. Stiles, B.; Yueh, S. Impact of Rain on Spaceborne Ku-band Wind Scatterometer data. IEEE Trans. Geosci. Remote Sens. 2002, 40, 1973–1983. [Google Scholar] [CrossRef]
  17. Fernandez, D.E.; Carswell, J.R.; Frasier, S.; Chang, P.S.; Black, P.G.; Marks, F.D. Dual-polarized C- and Ku-band Ocean Backscatter Response to Hurricane-Force Winds. J. Geophys. Res. Oceans 2006, 111, C08013. [Google Scholar] [CrossRef]
  18. Shen, H.; He, Y.; Perrie, W. Speed Ambiguity in Hurricane Wind Retrieval from SAR Imagery. Int. J. Remote Sens. 2009, 30, 2827–2836. [Google Scholar] [CrossRef]
  19. Reppucci, A.; Lehner, S.; Schulz-Stellenfleth, J.; Brusch, S. Tropical Cyclone Intensity Estimated From Wide-Swath SAR Images. IEEE Trans. Geosci. Remote Sens. 2010, 48, 1639–1649. [Google Scholar] [CrossRef]
  20. Shen, H.; Perrie, W.; He, Y. Evaluation of Hurricane Wind Speed Retrieval from Cross-Dual-Pol SAR. Int. J. Remote Sens. 2016, 37, 599–614. [Google Scholar] [CrossRef]
Figure 1. (left) Geophysical Model Function in dB for HH polarization, as a function of relative azimuth angle with different wind speeds as different lines, (middle) same for VV polarization, (right) same for HV polarization. Note the large wind direction modulation for co-polarizations, while the cross-polarization has much less dependance on wind direction. Also note the change in sign of directional modulation and non-monotonicity of the GMF in wind speed as cross-wind.
Remotesensing 11 01093 g001
Figure 2. (a) Typhoon Noul, (b) cyclone Quang, (c) hurricane Blanca. In each we have (left) HH σ 0 , (middle) HV σ 0 , (right) SAR wind speed. The arrows on the right plots are cyclonic prior wind direction used in speed retrieval. The VV σ 0 is not shown, however, it is qualitatively very similar to the HH σ 0 . In each we can clearly see the eye-wall in the HV, however, only in the case of Blanca is the eye-wall clearly visible in the HH σ 0 . There is a distinctive hour-glass shape in each of the HH images due to the high directional modulation for co-polarizations while the HV does not show this effect.
Remotesensing 11 01093 g002
Figure 3. Ratio of the HV σ 0 to the geometric average of the HH and VV co-polarization σ 0 plotted as a function of distance from estimated hurricane eye location for Noul (black), Quang (red), and Blanca (blue). The cross-pol co-pol ratio seems to peak at 12 dB for extreme winds and decreases as wind speed decreases. The Aquarius GMF indicates 16.6 dB ratio at 7.5 m/s wind speed. Note that Blanca, while weaker, is spatially a much larger storm with a larger eye, has two peaks (in agreement with the wind fields), and does not reach as high of a cross-pol co-pol ratio as the other two storms (less intense).
Remotesensing 11 01093 g003