Next Issue
Volume 11, May-2
Previous Issue
Volume 11, April-2
 
 
remotesensing-logo

Journal Browser

Journal Browser

Remote Sens., Volume 11, Issue 9 (May-1 2019) – 150 articles

Cover Story (view full-size image): 
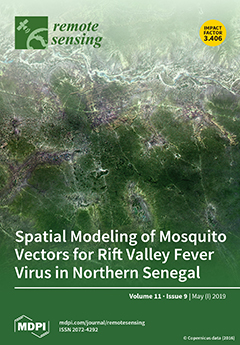
Mosquitoes are vectors of major pathogen agents worldwide. Mapping their distribution can contribute effectively to disease surveillance and control systems. In this study, we used remote sensing data as the input in a weather-driven model of mosquito population dynamics applied to Rift Valley fever vector species in northern Senegal. The model predictions were consistent with field entomological data on mosquito adult abundances. Based on satellite-derived rainfall and temperature data, dynamic maps of three potential Rift Valley fever vector species, Aedes vexans, Culex poicilipes, and Culex tritaeniorhynchus, were then produced at a regional scale on a weekly basis. When direct weather measurements are sparse, these maps can be used to support policymakers in optimizing surveillance and control interventions of Rift Valley fever in Senegal. View this paper.
  • Issues are regarded as officially published after their release is announced to the table of contents alert mailing list.
  • You may sign up for e-mail alerts to receive table of contents of newly released issues.
  • PDF is the official format for papers published in both, html and pdf forms. To view the papers in pdf format, click on the "PDF Full-text" link, and use the free Adobe Reader to open them.
Order results
Result details
Section
Select all
Export citation of selected articles as:
19 pages, 6761 KiB  
Article
Floating Xylene Spill Segmentation from Ultraviolet Images via Target Enhancement
by Shuyue Zhan, Chao Wang, Shuchang Liu, Kaibo Xia, Hui Huang, Xiaorun Li, Caicai Liu and Ren Xu
Remote Sens. 2019, 11(9), 1142; https://doi.org/10.3390/rs11091142 - 13 May 2019
Cited by 6 | Viewed by 3141
Abstract
Automatic colorless floating hazardous and noxious substances (HNS) spill segmentation is an emerging research topic. Xylene is one of the priority HNSs since it poses a high risk of being involved in an HNS incident. This paper presents a novel algorithm for the [...] Read more.
Automatic colorless floating hazardous and noxious substances (HNS) spill segmentation is an emerging research topic. Xylene is one of the priority HNSs since it poses a high risk of being involved in an HNS incident. This paper presents a novel algorithm for the target enhancement of xylene spills and their segmentation in ultraviolet (UV) images. To improve the contrast between targets and backgrounds (waves, sun reflections, and shadows), we developed a global background suppression (GBS) method to remove the irrelevant objects from the background, which is followed by an adaptive target enhancement (ATE) method to enhance the target. Based on the histogram information of the processed image, we designed an automatic algorithm to calculate the optimal number of clusters, which is usually manually determined in traditional cluster segmentation methods. In addition, necessary pre-segmentation processing and post-segmentation processing were adopted in order to improve the performance. Experimental results on our UV image datasets demonstrated that the proposed method can achieve good segmentation results for chemical spills from different backgrounds, especially for images with strong waves, uneven intensities, and low contrast. Full article
Show Figures

Graphical abstract

16 pages, 5544 KiB  
Article
A Geometric Barycenter-Based Clutter Suppression Method for Ship Detection in HF Mixed-Mode Surface Wave Radar
by Jiazhi Zhang, Xin Zhang, Weibo Deng, Lei Ye and Qiang Yang
Remote Sens. 2019, 11(9), 1141; https://doi.org/10.3390/rs11091141 - 13 May 2019
Cited by 4 | Viewed by 3398
Abstract
The nonhomogeneous clutter is a major challenge for ship detection in high-frequency mixed-mode surface wave radar. In this paper, a geometric barycenter-based reduced-dimension space-time adaptive processing method is proposed to suppress the clutter. Given the measured dataset, the range correlation of sea clutter [...] Read more.
The nonhomogeneous clutter is a major challenge for ship detection in high-frequency mixed-mode surface wave radar. In this paper, a geometric barycenter-based reduced-dimension space-time adaptive processing method is proposed to suppress the clutter. Given the measured dataset, the range correlation of sea clutter is first investigated. Then, joint domain localized processing is applied to solve the training samples starve scenario in a practical system. The geometric barycenter-based training data selector is presented to select valid training samples and improve the accuracy of the clutter covariance matrix estimation. Finally, the validity of the proposed method is verified using the experimental data and the results show that it outperforms the conventional method in the nonhomogeneous environment of a practical system. Full article
(This article belongs to the Special Issue Remote Sensing for Maritime Safety and Security)
Show Figures

Graphical abstract

23 pages, 20181 KiB  
Article
Pedestrian Walking Distance Estimation Based on Smartphone Mode Recognition
by Qu Wang, Langlang Ye, Haiyong Luo, Aidong Men, Fang Zhao and Changhai Ou
Remote Sens. 2019, 11(9), 1140; https://doi.org/10.3390/rs11091140 - 13 May 2019
Cited by 34 | Viewed by 5560
Abstract
Stride length and walking distance estimation are becoming a key aspect of many applications. One of the methods of enhancing the accuracy of pedestrian dead reckoning is to accurately estimate the stride length of pedestrians. Existing stride length estimation (SLE) algorithms present good [...] Read more.
Stride length and walking distance estimation are becoming a key aspect of many applications. One of the methods of enhancing the accuracy of pedestrian dead reckoning is to accurately estimate the stride length of pedestrians. Existing stride length estimation (SLE) algorithms present good performance in the cases of walking at normal speed and the fixed smartphone mode (handheld). The mode represents a specific state of the carried smartphone. The error of existing SLE algorithms increases in complex scenes with many mode changes. Considering that stride length estimation is very sensitive to smartphone modes, this paper focused on combining smartphone mode recognition and stride length estimation to provide an accurate walking distance estimation. We combined multiple classification models to recognize five smartphone modes (calling, handheld, pocket, armband, swing). In addition to using a combination of time-domain and frequency-domain features of smartphone built-in accelerometers and gyroscopes during the stride interval, we constructed higher-order features based on the acknowledged studies (Kim, Scarlett, and Weinberg) to model stride length using the regression model of machine learning. In the offline phase, we trained the corresponding stride length estimation model for each mode. In the online prediction stage, we called the corresponding stride length estimation model according to the smartphone mode of a pedestrian. To train and evaluate the performance of our SLE, a dataset with smartphone mode, actual stride length, and total walking distance were collected. We conducted extensive and elaborate experiments to verify the performance of the proposed algorithm and compare it with the state-of-the-art SLE algorithms. Experimental results demonstrated that the proposed walking distance estimation method achieved significant accuracy improvement over existing individual approaches when a pedestrian was walking in both indoor and outdoor complex environments with multiple mode changes. Full article
Show Figures

Graphical abstract

20 pages, 4219 KiB  
Article
Validation of Preliminary Results of Thermal Tropopause Derived from FY-3C GNOS Data
by Ziyan Liu, Yueqiang Sun, Weihua Bai, Junming Xia, Guangyuan Tan, Cheng Cheng, Qifei Du, Xianyi Wang, Danyang Zhao, Yusen Tian, Xiangguang Meng, Congliang Liu, Yuerong Cai and Dongwei Wang
Remote Sens. 2019, 11(9), 1139; https://doi.org/10.3390/rs11091139 - 13 May 2019
Cited by 6 | Viewed by 3249
Abstract
The state-of-art global navigation satellite system (GNSS) occultation sounder (GNOS) onboard the FengYun 3 series C satellite (FY-3C) has been in operation for more than five years. The accumulation of FY-3C GNOS atmospheric data makes it ready to be used in atmosphere and [...] Read more.
The state-of-art global navigation satellite system (GNSS) occultation sounder (GNOS) onboard the FengYun 3 series C satellite (FY-3C) has been in operation for more than five years. The accumulation of FY-3C GNOS atmospheric data makes it ready to be used in atmosphere and climate research fields. This work first introduces FY-3C GNOS into tropopause research and gives the error evaluation results of long-term FY-3C atmosphere profiles. We compare FY-3C results with Constellation Observing System for Meteorology, Ionosphere and Climate (COSMIC) and radiosonde results and also present the FY-3C global seasonal tropopause patterns. The mean temperature deviation between FY-3C GNOS temperature profiles and COSMIC temperature profiles from January 2014 to December 2017 is globally less than 0.2 K, and the bias of tropopause height (TPH) and tropopause temperature (TPT) annual cycle derived from both collocated pairs are about 80–100 m and 1–2 K, respectively. Also, the correlation coefficients between FY-3C GNOS tropopause parameters and each radiosonde counterpart are generally larger than 0.9 and the corresponding regression coefficients are close to 1. Multiple climate phenomena shown in seasonal patterns coincide with results of other relevant studies. Our results demonstrate the long-term stability of FY-3C GNOS atmosphere profiles and utility of FY-3C GNOS data in the climate research field. Full article
Show Figures

Graphical abstract

8 pages, 232 KiB  
Editorial
Advances in the Remote Sensing of Terrestrial Evaporation
by Matthew F. McCabe, Diego G. Miralles, Thomas R.H. Holmes and Joshua B. Fisher
Remote Sens. 2019, 11(9), 1138; https://doi.org/10.3390/rs11091138 - 13 May 2019
Cited by 22 | Viewed by 5172
Abstract
Characterizing the terrestrial carbon, water, and energy cycles depends strongly on a capacity to accurately reproduce the spatial and temporal dynamics of land surface evaporation. For this, and many other reasons, monitoring terrestrial evaporation across multiple space and time scales has been an [...] Read more.
Characterizing the terrestrial carbon, water, and energy cycles depends strongly on a capacity to accurately reproduce the spatial and temporal dynamics of land surface evaporation. For this, and many other reasons, monitoring terrestrial evaporation across multiple space and time scales has been an area of focused research for a number of decades. Much of this activity has been supported by developments in satellite remote sensing, which have been leveraged to deliver new process insights, model development and methodological improvements. In this Special Issue, published contributions explored a range of research topics directed towards the enhanced estimation of terrestrial evaporation. Here we summarize these cutting-edge efforts and provide an overview of some of the state-of-the-art approaches for retrieving this key variable. Some perspectives on outstanding challenges, issues, and opportunities are also presented. Full article
(This article belongs to the Special Issue Advances in the Remote Sensing of Terrestrial Evaporation)
17 pages, 6253 KiB  
Article
Same Viewpoint Different Perspectives—A Comparison of Expert Ratings with a TLS Derived Forest Stand Structural Complexity Index
by Julian Frey, Bettina Joa, Ulrich Schraml and Barbara Koch
Remote Sens. 2019, 11(9), 1137; https://doi.org/10.3390/rs11091137 - 13 May 2019
Cited by 15 | Viewed by 4820
Abstract
Forests are one of the most important terrestrial ecosystems for the protection of biodiversity, but at the same time they are under heavy production pressures. In many cases, management optimized for timber production leads to a simplification of forest structures, which is associated [...] Read more.
Forests are one of the most important terrestrial ecosystems for the protection of biodiversity, but at the same time they are under heavy production pressures. In many cases, management optimized for timber production leads to a simplification of forest structures, which is associated with species loss. In recent decades, the concept of retention forestry has been implemented in many parts of the world to mitigate this loss, by increasing structure in managed stands. Although this concept is widely adapted, our understanding what forest structure is and how to reliably measure and quantify it is still lacking. Thus, more insights into the assessment of biodiversity-relevant structures are needed, when aiming to implement retention practices in forest management to reach ambitious conservation goals. In this study we compare expert ratings on forest structural richness with a modern light detection and ranging (LiDAR) -based index, based on 52 research sites, where terrestrial laser scanning (TLS) data and 360° photos have been taken. Using an online survey (n = 444) with interactive 360° panoramic image viewers, we sought to investigate expert opinions on forest structure and learn to what degree measures of structure from terrestrial laser scans mirror experts’ estimates. We found that the experts’ ratings have large standard deviance and therefore little agreement. Nevertheless, when averaging the large number of participants, they distinguish stands according to their structural richness significantly. The stand structural complexity index (SSCI) was computed for each site from the LiDAR scan data, and this was shown to reflect some of the variation of expert ratings (p = 0.02). Together with covariates describing participants’ personal background, image properties and terrain variables, we reached a conditional R2 of 0.44 using a linear mixed effect model. The education of the participants had no influence on their ratings, but practical experience showed a clear effect. Because the SSCI and expert opinion align to a significant degree, we conclude that the SSCI is a valuable tool to support forest managers in the selection of retention patches. Full article
(This article belongs to the Special Issue Virtual Forest)
Show Figures

Graphical abstract

19 pages, 2832 KiB  
Article
Spatial Prior Fuzziness Pool-Based Interactive Classification of Hyperspectral Images
by Muhammad Ahmad, Asad Khan, Adil Mehmood Khan, Manuel Mazzara, Salvatore Distefano, Ahmed Sohaib and Omar Nibouche
Remote Sens. 2019, 11(9), 1136; https://doi.org/10.3390/rs11091136 - 13 May 2019
Cited by 59 | Viewed by 4759
Abstract
Acquisition of labeled data for supervised Hyperspectral Image (HSI) classification is expensive in terms of both time and costs. Moreover, manual selection and labeling are often subjective and tend to induce redundancy into the classifier. Active learning (AL) can be a suitable approach [...] Read more.
Acquisition of labeled data for supervised Hyperspectral Image (HSI) classification is expensive in terms of both time and costs. Moreover, manual selection and labeling are often subjective and tend to induce redundancy into the classifier. Active learning (AL) can be a suitable approach for HSI classification as it integrates data acquisition to the classifier design by ranking the unlabeled data to provide advice for the next query that has the highest training utility. However, multiclass AL techniques tend to include redundant samples into the classifier to some extent. This paper addresses such a problem by introducing an AL pipeline which preserves the most representative and spatially heterogeneous samples. The adopted strategy for sample selection utilizes fuzziness to assess the mapping between actual output and the approximated a-posteriori probabilities, computed by a marginal probability distribution based on discriminative random fields. The samples selected in each iteration are then provided to the spectral angle mapper-based objective function to reduce the inter-class redundancy. Experiments on five HSI benchmark datasets confirmed that the proposed Fuzziness and Spectral Angle Mapper (FSAM)-AL pipeline presents competitive results compared to the state-of-the-art sample selection techniques, leading to lower computational requirements. Full article
(This article belongs to the Special Issue Image Optimization in Remote Sensing)
Show Figures

Figure 1

24 pages, 18396 KiB  
Article
Studying the Influence of Nitrogen Deposition, Precipitation, Temperature, and Sunshine in Remotely Sensed Gross Primary Production Response in Switzerland
by Marta Gómez Giménez, Rogier de Jong, Armin Keller, Beat Rihm and Michael E. Schaepman
Remote Sens. 2019, 11(9), 1135; https://doi.org/10.3390/rs11091135 - 12 May 2019
Cited by 4 | Viewed by 4531
Abstract
Climate, soil type, and management practices have been reported as primary limiting factors of gross primary production (GPP). However, the extent to which these factors predict GPP response varies according to scales and land cover classes. Nitrogen (N) deposition has been highlighted as [...] Read more.
Climate, soil type, and management practices have been reported as primary limiting factors of gross primary production (GPP). However, the extent to which these factors predict GPP response varies according to scales and land cover classes. Nitrogen (N) deposition has been highlighted as an important driver of primary production in N-limited ecosystems that also have an impact on biodiversity in alpine grasslands. However, the effect of N deposition on GPP response in alpine grasslands hasn’t been studied much at a large scale. These remote areas are characterized by complex topography and extensive management practices with high species richness. Remotely sensed GPP products, weather datasets, and available N deposition maps bring along the opportunity of analyzing how those factors predict GPP in alpine grasslands and compare these results with those obtained in other land cover classes with intensive and mixed management practices. This study aims at (i) analyzing the impact of N deposition and climatic variables (precipitation, sunshine, and temperature) on carbon (C) fixation response in alpine grasslands and (ii) comparing the results obtained in alpine grasslands with those from other land cover classes with different management practices. We stratified the analysis using three land cover classes: Grasslands, croplands, and croplands/natural vegetation mosaic and built multiple linear regression models. In addition, we analyzed the soil characteristics, such as aptitude for croplands, stone content, and water and nutrient storage capacity for each class to interpret the results. In alpine grasslands, explanatory variables explained up to 80% of the GPP response. However, the explanatory performance of the covariates decreased to maximums of 47% in croplands and 19% in croplands/natural vegetation mosaic. Further information will improve our understanding of how N deposition affects GPP response in ecosystems with high and mixed intensity of use management practices, and high species richness. Nevertheless, this study helps to characterize large patterns of GPP response in regions affected by local climatic conditions and different land management patterns. Finally, we highlight the importance of including N deposition in C budget models, while accounting for N dynamics. Full article
(This article belongs to the Section Environmental Remote Sensing)
Show Figures

Graphical abstract

26 pages, 7429 KiB  
Article
Hybrid Grasshopper Optimization Algorithm and Differential Evolution for Multilevel Satellite Image Segmentation
by Heming Jia, Chunbo Lang, Diego Oliva, Wenlong Song and Xiaoxu Peng
Remote Sens. 2019, 11(9), 1134; https://doi.org/10.3390/rs11091134 - 12 May 2019
Cited by 53 | Viewed by 6915
Abstract
An efficient satellite image segmentation method based on a hybrid grasshopper optimization algorithm (GOA) and minimum cross entropy (MCE) is proposed in this paper. The proposal is known as GOA–jDE, and it merges GOA with self-adaptive differential evolution (jDE) to improve the search [...] Read more.
An efficient satellite image segmentation method based on a hybrid grasshopper optimization algorithm (GOA) and minimum cross entropy (MCE) is proposed in this paper. The proposal is known as GOA–jDE, and it merges GOA with self-adaptive differential evolution (jDE) to improve the search efficiency, preserving the population diversity especially in the later iterations. A series of experiments is conducted on various satellite images for evaluating the performance of the algorithm. Both low and high levels of the segmentation are taken into account, increasing the dimensionality of the problem. The proposed approach is compared with the standard color image thresholding methods, as well as the advanced satellite image thresholding techniques based on different criteria. Friedman test and Wilcoxon’s rank sum test are performed to assess the significant difference between the algorithms. The superiority of the proposed method is illustrated from different aspects, such as average fitness function value, peak signal to noise ratio (PSNR), structural similarity index (SSIM), feature similarity index (FSIM), standard deviation (STD), convergence performance, and computation time. Furthermore, natural images from the Berkeley segmentation dataset are also used to validate the strong robustness of the proposed method. Full article
(This article belongs to the Special Issue Image Optimization in Remote Sensing)
Show Figures

Graphical abstract

16 pages, 2765 KiB  
Article
Development and Validation of a Photo-Based Measurement System to Calculate the Debarking Percentages of Processed Logs
by Joachim B. Heppelmann, Eric R. Labelle, Thomas Seifert, Stefan Seifert and Stefan Wittkopf
Remote Sens. 2019, 11(9), 1133; https://doi.org/10.3390/rs11091133 - 12 May 2019
Cited by 2 | Viewed by 3497
Abstract
Within a research project investigating the applicability and performance of modified harvesting heads used during the debarking of coniferous tree species, the actual debarking percentage of processed logs needed to be evaluated. Therefore, a computer-based photo-optical measurement system (Stemsurf) designed to assess the [...] Read more.
Within a research project investigating the applicability and performance of modified harvesting heads used during the debarking of coniferous tree species, the actual debarking percentage of processed logs needed to be evaluated. Therefore, a computer-based photo-optical measurement system (Stemsurf) designed to assess the debarking percentage recorded in the field was developed, tested under laboratory conditions, and applied in live field operations. In total, 1720 processed logs of coniferous species from modified harvesting heads were recorded and analyzed within Stemsurf. With a single log image as the input, the overall debarking percentage was calculated by further estimating the un-displayed part of the log surface by defining polygons representing the differently debarked areas of the log surface. To assess the precision and bias of the developed measurement system, 480 images were captured under laboratory conditions on an artificial log with defined surface polygons. Within the laboratory test, the standard deviation of average debarking percentages remained within a 4% variation. A positive bias of 6.7% was caused by distortion and perspective effects. This resulted in an average underestimation of 1.1% for the summer debarking percentages gathered from field operations. The software generally performed as anticipated through field and lab testing and offered a suitable alternative of assessing stem debarking percentage, a task that should increase in importance as more operations are targeting debarked products. Full article
(This article belongs to the Special Issue Advances in Active Remote Sensing of Forests)
Show Figures

Figure 1

18 pages, 5704 KiB  
Article
A Partition Modeling for Anthropogenic Heat Flux Mapping in China
by Shasha Wang, Deyong Hu, Shanshan Chen and Chen Yu
Remote Sens. 2019, 11(9), 1132; https://doi.org/10.3390/rs11091132 - 12 May 2019
Cited by 28 | Viewed by 4239
Abstract
Anthropogenic heat (AH) generated by human activities has a major impact on urban and regional climate. Accurately estimating anthropogenic heat is of great significance for studies on urban thermal environment and climate change. In this study, a gridded anthropogenic heat flux (AHF) estimation [...] Read more.
Anthropogenic heat (AH) generated by human activities has a major impact on urban and regional climate. Accurately estimating anthropogenic heat is of great significance for studies on urban thermal environment and climate change. In this study, a gridded anthropogenic heat flux (AHF) estimation scheme was constructed based on socio-economic data, energy-consumption data, and multi-source remote sensing data using a partition modeling method, which takes into account the regional characteristics of AH emission caused by the differences in regional development levels. The refined AHF mapping in China was realized with a high resolution of 500 m. The results show that the spatial distribution of AHF has obvious regional characteristics in China. Compared with the AHF in provinces, the AHF in Shanghai is the highest which reaches 12.56 W·m−2, followed by Tianjin, Beijing, and Jiangsu. The AHF values are 5.92 W·m−2, 3.35 W·m−2, and 3.10 W·m−2, respectively. As can be seen from the mapping results of refined AHF, the high-value AHF aggregation areas are mainly distributed in north China, east China, and south China. The high-value AHF in urban areas is concentrated in 50–200 W·m−2, and maximum AHF in Shenzhen urban center reaches 267 W·m−2. Further, compared with other high resolution AHF products, it can be found that the AHF results in this study have higher spatial heterogeneity, which can better characterize the emission characteristics of AHF in the region. The spatial pattern of the AHF estimation results correspond to the distribution of building density, population, and industry zone. The high-value AHF areas are mainly distributed in airports, railway stations, industry areas, and commercial centers. It can thus be seen that the AHF estimation models constructed by the partition modeling method can well realize the estimation of large-scale AHF and the results can effectively express the detailed spatial distribution of AHF in local areas. These results can provide technical ideas and data support for studies on surface energy balance and urban climate change. Full article
(This article belongs to the Section Urban Remote Sensing)
Show Figures

Figure 1

18 pages, 5396 KiB  
Article
Aquarius Sea Surface Salinity Gridding Method Based on Dual Quality–Distance Weighting
by Yanyan Li, Qing Dong and Yongzheng Ren
Remote Sens. 2019, 11(9), 1131; https://doi.org/10.3390/rs11091131 - 11 May 2019
Cited by 3 | Viewed by 3147
Abstract
A new method for improving the accuracy of gridded sea surface salinity (SSS) fields is proposed in this paper. The method mainly focuses on dual quality–distance weighting of the Aquarius level 2 along-track SSS data according to quality flags, which represent nonnominal data [...] Read more.
A new method for improving the accuracy of gridded sea surface salinity (SSS) fields is proposed in this paper. The method mainly focuses on dual quality–distance weighting of the Aquarius level 2 along-track SSS data according to quality flags, which represent nonnominal data conditions for measurements. In the weighting progress, 14 data conditions were considered, and their geospatial distributions and influences on the SSS were also visualized and evaluated. Three interpolation methods were employed, and weekly gridded SSS maps were produced for the period from September 2011 to May 2015. These maps were evaluated via comparisons with concurrent Argo buoy measurements. The results show that the proposed method improved the accuracy of the SSS fields by approximately 36% compared to the officially released weekly level 3 products and yielded root mean squared difference (RMSD), correlation and bias values of 0.19 psu, 0.98 and 0.01 psu, respectively. These findings indicate a significant improvement in the accuracy of the SSS fields and provide a better understanding of the influences of different conditions on salinity. Full article
(This article belongs to the Special Issue Satellite Monitoring of Water Quality and Water Environment)
Show Figures

Graphical abstract

16 pages, 4058 KiB  
Article
Satellite-based Cloudiness and Solar Energy Potential in Texas and Surrounding Regions
by Shuang Xia, Alberto M. Mestas-Nuñez, Hongjie Xie and Rolando Vega
Remote Sens. 2019, 11(9), 1130; https://doi.org/10.3390/rs11091130 - 11 May 2019
Cited by 2 | Viewed by 3125
Abstract
Global horizontal irradiance (i.e., shortwave downward solar radiation received by a horizontal surface on the ground) is an important geophysical variable for climate and energy research. Since solar radiation is attenuated by clouds, its variability is intimately associated with the variability of cloud [...] Read more.
Global horizontal irradiance (i.e., shortwave downward solar radiation received by a horizontal surface on the ground) is an important geophysical variable for climate and energy research. Since solar radiation is attenuated by clouds, its variability is intimately associated with the variability of cloud properties. The spatial distribution of clouds and the daily, monthly, seasonal, and annual solar energy potential (i.e., the solar energy available to be converted into electricity) derived from satellite estimates of global horizontal irradiance are explored over the state of Texas, USA and surrounding regions, including northern Mexico and the western Gulf of Mexico. The maximum (minimum) monthly solar energy potential in the study area is 151–247 kWhm−2 (43–145 kWhm−2) in July (December). The maximum (minimum) seasonal solar energy potential is 457–706 kWhm−2 (167–481 kWhm−2) in summer (winter). The available annual solar energy in 2015 was 1295–2324 kWhm−2. The solar energy potential is significantly higher over the Gulf of Mexico than over land despite the ocean waters having typically more cloudy skies. Cirrus is the dominant cloud type over the Gulf which attenuates less solar irradiance compared to other cloud types. As expected from our previous work, there is good agreement between satellite and ground estimates of solar energy potential in San Antonio, Texas, and we assume this agreement applies to the surrounding larger region discussed in this paper. The study underscores the relevance of geostationary satellites for cloud/solar energy mapping and provides useful estimates on solar energy in Texas and surrounding regions that could potentially be harnessed and incorporated into the electrical grid. Full article
(This article belongs to the Special Issue Feature Papers for Section Atmosphere Remote Sensing)
Show Figures

Graphical abstract

22 pages, 6381 KiB  
Article
Field Intercomparison of Radiometers Used for Satellite Validation in the 400–900 nm Range
by Viktor Vabson, Joel Kuusk, Ilmar Ansko, Riho Vendt, Krista Alikas, Kevin Ruddick, Ave Ansper, Mariano Bresciani, Henning Burmester, Maycira Costa, Davide D’Alimonte, Giorgio Dall’Olmo, Bahaiddin Damiri, Tilman Dinter, Claudia Giardino, Kersti Kangro, Martin Ligi, Birgot Paavel, Gavin Tilstone, Ronnie Van Dommelen, Sonja Wiegmann, Astrid Bracher, Craig Donlon and Tânia Casaladd Show full author list remove Hide full author list
Remote Sens. 2019, 11(9), 1129; https://doi.org/10.3390/rs11091129 - 11 May 2019
Cited by 24 | Viewed by 6115
Abstract
An intercomparison of radiance and irradiance ocean color radiometers (the second laboratory comparison exercise—LCE-2) was organized within the frame of the European Space Agency funded project Fiducial Reference Measurements for Satellite Ocean Color (FRM4SOC) May 8–13, 2017 at Tartu Observatory, Estonia. LCE-2 consisted [...] Read more.
An intercomparison of radiance and irradiance ocean color radiometers (the second laboratory comparison exercise—LCE-2) was organized within the frame of the European Space Agency funded project Fiducial Reference Measurements for Satellite Ocean Color (FRM4SOC) May 8–13, 2017 at Tartu Observatory, Estonia. LCE-2 consisted of three sub-tasks: (1) SI-traceable radiometric calibration of all the participating radiance and irradiance radiometers at the Tartu Observatory just before the comparisons; (2) indoor, laboratory intercomparison using stable radiance and irradiance sources in a controlled environment; (3) outdoor, field intercomparison of natural radiation sources over a natural water surface. The aim of the experiment was to provide a link in the chain of traceability from field measurements of water reflectance to the uniform SI-traceable calibration, and after calibration to verify whether different instruments measuring the same object provide results consistent within the expected uncertainty limits. This paper describes the third phase of LCE-2: The results of the field experiment. The calibration of radiometers and laboratory comparison experiment are presented in a related paper of the same journal issue. Compared to the laboratory comparison, the field intercomparison has demonstrated substantially larger variability between freshly calibrated sensors, because the targets and environmental conditions during radiometric calibration were different, both spectrally and spatially. Major differences were found for radiance sensors measuring a sunlit water target at viewing zenith angle of 139° because of the different fields of view. Major differences were found for irradiance sensors because of imperfect cosine response of diffusers. Variability between individual radiometers did depend significantly also on the type of the sensor and on the specific measurement target. Uniform SI traceable radiometric calibration ensuring fairly good consistency for indoor, laboratory measurements is insufficient for outdoor, field measurements, mainly due to the different angular variability of illumination. More stringent specifications and individual testing of radiometers for all relevant systematic effects (temperature, nonlinearity, spectral stray light, etc.) are needed to reduce biases between instruments and better quantify measurement uncertainties. Full article
(This article belongs to the Special Issue Fiducial Reference Measurements for Satellite Ocean Colour)
Show Figures

Graphical abstract

17 pages, 33904 KiB  
Article
DisCountNet: Discriminating and Counting Network for Real-Time Counting and Localization of Sparse Objects in High-Resolution UAV Imagery
by Maryam Rahnemoonfar, Dugan Dobbs, Masoud Yari and Michael J. Starek
Remote Sens. 2019, 11(9), 1128; https://doi.org/10.3390/rs11091128 - 11 May 2019
Cited by 30 | Viewed by 4276
Abstract
Recent deep-learning counting techniques revolve around two distinct features of data—sparse data, which favors detection networks, or dense data where density map networks are used. Both techniques fail to address a third scenario, where dense objects are sparsely located. Raw aerial images represent [...] Read more.
Recent deep-learning counting techniques revolve around two distinct features of data—sparse data, which favors detection networks, or dense data where density map networks are used. Both techniques fail to address a third scenario, where dense objects are sparsely located. Raw aerial images represent sparse distributions of data in most situations. To address this issue, we propose a novel and exceedingly portable end-to-end model, DisCountNet, and an example dataset to test it on. DisCountNet is a two-stage network that uses theories from both detection and heat-map networks to provide a simple yet powerful design. The first stage, DiscNet, operates on the theory of coarse detection, but does so by converting a rich and high-resolution image into a sparse representation where only important information is encoded. Following this, CountNet operates on the dense regions of the sparse matrix to generate a density map, which provides fine locations and count predictions on densities of objects. Comparing the proposed network to current state-of-the-art networks, we find that we can maintain competitive performance while using a fraction of the computational complexity, resulting in a real-time solution. Full article
(This article belongs to the Section Remote Sensing Image Processing)
Show Figures

Graphical abstract

22 pages, 3548 KiB  
Article
Analysis of L-Band SAR Data for Soil Moisture Estimations over Agricultural Areas in the Tropics
by Mehrez Zribi, Sekhar Muddu, Safa Bousbih, Ahmad Al Bitar, Sat Kumar Tomer, Nicolas Baghdadi and Soumya Bandyopadhyay
Remote Sens. 2019, 11(9), 1122; https://doi.org/10.3390/rs11091122 - 11 May 2019
Cited by 44 | Viewed by 7658
Abstract
The main objective of this study is to analyze the potential use of L-band radar data for the estimation of soil moisture over tropical agricultural areas under dense vegetation cover conditions. Ten radar images were acquired using the Phased Array Synthetic Aperture Radar/Advanced [...] Read more.
The main objective of this study is to analyze the potential use of L-band radar data for the estimation of soil moisture over tropical agricultural areas under dense vegetation cover conditions. Ten radar images were acquired using the Phased Array Synthetic Aperture Radar/Advanced Land Observing Satellite (PALSAR/ALOS)-2 sensor over the Berambadi watershed (south India), between June and October of 2018. Simultaneous ground measurements of soil moisture, soil roughness, and leaf area index (LAI) were also recorded. The sensitivity of PALSAR observations to variations in soil moisture has been reported by several authors, and is confirmed in the present study, even for the case of very dense crops. The radar signals are simulated using five different radar backscattering models (physical and semi-empirical), over bare soil, and over areas with various types of crop cover (turmeric, marigold, and sorghum). When the semi-empirical water cloud model (WCM) is parameterized as a function of the LAI, to account for the vegetation’s contribution to the backscattered signal, it can provide relatively accurate estimations of soil moisture in turmeric and marigold fields, but has certain limitations when applied to sorghum fields. Observed limitations highlight the need to expand the analysis beyond the LAI by including additional vegetation parameters in order to take into account volume scattering in the L-band backscattered radar signal for accurate soil moisture estimation. Full article
(This article belongs to the Special Issue Microwave Remote Sensing for Hydrology)
Show Figures

Figure 1

13 pages, 5657 KiB  
Article
Establishment and Assessment of a New GNSS Precipitable Water Vapor Interpolation Scheme Based on the GPT2w Model
by Fei Yang, Jiming Guo, Xiaolin Meng, Junbo Shi and Lv Zhou
Remote Sens. 2019, 11(9), 1127; https://doi.org/10.3390/rs11091127 - 10 May 2019
Cited by 7 | Viewed by 3481
Abstract
With the development of Global Navigation Satellite System (GNSS) reference station networks that provide rich data sources containing atmospheric information, the precipitable water vapor (PWV) retrieved from GNSS remote sensing has become one of the most important bodies of data in many meteorological [...] Read more.
With the development of Global Navigation Satellite System (GNSS) reference station networks that provide rich data sources containing atmospheric information, the precipitable water vapor (PWV) retrieved from GNSS remote sensing has become one of the most important bodies of data in many meteorological departments. GNSS stations are distributed in the form of scatters, generally, these separations range from a few kilometers to tens of kilometers. Therefore, the spatial resolution of GNSS-PWV can restrict some applications such as interferometric synthetic aperture radar (InSAR) atmospheric calibration and regional atmospheric water vapor analysis, which inevitably require the spatial interpolation of GNSS-PWV. This paper explored a PWV interpolation scheme based on the GPT2w model, which requires no meteorological data at an interpolation station and no regression analysis of the observation data. The PWV interpolation experiment was conducted in Hong Kong by different interpolation schemes, which differed in whether the impact of elevation was considered and whether the GPT2w model was added. In this paper, we adopted three skill scores, i.e., compound relative error (CRE), mean absolute error (MAE), and root mean square error (RMSE), and two approaches, i.e., station cross-validation and grid data validation, for our comparison. Numerical results showed that the interpolation schemes adding the GPT2w model could greatly improve the PWV interpolation accuracy when compared to the traditional schemes, especially at interpolation points away from the elevation range of reference stations. Moreover, this paper analyzed the PWV interpolation results under different weather conditions, at different locations, and on different days. Full article
(This article belongs to the Special Issue GPS/GNSS for Earth Science and Applications)
Show Figures

Graphical abstract

15 pages, 2684 KiB  
Article
A Rapid and Automated Urban Boundary Extraction Method Based on Nighttime Light Data in China
by Xiaojiang Liu, Xiaogang Ning, Hao Wang, Chenggang Wang, Hanchao Zhang and Jing Meng
Remote Sens. 2019, 11(9), 1126; https://doi.org/10.3390/rs11091126 - 10 May 2019
Cited by 24 | Viewed by 3770
Abstract
As urbanization has progressed over the past 40 years, continuous population growth and the rapid expansion of urban land use have caused some regions to experience various problems, such as insufficient resources and issues related to the environmental carrying capacity. The urbanization process [...] Read more.
As urbanization has progressed over the past 40 years, continuous population growth and the rapid expansion of urban land use have caused some regions to experience various problems, such as insufficient resources and issues related to the environmental carrying capacity. The urbanization process can be understood using nighttime light data to quickly and accurately extract urban boundaries at large scales. A new method is proposed here to quickly and accurately extract urban boundaries using nighttime light imagery. Three types of nighttime light data from the DMSP/OLS (US military’s defense meteorological satellite), NPP-VIIRS (National Polar-orbiting Partnership-Visible Infrared Imaging Radiometer Suite), and Luojia1-01 data sets are selected, and the high-precision urban boundaries obtained from a high-resolution image are selected as the true value. Next, 15 cities are selected as the training samples, and the Jaccard coefficient is introduced. The spatial data comparison method is then used to determine the optimal threshold function for the urban boundary extraction. Alternative high-precision urban boundary truth-values for the 13 cities are then selected, and the accuracy of the urban boundary extraction results obtained using the optimal threshold function and the mutation detection method are evaluated. The following observations are made from the results: (i) The average relative errors for the urban boundary extraction results based on the three nighttime light data sources (DMSP/OLS, NPP-VIIRS, and Luojia1-01) using the optimal threshold functions are 29%, 20%, and 39%, respectively. Compared with the mutation detection method, these relative errors are reduced by 83%, 18%, and 77%, respectively; (ii) The average overall classification accuracies of the extracted urban boundaries are 95%, 96%, and 93%, respectively, which are 5%, 1%, and 7% higher than those for the mutation detection method; (iii) The average Kappa coefficients of the extracted urban boundaries are 61%, 71%, and 61%, respectively, which are 5%, 4%, and 12% higher than for the mutation detection method. Full article
(This article belongs to the Special Issue Advances in Remote Sensing with Nighttime Lights)
Show Figures

Graphical abstract

20 pages, 9960 KiB  
Article
Surfaces of Revolution (SORs) Reconstruction Using a Self-Adaptive Generatrix Line Extraction Method from Point Clouds
by Xianglei Liu, Ming Huang, Shanlei Li and Chaoshuai Ma
Remote Sens. 2019, 11(9), 1125; https://doi.org/10.3390/rs11091125 - 10 May 2019
Cited by 2 | Viewed by 3285
Abstract
This paper presents an automatic reconstruction algorithm of surfaces of revolution (SORs) with a self-adaptive method for generatrix line extraction from point clouds. The proposed method does not need to calculate the normal of point clouds, which can greatly improve the efficiency and [...] Read more.
This paper presents an automatic reconstruction algorithm of surfaces of revolution (SORs) with a self-adaptive method for generatrix line extraction from point clouds. The proposed method does not need to calculate the normal of point clouds, which can greatly improve the efficiency and accuracy of SORs reconstruction. Firstly, the rotation axis of a SOR is automatically extracted by a minimum relative deviation among the three axial directions for both tall-thin and short-wide SORs. Secondly, the projection profile of a SOR is extracted by the triangulated irregular network (TIN) model and random sample consensus (RANSAC) algorithm. Thirdly, the point set of a generatrix line of a SOR is determined by searching for the extremum of coordinate Z, together with overflow points processing, and further determines the type of generatrix line by the smaller RMS errors between linear fitting and quadratic curve fitting. In order to validate the efficiency and accuracy of the proposed method, two kinds of SORs, simple SORs with a straight generatrix line and complex SORs with a curved generatrix line are selected for comparison analysis in the paper. The results demonstrate that the proposed method is robust and can reconstruct SORs with a higher accuracy and efficiency based on the point clouds. Full article
(This article belongs to the Special Issue Point Cloud Processing in Remote Sensing)
Show Figures

Figure 1

21 pages, 8939 KiB  
Technical Note
FORCE—Landsat + Sentinel-2 Analysis Ready Data and Beyond
by David Frantz
Remote Sens. 2019, 11(9), 1124; https://doi.org/10.3390/rs11091124 - 10 May 2019
Cited by 159 | Viewed by 15140
Abstract
Ever increasing data volumes of satellite constellations call for multi-sensor analysis ready data (ARD) that relieve users from the burden of all costly preprocessing steps. This paper describes the scientific software FORCE (Framework for Operational Radiometric Correction for Environmental monitoring), an ‘all-in-one’ solution [...] Read more.
Ever increasing data volumes of satellite constellations call for multi-sensor analysis ready data (ARD) that relieve users from the burden of all costly preprocessing steps. This paper describes the scientific software FORCE (Framework for Operational Radiometric Correction for Environmental monitoring), an ‘all-in-one’ solution for the mass-processing and analysis of Landsat and Sentinel-2 image archives. FORCE is increasingly used to support a wide range of scientific to operational applications that are in need of both large area, as well as deep and dense temporal information. FORCE is capable of generating Level 2 ARD, and higher-level products. Level 2 processing is comprised of state-of-the-art cloud masking and radiometric correction (including corrections that go beyond ARD specification, e.g., topographic or bidirectional reflectance distribution function correction). It further includes data cubing, i.e., spatial reorganization of the data into a non-overlapping grid system for enhanced efficiency and simplicity of ARD usage. However, the usage barrier of Level 2 ARD is still high due to the considerable data volume and spatial incompleteness of valid observations (e.g., clouds). Thus, the higher-level modules temporally condense multi-temporal ARD into manageable amounts of spatially seamless data. For data mining purposes, per-pixel statistics of clear sky data availability can be generated. FORCE provides functionality for compiling best-available-pixel composites and spectral temporal metrics, which both utilize all available observations within a defined temporal window using selection and statistical aggregation techniques, respectively. These products are immediately fit for common Earth observation analysis workflows, such as machine learning-based image classification, and are thus referred to as highly analysis ready data (hARD). FORCE provides data fusion functionality to improve the spatial resolution of (i) coarse continuous fields like land surface phenology and (ii) Landsat ARD using Sentinel-2 ARD as prediction targets. Quality controlled time series preparation and analysis functionality with a number of aggregation and interpolation techniques, land surface phenology retrieval, and change and trend analyses are provided. Outputs of this module can be directly ingested into a geographic information system (GIS) to fuel research questions without any further processing, i.e., hARD+. FORCE is open source software under the terms of the GNU General Public License v. >= 3, and can be downloaded from http://force.feut.de. Full article
(This article belongs to the Section Remote Sensing Image Processing)
Show Figures

Graphical abstract

20 pages, 17514 KiB  
Article
Automatic Post-Disaster Damage Mapping Using Deep-Learning Techniques for Change Detection: Case Study of the Tohoku Tsunami
by Jérémie Sublime and Ekaterina Kalinicheva
Remote Sens. 2019, 11(9), 1123; https://doi.org/10.3390/rs11091123 - 10 May 2019
Cited by 90 | Viewed by 8040
Abstract
Post-disaster damage mapping is an essential task following tragic events such as hurricanes, earthquakes, and tsunamis. It is also a time-consuming and risky task that still often requires the sending of experts on the ground to meticulously map and assess the damages. Presently, [...] Read more.
Post-disaster damage mapping is an essential task following tragic events such as hurricanes, earthquakes, and tsunamis. It is also a time-consuming and risky task that still often requires the sending of experts on the ground to meticulously map and assess the damages. Presently, the increasing number of remote-sensing satellites taking pictures of Earth on a regular basis with programs such as Sentinel, ASTER, or Landsat makes it easy to acquire almost in real time images from areas struck by a disaster before and after it hits. While the manual study of such images is also a tedious task, progress in artificial intelligence and in particular deep-learning techniques makes it possible to analyze such images to quickly detect areas that have been flooded or destroyed. From there, it is possible to evaluate both the extent and the severity of the damages. In this paper, we present a state-of-the-art deep-learning approach for change detection applied to satellite images taken before and after the Tohoku tsunami of 2011. We compare our approach with other machine-learning methods and show that our approach is superior to existing techniques due to its unsupervised nature, good performance, and relative speed of analysis. Full article
(This article belongs to the Section Remote Sensing Image Processing)
Show Figures

Graphical abstract

21 pages, 13168 KiB  
Article
Quality Assessment and Glaciological Applications of Digital Elevation Models Derived from Space-Borne and Aerial Images over Two Tidewater Glaciers of Southern Spitsbergen
by Małgorzata Błaszczyk, Dariusz Ignatiuk, Mariusz Grabiec, Leszek Kolondra, Michał Laska, Leo Decaux, Jacek Jania, Etienne Berthier, Bartłomiej Luks, Barbara Barzycka and Mateusz Czapla
Remote Sens. 2019, 11(9), 1121; https://doi.org/10.3390/rs11091121 - 10 May 2019
Cited by 29 | Viewed by 5808
Abstract
In this study, we assess the accuracy and precision of digital elevation models (DEM) retrieved from aerial photographs taken in 2011 and from Very High Resolution satellite images (WorldView-2 and Pléiades) from the period 2012–2017. Additionally, the accuracy of the freely available Strip [...] Read more.
In this study, we assess the accuracy and precision of digital elevation models (DEM) retrieved from aerial photographs taken in 2011 and from Very High Resolution satellite images (WorldView-2 and Pléiades) from the period 2012–2017. Additionally, the accuracy of the freely available Strip product of ArcticDEM was verified. We use the DEMs to characterize geometry changes over Hansbreen and Hornbreen, two tidewater glaciers in southern Spitsbergen, Svalbard. The satellite-based DEMs from WorldView-2 and Pléiades stereo pairs were processed using the Rational Function Model (RFM) without and with one ground control point. The elevation quality of the DEMs over glacierized areas was validated with in situ data: static differential GPS survey of mass balance stakes and GPS kinematic data acquired during ground penetrating radar survey. Results demonstrate the usefulness of the analyzed sources of DEMs for estimation of the total geodetic mass balance of the Svalbard glaciers. DEM accuracy is sufficient to investigate glacier surface elevation changes above 1 m. Strips from the ArcticDEM are generally precise, but some of them showed gross errors and need to be handled with caution. The surface of Hansbreen and Hornbreen has been lowering in recent years. The average annual elevation changes for Hansbreen were more negative in the period 2015–2017 (−2.4 m a−1) than in the period 2011–2015 (−1.7 m a−1). The average annual elevation changes over the studied area of Hornbreen for the period 2012–2017 amounted to −1.6 m a−1. The geodetic mass balance for Hansbreen was more negative than the climatic mass balance estimated using the mass budget method, probably due to underestimation of the ice discharge. From 2011 to 2017, Hansbreen lost on average over 1% of its volume each year. Such a high rate of relative loss illustrates how fast these glaciers are responding to climate change. Full article
(This article belongs to the Special Issue Remote Sensing of Glaciers at Global and Regional Scales)
Show Figures

Graphical abstract

11 pages, 9243 KiB  
Article
Satellite Cross-Talk Impact Analysis in Airborne Interferometric Global Navigation Satellite System-Reflectometry with the Microwave Interferometric Reflectometer
by Raul Onrubia, Daniel Pascual, Hyuk Park, Adriano Camps, Christoph Rüdiger, Jeffrey P. Walker and Alessandra Monerris
Remote Sens. 2019, 11(9), 1120; https://doi.org/10.3390/rs11091120 - 10 May 2019
Cited by 15 | Viewed by 3691
Abstract
This work analyzes the satellite cross-talk observed by the microwave interferometric reflectometer (MIR), a new global navigation satellite system (GNSS) reflectometer, during an airborne field campaign in Victoria and New South Wales, Australia. MIR is a GNSS reflectometer with two 19-element, dual-band arrays, [...] Read more.
This work analyzes the satellite cross-talk observed by the microwave interferometric reflectometer (MIR), a new global navigation satellite system (GNSS) reflectometer, during an airborne field campaign in Victoria and New South Wales, Australia. MIR is a GNSS reflectometer with two 19-element, dual-band arrays, each of them having four steerable beams. The data collected during the experiment, the characterization of the arrays, and the global positioning system (GPS) and Galileo ephemeris were used to compute the expected delays and power levels of all incoming signals, and the probability of cross-talk was then evaluated. Despite the MIR highly directive arrays, the largest ever for a GNSS-R instrument, one of the flights was found to be contaminated by cross-talk almost half of the time at the L1/E1 frequency band, and all four flights were contaminated ∼5–10% of the time at the L5/E5a frequency band. The cross-talk introduces an error of up to 40 cm of standard deviation for altimetric applications and about 0.24 dB for scatterometric applications. Full article
(This article belongs to the Special Issue Radio Frequency Interference (RFI) in Microwave Remote Sensing)
Show Figures

Graphical abstract

22 pages, 6599 KiB  
Article
Improving Jujube Fruit Tree Yield Estimation at the Field Scale by Assimilating a Single Landsat Remotely-Sensed LAI into the WOFOST Model
by Tiecheng Bai, Nannan Zhang, Benoit Mercatoris and Youqi Chen
Remote Sens. 2019, 11(9), 1119; https://doi.org/10.3390/rs11091119 - 10 May 2019
Cited by 14 | Viewed by 4185
Abstract
Few studies were focused on yield estimation of perennial fruit tree crops by integrating remotely-sensed information into crop models. This study presented an attempt to assimilate a single leaf area index (LAI) near to maximum vegetative development stages derived from Landsat satellite data [...] Read more.
Few studies were focused on yield estimation of perennial fruit tree crops by integrating remotely-sensed information into crop models. This study presented an attempt to assimilate a single leaf area index (LAI) near to maximum vegetative development stages derived from Landsat satellite data into a calibrated WOFOST model to predict yields for jujube fruit trees at the field scale. Field experiments were conducted in three growth seasons to calibrate input parameters for WOFOST model, with a validated phenology error of −2, −3, and −3 days for emergence, flowering, and maturity, as well as an R2 of 0.986 and RMSE of 0.624 t ha−1 for total aboveground biomass (TAGP), R2 of 0.95 and RMSE of 0.19 m2 m−2 for LAI, respectively. Normalized Difference Vegetation Index (NDVI) showed better performance for LAI estimation than a Soil-adjusted Vegetation Index (SAVI), with a better agreement (R2 = 0.79) and prediction accuracy (RMSE = 0.17 m2 m−2). The assimilation after forcing LAI improved the yield prediction accuracy compared with unassimilated simulation and remotely sensed NDVI regression method, showing a R2 of 0.62 and RMSE of 0.74 t ha−1 for 2016, and R2 of 0.59 and RMSE of 0.87 t ha−1 for 2017. This research would provide a strategy to employ remotely sensed state variables and a crop growth model to improve field-scale yield estimates for fruit tree crops. Full article
Show Figures

Graphical abstract

16 pages, 5278 KiB  
Article
Present-Day Deformation of the Gyaring Co Fault Zone, Central Qinghai–Tibet Plateau, Determined Using Synthetic Aperture Radar Interferometry
by Yong Zhang, Chuanjin Liu, Wenting Zhang and Fengyun Jiang
Remote Sens. 2019, 11(9), 1118; https://doi.org/10.3390/rs11091118 - 10 May 2019
Cited by 10 | Viewed by 3806
Abstract
Because of the constant northward movement of the Indian plate and blockage of the Eurasian continent, the Qinghai–Tibet Plateau has been extruded by north–south compressive stresses since its formation. This has caused the plateau to escape eastward to form a large-scale east–west strike-slip [...] Read more.
Because of the constant northward movement of the Indian plate and blockage of the Eurasian continent, the Qinghai–Tibet Plateau has been extruded by north–south compressive stresses since its formation. This has caused the plateau to escape eastward to form a large-scale east–west strike-slip fault and a north–south extensional tectonic system. The Karakorum–Jiali fault, a boundary fault between the Qiangtang and Lhasa terranes, plays an important role in the regional tectonic evolution of the Qinghai–Tibet Plateau. The Gyaring Co fault, in the middle of the Karakoram–Jiali fault zone, is a prominent tectonic component. There have been cases of strong earthquakes of magnitude 7 or greater in this fault, providing a strong earthquake occurrence background. However, current seismic activity is weak. Regional geodetic observation stations are sparsely distributed; thus, the slip rate of the Gyaring Co fault remains unknown. Based on interferometric synthetic aperture radar (InSAR) technology, we acquired current high-spatial resolution crustal deformation characteristics of the Gyaring Co fault zone. The InSAR-derived deformation features were highly consistent with Global Positioning System observational results, and the accuracy of the InSAR deformation fields was within 2 mm/y. According to InSAR results, the Gyaring Co fault controlled the regional crustal deformation pattern, and the difference in far-field deformation on both sides of the fault was 3–5 mm/y (parallel to the fault). The inversion results of the back-slip dislocation model indicated that the slip rate of the Gyaring Co fault was 3–6 mm/y, and the locking depth was ~20 km. A number of v-shaped conjugate strike-slip faults, formed along the Bangong–Nujiang suture zone in the central and southern parts of the -Tibet Plateau, played an important role in regional tectonic evolution. V-shaped conjugate shear fault systems include the Gyaring Co and Doma–Nima faults, and the future seismic risk cannot be ignored. Full article
(This article belongs to the Special Issue Environmental and Geodetic Monitoring of the Tibetan Plateau)
Show Figures

Graphical abstract

19 pages, 6971 KiB  
Article
Deep Learning Based Fossil-Fuel Power Plant Monitoring in High Resolution Remote Sensing Images: A Comparative Study
by Haopeng Zhang and Qin Deng
Remote Sens. 2019, 11(9), 1117; https://doi.org/10.3390/rs11091117 - 10 May 2019
Cited by 20 | Viewed by 5037
Abstract
The frequent hazy weather with air pollution in North China has aroused wide attention in the past few years. One of the most important pollution resource is the anthropogenic emission by fossil-fuel power plants. To relieve the pollution and assist urban environment monitoring, [...] Read more.
The frequent hazy weather with air pollution in North China has aroused wide attention in the past few years. One of the most important pollution resource is the anthropogenic emission by fossil-fuel power plants. To relieve the pollution and assist urban environment monitoring, it is necessary to continuously monitor the working status of power plants. Satellite or airborne remote sensing provides high quality data for such tasks. In this paper, we design a power plant monitoring framework based on deep learning to automatically detect the power plants and determine their working status in high resolution remote sensing images (RSIs). To this end, we collected a dataset named BUAA-FFPP60 containing RSIs of over 60 fossil-fuel power plants in the Beijing-Tianjin-Hebei region in North China, which covers about 123 km 2 of an urban area. We compared eight state-of-the-art deep learning models and comprehensively analyzed their performance on accuracy, speed, and hardware cost. Experimental results illustrate that our deep learning based framework can effectively detect the fossil-fuel power plants and determine their working status with mean average precision up to 0.8273, showing good potential for urban environment monitoring. Full article
(This article belongs to the Special Issue Deep Learning Approaches for Urban Sensing Data Analytics)
Show Figures

Graphical abstract

19 pages, 4033 KiB  
Article
Label Noise Cleansing with Sparse Graph for Hyperspectral Image Classification
by Qingming Leng, Haiou Yang and Junjun Jiang
Remote Sens. 2019, 11(9), 1116; https://doi.org/10.3390/rs11091116 - 10 May 2019
Cited by 11 | Viewed by 3740
Abstract
In a real hyperspectral image classification task, label noise inevitably exists in training samples. To deal with label noise, current methods assume that noise obeys the Gaussian distribution, which is not the real case in practice, because in most cases, we are more [...] Read more.
In a real hyperspectral image classification task, label noise inevitably exists in training samples. To deal with label noise, current methods assume that noise obeys the Gaussian distribution, which is not the real case in practice, because in most cases, we are more likely to misclassify training samples at the boundaries between different classes. In this paper, we propose a spectral–spatial sparse graph-based adaptive label propagation (SALP) algorithm to address a more practical case, where the label information is contaminated by random noise and boundary noise. Specifically, the SALP mainly includes two steps: First, a spectral–spatial sparse graph is constructed to depict the contextual correlations between pixels within the same superpixel homogeneous region, which are generated by superpixel image segmentation, and then a transfer matrix is produced to describe the transition probability between pixels. Second, after randomly splitting training pixels into “clean” and “polluted,” we iteratively propagate the label information from “clean” to “polluted” based on the transfer matrix, and the relabeling strategy for each pixel is adaptively adjusted along with its spatial position in the corresponding homogeneous region. Experimental results on two standard hyperspectral image datasets show that the proposed SALP over four major classifiers can significantly decrease the influence of noisy labels, and our method achieves better performance compared with the baselines. Full article
(This article belongs to the Special Issue Robust Multispectral/Hyperspectral Image Analysis and Classification)
Show Figures

Graphical abstract

18 pages, 1284 KiB  
Technical Note
Pointing Accuracy of an Operational Polarimetric Weather Radar
by Michael Frech, Theodor Mammen and Bertram Lange
Remote Sens. 2019, 11(9), 1115; https://doi.org/10.3390/rs11091115 - 10 May 2019
Cited by 3 | Viewed by 3703
Abstract
Exact navigation of detected radar signals is crucial for usage of radar data in meteorological applications. The antenna pointing accuracy in azimuth and elevation of a polarimetric weather research radar depending on position of the sun is assessed using dedicated solar boxscans in [...] Read more.
Exact navigation of detected radar signals is crucial for usage of radar data in meteorological applications. The antenna pointing accuracy in azimuth and elevation of a polarimetric weather research radar depending on position of the sun is assessed using dedicated solar boxscans in a sequence of 10 min. The research radar of the German Meteorological Service (Deutscher Wetterdienst, DWD) is located at the meteorological observatory Hohenpeissenberg. It is identical to the 17 weather radars of the German weather radar network. A non-linear azimuthal variation of azimuthal pointing bias of up to 0.1 is found, which is significant as this is commonly viewed as the target pointing accuracy. This azimuthal variation can be attributed to the mechanical design of the drive train with the angle encoder. This includes the inherent backlash of the gear-drive assembly. The pointing bias estimates based on over 1000 boxscans from 26 days show a small case by case variability, which indicates that dedicated solar boxscans from one day are sufficient to characterize the pointing performance of a particular system. An azimuth and elevation range that is covered with this approach is limited and dependent on the time of the year. At Hohenpeißenberg, an azimuth range up to 50–300 was covered around summer solstice and about 90 boxscans were acquired. It is shown that the pointing bias based on solar boxscan data are consistent with results from the operational assessment of pointing bias using solar hits from operational scanning if we take into account the fact that the DWD operational scan definition has only a maximum elevation of 25 . The analysis of a full diurnal cycle of boxscans from four operational radar system shows that the azimuthal dependence of azimuth bias needs to be evaluated individually for each system. For one of the systems, the azimuthal variation of the pointing bias of about 0.2 seems related to the bull gear. A difference of the pointing bias for the horizontal and vertical polarization is an indication of beam squint and, eventually, that of a feed misalignment. Beam squint and, as such, the quality of the antenna assembly can easily be monitored with this method during the life-time of a weather radar. Full article
(This article belongs to the Special Issue Radar Polarimetry—Applications in Remote Sensing of the Atmosphere)
Show Figures

Graphical abstract

18 pages, 651 KiB  
Article
Kernel Joint Sparse Representation Based on Self-Paced Learning for Hyperspectral Image Classification
by Sixiu Hu, Jiangtao Peng, Yingxiong Fu and Luoqing Li
Remote Sens. 2019, 11(9), 1114; https://doi.org/10.3390/rs11091114 - 09 May 2019
Cited by 6 | Viewed by 2806
Abstract
By means of joint sparse representation (JSR) and kernel representation, kernel joint sparse representation (KJSR) models can effectively model the intrinsic nonlinear relations of hyperspectral data and better exploit spatial neighborhood structure to improve the classification performance of hyperspectral images. However, due to [...] Read more.
By means of joint sparse representation (JSR) and kernel representation, kernel joint sparse representation (KJSR) models can effectively model the intrinsic nonlinear relations of hyperspectral data and better exploit spatial neighborhood structure to improve the classification performance of hyperspectral images. However, due to the presence of noisy or inhomogeneous pixels around the central testing pixel in the spatial domain, the performance of KJSR is greatly affected. Motivated by the idea of self-paced learning (SPL), this paper proposes a self-paced KJSR (SPKJSR) model to adaptively learn weights and sparse coefficient vectors for different neighboring pixels in the kernel-based feature space. SPL strateges can learn a weight to indicate the difficulty of feature pixels within a spatial neighborhood. By assigning small weights for unimportant or complex pixels, the negative effect of inhomogeneous or noisy neighboring pixels can be suppressed. Hence, SPKJSR is usually much more robust. Experimental results on Indian Pines and Salinas hyperspectral data sets demonstrate that SPKJSR is much more effective than traditional JSR and KJSR models. Full article
Show Figures

Figure 1

28 pages, 14797 KiB  
Article
Evaluation of the Performance of SM2RAIN-Derived Rainfall Products over Brazil
by Franklin Paredes-Trejo, Humberto Barbosa and Carlos A. C. dos Santos
Remote Sens. 2019, 11(9), 1113; https://doi.org/10.3390/rs11091113 - 09 May 2019
Cited by 34 | Viewed by 4856
Abstract
Microwave-based satellite soil moisture products enable an innovative way of estimating rainfall using soil moisture observations with a bottom-up approach based on the inversion of the soil water balance Equation (SM2RAIN). In this work, the SM2RAIN-CCI (SM2RAIN-ASCAT) rainfall data obtained from the inversion [...] Read more.
Microwave-based satellite soil moisture products enable an innovative way of estimating rainfall using soil moisture observations with a bottom-up approach based on the inversion of the soil water balance Equation (SM2RAIN). In this work, the SM2RAIN-CCI (SM2RAIN-ASCAT) rainfall data obtained from the inversion of the microwave-based satellite soil moisture (SM) observations derived from the European Space Agency (ESA) Climate Change Initiative (CCI) (from the Advanced SCATterometer (ASCAT) soil moisture data) were evaluated against in situ rainfall observations under different bioclimatic conditions in Brazil. The research V7 version of the Tropical Rainfall Measurement Mission Multi-satellite Precipitation Analysis (TRMM TMPA) was also used as a state-of-the-art rainfall product with an up-bottom approach. Comparisons were made at daily and 0.25° scales, during the time-span of 2007–2015. The SM2RAIN-CCI, SM2RAIN-ASCAT, and TRMM TMPA products showed relatively good Pearson correlation values (R) with the gauge-based observations, mainly in the Caatinga (CAAT) and Cerrado (CER) biomes (R median > 0.55). SM2RAIN-ASCAT largely underestimated rainfall across the country, particularly over the CAAT and CER biomes (bias median < −16.05%), while SM2RAIN-CCI is characterized by providing rainfall estimates with only a slight bias (bias median: −0.20%), and TRMM TMPA tended to overestimate the amount of rainfall (bias median: 7.82%). All products exhibited the highest values of unbiased root mean square error (ubRMSE) in winter (DJF) when heavy rainfall events tend to occur more frequently, whereas the lowest values are observed in summer (JJA) with light rainfall events. The SM2RAIN-based products showed larger contribution of systematic error components than random error components, while the opposite was observed for TRMM TMPA. In general, both SM2RAIN-based rainfall products can be effectively used for some operational purposes on a daily scale, such as water resources management and agriculture, whether the bias is previously adjusted. Full article
(This article belongs to the Special Issue Precipitation and Water Cycle Measurements Using Remote Sensing)
Show Figures

Graphical abstract

Previous Issue
Next Issue
Back to TopTop