Letter

Volcanic Cloud Top Height Estimation Using the Plume Elevation Model Procedure Applied to Orthorectified Landsat 8 Data. Test Case: 26 October 2013 Mt. Etna Eruption

1
Bureau de Recherches Géologiques et Minières, 3 av. C. Guillemin, 45000 Orléans, France
2
Istituto Nazionale di Geofisica e Vulcanologia, Sez. Roma Via di Vigna Murata, 00100 Rome, Italy
3
Istituto Nazionale di Geofisica e Vulcanologia, Sez Catania, Piazza Roma, 95100 Catania, Italy
4
Laboratoire Interuniversitaire des Systèmes Atmosphériques, Université Paris-Est, 94000 Créteil, France
5
COMET, Atmospheric, Oceanic and Planetary Physics, University of Oxford, Clarendon Laboratory, Parks Road, Oxford OX1 3PU, UK
*
Author to whom correspondence should be addressed.
Remote Sens. 2019, 11(7), 785; https://doi.org/10.3390/rs11070785
Submission received: 22 January 2019 / Revised: 26 March 2019 / Accepted: 28 March 2019 / Published: 2 April 2019
(This article belongs to the Special Issue Remote Sensing of Volcanic Processes and Risk)

Abstract

:
In this study, we present a method for extracting the volcanic cloud top height (VCTH) as a plume elevation model (PEM) from orthorectified Landsat 8 data (Level 1). A similar methodology was previously applied to raw Landsat-8 data (Level 0). But level 0 data are not the standard product provided by the National Aeronautics and Space Administration (NASA)/United States Geological Survey (USGS). Level 0 data are available only on demand and consist on 14 data stripes multiplied by the number of multispectral bands. The standard product for Landsat 8 is the ortho image, available free of charge for end-users. Therefore, there is the need to adapt our previous methodology to Level 1 Landsat data. The advantages of using the standard Landsat products instead of raw data mainly include the fast -ready to use- availability of the data and free access to registered users, which is of major importance during volcanic crises. In this study, we adapt the PEM methodology to the standard Landsat-8 products, with the aim of simplifying the procedure for routine monitoring, offering an opportunity to produce PEM maps. In this study, we present the method. Our approach is applied to the 26 October 2013 Mt. Etna episodes comparing results independent VCTH measures from the spinning enhanced visible and infrared imager (SEVIRI) and the moderate resolution imaging spectroradiometer (MODIS).

Graphical Abstract

1. Introduction

In volcanology, the volcanic cloud-top height (VCTH) is one of the most critical parameters to retrieve. It affects the quantitative estimation of volcanic cloud ash and gases parameters [1,2,3], the mass eruption rate needed for the transport and deposition models [4,5,6] and the definition of the most dangerous zone for air traffic. Exploiting their global coverage (in time and space), satellite sensors offer the unique possibility for an effective monitoring of VCTH. In recent years, many techniques have been developed exploiting the dark pixel brightness temperature [2], the CO2 [7,8] and O2 [9,10] absorption bands, the radio occultation [11] and backward trajectory modelling [12]. Among the different techniques (for a complete review of advantages and drawbacks please refer to [13]) and satellite active systems as CALIPSO [14], several algorithms have been developed exploiting the parallax between remote sensing measurements collected by different views of the same object by using one or more instruments. The use of the parallax was introduced by Prata and Turner [15] using the dual view of the along track scanning radiometer (ATSR) and developed further by Mims et al. [16], Nelson et al. [17], and Flower and Kahn [18] using dedicated multiangle imager spectro radiometer (MISR) measurements. Zakšek et al. [19], Corradini et al. [20], and Merucci et al., [13] developed algorithms based on the combined use of polar-geostationary, ground based-geostationary and geostationary-geostationary measurements respectively.
De Michele et al. [21] generalized the method based on small parallax for virtually all push broom sensor data. The extraction of the VCTH in the form of a plume elevation model from the high-resolution push broom operational land imager (OLI) sensor on board a Landsat-8 satellite, has been demonstrated starting from raw data. The main idea expressed in [21] is that the physical distance between the panchromatic sensor (PAN) and the multi-spectral sensors (MS), both on Landsat-like satellites, yields a baseline and a time lag between the PAN and MS image acquisitions during a single passage of the satellite. This information can be used to extract a spatially detailed map of VCTH from virtually any multi spectral push broom system, called a plume elevation model (PEM).
The main difficulty of the data processing comes from the fact that one Landsat image is composed of 14 focal plane modules (FPMs) arranged in the so called ’staggered’ geometry, which makes the joint retrieval of plume velocities and heights challenging. De Michele et al. [21] addressed this problem by reconstructing a new OLI image starting from the raw OLI data stripes (courtesy of National Aeronautics and Space Administration (NASA), pers. comm.). However, the raw Landsat-8 data are not the standard Landsat-8 products provided by NASA/ United States Geological Survey (USGS). The raw data are available only on demand and consist of 14 data stripes (one data stripe for each FPM) multiplied by the number of multispectral bands. The standard product for Landsat 8 is the ortho image, available at no cost for the end-user. For PEM extractions, the advantages of using the standard Landsat products instead of the raw data mainly include the fast -ready to use- availability of the data, free to registered users, which is of major importance during volcanic crises. In this study, we adapt the methodology described in [21] to standard Landsat-8 products, with the aim of simplifying the procedure for routine use, thus widening the usability of this method for producing PEM maps. In this study, the procedure will be applied to the standard Landsat 8 data collected during the 26 October 2013 Mt. Etna eruptive episode and the results compared with those obtained using different satellites systems.
The paper is organized as follows: Section 1 outlines the 26 October 2013 Etna eruption and Section 2 describes the PEM procedure applied to the standard Landsat-8 products. In Section 3 the results obtained are compared with the VCTH retrieved from the PEM procedure applied to the estimations realized using the spinning enhanced visible and infrared imager (SEVIRI) and the moderate resolution imaging spectroradiometer (MODIS). In Section 4 and Section 5 the discussion and the conclusions are presented.

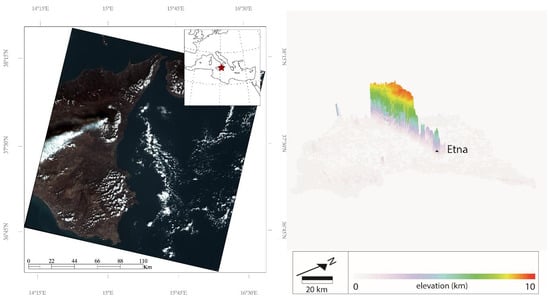
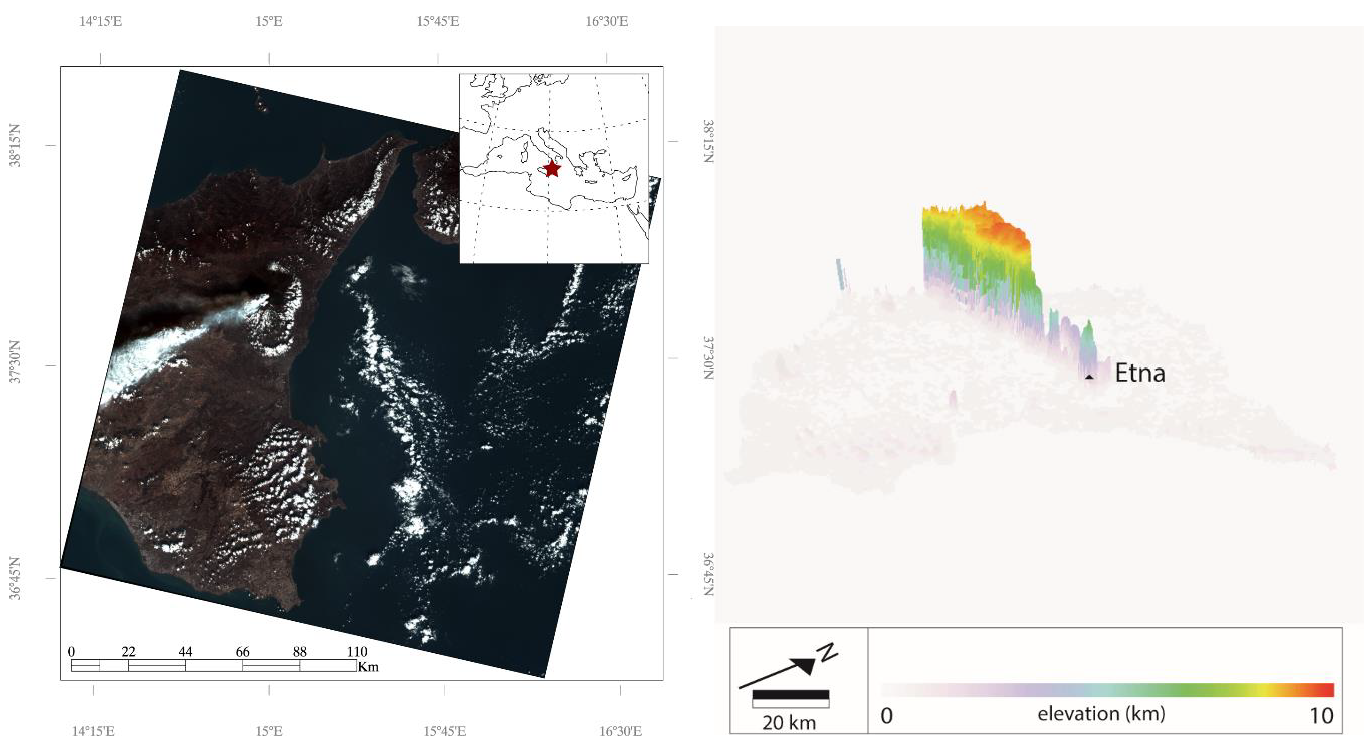
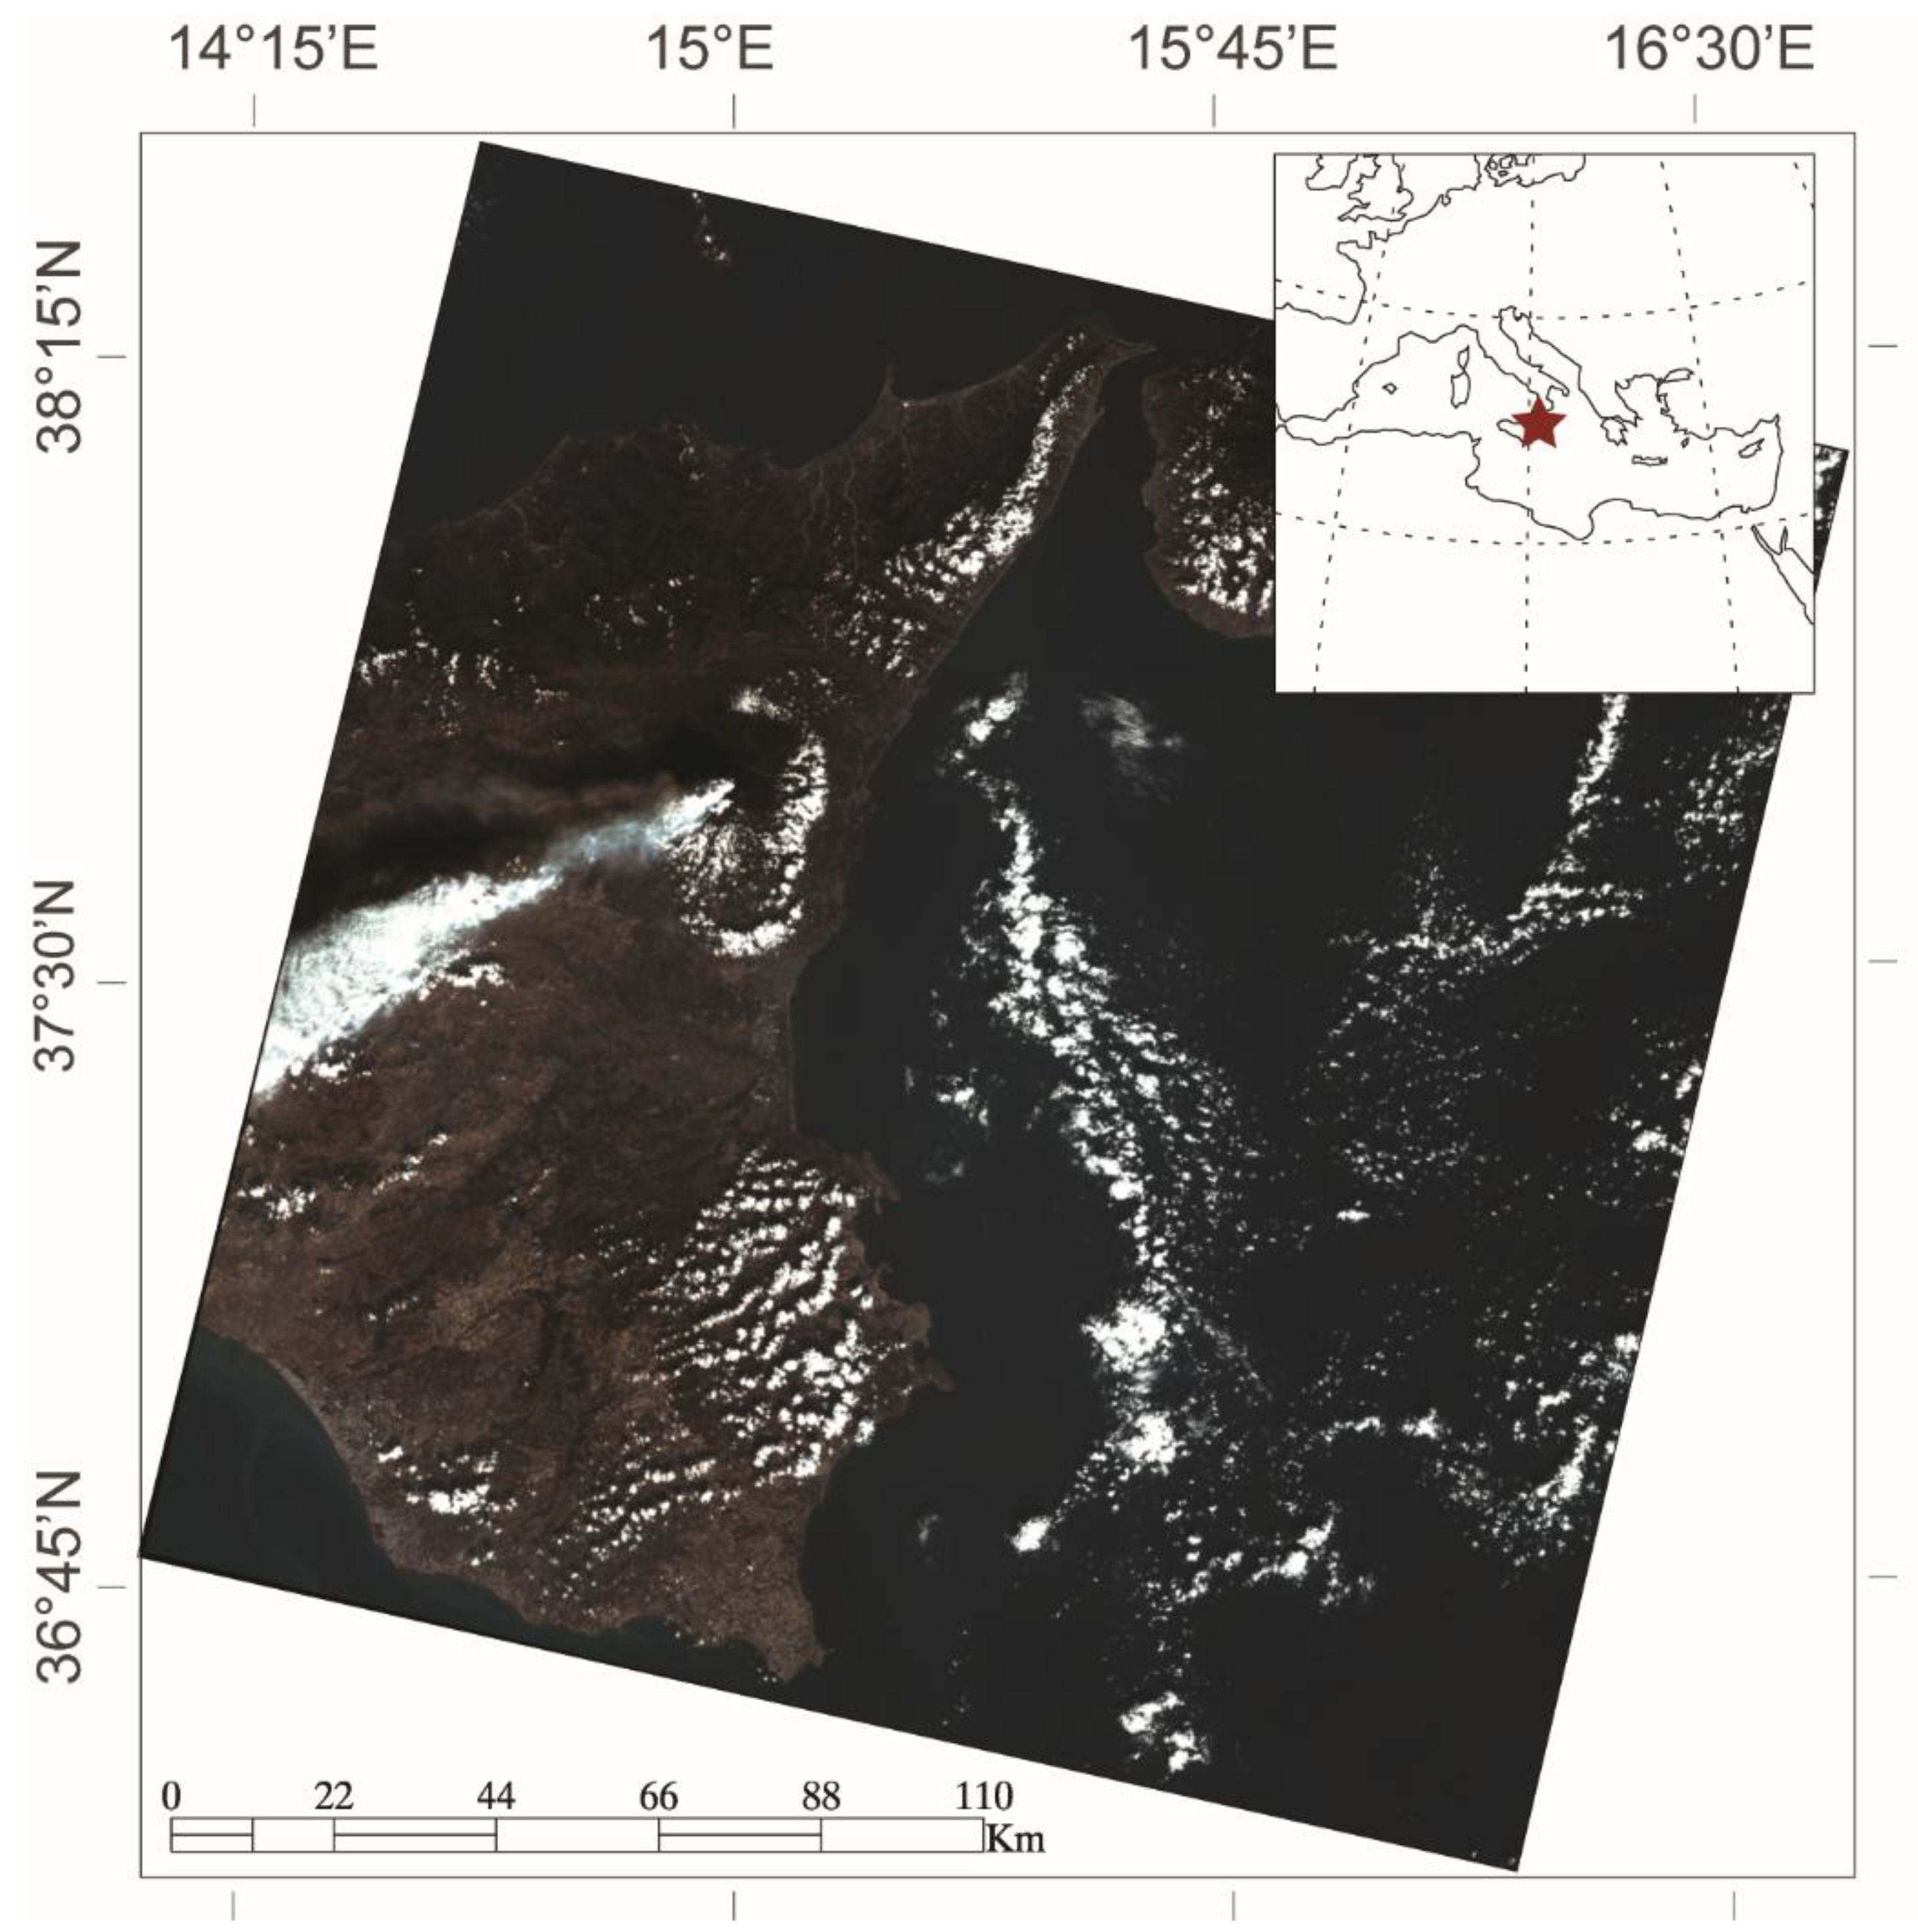
The 26 October 2013 Mt. Etna Eruption

Mt. Etna activity in 2013 was characterized by a sequence of 16 episodes of intense eruptive activity at the summit of the volcano, fed by the New Southeast Crater [22,23]. The 26 October 2013 episodes stand as the 14th of the year and the 39th paroxysm episode of the sequence started earlier in 2011 [24,25,26]. The eruption occurred after a few months of quiescence and started in the early morning on 25 October, displaying mild intra-crater Strombolian activity. On 26 October, the eruptive activity gradually increased in magnitude and frequency of explosions, and lava started pouring from the crater slowly expanding towards the Valle del Bove. In the early morning of 26 October, the explosion intensity increased markedly, and between 2:00 and 10:00 UTC the activity climaxed into a lava fountain. Over the paroxysm, the height of the lava fountain steadily reached ~200 m above the crater rim. A significant emission of gas, ash, and lapilli formed an eruptive column that rose convectively several kilometres above the summit of the volcano. The eruption ceased progressively in the late evening, and marked ash fall was reported to be dispersed by the wind southwest of the volcano proximally and distally down to the Ionian Mediterranean Sea [27]. Figure 1 shows the Orthorectified Landsat 8 image collected the 26 October 2013 at 09:37 UTC. The volcanic cloud is clearly visible.

2. Materials and Methods

The Landsat 8 OLI is a push-broom (linear array) imaging system that collects visible, near infra-red, and short-wave infra-red spectral band imagery at 30 m multi-spectral and 15 m panchromatic ground sample distances. It collects 190 km wide image swaths from ~705 km orbital altitude [28].
The OLI focal plane layout is very well described in [28] and [29]. The OLI detectors are distributed across 14 separate FPMs, each of which covers a portion of the 15° OLI cross-track field of view. Adjacent FPMs are offset in the along-track direction to allow for FPM-to-FPM overlap, avoiding any gaps in the cross-track coverage. The internal layout of all 14 FPMs is the same, with alternate FPMs being rotated by 180° to keep the active detector areas as close together as possible. This feature has the effect of inverting the along-track order of the spectral bands in adjacent FPMs. Consequently, this has the effect of inverting the signs of the cross-correlation measurements when calculating pixels offsets between PAN and MS bands, related to the volcanic cloud velocity and parallax.
The general concept of PEM methodology is that the PAN and the MS sensors on board a satellite platform cannot occupy the same position in the focal plane of the push-broom instrument. There is a physical separation between them. This separation yields a baseline and a time lag between the PAN and MS image acquisitions. Two directions are considered: The epipolar direction (EP), i.e., the azimuth direction of the satellite or the flight direction, and the perpendicular (P2E) to the EP direction. The pixel offset between PAN and MS in the EP direction is proportional to the height of the plume plus the pixel offset contribution induced by the motion of the plume itself in between the two acquisitions. The pixel offsets in the P2E direction, also controlled by the time lag, are proportional to the plume motion only, as there is no parallax in the P2E direction by definition. In principle, the offset in the P2E direction is proportional to movements of every feature in the imaged scene (e.g., meteorological clouds, lahars, rivers flow, ocean waves, vehicles). In our case study, we are interested in the volcanic cloud motion only. We use this latter information to compensate for the apparent parallax recorded in the EP offset.
If the data are downloaded in a staggered and orthorectified geometry, the processing is not straightforward, since FPMs are rotated 180°, and the offset analysis by cross-correlation would yield opposite signs at adjacent image stripes. This hampers the correct deployment of the method described in [21]. To avoid this inconvenience, we propose the following 5 step procedure:
  • The dataset is rotated, so that the columns of the image matrix are aligned to the nominal azimuth direction of the satellite reported in the ancillary data files.
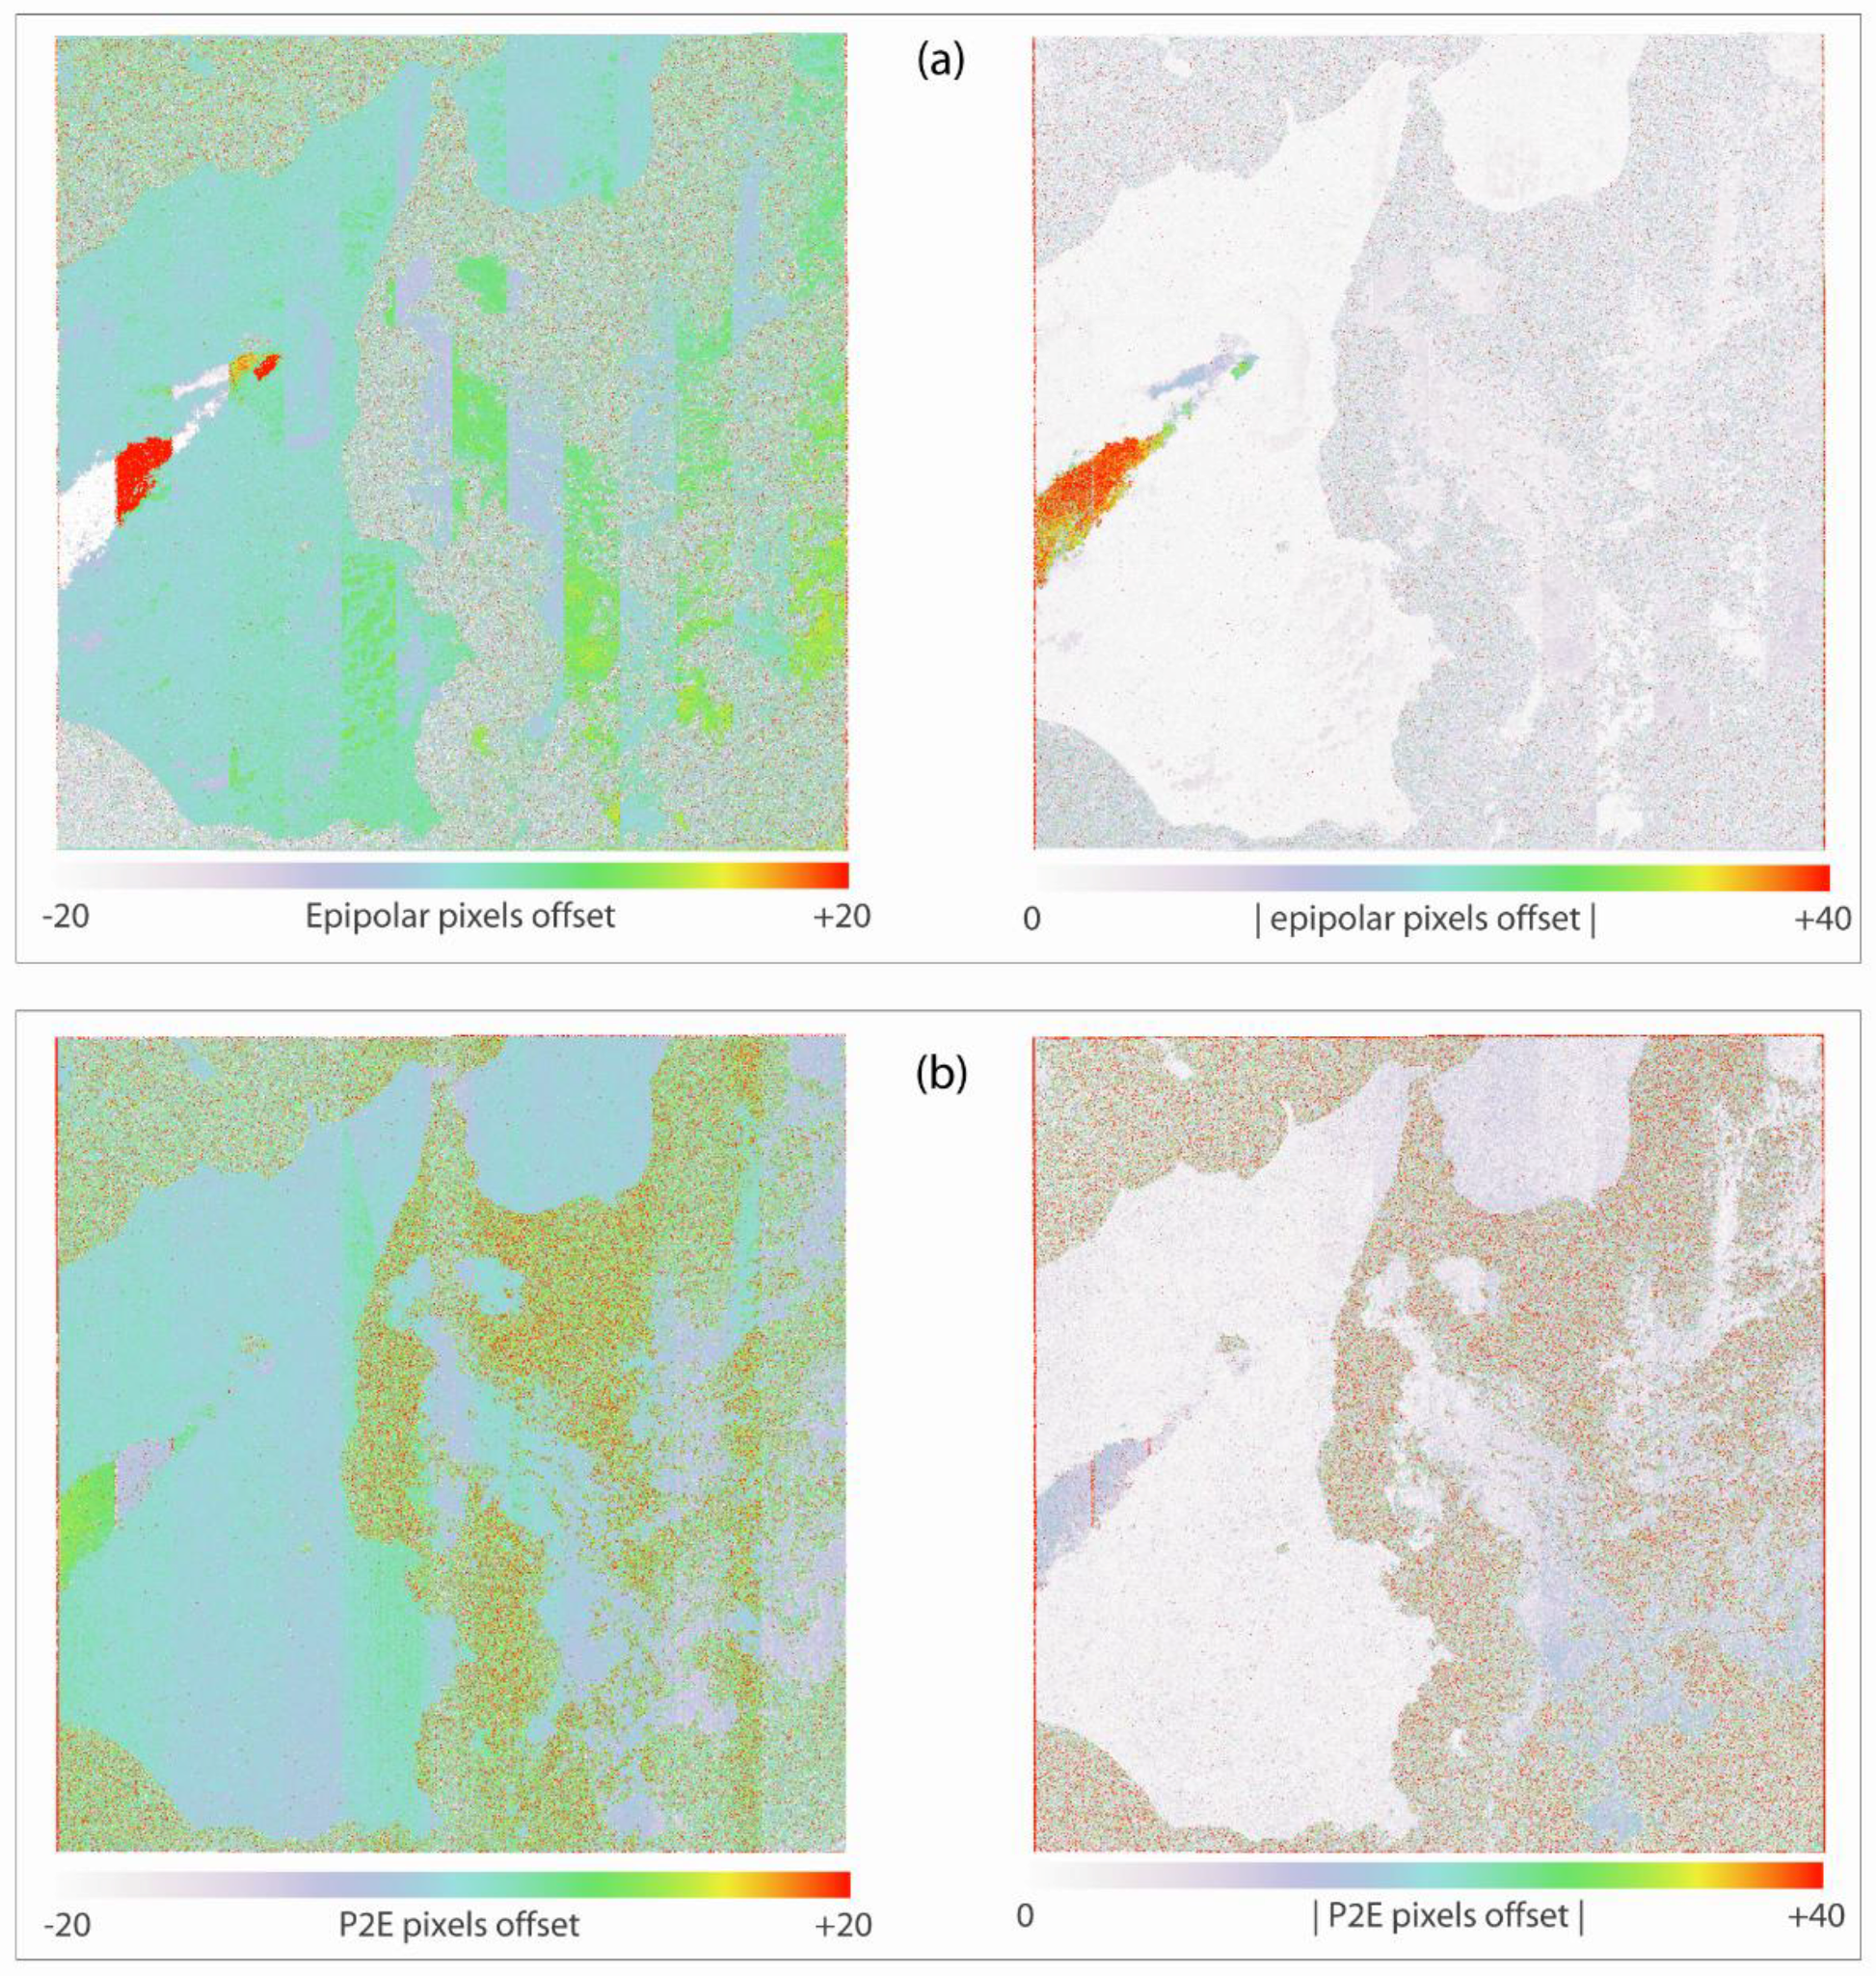
  • A correlator to perform pixel (or sub-pixel) offset measurements is used (e.g., [30]). If one considers the OLI image as a matrix made of lines and columns, offsets among lines are the EP offsets (Oe), while offsets among columns are the P2E offsets (Op2e). In the offset results, there could exist a ramp resulting from band mis-registration; the ramp, if found, is removed.
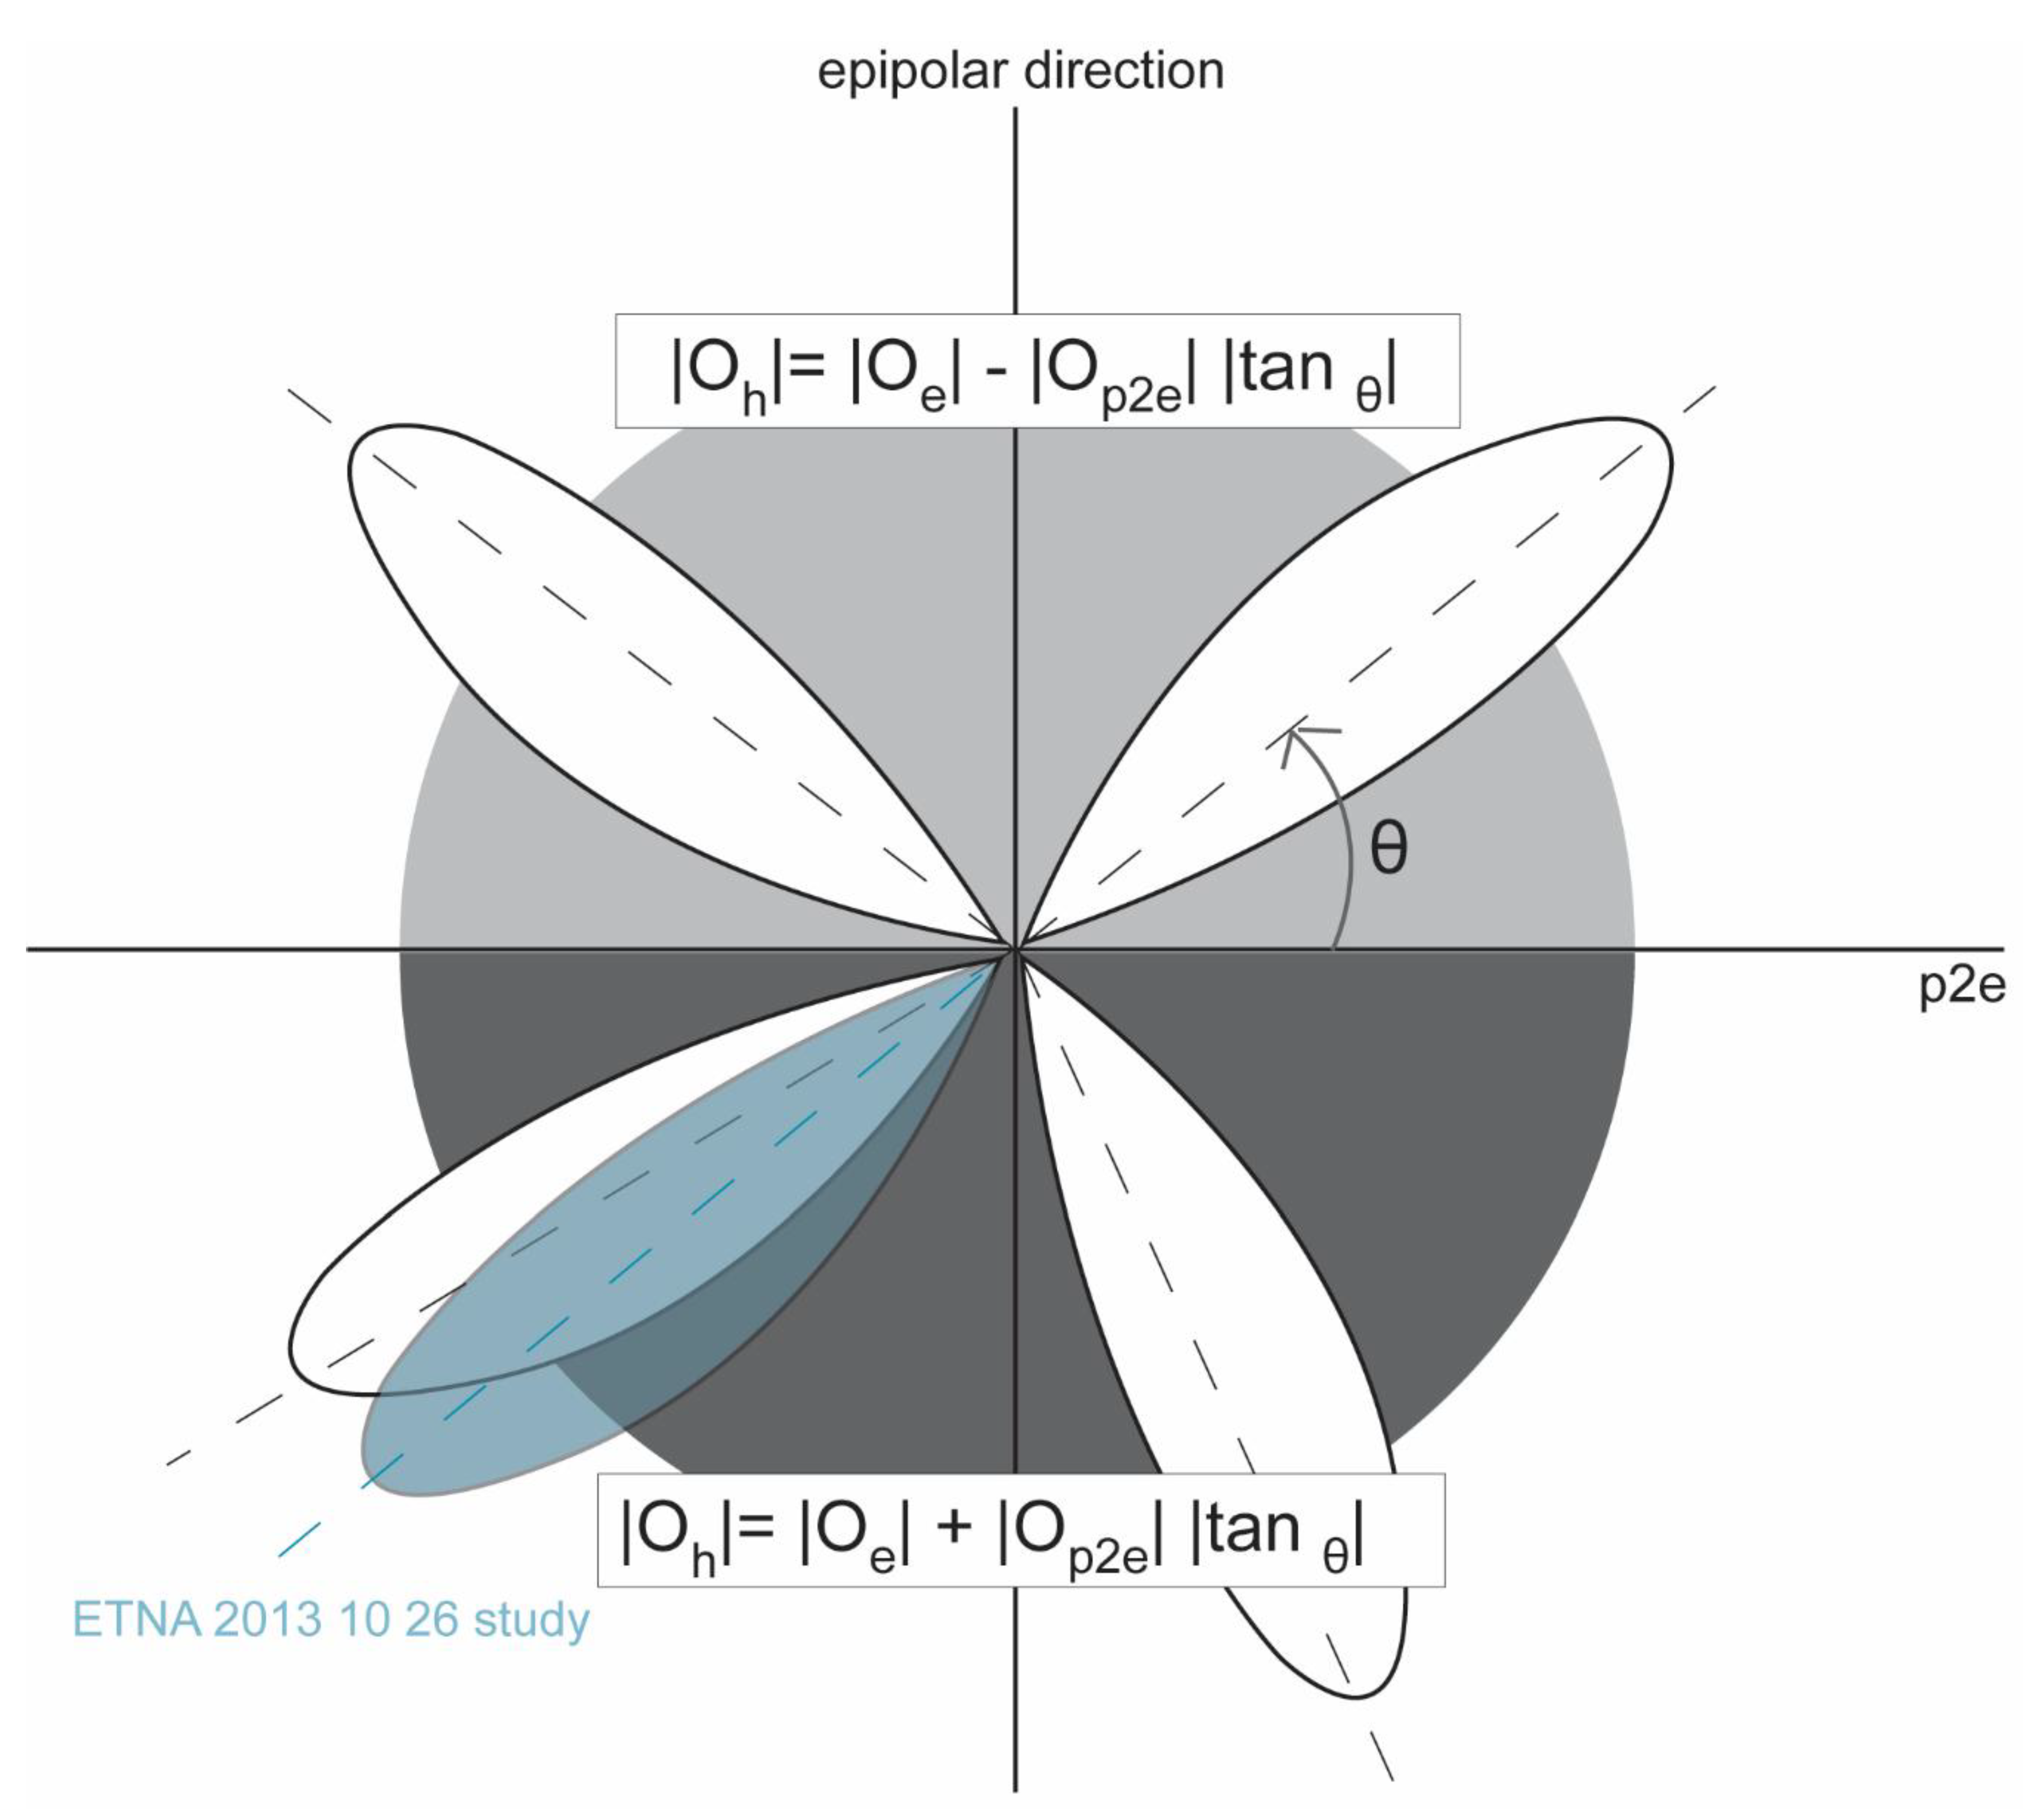
  • The direction of the plume is measured with respect to the azimuth direction, with the convention depicted in Figure 2.
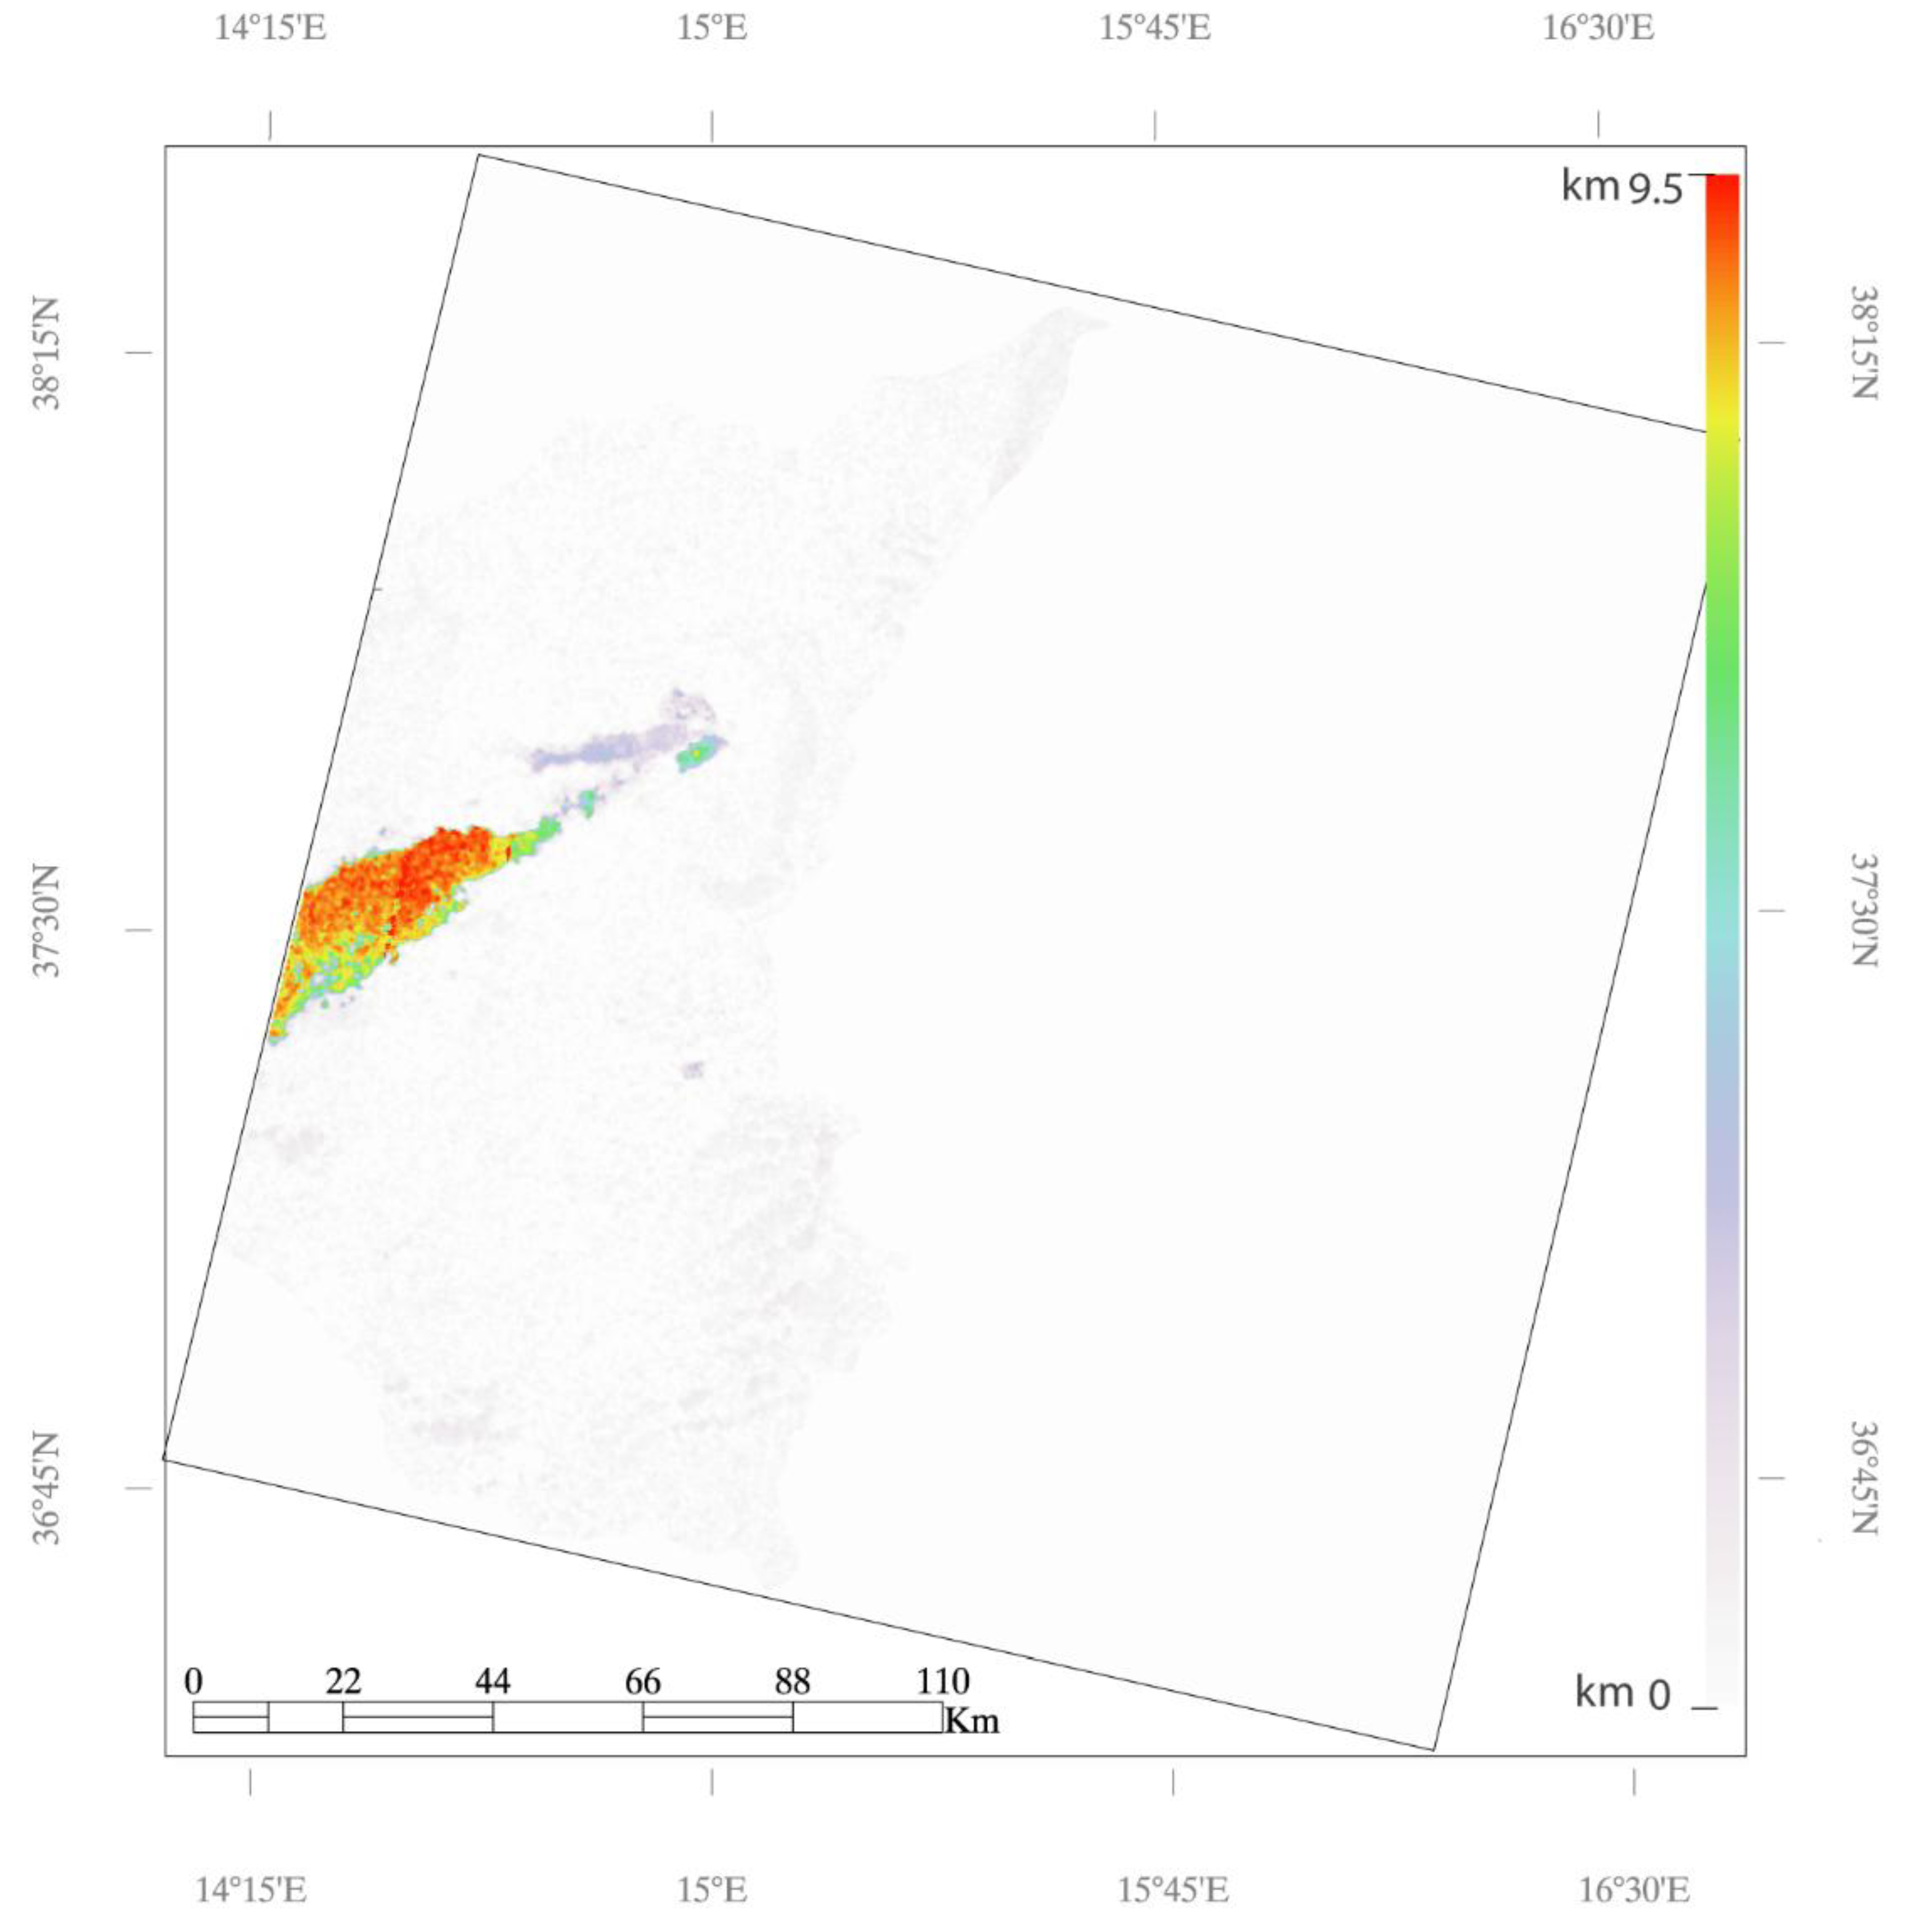
  • The absolute value of the pixel offsets due to the VCTH is calculated as Oh. Generally, Oh from staggered sensors should be calculated as follows:
    | O h | = | O e |   | O p 2 e |   | t a n   θ |
    if theta is between zero and 180, or
    | O h | = | O e | +   | O p 2 e |   | t a n   θ |
    if theta is between 180 and 360.
    Oh is then converted into a VCTH using the formula provided in [20]:
    h =   | O h | . s . H V . t
    for every pixel, which makes it a PEM. h is the plume height (m), s is the pixel size (m), V is the platform velocity (m/s), t is the temporal lag between the two Landsat 8 bands (s) and H is the platform height (m).
    Peculiar cases are: θ = 0° and θ = 180°. In these cases, the system is no longer sensitive to plume velocity. Therefore,
    | O h | =   | O e |
  • Finally, the results are re-rotated to their original position. Then, one has to choose a known reference altitude value on land and attribute it to the corresponding pixel. In our case study, we choose to set to zero the coastline close to the city of Catania.
Figure 3 shows the offsets results. We show the raw results of the correlator on the left sides and the corrected results on the right side. The vertical stripes on the left sides are due to volcanic (and non-volcanic) cloud velocities and parallax: As the FPMs are inverted 180°, the correlator yields velocities with sign opposition (as explained in the introduction). The correlation results are corrected by using | O e | ,   | O p 2 e | as described in the above paragraphs. The pixel offsets are expressed in meters. It is interesting to note that the P2E offset correspond to cloud (volcanic cloud and non-volcanic cloud) velocities, which values are comparable to the wind speed represented in Figure 6.

3. Results and Cross-Comparisons

Figure 4 shows the VCTH map obtained from the PEM procedure applied to the Landsat orthorectified data. The volcanic cloud height vary from about 6 up to 9.5 km above the sea level (a.s.l.) with the higher values that lie in the central region of the cloud.
The estimated VCTH has been compared the VCTH extracted by using different procedure applied to other satellite sensors. Note that the cross-comparison here is not used as a validation. It allows us to assess the consistency of the results (i.e., our results are in the same order/scale as independent measurements). A thorough validation is not possible since acquisition times (repeat cycle) of different sensors are not the same as Landsat. Since the VCTH evolves with time, we prefer to call it « cross-comparisons » rather than « validation ». In addition, different sensors acquire data from different positions, introducing a bias in the eventual validation campaign.
Here the VCTH of the Etna 26 October 2013 eruption, used for the cross-comparison with Landsat results, are estimated by using geostationary (SEVIRI) and polar (MODIS) satellite sensors.

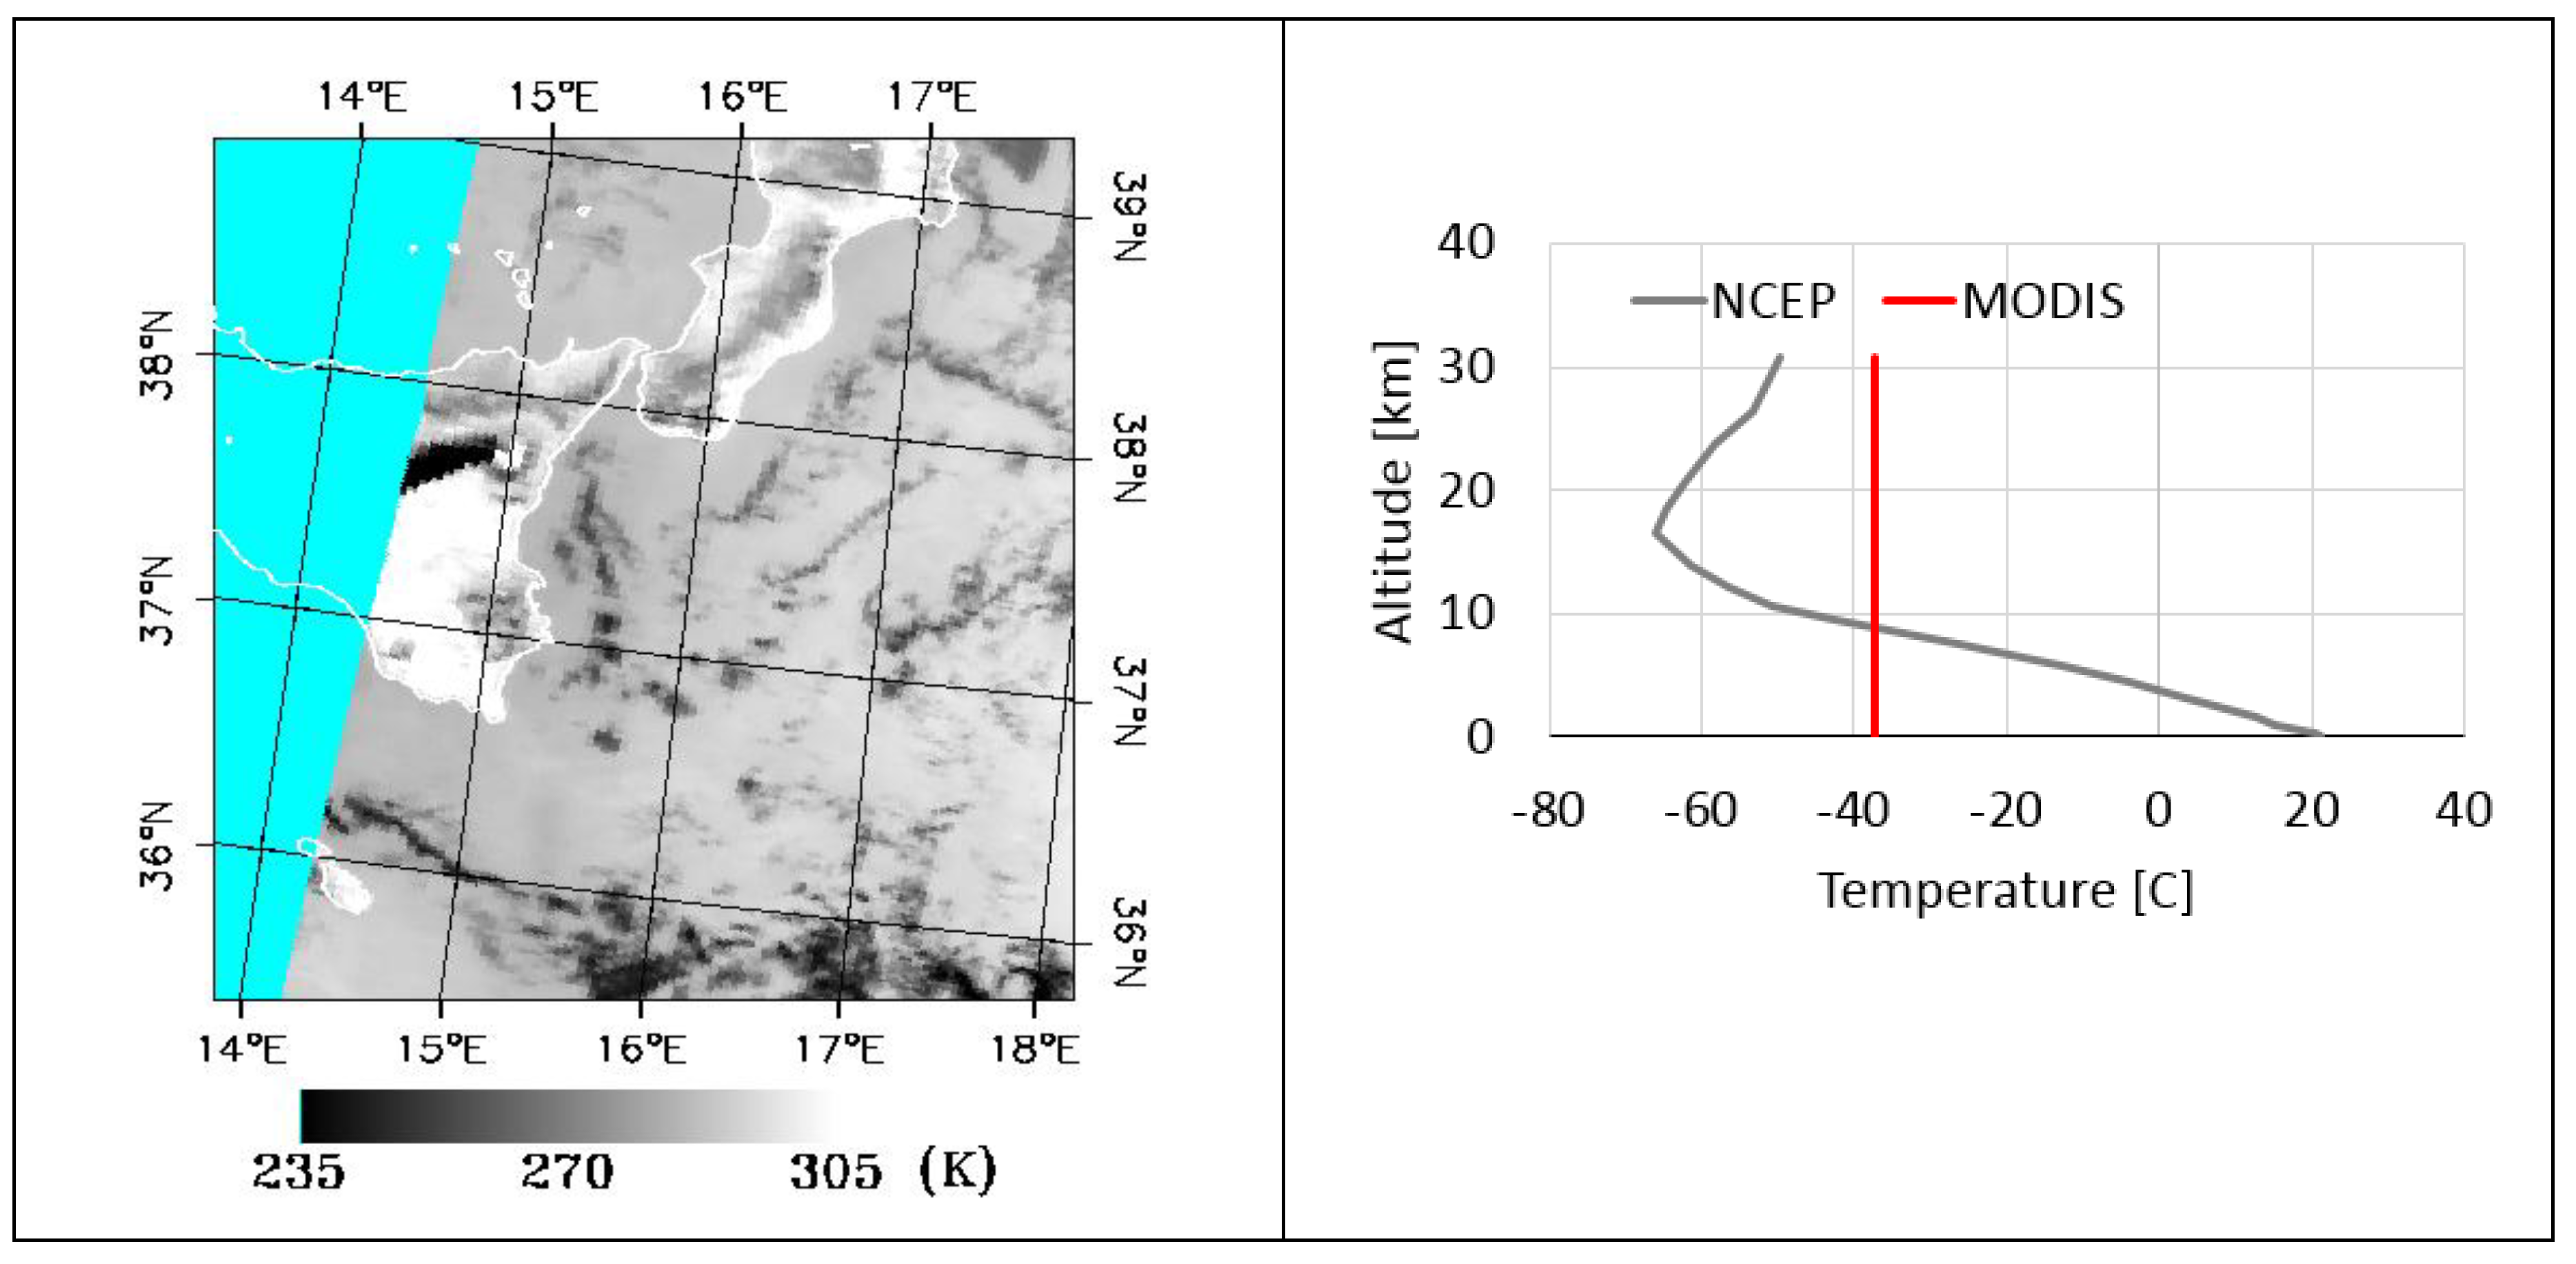
3.1. MODIS VCTH Estimation

MODIS is a multispectral radiometer on board the NASA Terra and Aqua polar satellites. It has 36 spectral channels from visible (VIS) to thermal infrared (TIR), with a spatial resolution at sub-satellite of 1 km in the TIR and repetition cycle of 1–2 days. The VCTH is computed by exploiting the well known “dark pixels” procedure, based on the comparison between the brightness temperature at 11 μm of the coldest volcanic cloud pixel (Tb,11), with the atmospheric temperature profile of the same region at same time [2]. The temperature profile has been obtained from the National Centers for Environmental Prediction (NCEP)/National Center for Atmospheric Research (NCAR) [31], considering a box with 2.5° x 2.5° centred on Etna at 12:00 UTC. The left panel of Figure 5 shows the Tb,11 for the MODIS-Terra image collected the 26 October 2013 at 09:00 UTC. The volcanic cloud is clearly visible as dark signature on the right side of the image, while the cyan region indicates no data. The right panel of Figure 5 shows the NCEP temperature profile (grey line) and the Tb,11 of the dark pixel (red vertical line). Being Tb,11 = −37.4 °C, VCTH result 8.9 km with an uncertainty of +/− 500 m, computed considering Tb,11 +/− 2 °C [2,32].

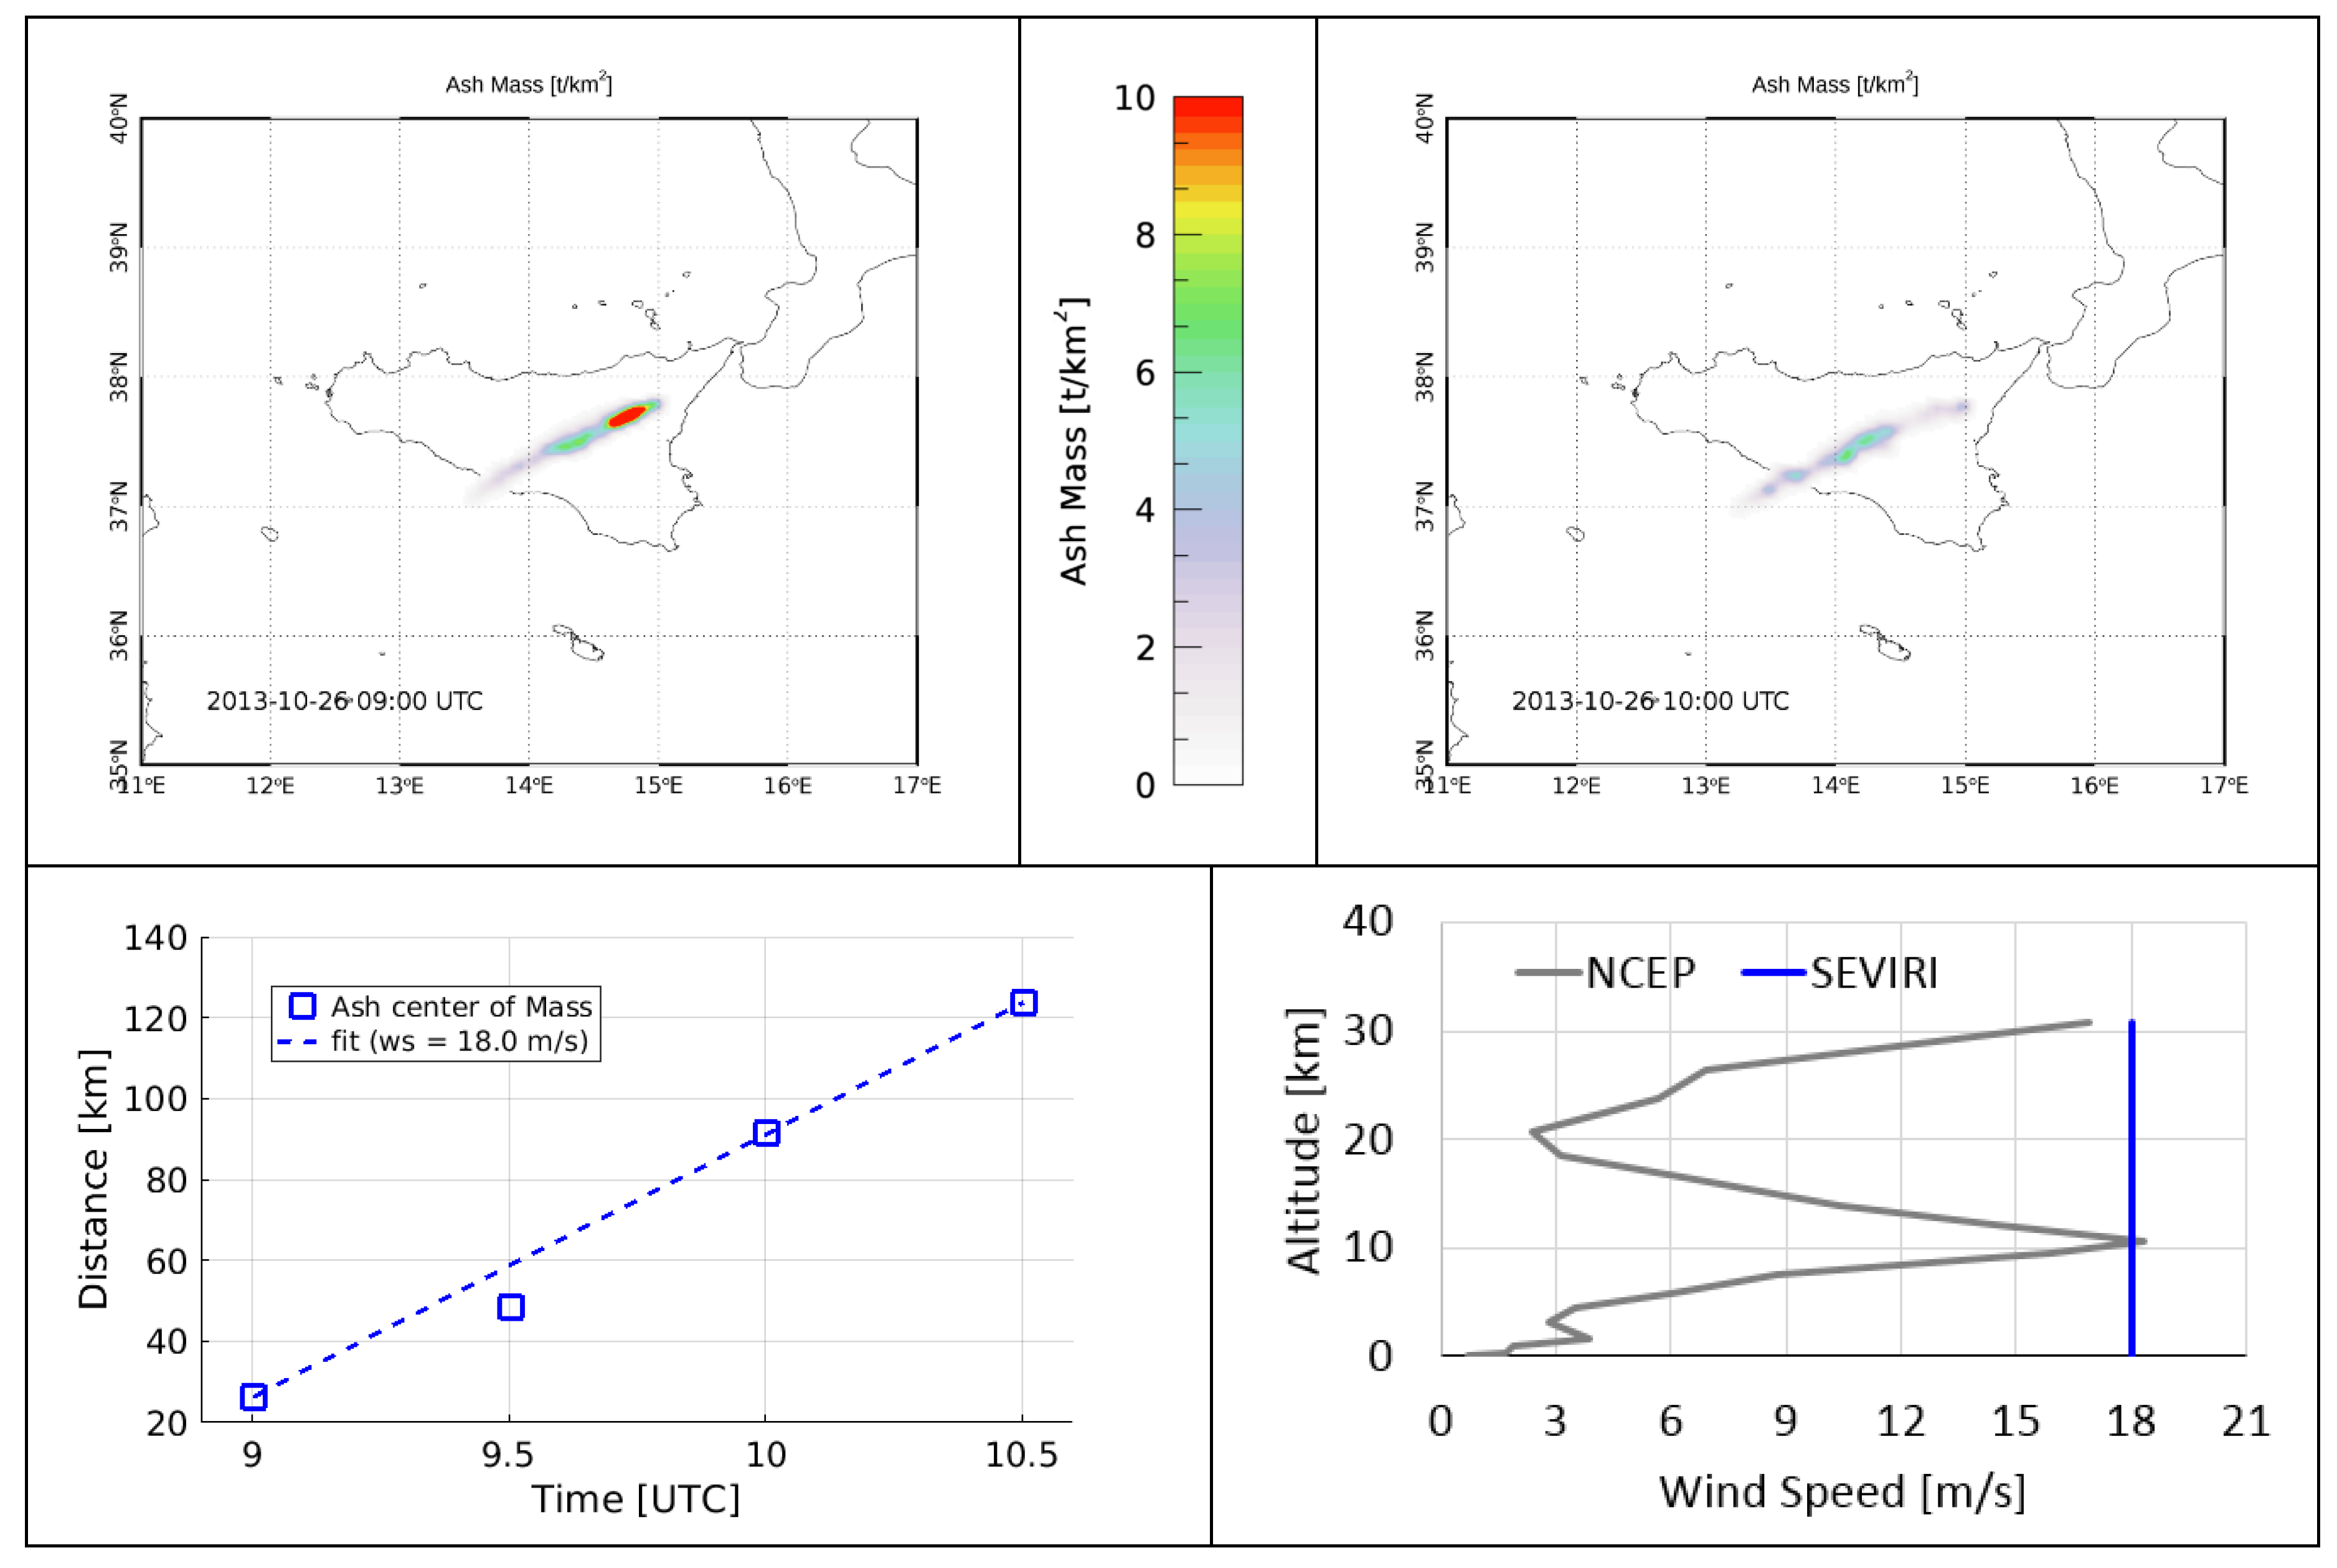
3.2. SEVIRI VCTH Estimation

The SEVIRI instrument on board METEOSAT Second Generation (MSG) geostationary satellites is a 12 channel VIS-TIR multi-channel imager, which operates from 15 min repeat cycle on entire hemisphere (Full Disk) to 5 min over Europe (Rapid Scan). The sub-satellite point spatial resolution is 3 × 3 km2, and the pixel dimension in the Etnean area is about 4.3 × 3.3 km. Exploiting the high data frequency of the SEVIRI images, the volcanic cloud speed can be retrieved by following the volcanic cloud centre of mass. By making a basic assumption that the estimated centre of mass speed is the whole volcanic cloud speed, VCTH can be obtained by comparing this value with the wind speed profile collected in the same time and position [26]. Also in this case the wind profile derive from NCEP/NCAR considering a box with 2.5° x 2.5° centred on Etna at 12:00 UTC. The upper panels of Figure 6 show the volcanic cloud ash mass maps obtained from the SEVIRI images collected at 09:00 UTC (left panel) and at 10:00 UTC (right panel). In these two images the different position of the volcanic cloud centre of mass is clearly identifiable. The distance of the centre of mass from the vents and the time of acquisition of the SEVIRI images, allows the computation of the volcanic cloud speed (see lower-left panel). This retrieved value is then compared with the wind speed NCEP/NCAR profile (see lower-right panel). In this case the wind speed of the volcanic cloud centre of mass is 18.0 m/s that yield to a VCTH of 10.5 km. An uncertainty of +/- 500 m is associated to take into account the uncertainty in the centre of mass identification. It is interesting to note that the P2E offset in Figure 3 corresponding to volcanic cloud velocities, is comparable to the wind speed measured by NCEP/NCAR (~18 m/s) shown in Figure 6.

4. Discussion

The simple cross comparison presented here indicates that VCTH retrievals from Landsat 8, SEVIRI, and MODIS are in good agreement, taking into account the different methodologies and the different times of images acquisition (9:37 UTC for Landsat, 9:00 UTC for MODIS and from 9 to 10:30 UTC for SEVIRI). The volcanic plume is a complex medium made of different materials and chemical species. Different materials (such as ash or ice) and different chemicals (such as SO2, H2O, and CO2, and halogens) are dispersed at different altitudes. As an example, sensors that capture or model SO2 dispersion in the atmosphere (such as the Infrared Atmospheric Sounding Interferometer, Iasi) will, therefore, measure a different plume altitude compared to sensors that measure visible plume particles (such as Landsat 8 and SEVIRI). This important distinction has to be taken into account when comparing results from different sensors. The PEM method works best for volcanic clouds made of ash particles and optically thick material.
The accuracy of the PEM extracted from Landsat 8 has been already assessed against ground cameras in de Michele et al. (2016) for the Holuraun fissural eruption (Iceland). They reported an accuracy of 300 m. Landsat 8 acquires data at a high spatial resolution (15/30 m grid) at the cost of a medium revisit time (every 14 days). Instead, SEVIRI has the advantage of acquiring data every half an hour everywhere in the globe. This is done at the cost of medium spatial resolution (1 km grid). Statistics performed over VCTH retrieved by Landsat 8 (PEM), SEVIRI and MODIS data on a common area show very good agreement with a maximum height value of 8 (with 1 km precision). The strength in the results show the complementarity between these systems. Assimilation models could benefit from complementary constraints brought by these sensors.
Some questions remain open to future studies. How large must the optical depth or concentration of the particles be to enable VCTH-assessment? How far from the source is the retrieval of VCTH typically possible with Landsat 8 ? We believe that this information would be essential for designing a new, dedicated mission. In general, in our approach, the plume height is not measureable if the plume is not visible in the image (Table 1).

5. Conclusions

Landsat 8 satellites offer a unique opportunity for monitoring volcanic plumes at a high spatial resolution together with the opportunity to study volcanic eruptions back in time by exploiting the data archives. De Michele et al. [21] presented a method to extract the PEM (i.e., the digital elevation model of a volcanic plume) from raw Landsat 8 data. Nevertheless, raw Landsat 8 data are not available to the general public, limiting de facto the straight-forward application of the method. Moreover, the Landsat 8 OLI sensor presents a staggered geometry, which needs tuned processing. In this study, we push the methodology forward: Here we present a generalized, simplified methodology to extract the VCTH as a PEM from the common push broom staggered sensors, such as the standard Landsat 8 products. The advantages are manifold. First, it takes advantage of the freely available Landsat 8 data archives. Second, the method exploits the already-orthorectified Landsat 8 dataset, which is a standard Landsat 8 product, readily available on Landsat 8 archives. Third, the method could be adapted to the Copernicus Sentinel 2 data, a staggered sensor for which the products available to general public are orthorectified (similar to Landsat 8). The synergetic use of multiple sensors could improve the revisit time over a given volcanic eruption. It represents a step towards the routine monitoring of volcanic plumes height from space, at high spatial resolution.
The VCTH retrievals obtained from the geostationary SEVIRI and the polar MODIS satellite instruments indicate a good agreement with the Landsat VCTH product.

Funding

This study benefited from funding of the European Union and BRGM within the APHORISM (Advanced Procedures for Volcanic and Seismic Monitoring) project, 7th framework programme of the European Union. We are thankful to NASA/USGS Landsat 8 program for the Landsat 8 OLI data.

Acknowledgments

We are thankful to NASA/USGS for the Landsat8 data.

Conflicts of Interest

The authors declare no conflict of interest.

References

  1. Wen, S.; Rose, W.I. Retrieval of sizes and total masses of particles in volcanic clouds using AVHRR bands 4 and 5. J. Geophys. Res. Atmos. 1994, 99, 5421–5431. [Google Scholar] [CrossRef]
  2. Prata, A.J.; Grant, I.F. Retrieval of microphysical and morphological properties of volcanic ash plumes from satellite data: Application to Mt Ruapehu, New Zealand. Q. J. R. Meteorol. Soc. 2001, 127, 2153–2179. [Google Scholar] [CrossRef]
  3. Corradini, S.; Merucci, L.; Prata, A.J. Retrieval of SO2 from thermal infrared satellite measurements: Correction procedures for the effects of volcanic ash. Atmos. Meas. Tech. 2009, 2, 177–191. [Google Scholar] [CrossRef]
  4. Mastin, L.G.; Guffanti, M.; Servranckx, R.; Webley, P.; Barsotti, S.; Dean, K.; Durant, A.; Ewert, J.W.; Neri, A.; Rose, W.I.; et al. A multidisciplinary effort to assign realistic source parameters to models of volcanic ash-cloud transport and dispersion during eruptions. J. Volcanol. Geotherm. Res. 2009, 186, 10–21. [Google Scholar] [CrossRef] [Green Version]
  5. Stohl, A.; Prata, A.J.; Eckhardt, S.; Clarisse, L.; Durant, A.; Henne, S.; Kristiansen, N.I.; Minikin, A.; Schumann, U.; Seibert, P.; et al. Determination of time- and height-resolved volcanic ash emissions and their use for quantitative ash dispersion modeling: The 2010 Eyjafjallajökull eruption. Atmos. Chem. Phys. 2011, 11, 4333–4351. [Google Scholar]
  6. Poret, M.; Corradini, S.; Merucci, L.; Costa, A.; Andronico, D.; Montopoli, M.; Vulpiani, G.; Freret-Lorgeril, V. Reconstructing volcanic plume evolution integrating satellite and ground-based data: Application to the 23rd November 2013 Etna eruption. Atmos. Chem. Phys. Discuss. 2018. [Google Scholar] [CrossRef]
  7. Richards, M.S. Volcanic Ash Cloud Heights Using the MODIS CO2-Slicing Algorithm. Master’s Thesis, University of Wisconsin, Madison, WI, USA, 6 January 2006. [Google Scholar]
  8. Chang, F.-L.; Minnis, P.; Lin, B.; Khaiyer, M.M.; Palikonda, R.; Spangenberg, D.A. A modified method for inferring upper troposphere cloud top height using the GOES 12 imager 10.7 and 13.3 μm data. J. Geophys. Res. 2010, 115, D06208. [Google Scholar] [CrossRef]
  9. Corradini, S.; Cervino, M. Aerosol extinction coefficient profile retrieval in the Oxygen A-band considering multiple scattering atmosphere. Test case: SCIAMACHY nadir simulated measurements. J. Quant. Spectrosc. Radiat. Transf. 2006, 97, 354–380. [Google Scholar] [CrossRef]
  10. Dubuisson, P.; Frouin, R.; Dessailly, D.; Duforêt, L.; Léon, J.-F.; Voss, K.; Antoine, D. Estimating the altitude of aerosol plumes over the ocean from reflectance ratio measurements in the O2 A-band. Remote Sens. Environ. 2009, 113, 1899–1911. [Google Scholar] [CrossRef]
  11. Biondi, R.; Steiner, A.K.; Kirchengast, G.; Brenot, H.; Rieckh, T. Supporting the detection and monitoring of volcanic clouds: A promising new application of Global Navigation Satellite System radio occultation. Adv. Space Res. 2017, 60, 2707–2722. [Google Scholar] [CrossRef]
  12. Pardini, F.; Burton, M.; de’ Michieli Vitturi, M.; Corradini, S.; Salerno, G.; Merucci, L.; Di Grazia, G. Retrieval and intercomparison of volcanic SO2 injection height and eruption time from satellite maps and ground-based observations. J. Volcanol. Geotherm. Res. 2017. [Google Scholar] [CrossRef]
  13. Merucci, L.; Zakšek, K.; Carboni, E.; Corradini, S. Steeoscopic estimation of volcanic cloud-top height from two geostationary satellites. Remote Sens. 2016, 8, 206. [Google Scholar] [CrossRef]
  14. Winker, D.M.; Liu, Z.; Omar, A.; Tackett, J.; Fairlie, D. CALIOP observations of the transport of ash from the Eyjafjallajökull volcano in April 2010. J. Geophys. Res. 2012, 117, D00U15. [Google Scholar] [CrossRef]
  15. Prata, A.J.; Turner, P.J. Cloud top height determination from the ATSR. Remote Sens. Environ. 1997, 59, 1. [Google Scholar] [CrossRef]
  16. Mims, S.R.; Kahn, R.A.; Moroney, C.M.; Gaitley, B.J.; Nelson, D.L.; Garay, M.J. MISR stereo heights of grassland fire smoke plumes in Australia. IEEE Trans. Geosci. Remote Sens. 2010, 48, 25–35. [Google Scholar] [CrossRef]
  17. Nelson, D.L.; Garay, M.J.; Kahn, R.A.; Dunst, B.A. Stereoscopic Height and Wind Retrievals for Aerosol Plumes with the MISR INteractive eXplorer (MINX). Remote Sens. 2013, 5, 4593–4628. [Google Scholar] [CrossRef] [Green Version]
  18. Flower, V.J.; Kahn, R.A. Assessing the altitude and dispersion of volcanic plumes using MISR multi-angle imaging from space: Sixteen years of volcanic activity in the Kamchatka Peninsula, Russia. J. Volcanol. Geotherm. Res. 2017, 337, 1–15. [Google Scholar] [CrossRef]
  19. Zakšek, K.; Hort, M.; Zaletelj, J.; Langmann, B. Monitoring volcanic ash cloud top height through simultaneous retrieval of optical data from polar orbiting and geostationary satellites. Atmos. Chem. Phys. 2013, 13, 2589–2606. [Google Scholar] [CrossRef] [Green Version]
  20. Corradini, S.; Montopoli, M.; Guerrieri, L.; Ricci, M.; Scollo, S.; Merucci, L.; Marzano, F.S.; Pugnaghi, S.; Prestifilippo, M.; Ventress, L.; et al. A multi-sensor approach for the volcanic ash cloud retrievals and eruption characterization. Remote Sens. 2016, 8, 58. [Google Scholar] [CrossRef]
  21. De Michele, M.; Raucoules, D.; Arason, Þ. Volcanic plume elevation model and its velocity derived from Landsat 8. Remote Sens. Environ. 2016, 176, 219–224. [Google Scholar] [CrossRef]
  22. Ferlito, C.; Bruno, V.; Salerno, G.; Caltabiano, T.; Scandura, D.; Mattia, M.; Coltorti, M. Dome-like behavior at Mt. Etna: The case of the 28 December 2014 South East Crater paroxysm. Sci. Rep. 2017, 7, 5361. [Google Scholar] [CrossRef]
  23. Patanè, D.; Aiuppa, A.; Aloisi, M.; Behncke, B.; Cannata, A.; Coltelli, M.; Di Grazia, G.; Gambino, S.; Gurrieri, S.; Mattia, M.; et al. Insights into magma and fluid transfer at Mount Etna by a multi parametric approach: A model of the events leading to the 2011 eruptive cycle. J. Geophys. Res. 2013, 118, 1–21. [Google Scholar] [CrossRef]
  24. Behncke, B.; Branca, S.; Corsaro, R.A.; De Beni, E.; Miraglia, L.; Proietti, C. The 2011–2012 summit activity of Mount Etna: Birth, growth and products of the new SE crater. J. Volcanol. Geotherm. Res. 2014, 270, 10–21. [Google Scholar] [CrossRef]
  25. Spampinato, L.; Sciotto, M.; Cannata, A.; Cannavò, F.; La Spina, A.; Palano, M.; Salerno, G.G.; Privitera, E.; Caltabiano, T. Multiparametric study of the February–April 2013 paroxysmal phase of Mt. Etna New South-East crater. Geochem. Geophys. Geosyst. 2015, 16, 1932–1949. [Google Scholar] [CrossRef]
  26. Corradini, S.; Guerrieri, L.; Lombardo, V.; Merucci, L.; Musacchio, M.; Prestifilippo, M.; Scollo, S.; Silvestri, M.; Spata, G.; Stelitano, D. Proximal monitoring of the 2011-2015 Etna lava fountains using MSG-SEVIRI data. Geosciences 2018, 8, 140. [Google Scholar] [CrossRef]
  27. Sellitto, P.; di Sarra, A.; Corradini, S.; Boichu, M.; Herbin, H.; Dubuisson, P.; Sèze, G.; Meloni, D.; Monteleone, F.; Merucci, L.; et al. Synergistic use of Lagrangian dispersion and radiative transfer modelling with satellite and surface remote sensing measurements for the investigation of volcanic plumes: The Mount Etna eruption of 25–27 October 2013. Atmos. Chem. Phys. 2016, 16, 6841–6861. [Google Scholar] [CrossRef]
  28. Storey, J.; Choate, M.; Lee, K. Landsat-8 operational land imager on-orbit geometric calibration and performance. Remote Sens. 2014, 6, 11127–11152. [Google Scholar] [CrossRef]
  29. Knight, E.; Kvaran, G. Landsat-8 operational land imager design, characterization, and performance. Remote Sens. 2014, 6, 10286–10305. [Google Scholar] [CrossRef]
  30. Leprince, S.; Barbot, S.; Ayoub, F.; Avouac, J.P. Automatic and precise orthorectification, coregistration, and subpixel correlation of satellite images, application to ground deformation measurements. IEEE Trans. Geosci. Remote Sens. 2007, 45, 6. [Google Scholar] [CrossRef]
  31. The NCEP/NCAR Reanalysis Project at the NOAA/ESRL Physical Sciences Division. Available online: http://www.esrl.noaa.gov/psd/data/reanalysis/reanalysis.shtml (accessed on 1 December 2017).
  32. Corradini, S.; Merucci, L.; Prata, A.J.; Piscini, A. Volcanic ash and SO2 in the 2008 Kasatochi eruption: Retrievals comparison from different IR satellite sensors. JGR 2010, 115, D00L21. [Google Scholar] [CrossRef]
Figure 1. Orthorectified Landsat 8 data acquired the 26 October 2013 at 09:37 UTC on Mt. Etna volcano (image courtesy of National Aeronautics and Space Administration (NASA)/United States Geological Survey (USGS)).
Remotesensing 11 00785 g001
Figure 2. Angles and geometrical conventions, imagining this is a rotated Landsat 8 scene with a volcano at its centre. The epipolar (flight motion) direction and the perpendicular (p2e) to the epipolar direction (EP) direction are indicated. Dark gray and light gray colours indicate quadrants where the offsets are either summed up, either subtracted respectively. Ovals represent possible ash clouds directions. The light blue colour indicate the ash cloud direction of the case study presented here.
Remotesensing 11 00785 g002
Figure 3. (a): Results from the correlator show vertical stripes due to volcanic (and non-volcanic) cloud velocities. As focal plane modules (FPMs) are inverted 180°, the correlator yields velocities with sign opposition (see text for more details). (b): Correlation results are corrected by using | O e | ,   | O p 2 e |   as described in this study. EP offsets (Oe), P2E offsets (Op2e). The pixel offset is expressed in meters. It is interesting to note that the P2E offset correspond to cloud velocities.
Remotesensing 11 00785 g003
Figure 4. The volcanic cloud elevation (km), extracted from Landsat 8 orthorectified image.
Remotesensing 11 00785 g004
Figure 5. Left panel: brightness temperature at 11 μm for the moderate resolution imaging spectroradiometer (MODIS)-Terra image collected the 26 October 2013 at 09:00 UTC. Right panel: National Centers for Environmental Prediction (NCEP) temperature profile (grey line) and dark pixel brightness temperature (red vertical line).
Remotesensing 11 00785 g005
Figure 6. Upper panels: volcanic cloud ash mass maps obtained from the spinning enhanced visible and infrared imager (SEVIRI) images collected at 09:00 UTC (left panel) and at 10:00 UTC (right panel). Lower panels: Computation of the volcanic cloud speed from SEVIRI images (left panel) and comparison between the value obtained and the wind speed NCEP/ National Center for Atmospheric Research (NCAR) profile (right panel).
Remotesensing 11 00785 g006
Table 1. Summary of the comparison between the different volcanic cloud-top height (VCTH) retrievals derived from Landsat 8, MODIS and SEVIRI.
VCTH [km]VCTHUncertainty
LANDSAT9.930.3
MODIS8.90.5
SEVIRI10.50.5

