Shrinkage of Nepal’s Second Largest Lake (Phewa Tal) Due to Watershed Degradation and Increased Sediment Influx

 ,
,
Abstract
:
1. Introduction
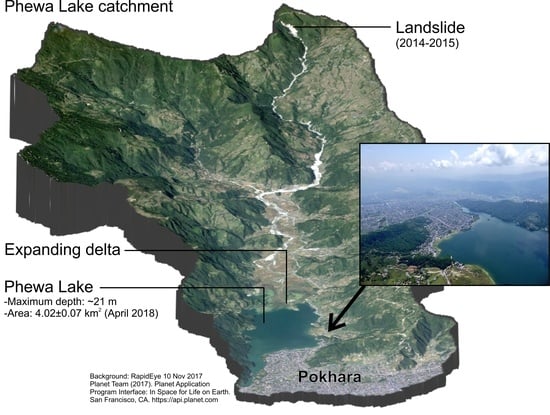
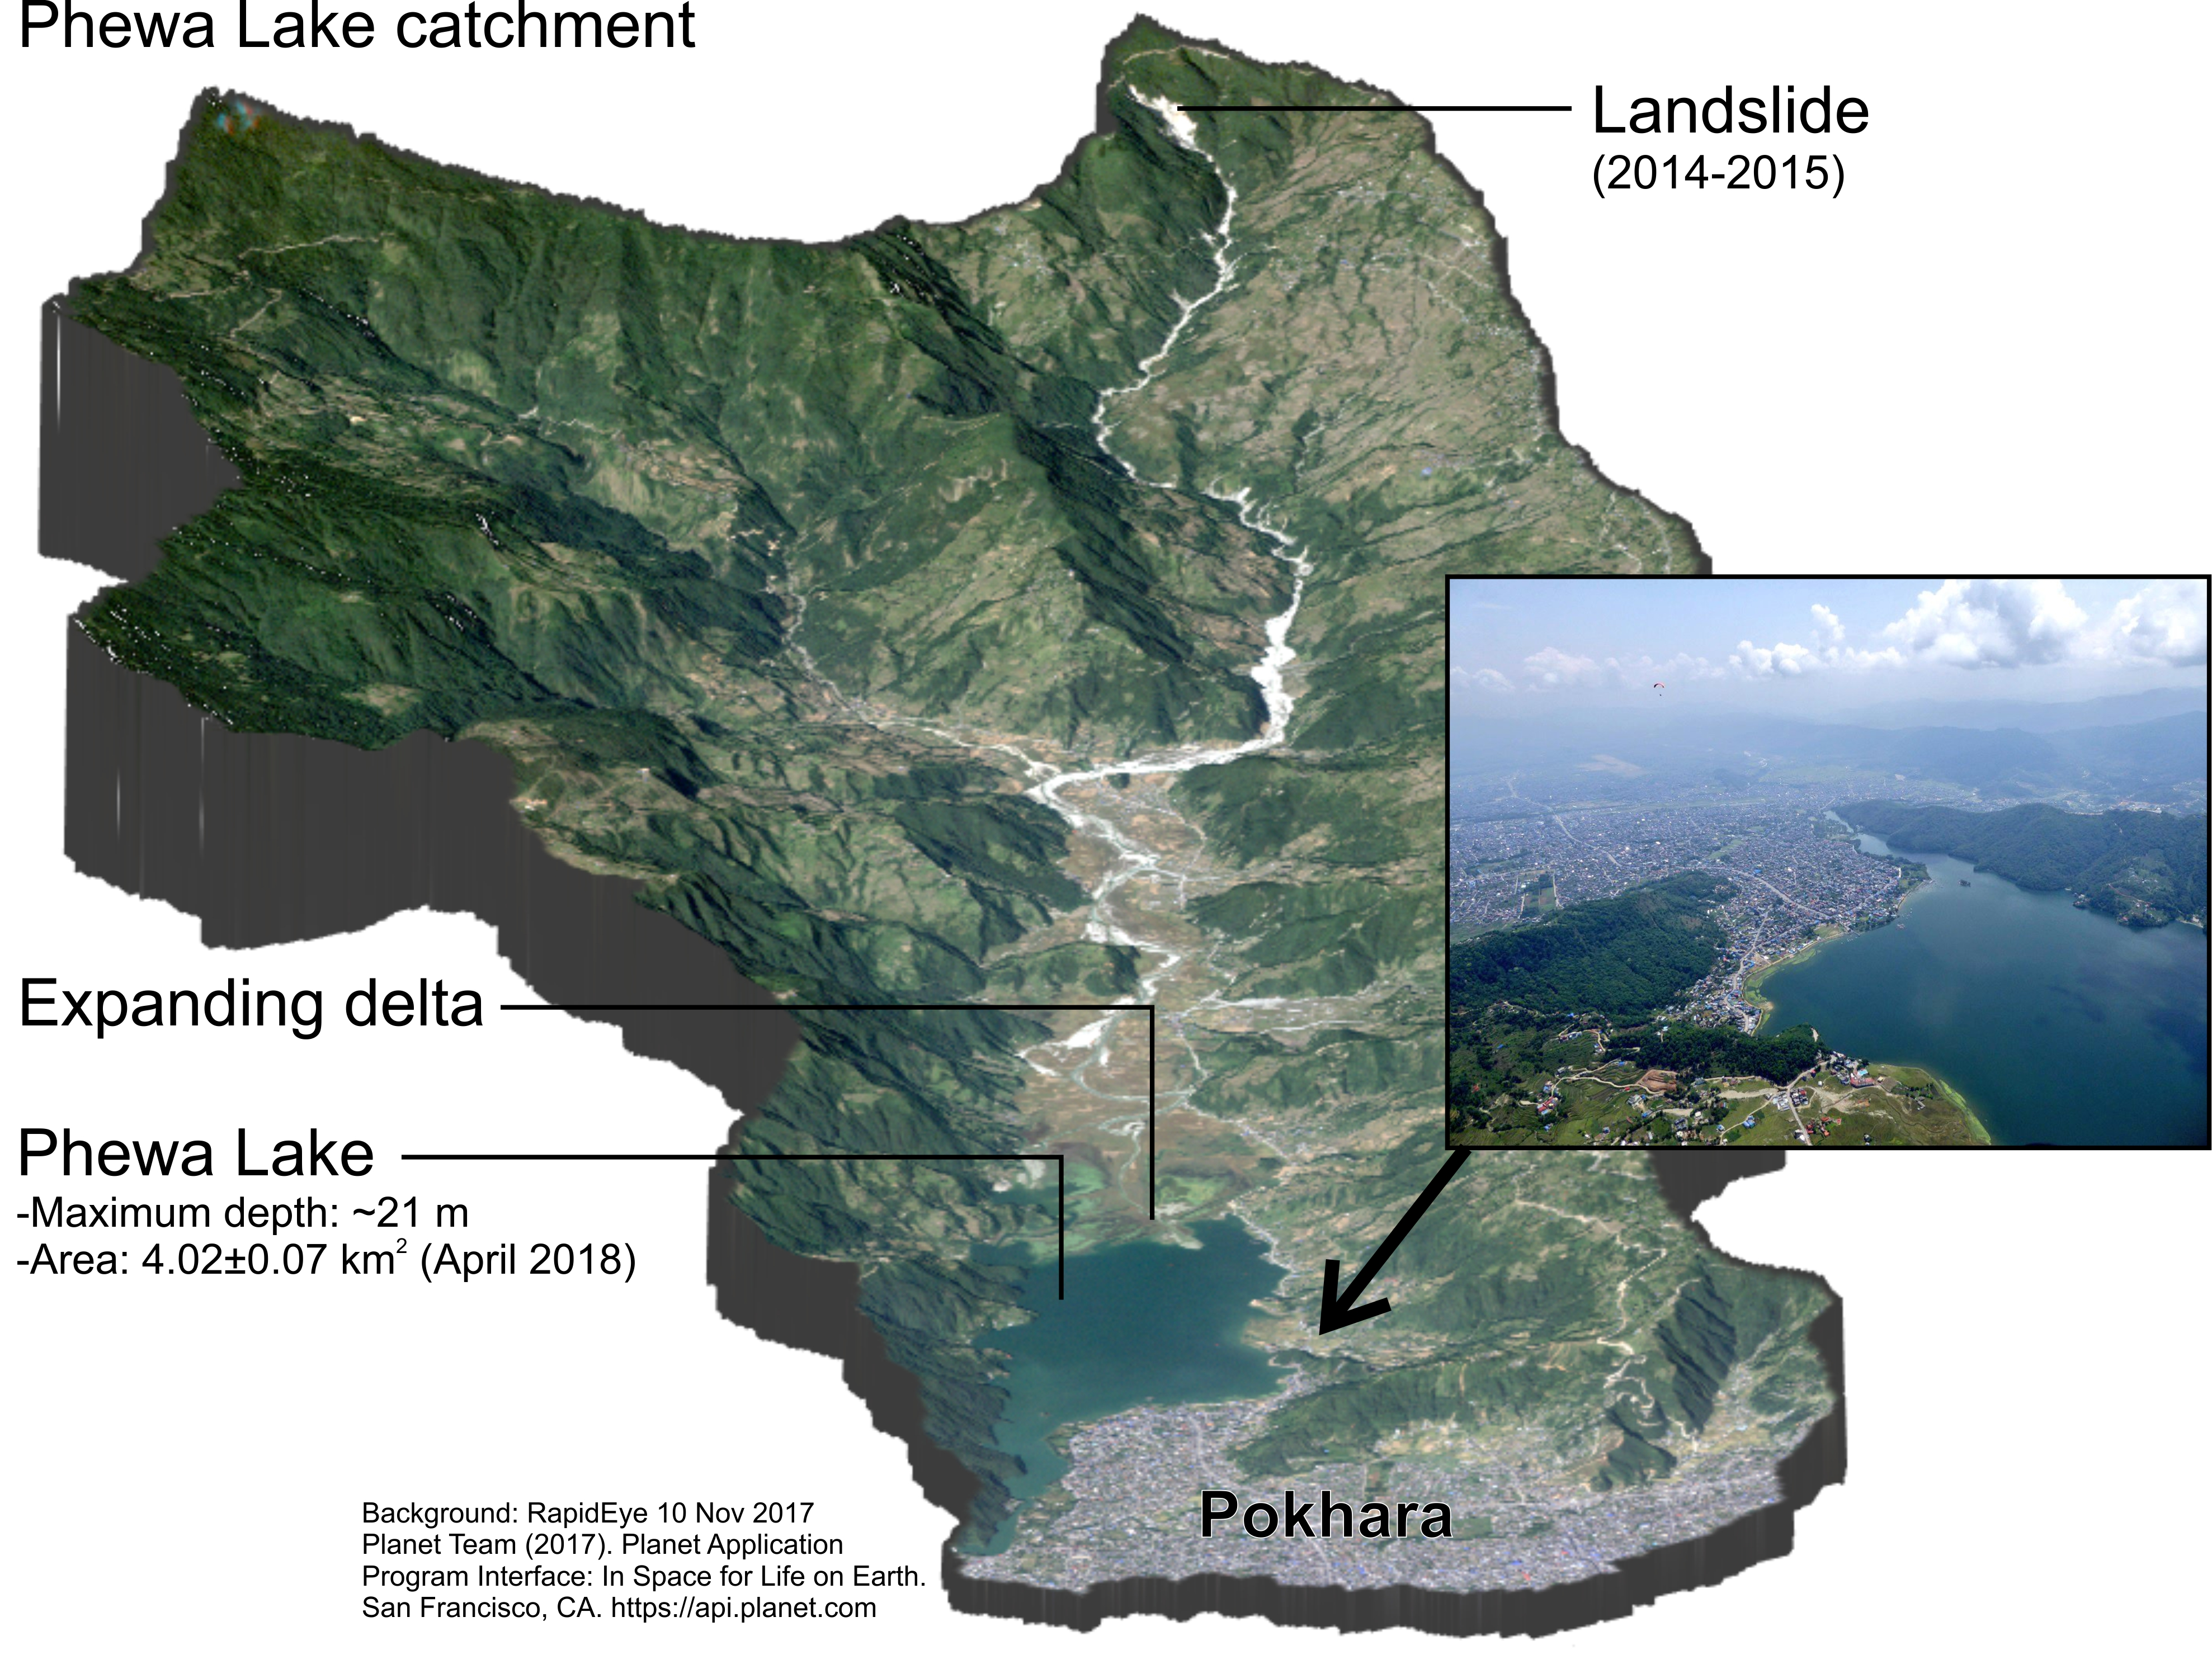
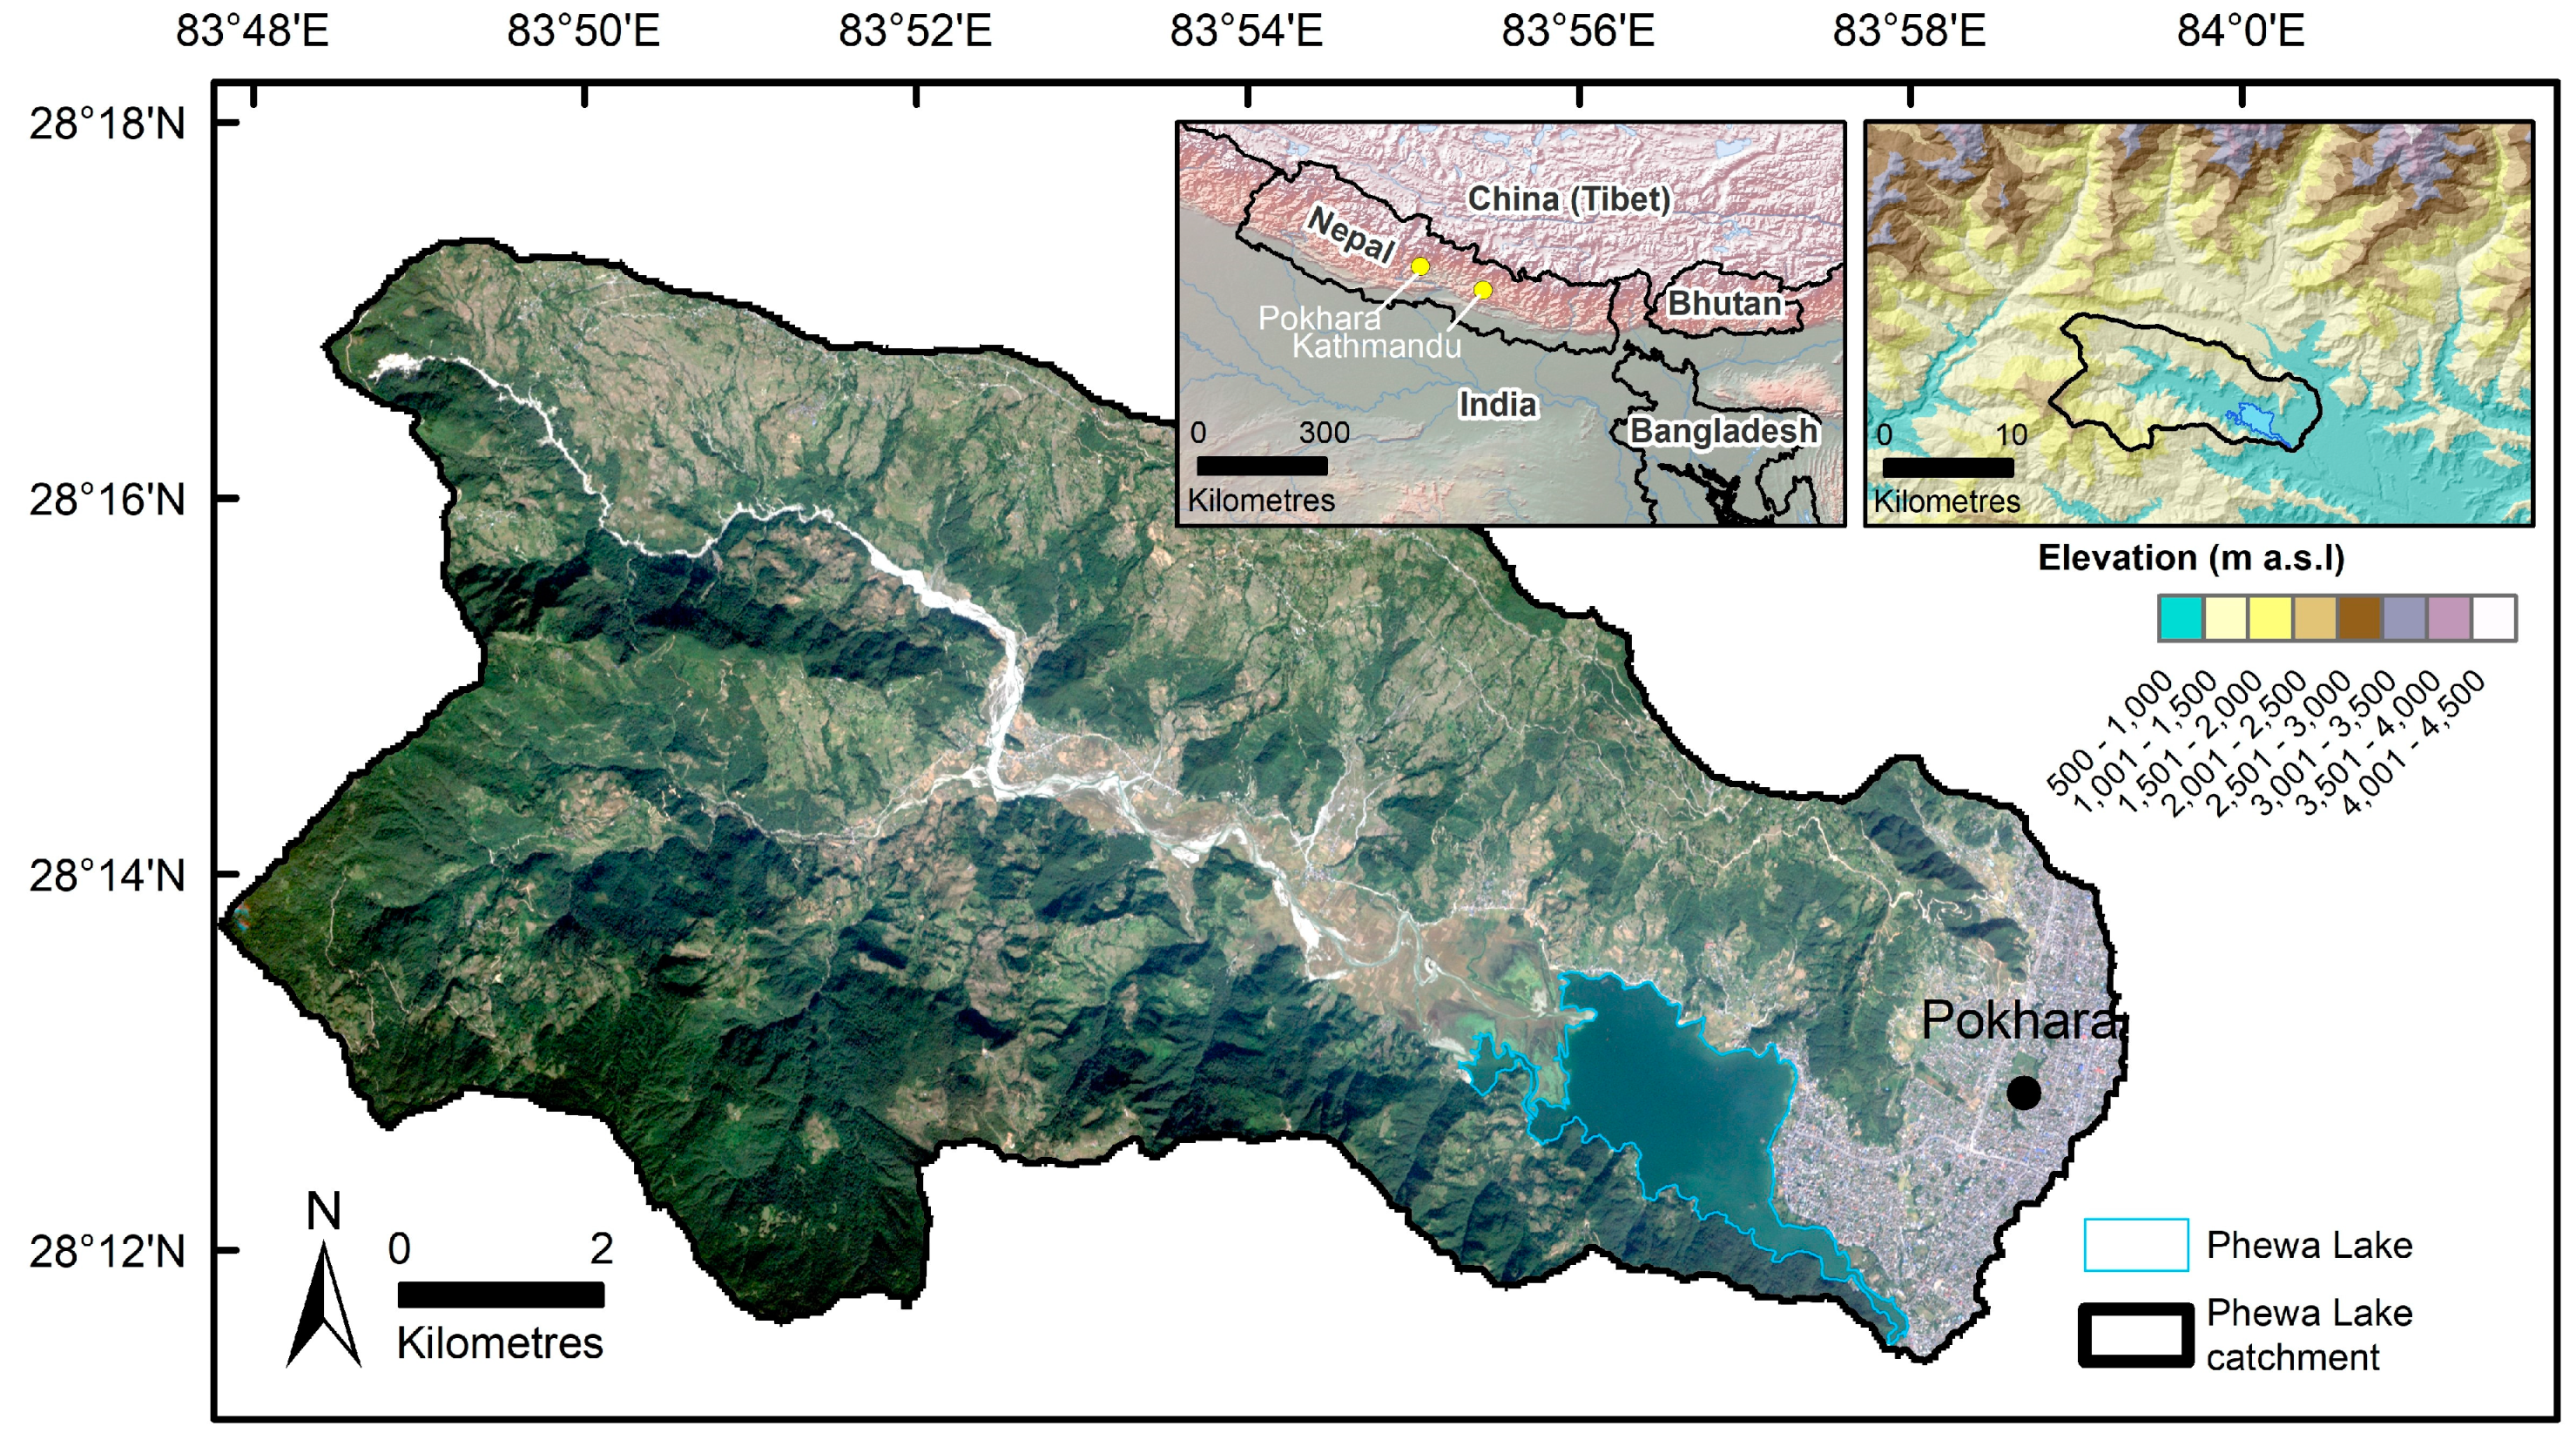
2. Study Site
3. Methods
3.1. Lake Area
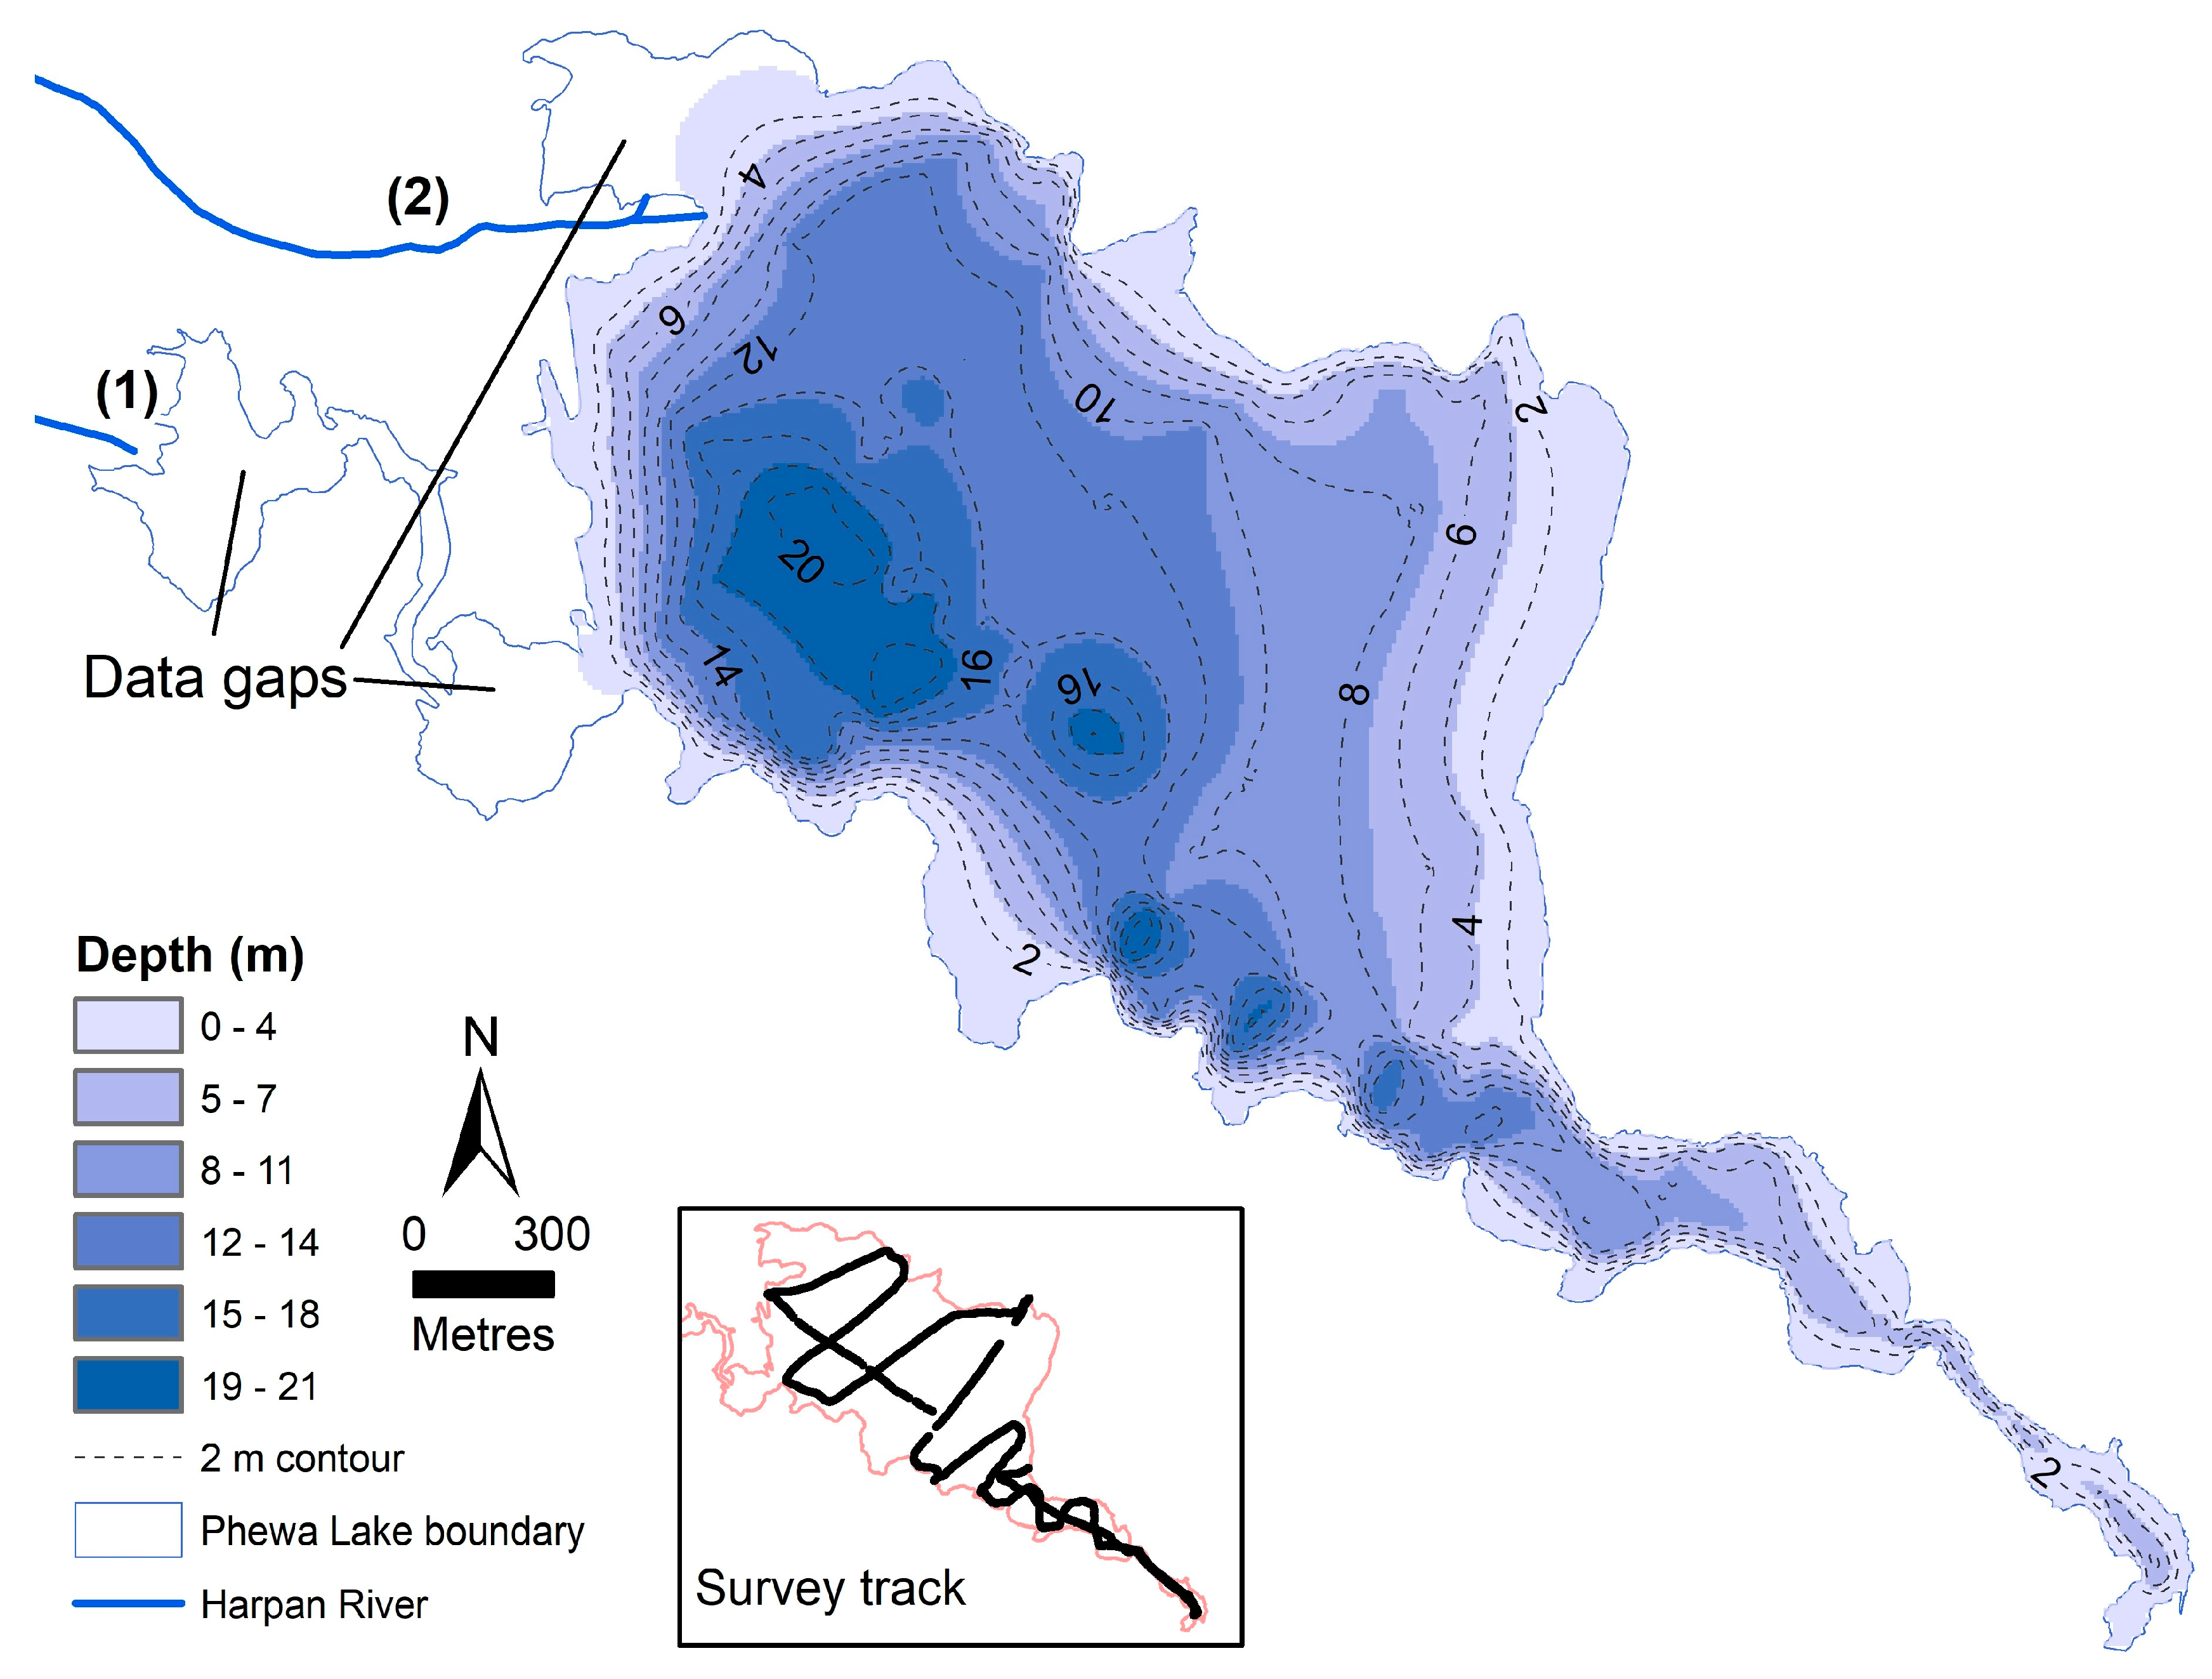
3.2. Lake Bathymetry and Surrounding Topography
3.3. Lake Characteristics
3.4. Landslide Activity and Urban Expansion
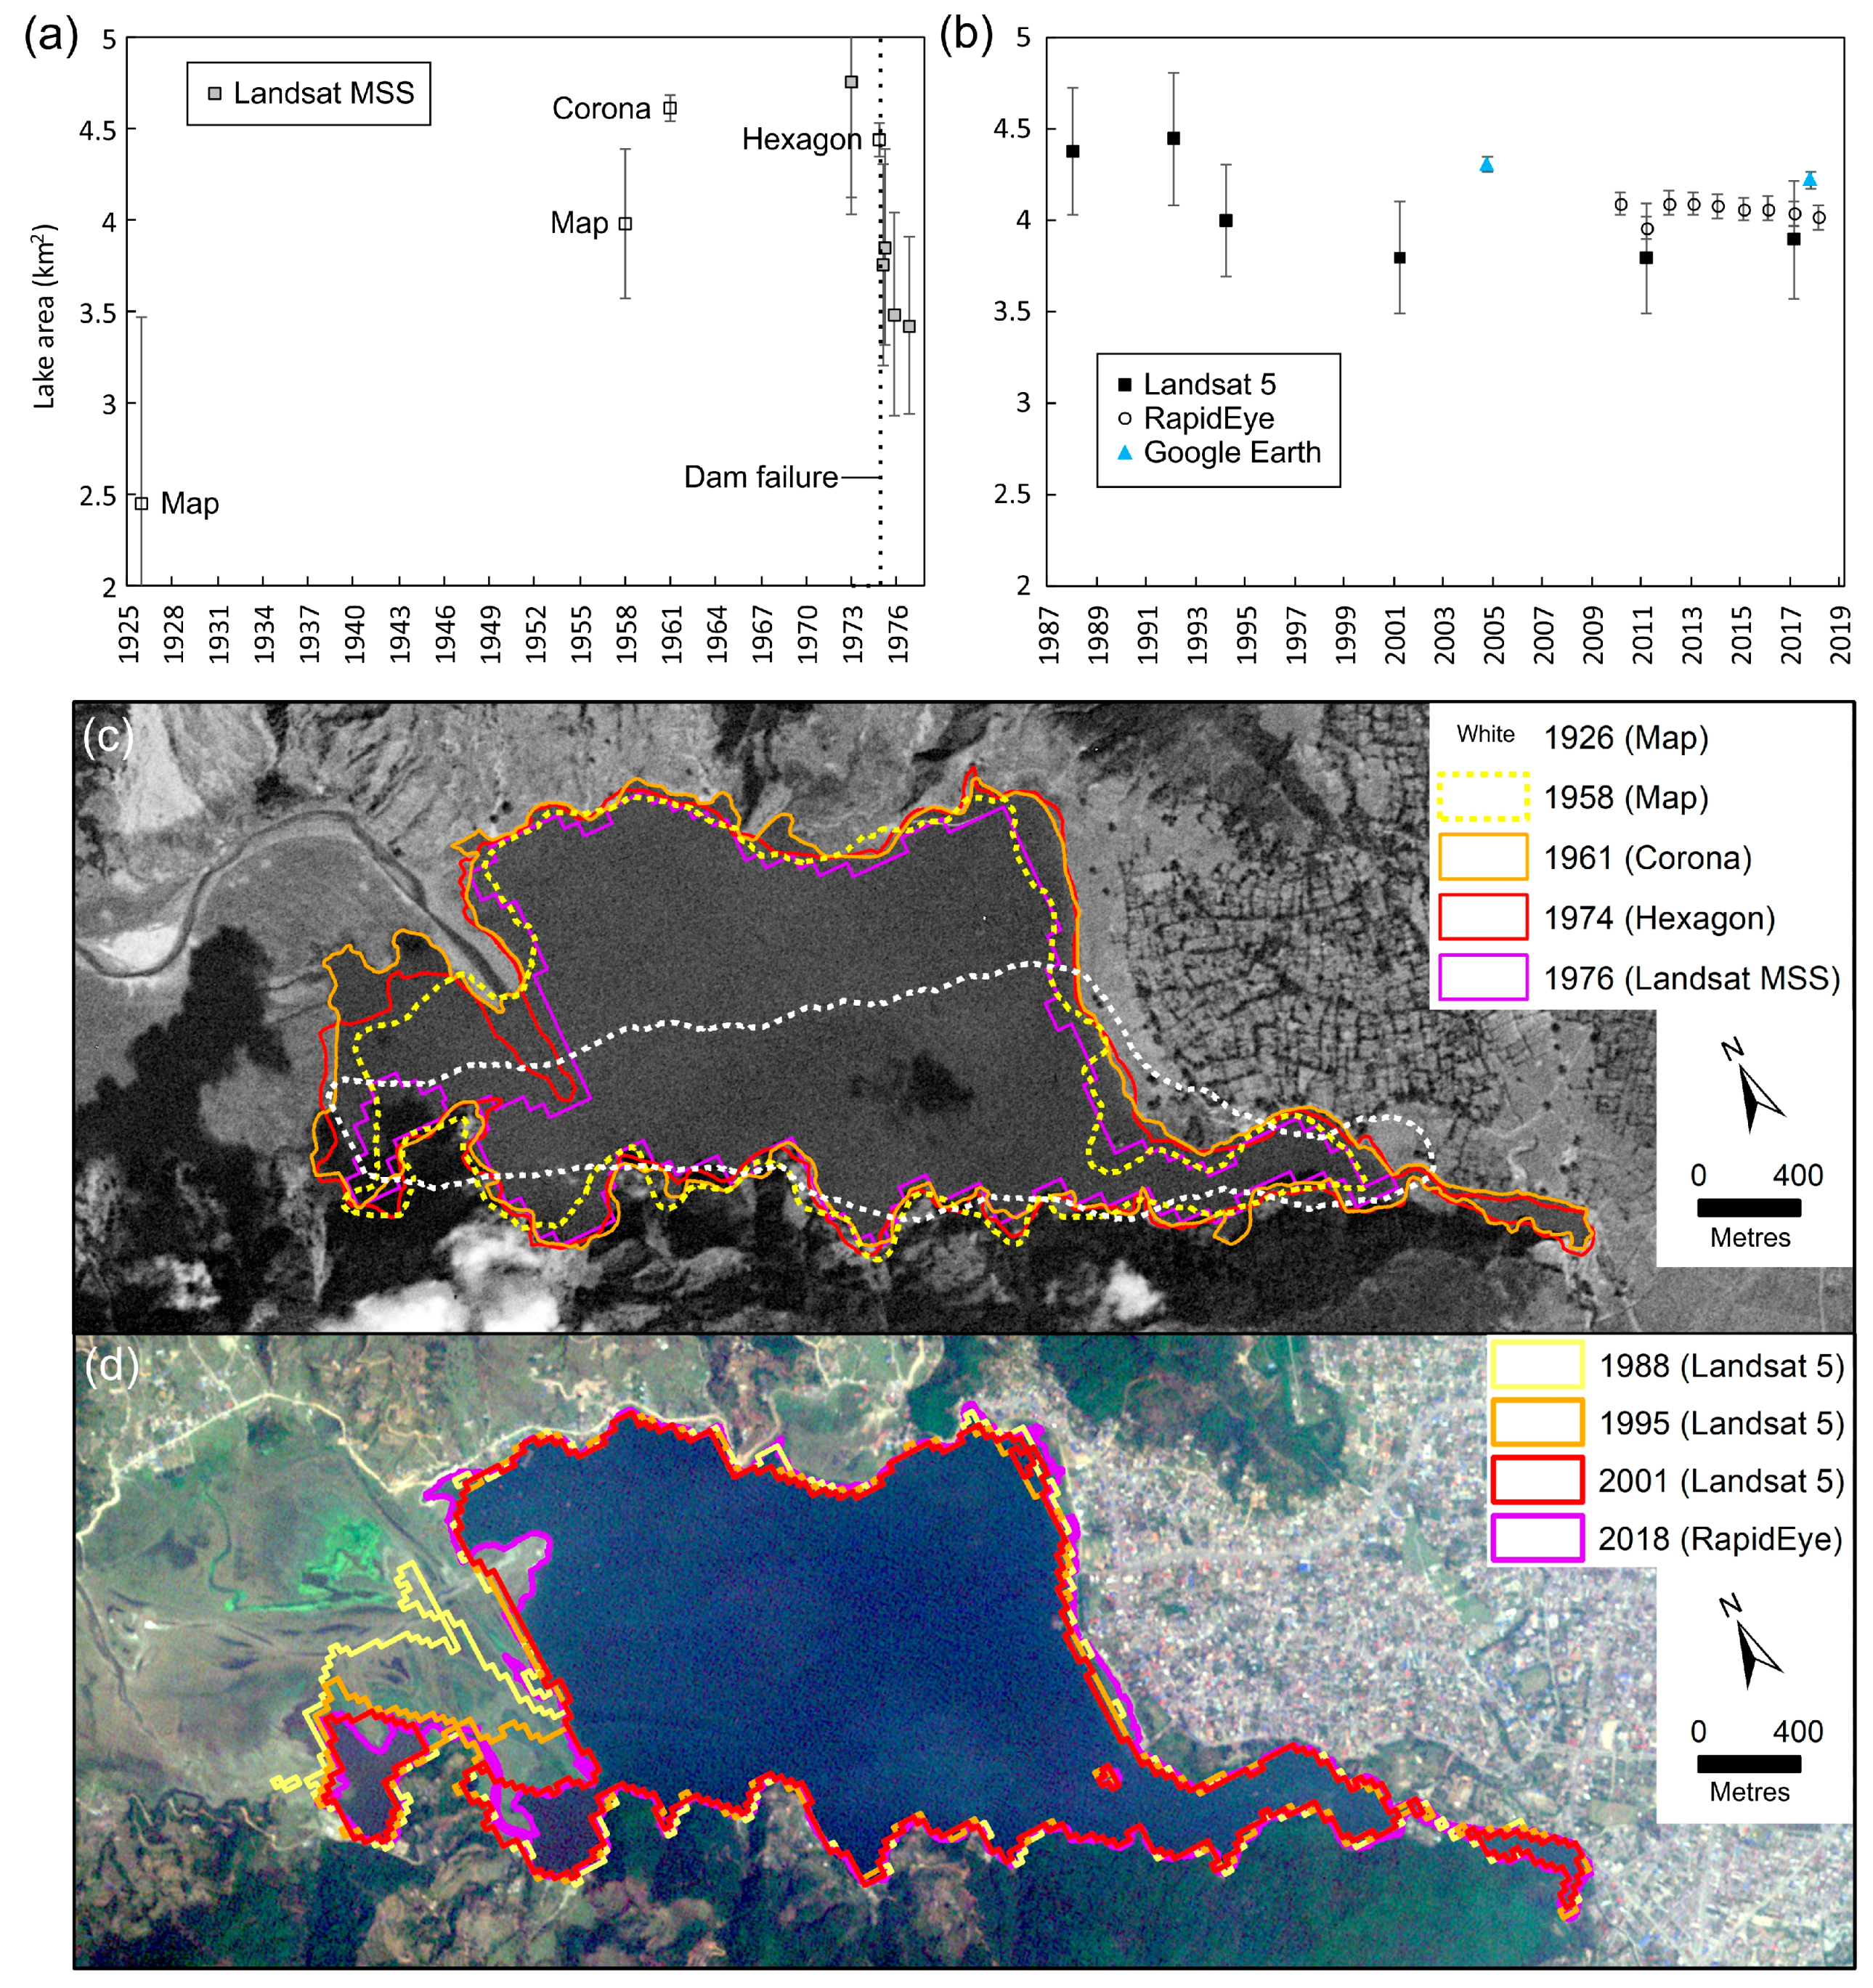
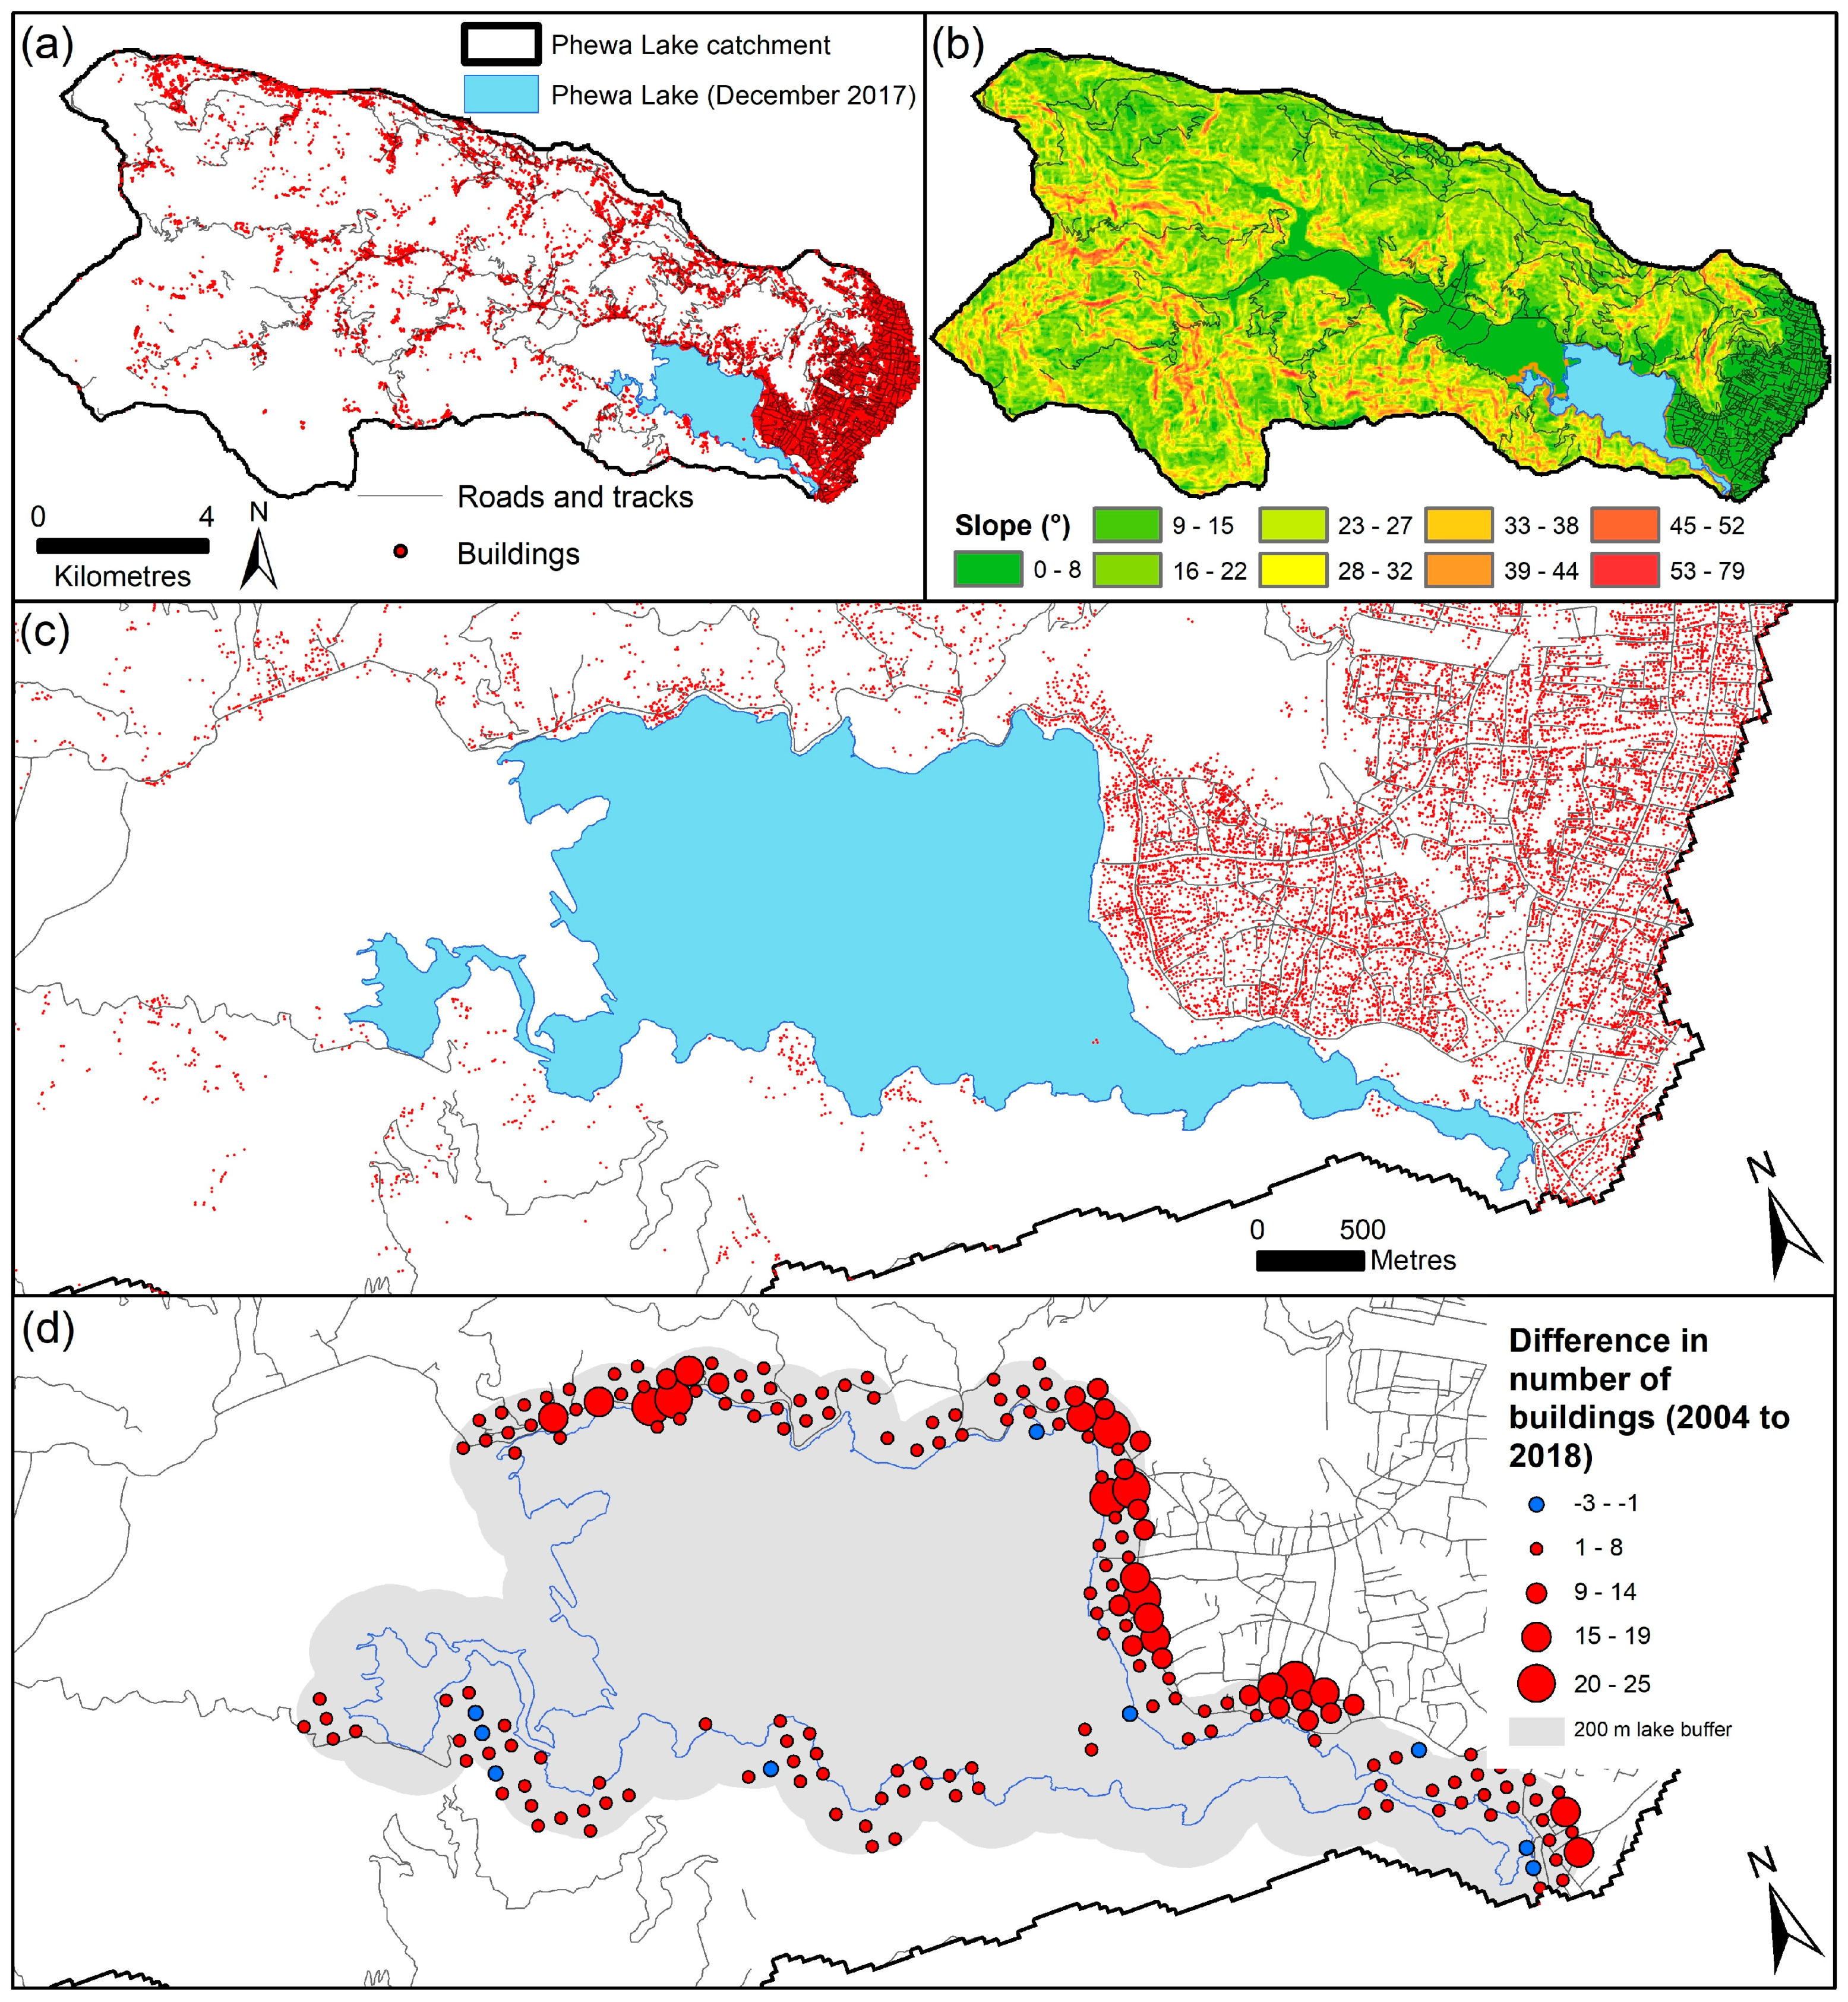
4. Results
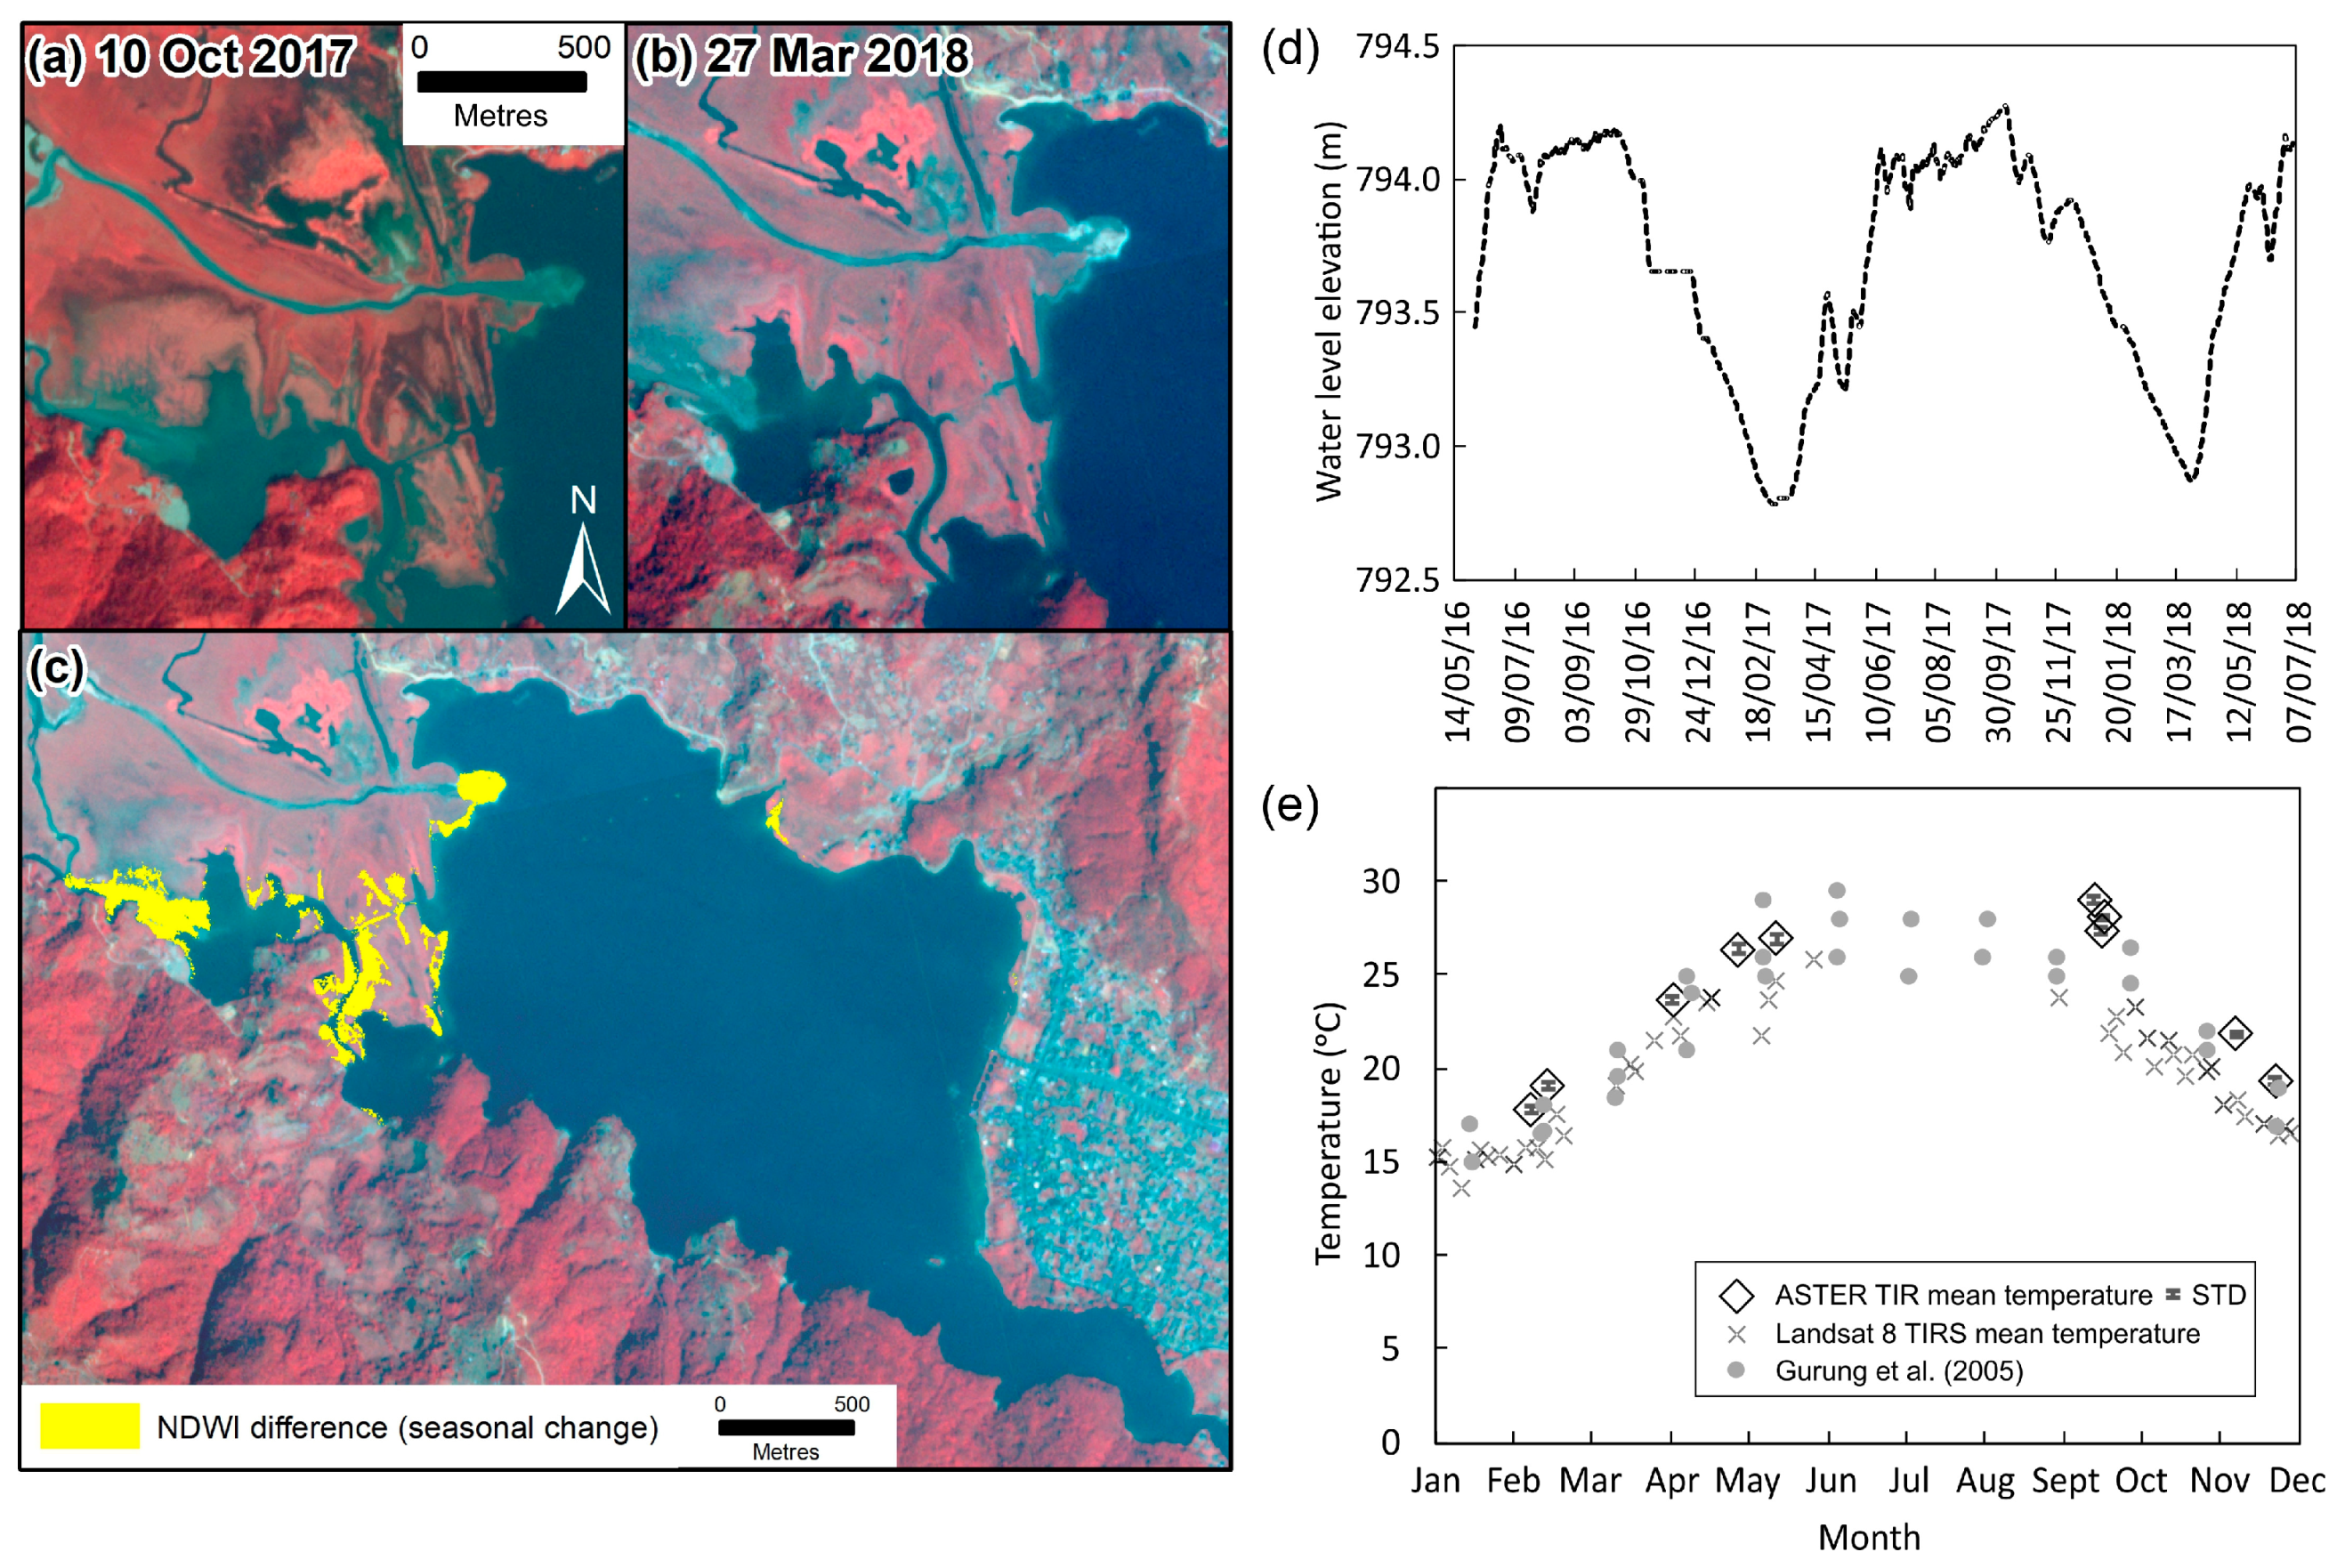
4.1. Lake Characteristics
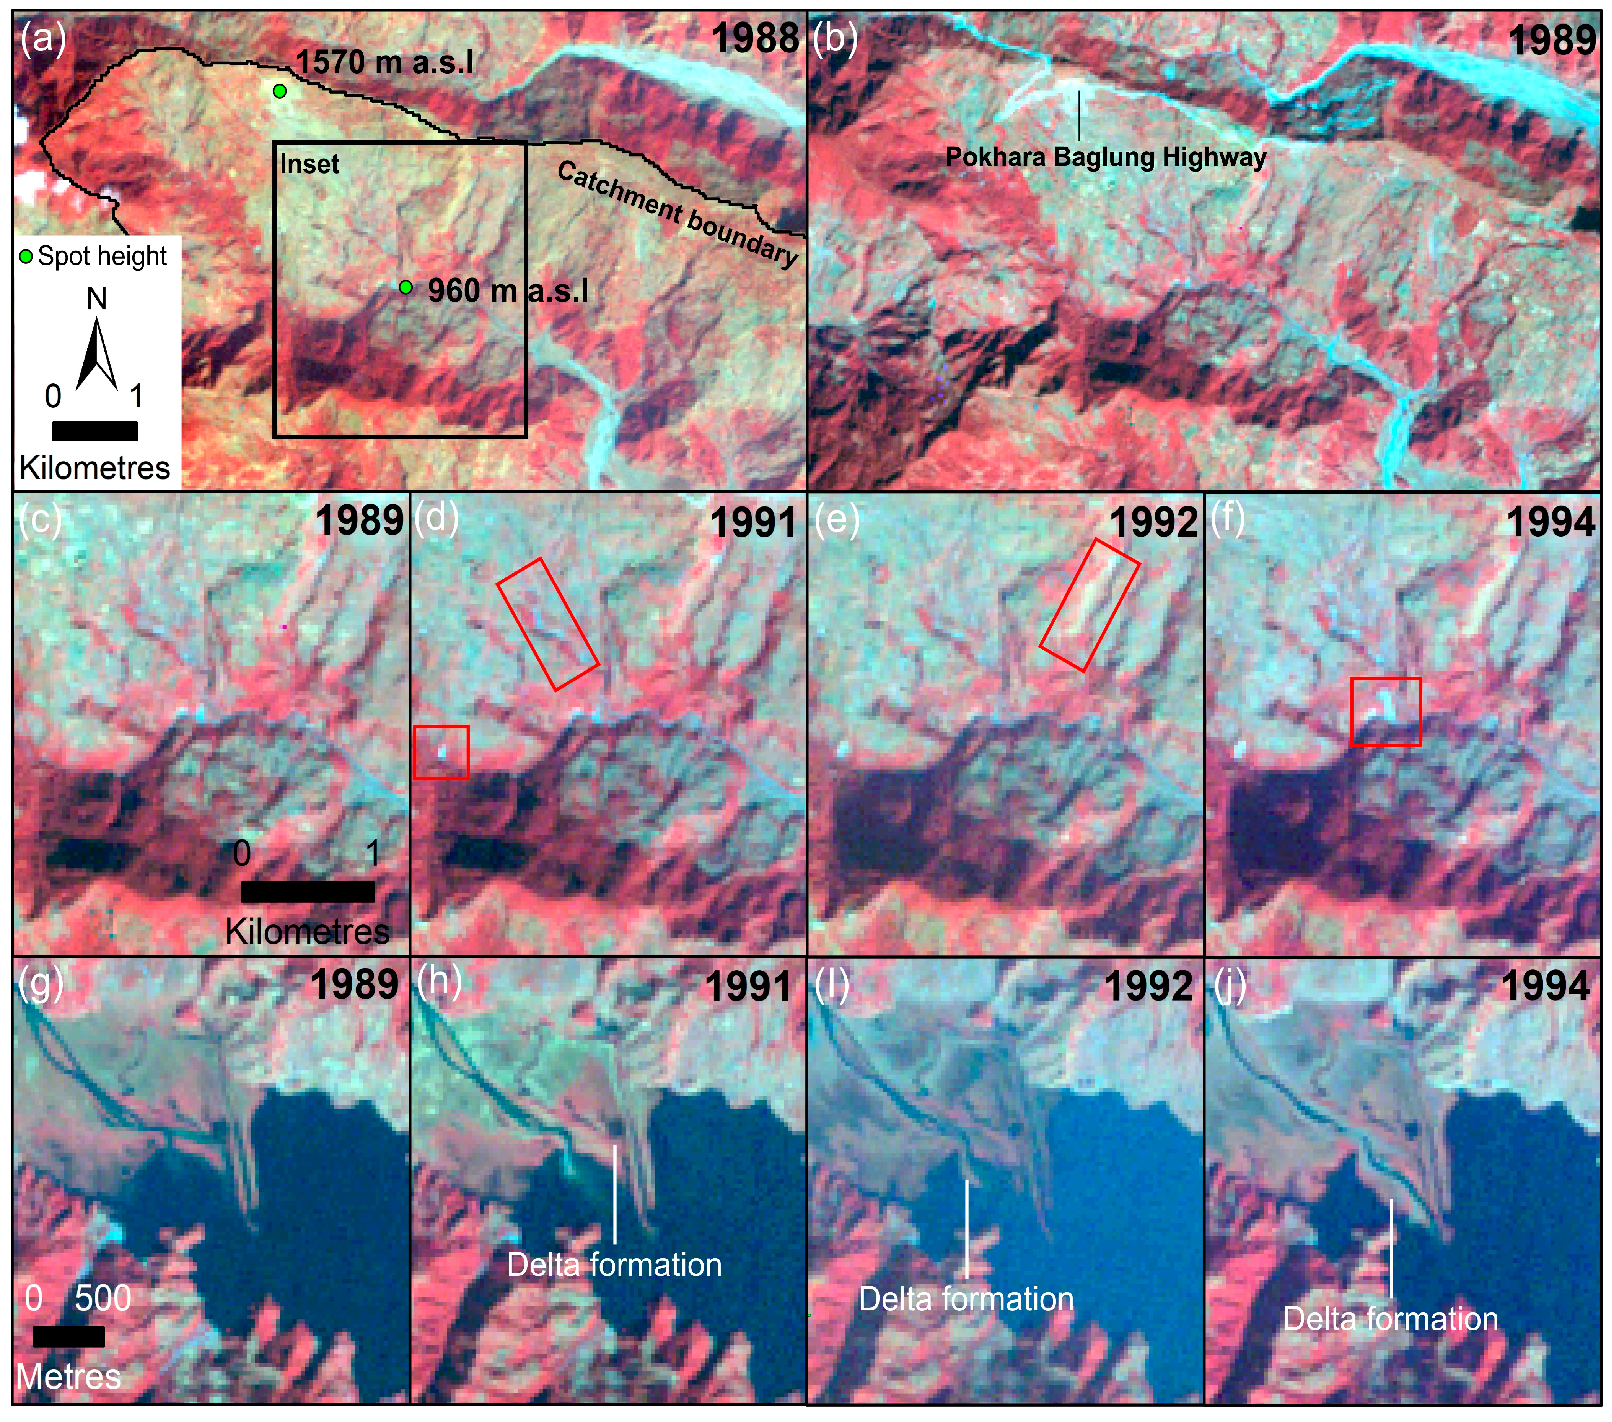
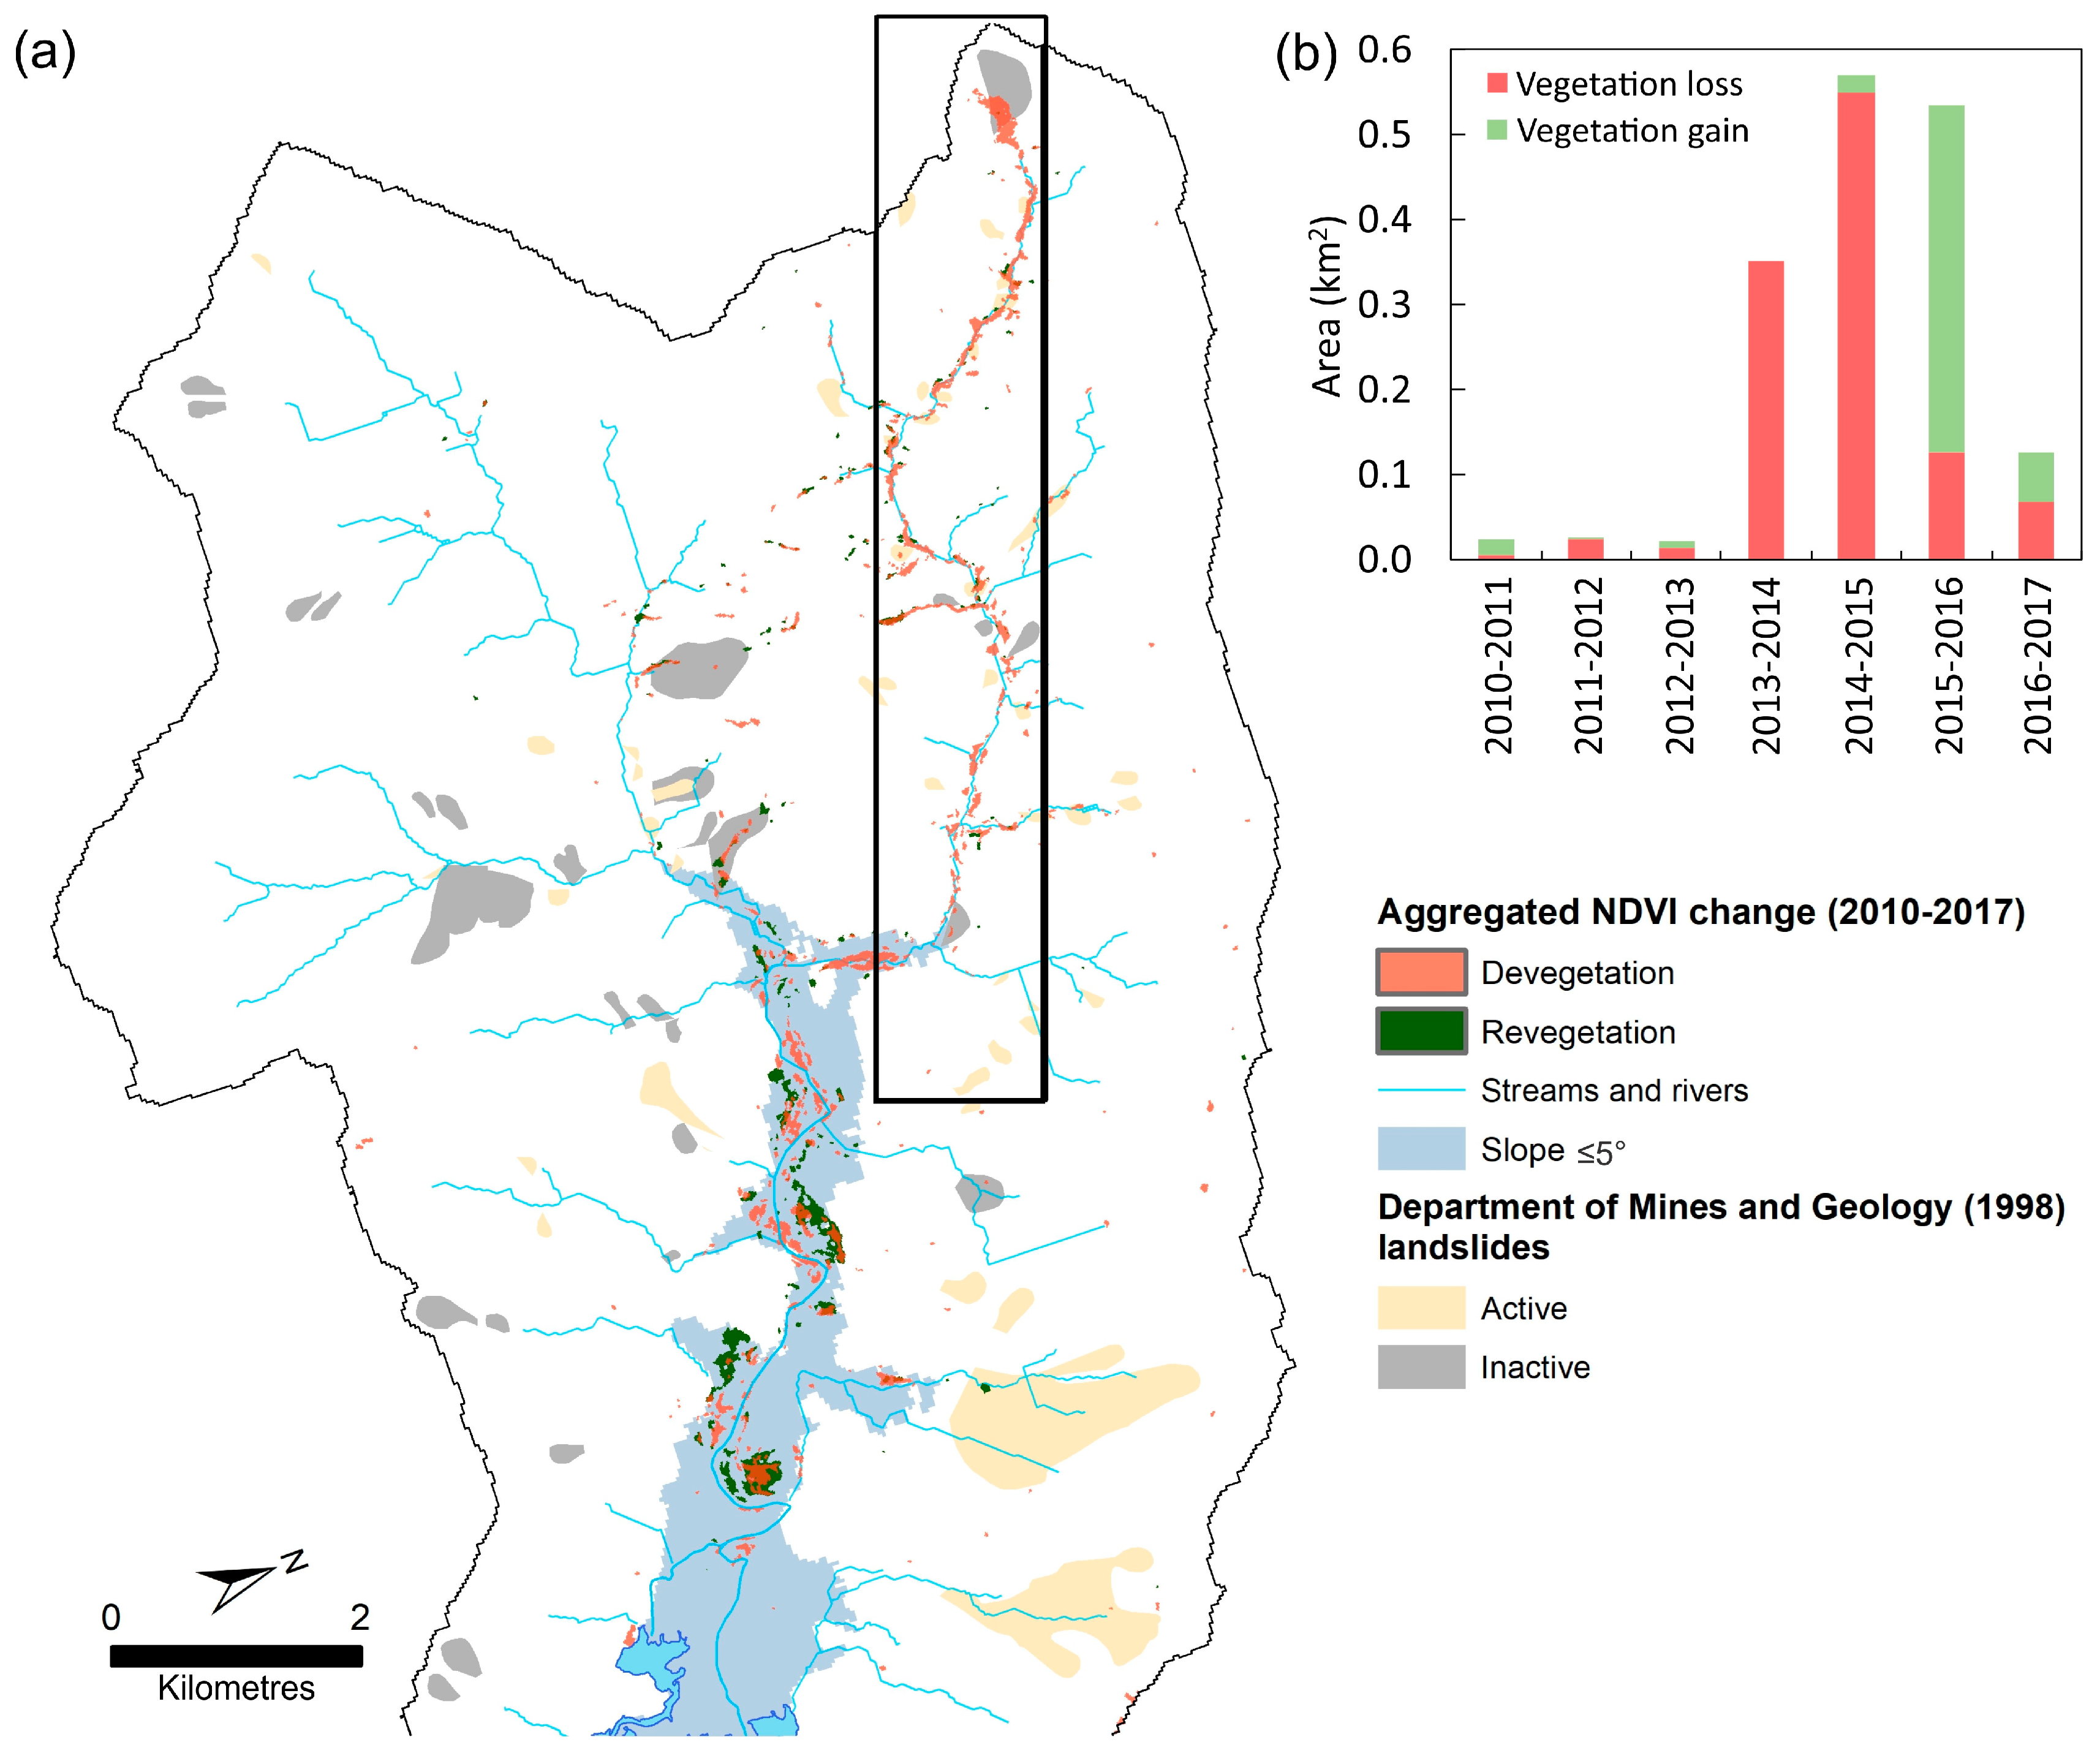
4.2. Urban Expansion and Landslides
5. Discussion
5.1. Lake Area and Volume Evolution
5.1.1. Pre-1982 Lake Area
5.1.2. Post-1982 Lake Area
5.1.3. Lake Volume
5.2. Urbanisation
6. Conclusions
Supplementary Materials
Author Contributions
Funding
Acknowledgments
Conflicts of Interest
References
- Petley, D. Global patterns of loss of life from landslides. Geology 2012, 40, 927–930. [Google Scholar] [CrossRef]
- Petley, D.N.; Hearn, G.J.; Hart, A.; Rosser, N.J.; Dunning, S.A.; Oven, K.; Mitchell, W.A. Trends in landslide occurrence in Nepal. Nat. Hazards 2007, 43, 23–44. [Google Scholar] [CrossRef]
- Kargel, J.S.; Leonard, G.J.; Shugar, D.H.; Haritashya, U.K.; Bevington, A.; Fielding, E.J.; Fujita, K.; Geertsema, M.; Miles, E.S.; Steiner, J.; et al. Geomorphic and geologic controls of geohazards induced by Nepal’s 2015 Gorkha earthquake. Science 2016, 351. [Google Scholar] [CrossRef]
- Leibundgut, G.; Sudmeier-Rieux, K.; Devkota, S.; Jaboyedoff, M.; Derron, M.-H.; Penna, I.; Nguyen, L. Rural earthen roads impact assessment in Phewa watershed, Western region, Nepal. Geoenviron. Disasters 2016, 3. [Google Scholar] [CrossRef]
- Mulmi, A.D. Green road approach in rural road construction for the sustainable development of Nepal. J. Sustain. Dev. 2009, 2. [Google Scholar] [CrossRef]
- Vuillez, C.; Tonini, M.; Sudmeier-Rieux, K.; Devkota, S.; Derron, M.-H.; Jaboyedoff, M. Land use changes, landslides and roads in the Phewa Watershed, Western Nepal from 1979 to 2016. Appl. Geogr. 2018, 94, 30–40. [Google Scholar] [CrossRef]
- Andermann, C.; Crave, A.; Gloaguen, R.; Davy, P.; Bonnet, S. Connecting source and transport: Suspended sediments in the Nepal Himalayas. Earth Planet. Sci. Lett. 2012, 351–352, 158–170. [Google Scholar] [CrossRef]
- Fort, M.; Cossart, E.; Arnaud-Fassetta, G. Hillslope-channel coupling in the Nepal Himalayas and threat to man-made structures: The middle Kali Gandaki valley. Geomorphology 2010, 124, 178–199. [Google Scholar] [CrossRef]
- Ross, J.; Gilbert, R. Lacustrine sedimentation in a monsoon environment: The record from Phewa Tal, middle mountain region of Nepal. Geomorphology 1999, 27, 307–323. [Google Scholar] [CrossRef]
- Heyojoo, B.P.; Takhachhe, P. An Assessment of Lake Area Shrinkage through Geospatial Approach: Case study of Phewa Lake of Kaski District, Nepal. Int. J. Multidiscip. Curr. Res. 2014, 2, 725–728. [Google Scholar]
- Aryal, V. Phewa Lake Watershed Area: A Study on the Challenges to Human Encroachment. In Proceedings of the Taal 2007: The 12th World Lake Conference, Jaipur, India, 29 October–2 November 2007; pp. 2292–2299. [Google Scholar]
- Pokharel, S. Conservation of Phewa Lake of Pokhara, Nepal. 2009. Available online: http://rcse.edu.shiga-u.ac.jp/gov-pro/plan/2008list/06-020503.pdf (accessed on 27 May 2018).
- Pokharel, S. Lessons from Nepal on Developing a Strategic Plan for the Integrated Lake Basin Management Conservation of Phewa Lake of Pokhara, Nepal. Sigha University and ILEC. 2009. Available online: https://www.ilec.or.jp/ILBMTrainingMaterials/resources/nepal_strategy.pdf (accessed on 4 June 2018).
- GoN/EbA/UNDP. Development of Ecosystem Based Sediment Control Techniques and Esign of Siltation Dam to Protect Phewa Lake. Summary Report. Prepared By Forum for Energy and Environment Development (FEED) P. Ltd. for The Ecosystem Based Adaptation in Mountain Ecosystems (EbA) Nepal Project. 2015. Available online: http://www.np.undp.org/content/dam/nepal/docs/reports/environment%20and%20energy/UNDP_EBA_Siltation_Dam_Summary_Report.pdf (accessed on 3 June 2018).
- JICA/SILT. Final Report on the Development Study on the Environmental Conservation of Phewa Lake in Pokhara, Nepal. 2002. Available online: http://open_jicareport.jica.go.jp/619/619/619_116_11688165.html (accessed on 3 June 2018).
- Dixit, A.; Karki, M.; Shukla, A. Vulnerability and Impacts Assessment for Adaptation Planning in Panchase Mountain. Ecological Region, Kathmandu, Nepal. 2015. Available online: https://reliefweb.int/sites/reliefweb.int/files/resources/dixit_et_al_2015_nepal_via_report_panchase_final.pdf (accessed on 23 July 2018).
- The Himalayan Times. Clear Encroachment around Phewa Lake: SC. Himal. Times. 2018. Available online: https://thehimalayantimes.com/nepal/clear-encroachment-around-phewa-lake-supreme-court/ (accessed on 13 July 2018).
- Shrestha, G.K.C.; Pradhan, A.M.S. Morphometry, Water Quality and Sedimentation of Phewa Lake, Pokhara, Nepal. 2010. Available online: https://www.researchgate.net/profile/Ananta_Pradhan/publication/273063004_WATER_QUALITY_ECOLOGICAL_STATUS_AND_BATHYMETRY_OF_PHEWA_LAKE_POKHARA/links/5565574708aec4b0f4859a38.pdf (accessed on 27 May 2018).
- Fleming, B.; Fleming, J.P. A watershed conservation success story in Nepal: Land use changes over 30 years. Waterlines 2009, 28, 29–46. [Google Scholar] [CrossRef]
- Fort, M. The Pokhara Valley: A Product of a Natural Catastrophe. In Geomorphological Landscapes of the World; Migon, P., Ed.; Springer: Dordrecht, The Netherlands, 2010; pp. 265–274. [Google Scholar]
- Yamanaka, H. Terrace landform and Quaternary deposit around Pokhara valley, central Nepal. J. Nepal Geol. Soc. 1982, 2, 113–142. [Google Scholar]
- Carson, B. Erosion and Sedimentation Processes in the Nepalese Himalaya: ICIMOD Occasional Paper No. 1. 1985. Available online: http://lib.icimod.org/record/21453/files/attachment_87.pdf (accessed on 3 June 2018).
- Stolle, A.; Bernhardt, A.; Schwanghart, W.; Hoelzmann, P.; Adhikari, B.R.; Fort, M.; Korup, O. Catastrophic valley fills record large Himalayan earthquakes, Pokhara, Nepal. Quat. Sci. Rev. 2017, 177, 88–103. [Google Scholar] [CrossRef]
- Monecke, K.; Winsemann, J.; Hanisch, J. Climatic response of Quaternary alluvial deposits in the upper Kali Gandaki valley (West Nepal). Glob. Planet. Chang. 2001, 28, 293–302. [Google Scholar] [CrossRef]
- Ramsay, W.J.H. Erosion in the Middle Himalaya, Nepal with a Case Study of the Phewa Valley. Unpublished Master’s Thesis, University of British Columbia, Vancouver, BC, Canada, 1985; 160p. [Google Scholar]
- U.S. Geological Survey. Declassified Intelligence Satellite Photographs: U.S. Geological Survey Fact Sheet 2008–3054. 2008; 2p. Available online: https://pubs.usgs.gov/fs/2008/3054/pdf/fs2008-3054.pdf (accessed on 7 February 2019).
- McFeeters, S.K. The use of the Normalized Difference Water Index (NDWI) in the delineation of open water features. Int. J. Remote Sens. 1996, 17, 1425–1432. [Google Scholar] [CrossRef]
- Huggel, C.; Kääb, A.; Haeberli, W.; Teysseire, P.; Paul, F. Remote sensing based assessment of hazards from glacier lake outbursts: A case study in the Swiss Alps. Can. Geotech. J. 2002, 39, 316–330. [Google Scholar] [CrossRef]
- Haritashya, U.; Kargel, J.; Shugar, D.; Leonard, G.; Strattman, K.; Watson, C.; Shean, D.; Harrison, S.; Mandli, K.; Regmi, D. Evolution and Controls of Large Glacial Lakes in the Nepal Himalaya. Remote Sens. 2018, 10, 798. [Google Scholar] [CrossRef]
- Impat, P. Hydrometeorology and Sediment Data for Phewa Watershed: 1979 Data; Project Field Document No. 15; Department of Soil Conservation and Watershed Management; Ministry of Forest and Soil Conservation: Kathmandu, Nepal, 1981; 29p.
- Department of Soil Conservation. Sedimentation Survey of Phewa Lake; Department of Soil Conservation (DSC); Research and Soil Conservation Sections; HMG Ministry of Forest and Soil Conservation: Kathmandu, Nepal, 1994; pp. 1–26.
- Bandini, F.; Olesen, D.; Jakobsen, J.; Kittel, C.M.M.; Wang, S.; Garcia, M.; Bauer-Gottwein, P. Technical note: Bathymetry observations of inland water bodies using a tethered single-beam sonar controlled by an unmanned aerial vehicle. Hydrol. Earth Syst. Sci. 2018, 22, 4165–4181. [Google Scholar] [CrossRef]
- Farr, T.G.; Rosen, P.A.; Caro, E.; Crippen, R.; Duren, R.; Hensley, S.; Kobrick, M.; Paller, M.; Rodriguez, E.; Roth, L.; et al. The Shuttle Radar Topography Mission. Rev. Geophys. 2007, 45. [Google Scholar] [CrossRef] [Green Version]
- Ramachandran, B.; Dwyer, J.; Raup, B.H.; Kargel, J.S. ASTER Datasets and Derived Products for Global Glacier Monitoring. In Global Land Ice Measurements from Space; Kargel, J.S., Leonard, G.J., Bishop, M.P., Kääb, A., Raup, B.H., Eds.; Springer: Berlin/Heidelberg, Germany, 2014; pp. 145–162. [Google Scholar]
- Planet Team. Planet Team. Planet Application Program Interface. In Space for Life on Earth; Planet Team: San Francisco, CA, USA, 2018. [Google Scholar]
- Deptartment of Mines and Geology. Engineering and Environmental Geological Map of Pokhara Valley; Scale 1:50,000; Deptartment of Mines and Geology: Kathmandu, Nepal, 1998.
- Gurung, T.B.; Wagle, S.K.; Bista, J.D.; Dhakal, R.P.; Joshi, P.L.; Batajoo, R.; Adhikari, P.; Rai, A.K. Participatory fisheries management for livelihood improvement of fishers in Phewa Lake, Pokhara, Nepal. Himal. J. Sci. 2005, 3, 47–52. [Google Scholar] [CrossRef]
- Francois, J. Recherches Experimentales sur l´ecologie la Jacinthe d´eau Eichhornia Crassipes (Mart.) Solms. Ph.D thesis, Faculte Sci Agronom, Gembloux, Belgium, 1970. [Google Scholar]
- The Himalayan Times. SC Gives Govt Six Months to Raze Structures near Phewa Lake. 2018. Available online: https://thehimalayantimes.com/nepal/supreme-court-gives-govt-six-months-to-raze-structures-near-phewa-lake/ (accessed on 12 February 2019).
- Rai, A.K. Limnological characteristics of subtropical Lakes Phewa, Begnas, and Rupa in Pokhara Valley, Nepal. Limnology 2000, 1, 33–46. [Google Scholar] [CrossRef]
- Dhakal, S. The Role of Landslides on the Sediment Budget in Upper Phewa Lake Watershed, Western Nepal. Master’s Thesis, Geo-Information Science and Earth Observations, University of Twente, Enschede, The Netherlands, 2016; 65p. Available online: https://webapps.itc.utwente.nl/librarywww/papers_2016/msc/aes/dhakal.pdf (accessed on 4 June 2018).
- The Himalayan Times. Kaski, Myagdi Landslides Claim 33. Himal. Times. 2015. Available online: https://thehimalayantimes.com/nepal/kaski-myagdi-landslides-claim-33/ (accessed on 24 July 2018).
- My Republica. Flood of Fear. 2016. Available online: http://admin.myrepublica.com/opinion/story/37525/flood-of-fear.html (accessed on 12 February 2019).
- The Kathmandu Post. Kaski Landslides: Death Toll Climbs to 30 (with Pictures). 2015. Available online: http://kathmandupost.ekantipur.com/news/2015-07-30/kaski-landslides-death-toll-climbs-to-30-with-pictures.html (accessed on 12 February 2019).
- Lau, W.K.M.; Kim, K.-M. Fingerprinting the impacts of aerosols on long-term trends of the Indian summer monsoon regional rainfall. Geophys. Res. Lett. 2010, 37. [Google Scholar] [CrossRef] [Green Version]
- Genesis Consultancy (P) Ltd. Report on Impact of Settlement Pattern, Land-Use Practice and Options in High Risk Areas; Report for UNDP/ERRRP; Genesis Consultancy (P) Ltd.: Pokhara Sub-Metropolitan City, Nepal, 2009. [Google Scholar]
- Baral, P.; Wen, Y.; Urriola, N. Forest Cover Changes and Trajectories in a Typical Middle Mountain Watershed of Western Nepal. Land 2018, 7. [Google Scholar] [CrossRef]
- Paudyal, K.; Baral, H.; Putzel, L.; Bhandari, S.; Keenan, R. Change in land use and ecosystem services delivery from community-based forest landscape restoration in the Phewa Lake watershed, Nepal. Int. For. Rev. 2017, 19, 88–101. [Google Scholar] [CrossRef]


| Data Source (Spatial Resolution) | Date | Lake Boundary Uncertainty (m) | Notes |
|---|---|---|---|
| 1:253,440 scale map | 1926 | 100 | Manual digitisation. Map No. 62 P. Publisher: Survey of India |
| 1:63,260 scale map | 1957–58 | 30 | Manual digitisation. Map Series Geographical Section, General Staff (GSGS) 5501, Sheet 62 P/16. Publisher: Survey of India |
| Corona satellite imagery (8 m) | 12 January 1961 | 4 | Manual digitisation. Imagery was georeferenced but not orthorectified. Available from: http://earthexplorer.usgs.gov |
| Hexagon satellite imagery (10 m) | 4 November 1974 | 5 | Manual digitisation. Available from: http://earthexplorer.usgs.gov |
| Landsat Multispectral Scanner (MSS) (60 m) | 15 December 1972 | 30 | Normalised difference water index (NDWI) |
| 20 January 1973 | |||
| 25 February 1975 | |||
| 15 March 1975 | |||
| 3 November 1975 | |||
| 11 October 1976 | |||
| Landsat 5 Thematic Mapper (TM) (30 m) | 6 February 1988 | 15 | NDWI |
| 4 March 1992 | |||
| 14 April 1994 | |||
| 30 April 2001 | |||
| 26 April 2011 | |||
| Landsat 8 Operational Land Imager (OLI (30 m) | 12 December 2017 | 15 | NDWI |
| QuickBird-2 Imagery accessed through Google Earth (~2 m) | 20 November 2004 | 2 | Manual digitisation |
| RapidEye (5 m) | 21 March 2010 | 2.5 | NDWI |
| 21 April 2011 | |||
| 22 March 2012 | |||
| 28 February 2013 | |||
| 13 March 2014 | |||
| 22 March 2015 | |||
| 22 March 2016 | |||
| 20 April 2017 | |||
| 16 April 2018 | |||
| PlanetScope (3 m) | 10 October 2017 | NDWI | |
| 27 March 2018 |
| Potentially Hazardous Area | Number of Buildings |
|---|---|
| Aggregated NDVI decrease 2010–2017 | 52 |
| Department of Mines and Geology (1998) old landslides | 15 |
| Department of Mines and Geology (1998) active landslides | 180 |
| Distance (m) | Date | Number of Buildings |
|---|---|---|
| 65 | 19th November 2004 | 185 |
| 200 | 784 | |
| 65 | 12th December 2017 | 505 |
| 200 | 1687 |
© 2019 by the authors. Licensee MDPI, Basel, Switzerland. This article is an open access article distributed under the terms and conditions of the Creative Commons Attribution (CC BY) license (http://creativecommons.org/licenses/by/4.0/).
Share and Cite
Watson, C.S.; Kargel, J.S.; Regmi, D.; Rupper, S.; Maurer, J.M.; Karki, A. Shrinkage of Nepal’s Second Largest Lake (Phewa Tal) Due to Watershed Degradation and Increased Sediment Influx. Remote Sens. 2019, 11, 444. https://doi.org/10.3390/rs11040444
Watson CS, Kargel JS, Regmi D, Rupper S, Maurer JM, Karki A. Shrinkage of Nepal’s Second Largest Lake (Phewa Tal) Due to Watershed Degradation and Increased Sediment Influx. Remote Sensing. 2019; 11(4):444. https://doi.org/10.3390/rs11040444
Chicago/Turabian StyleWatson, C. Scott, Jeffrey S. Kargel, Dhananjay Regmi, Summer Rupper, Joshua M. Maurer, and Alina Karki. 2019. "Shrinkage of Nepal’s Second Largest Lake (Phewa Tal) Due to Watershed Degradation and Increased Sediment Influx" Remote Sensing 11, no. 4: 444. https://doi.org/10.3390/rs11040444