The Influence of Heterogeneity on Lunar Irradiance Based on Multiscale Analysis

Abstract
: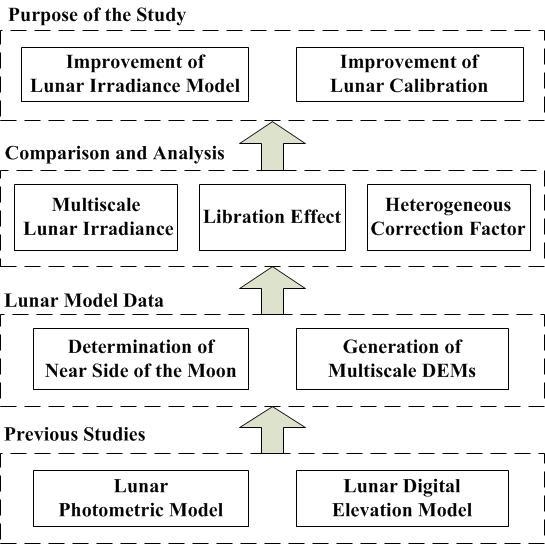
1. Introduction
2. Methodology
2.1. Generation of Multiscale DEMs
2.2. The Photometric Model
2.3. Generation of Multiscale Lunar Images
- The sub-Earth point is determined with knowledge of the Julian date using Spacecraft, Planet, Instruments, C-matrix, and Events (SPICE) toolkit.
- The latitude and longitude in moon-centered coordinates, with (−90°, 90°) longitude and (−90°, 90°) latitude is converted into a rectangular coordinate system.
- The rotation matrix is determined using Rodrigues’ rotation formula as follows:where represents the angle between the unit normal vector at (0°N, 0°W) in the moon-centered coordinate system () and the unit normal vector at sub-Earth point (), E represents the three-order unit matrix, and [kx, ky, kz]’ represents the unit vector of rotation axis, which is determined by the cross product of and .The rectangular coordinates after rotation are derived using the following equation:where represents the original points of the rectangular coordinate system and indicates the points after rotation.
- The rectangular coordinates are converted back into latitude and longitude in the moon-centered coordinate system.
2.4. Heterogeneous Correction Factor
3. Results
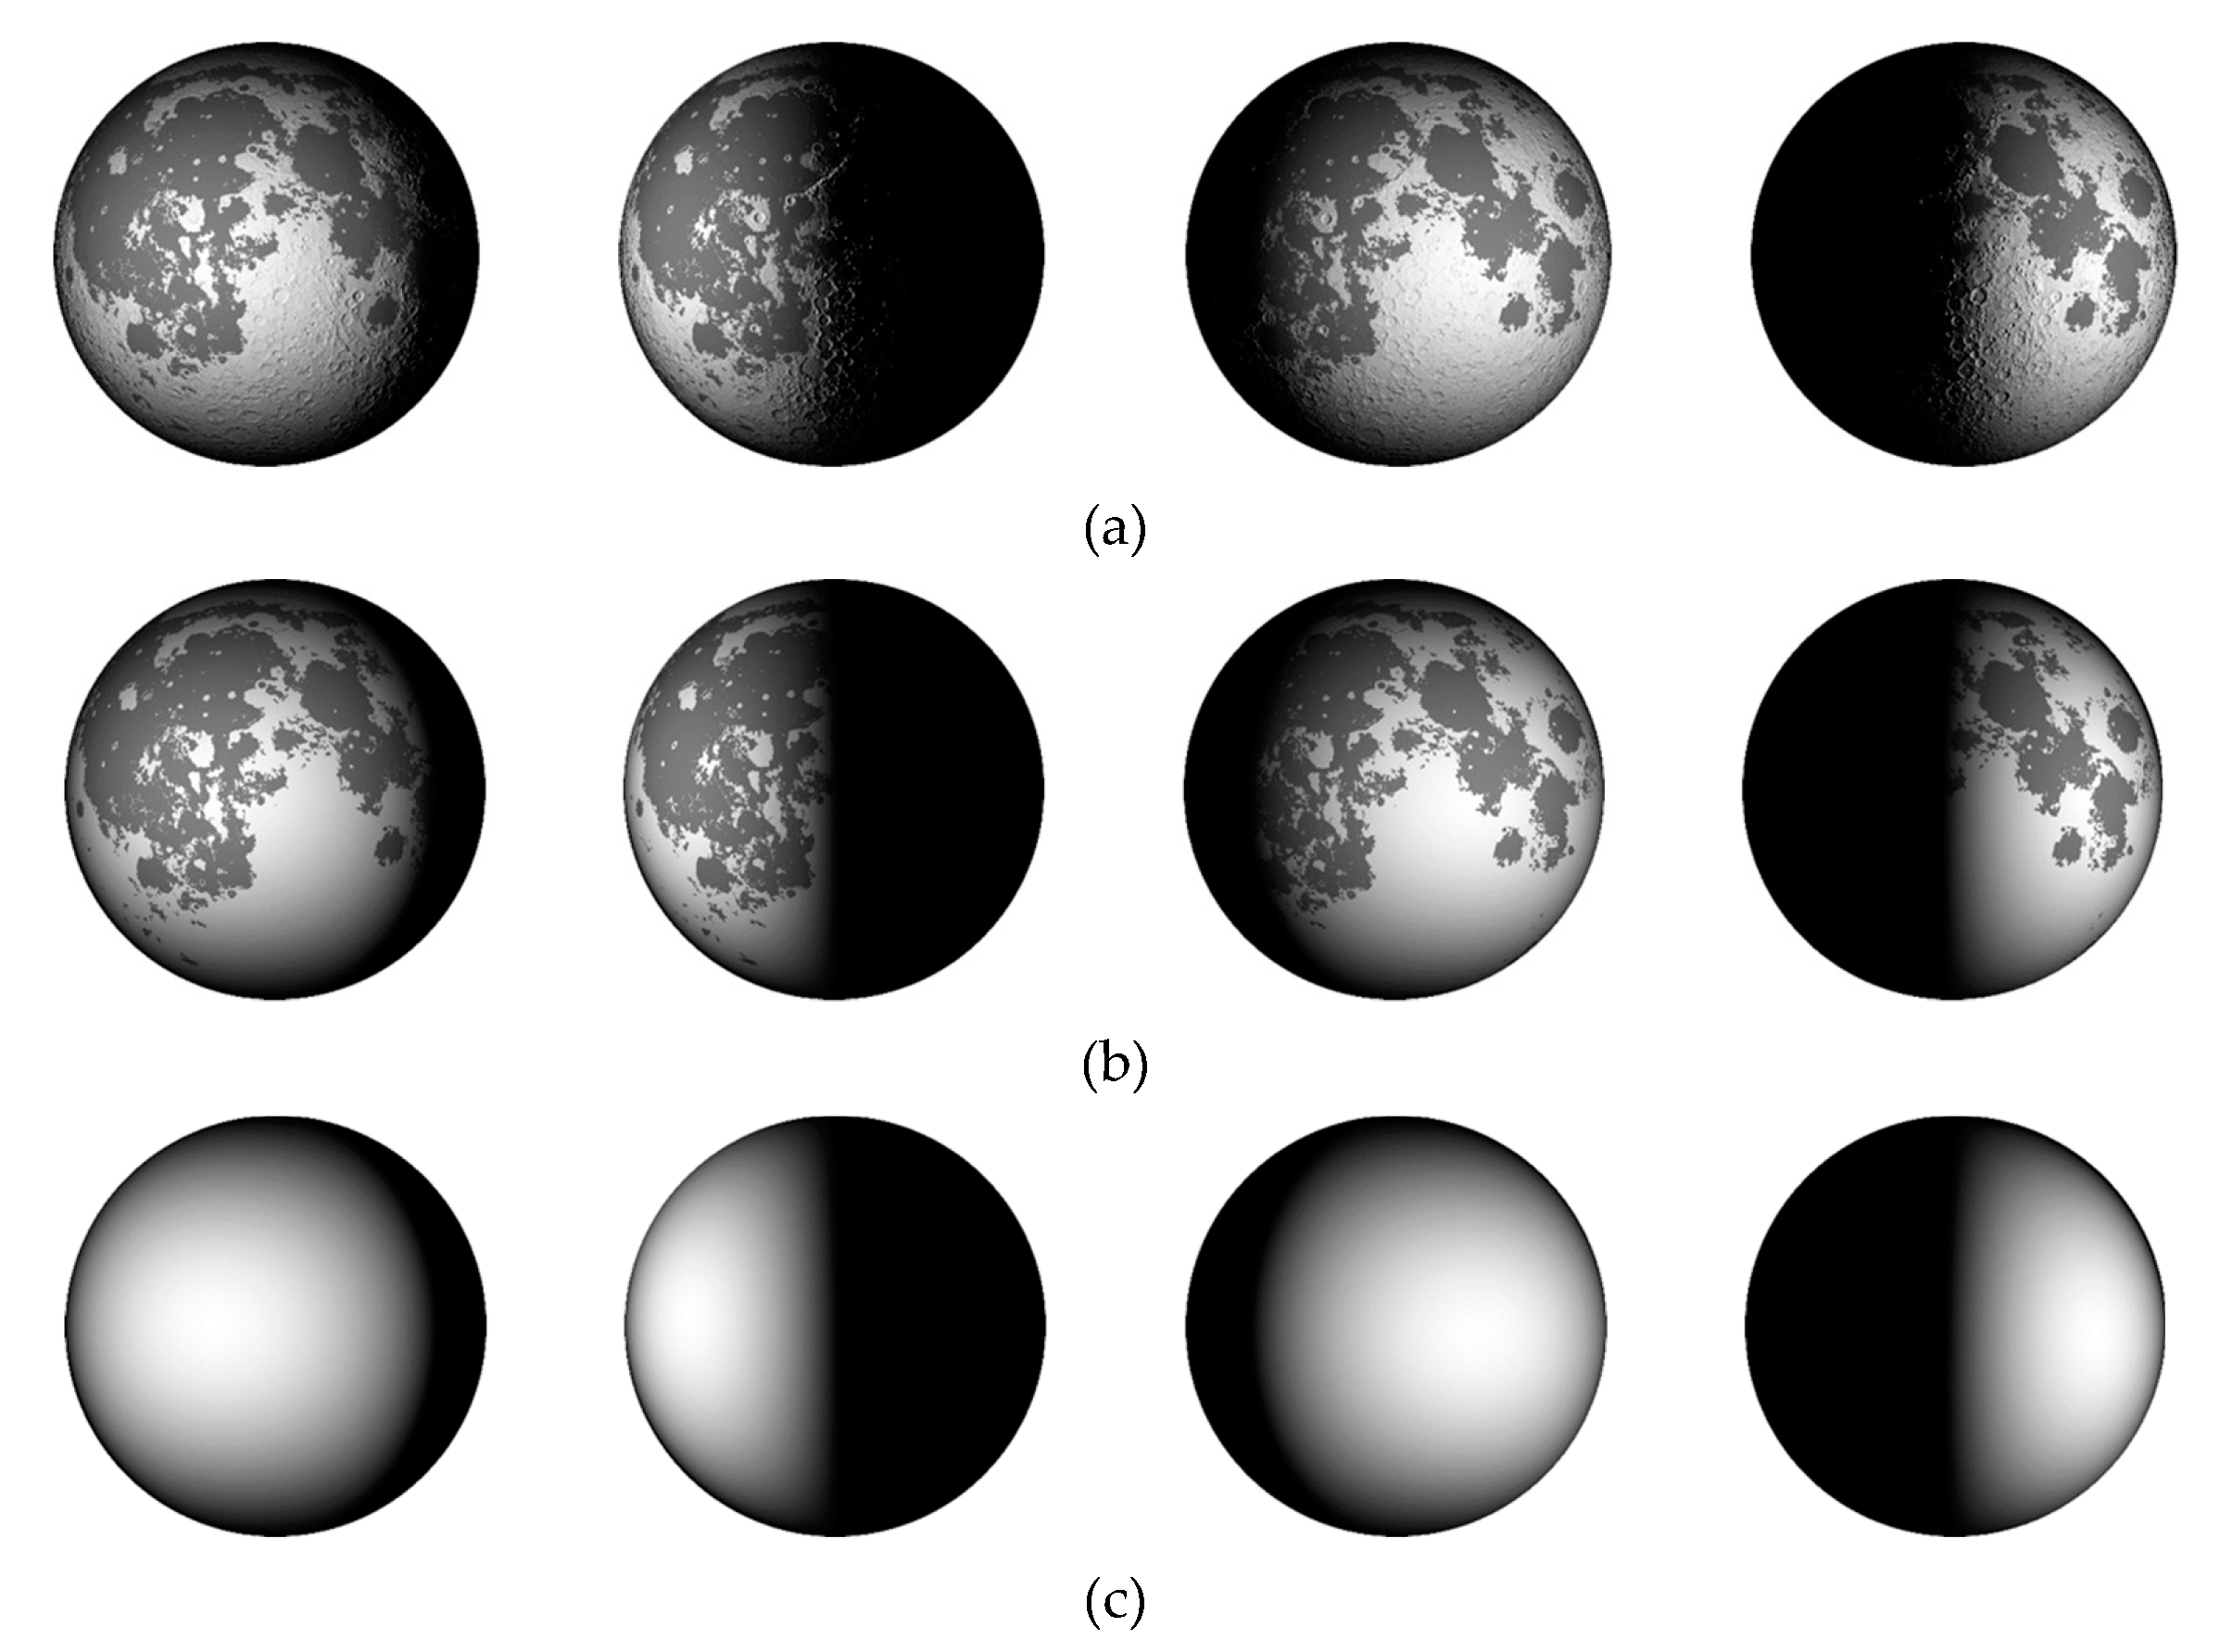
3.1. Comparison of Multiscale Lunar Images
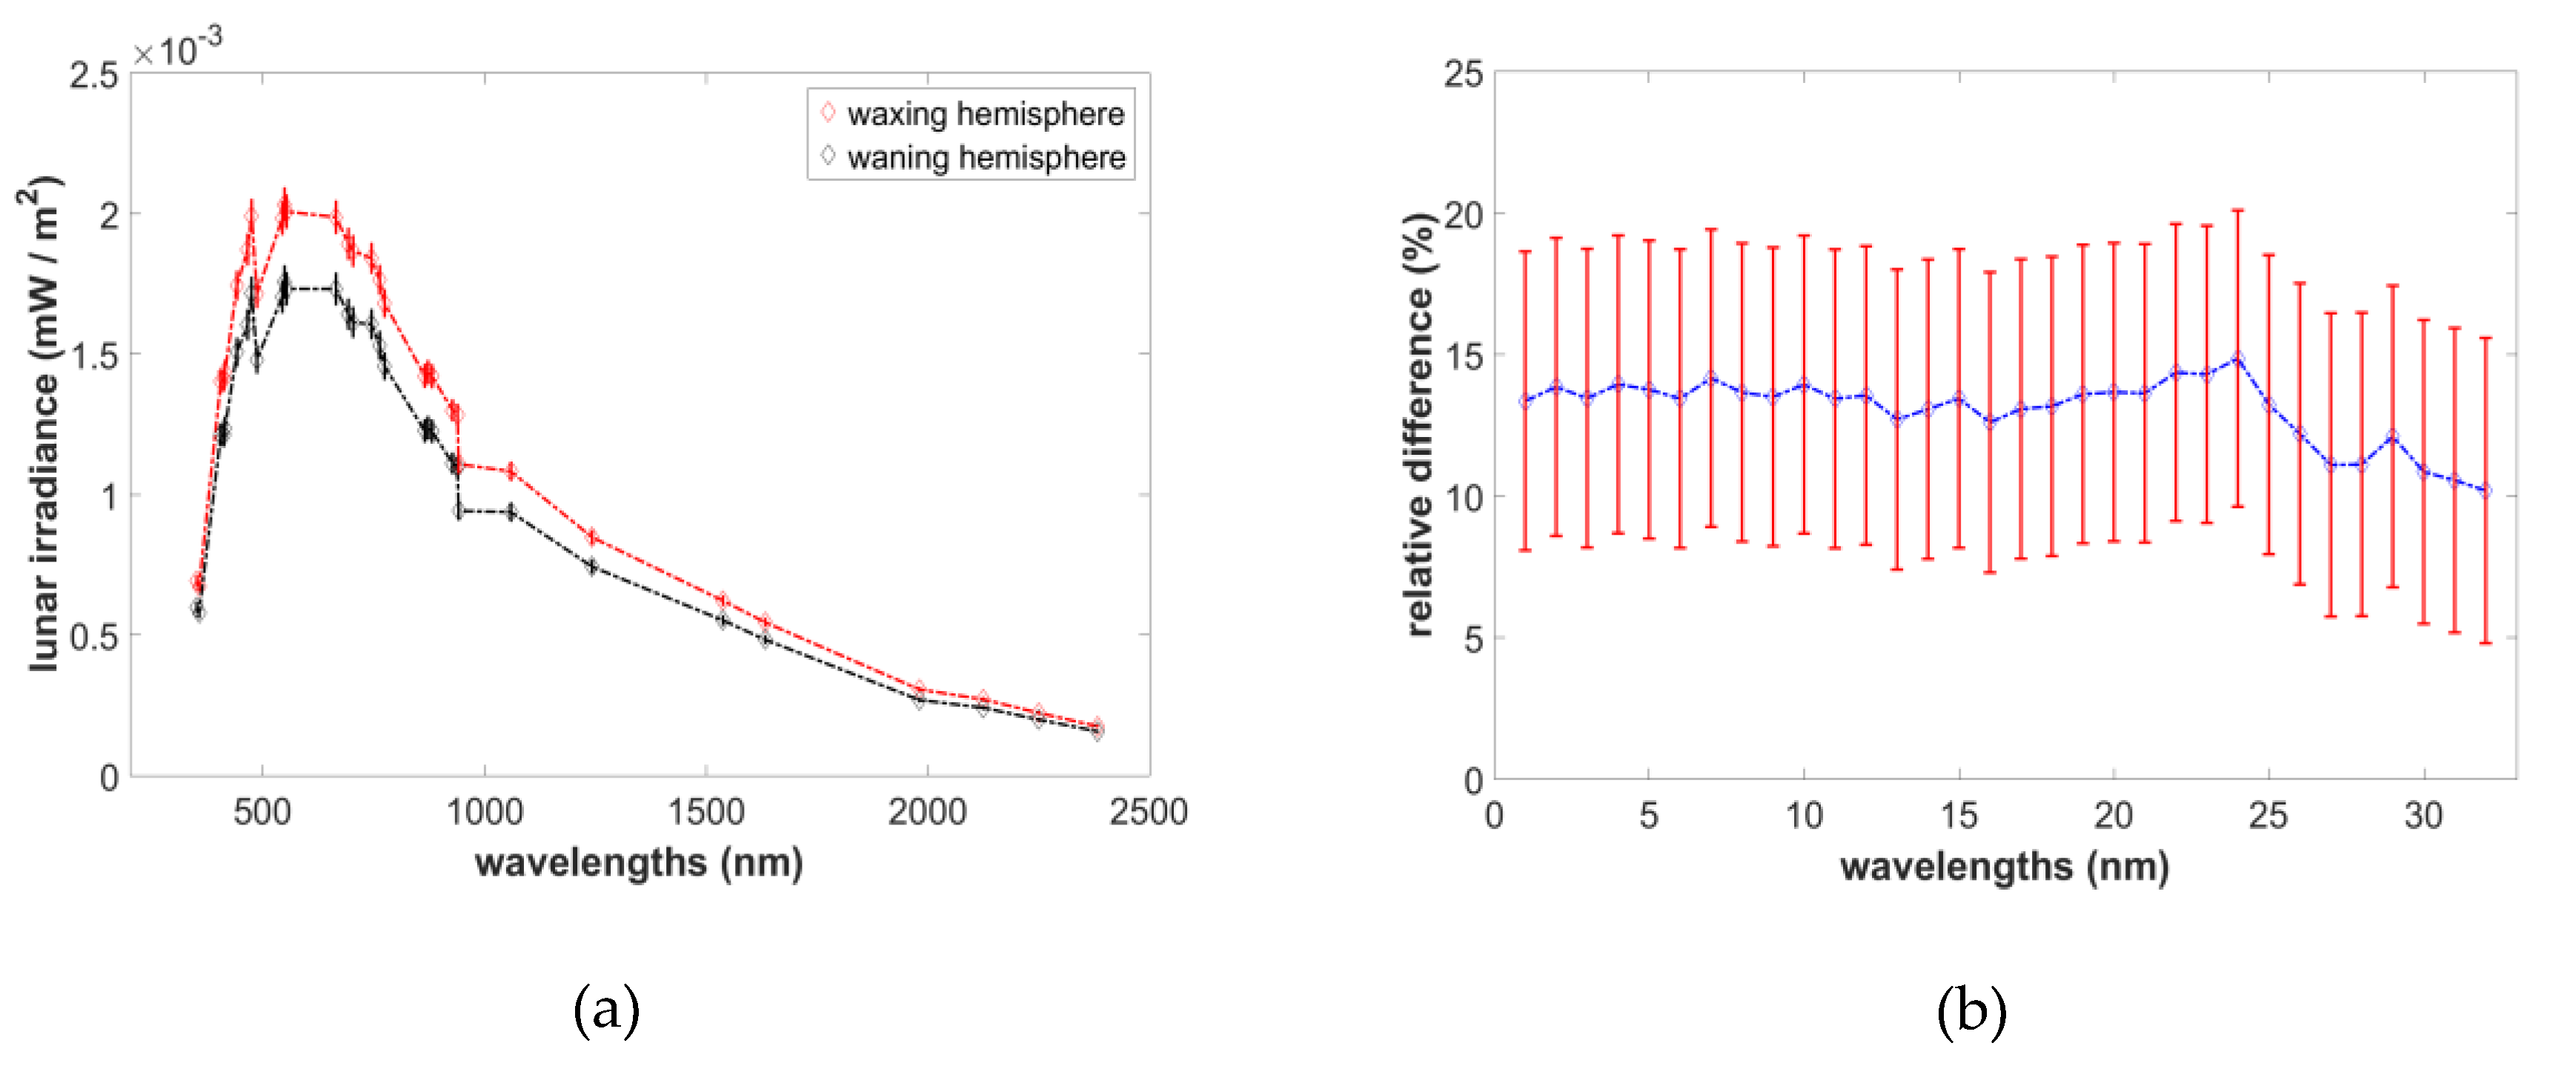
3.2. The Evaluation of Libration Effect
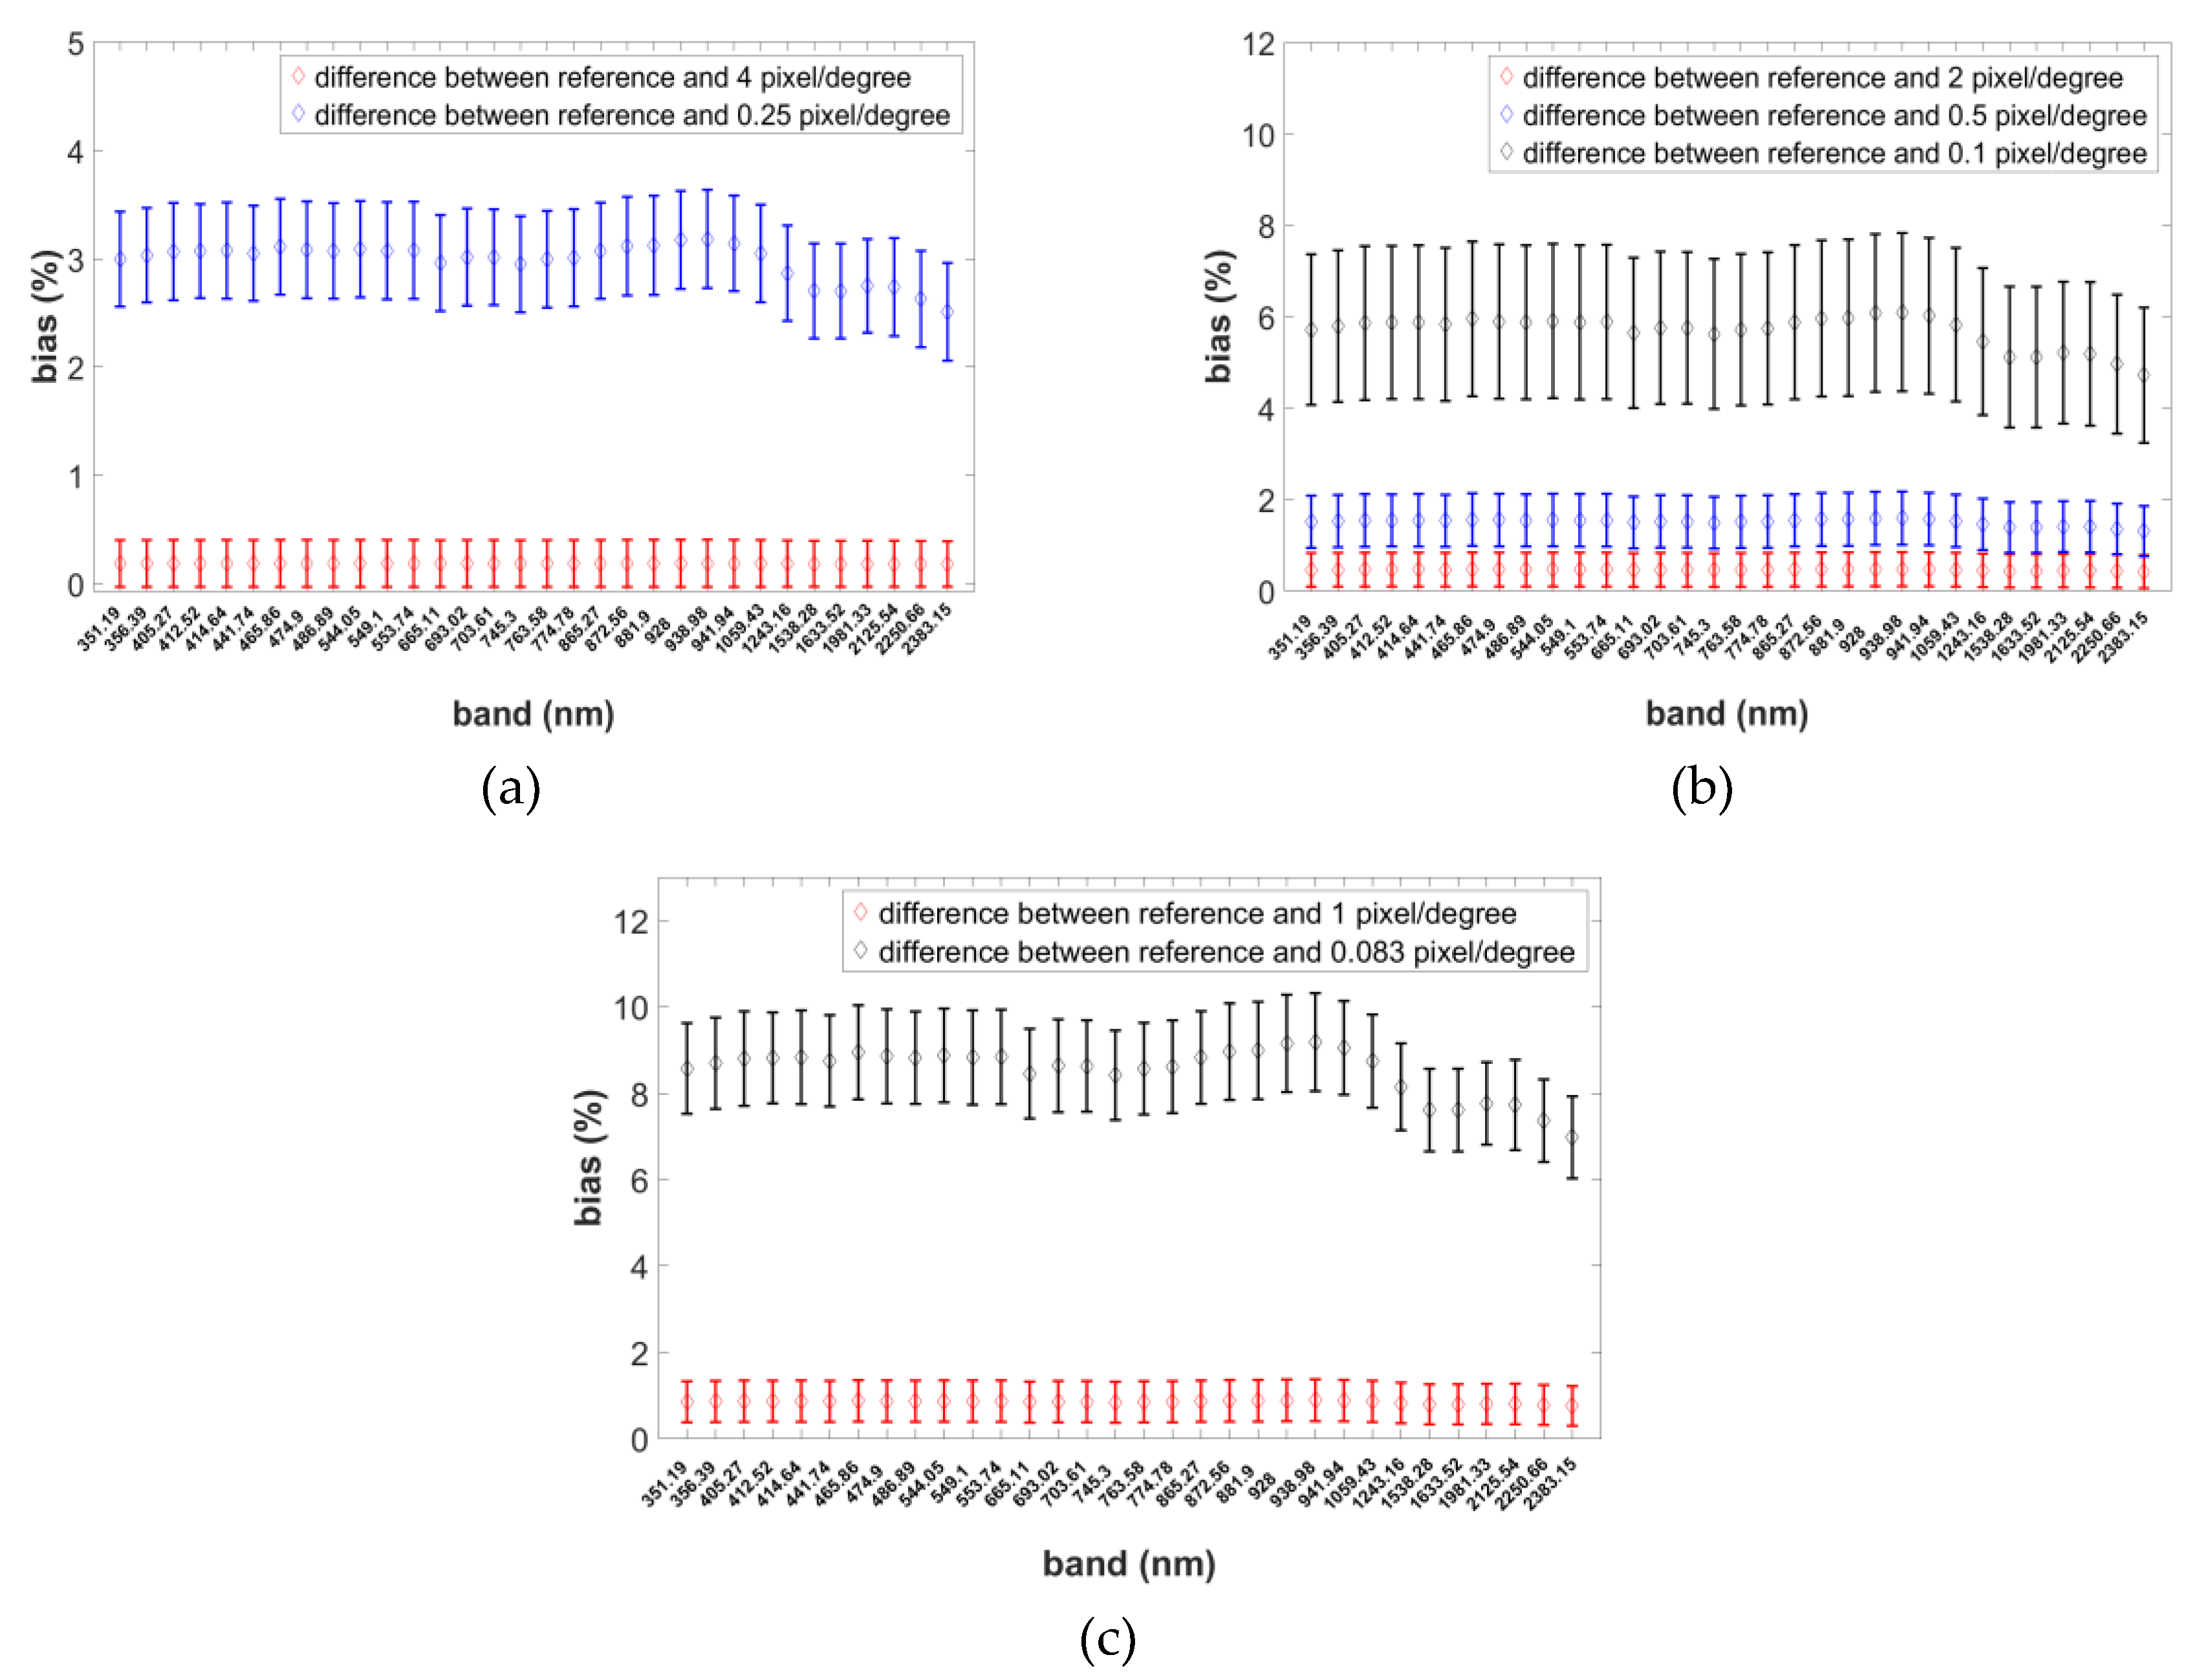
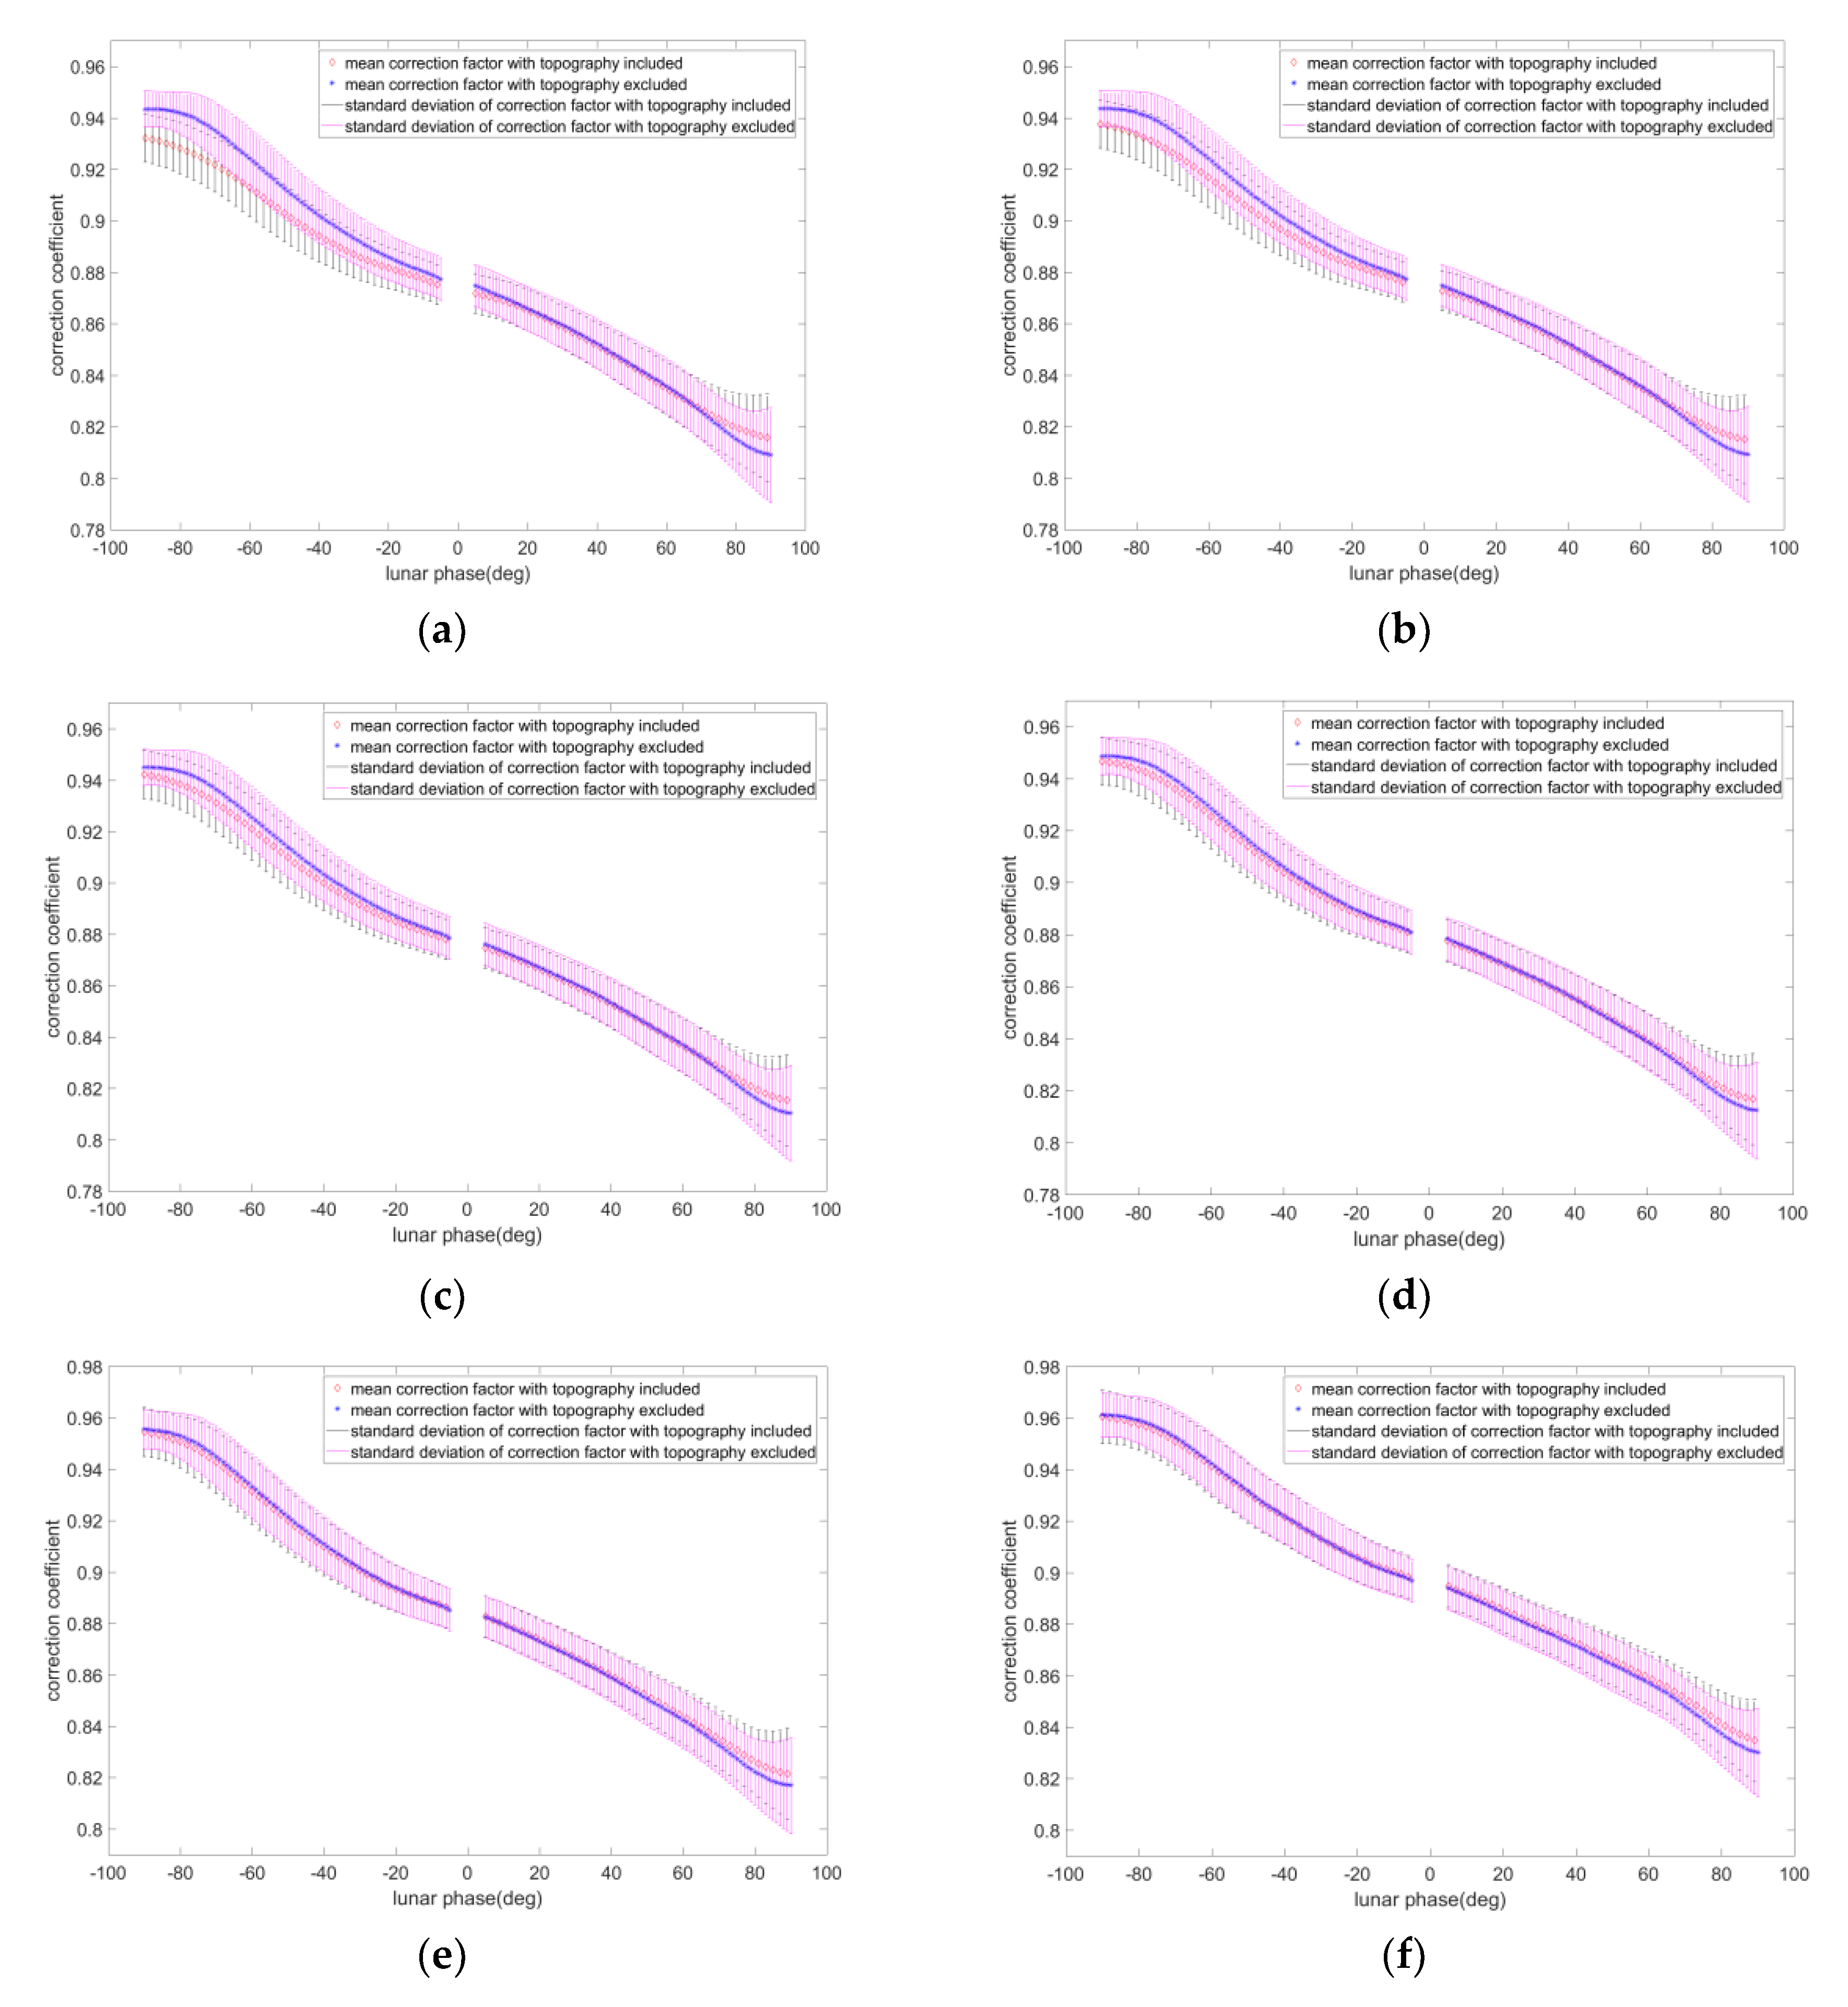
3.3. Heterogeneous Correction Factors at Different Scales
4. Discussion
4.1. The Challenge of the Study
4.2. The Analysis of the Results
4.3. Limitations
5. Conclusions
Author Contributions
Funding
Acknowledgments
Conflicts of Interest
References
- Sun, J.Q.; Xiong, X.; Barnes, W.L.; Guenther, B. MODIS Reflective Solar Bands On-Orbit Lunar Calibration. IEEE Trans. Geosci. Remote Sens. 2007, 45, 2383–2393. [Google Scholar] [CrossRef]
- Barnes, R.A.; Eplee, R.E.; Patt, F.S.; Kieffer, H.H.; Stone, T.C.; Meister, G.; Butler, J.J.; McClain, C.R. Comparison of SeaWiFS measurements of the Moon with the US Geological Survey lunar model. Appl. Opt. 2004, 43, 5838–5854. [Google Scholar] [CrossRef] [PubMed]
- Xiong, X.; Sun, J.; Fulbright, J.; Wang, Z.; Butler, J. Lunar Calibration and Performance for S-NPP VIIRS Reflective Solar Bands. IEEE Trans. Geosci. Remote Sens. 2016, 54, 1052–1061. [Google Scholar] [CrossRef]
- Kieffer, H.H.; Wildey, R.L. Absolute calibration of Landsat instruments using the Moon. Photogramm. Eng. Remote Sens. 1985, 51, 1391–1393. [Google Scholar]
- Kieffer, H.; Anderson, J.; Becker, K. Radiometric calibration of spacecraft using small lunar images. In Proceedings of the SPIE Remote Sensing, Florence, Italy, 20–23 September 1999; pp. 193–205. [Google Scholar]
- Wu, X.Q.; Stone, T.C.; Yu, F.F.; Han, D.J. Vicarious Calibration of GOES Imager Visible Channel Using the Moon. In Proceedings of SPIE-The International Society for Optical Engineering; 2006; Volume 6296, Available online: https://www.spiedigitallibrary.org/conference-proceedings-of-spie/6296/62960Z/Vicarious-calibration-of-GOES-Imager-visible-channel-using-the-Moon/10.1117/12.681591.short?SSO=1 (accessed on 11 November 2019).
- Kieffer, H.H.; Stone, T.C. The Spectral Irradiance of the Moon. Astron. J. 2005, 129, 2887. [Google Scholar] [CrossRef]
- Wagner, S.C.; Hewison, T.; Stone, T.; Lachérade, S.; Fougnie, B.; Xiong, X. A summary of the joint GSICS–CEOS/IVOS lunar calibration workshop: Moving towards intercalibration using the Moon as a transfer target. Hitotsubashi Rev. 2015, 116, 796–804. [Google Scholar]
- Brown, S.W.; Eplee, R.E., Jr.; Xiong, X. SI-traceable top-of-the-atmosphere lunar irradiance: Potential tie-points to the output of the ROLO model. Proc. SPIE 2017, 10402. [Google Scholar] [CrossRef]
- Miller, S.D.; Turner, R.E. A Dynamic Lunar Spectral Irradiance Data Set for NPOESS/VIIRS Day/Night Band Nighttime Environmental Applications. IEEE Trans. Geosci. Remote Sens. 2009, 47, 2316–2329. [Google Scholar] [CrossRef]
- Liao, L.B.; Weiss, S.; Mills, S.; Hauss, B. Suomi NPP VIIRS day/night band on-orbit performance. J. Geophys. Res. Atmos. 2013, 118, 12705–12718. [Google Scholar] [CrossRef]
- Barreto, Á.; Román, R.; Cuevas, E.; Berjón, A.J. Assessment of nocturnal aerosol optical depth from lunar photometry at the Izaña high mountain observatory. Atmos. Meas. Tech. 2017, 10, 3007–3019. [Google Scholar] [CrossRef]
- Qiu, S.; Shao, X.; Cao, C.; Uprety, S. Feasibility demonstration for calibrating Suomi-National Polar-Orbiting Partnership Visible Infrared Imaging Radiometer Suite day/night band using Dome C and Greenland under moon light. J. Appl. Remote Sens. 2016, 10. [Google Scholar] [CrossRef]
- Cao, C.; Bai, Y. Quantitative analysis of VIIRS DNB nightlight point source for light power estimation and stability monitoring. Remote Sens. 2014, 6, 11915–11935. [Google Scholar] [CrossRef]
- Li, X.; Xu, H.; Chen, X.; Li, C. Potential of NPP-VIIRS nighttime light imagery for modeling the regional economy of China. Remote Sens. 2013, 5, 3057–3081. [Google Scholar] [CrossRef]
- Hani, A.F.M.; Sathyamoorthy, D.; Asirvadam, V.S. A method for computation of surface roughness of digital elevation model terrains via multiscale analysis. Comput. Geosci. 2011, 37, 177–192. [Google Scholar] [CrossRef]
- Rosenburg, M.A.; Aharonson, O.; Head, J.W.; Kreslavsky, M.A.; Mazarico, E.; Neumann, G.A.; Smith, D.E.; Torrence, M.H.; Zuber, M.T. Global surface slopes and roughness of the Moon from the Lunar Orbiter Laser Altimeter. J. Geophys. Res. Planets 2011, 116. [Google Scholar] [CrossRef]
- Kreslavsky, M.A.; Head, J.W.; Neumann, G.A.; Rosenburg, M.A.; Aharonson, O.; Smith, D.E.; Zuber, M.T. Lunar topographic roughness maps from Lunar Orbiter Laser Altimeter (LOLA) data: Scale dependence and correlation with geologic features and units. Icarus 2013, 226, 52–66. [Google Scholar] [CrossRef]
- Cao, W.; Cai, Z.; Tang, Z. Lunar surface roughness based on multiscale morphological method. Planet. Space Sci. 2015, 108, 13–23. [Google Scholar] [CrossRef]
- Yokota, Y.; Matsunaga, T.; Ohtake, M.; Haruyama, J.; Nakamura, R.; Yamamoto, S.; Ogawa, Y.; Morota, T.; Honda, C.; Saiki, K. Lunar photometric properties at wavelengths 0.5–1.6 μm acquired by SELENE Spectral Profiler and their dependency on local albedo and latitudinal zones. Icarus 2011, 215, 639–660. [Google Scholar] [CrossRef]
- Wu, Y.Z.; Besse, S.; Li, J.Y.; Combe, J.P.; Wang, Z.C.; Zhou, X.Z.; Wang, C. Photometric correction and in-flight calibration of Chang’ E-1 Interference Imaging Spectrometer (IIM) data. Icarus 2013, 222, 283–295. [Google Scholar] [CrossRef]
- Buratti, B.J.; Hicks, M.D.; Nettles, J.; Staid, M.; Pieters, C.M.; Sunshine, J.; Boardman, J.; Stone, T.C. A wavelength-dependent visible and infrared spectrophotometric function for the Moon based on ROLO data. J. Geophys. Res. Planets 2011, 116. [Google Scholar] [CrossRef]
- Hicks, M.D.; Buratti, B.J.; Nettles, J.; Staid, M.; Sunshine, J.; Pieters, C.M.; Besse, S.; Boardman, J. A photometric function for analysis of lunar images in the visual and infrared based on Moon Mineralogy Mapper observations. J. Geophys. Res. Planets 2011, 116. [Google Scholar] [CrossRef]
- Miller, S.D.; Combs, C.; Wagner, S.; Viticchiè, B.; Walther, A.; Solbrig, J. Validation and Refinement of a Lunar Irradiance Model for Suomi NPP VIIRS Day-Night Band Quantitative Nighttime Applications. In Proceedings of the AGU Fall Meeting Abstracts, San Francisco, CA, USA, 15–19 December 2014; Volume 1, p. 3. [Google Scholar]
- Zeng, X.Z.; Shao, X.; Qiu, S.; Ma, L.L.; Gao, C.X.; Li, C.R. Stability Monitoring of the VIIRS Day/Night Band over Dome C with a Lunar Irradiance Model and BRDF Correction. Remote Sens. 2018, 10, 189. [Google Scholar] [CrossRef]
- Helmlinger, K.R.; Kumar, P.; Foufoula-Georgiou, E. On the use of digital elevation model data for Hortonian and fractal analyses of channel networks. Water Resour. Res. 1993, 29, 2599–2613. [Google Scholar] [CrossRef]
- Shannon, C.E. A mathematical theory of communication. Bell Syst. Tech. J. 1948, 27, 379–423. [Google Scholar] [CrossRef]
- Li, B.; Ling, Z.C.; Zhang, J.; Chen, J.; Wu, Z.C.; Ni, Y.H.; Zhao, H.W. Texture descriptions of lunar surface derived from LOLA data: Kilometer-scale roughness and entropy maps. Planet. Space Sci. 2015, 117, 303–311. [Google Scholar] [CrossRef]
- Zhang, X.Y.; Drake, N.A.; Mulligan, M. Comparison of slope estimates from low resolution DEMs: Scaling issues and a fractal method for their solution. Earth Surf. Process. Landf. 2015, 24, 763–779. [Google Scholar] [CrossRef]
- Chen, Y.; Zhou, Q. A scale-adaptive DEM for multi-scale terrain analysis. Int. J. Geogr. Inf. Sci. 2013, 27, 1329–1348. [Google Scholar] [CrossRef]
- Hillier, J.K.; Buratti, B.J.; Hill, K. Multispectral Photometry of the Moon and Absolute Calibration of the Clementine UV/Vis Camera. Icarus 1999, 141, 205–225. [Google Scholar] [CrossRef]
- Shao, X.; Wu, X.; Yu, F. Selenographic coordinate mapping of lunar observations by GOES imager. Proc. SPIE 2015. [Google Scholar] [CrossRef]
- Smith, A.W.; Lorentz, S.R.; Stone, T.C.; Datla, R.V. Lunar Spectral Irradiance and radiance (LUSI): New instrumentation to characterize the Moon as a space-based radiometric standard. J. Res. Natl. Inst. Stand Technol. 2012, 117, 185–201. [Google Scholar] [CrossRef]
- Kieffer, H.H. Establishing the moon as a spectral radiance standard. J. Atmos. Ocean. Technol. 1996, 13, 360–375. [Google Scholar] [CrossRef]
- Shkuratov, Y.G.; Kreslavsky, M.A.; Ovcharenko, A.A.; Stankevich, D.G.; Zubko, E.S. Opposition Effect from Clementine Data and Mechanisms of Backscatter. Icarus 1999, 141, 132–155. [Google Scholar] [CrossRef]
- Yokota, Y.; Iijima, Y.; Honda, R.; Okada, T.; Mizutani, H. Photometric properties of the Moon: Phase curves at small phase angles (0–10°) by clementine images. Adv. Space Res. 1999, 23, 1841–1844. [Google Scholar] [CrossRef]
- Velikodsky, Y.I.; Korokhin, V.V.; Shkuratov, Y.G.; Kaydash, V.G.; Videen, G. Opposition effect of the Moon from LROC WAC data. Icarus 2016, 275, 1–15. [Google Scholar] [CrossRef]


| Scale Level | 8 pixels/degree | 4 pixels/degree | 2 pixels/degree | 1 pixel/degree |
| Entropy | 16,977.78 | 4272.33 | 1087.52 | 285.41 |
| Scale level | 0.5 pixels/degree | 0.25 pixels/degree | 0.1 pixels/degree | 0.083 pixels/degree |
| Entropy | 81.65 | 28.43 | 11.25 | 10.44 |
| Waning Hemisphere | Waxing Hemisphere | |||
|---|---|---|---|---|
| Scale Level | 256 pixels/degree | 8 pixels/degree | 256 pixels/degree | 8 pixels/degree |
| Entropy | 5,239,252.83 | 5130.96 | 5,124,114.39 | 5024.82 |
| Band | 1 | 2 | 3 | 4 | 5 | 6 | 7 | 8 |
| Uncertainty (%) | 1.05 0.98 | 1.08 1.01 | 1.06 0.99 | 1.09 1.02 | 1.07 1.01 | 1.05 0.99 | 1.10 1.03 | 1.07 1.00 |
| Band | 9 | 10 | 11 | 12 | 13 | 14 | 15 | 16 |
| Uncertainy (%) | 1.06 0.99 | 1.09 1.02 | 1.05 0.99 | 1.06 0.99 | 1.01 0.94 | 1.03 0.96 | 1.05 0.99 | 1.00 0.93 |
| Band | 17 | 18 | 19 | 20 | 21 | 22 | 23 | 24 |
| Uncertainty | 1.03 0.96 | 1.04 0.97 | 1.06 1.00 | 1.07 1.00 | 1.07 1.00 | 1.11 1.04 | 1.11 1.04 | 1.15 1.07 |
| Band | 25 | 26 | 27 | 28 | 29 | 30 | 31 | 32 |
| Uncertainty (%) | 1.04 0.97 | 0.98 0.91 | 0.91 0.85 | 0.91 0.85 | 0.97 0.90 | 0.90 0.83 | 0.88 0.81 | 0.86 0.79 |
| Band | 1 | 2 | 3 | 4 | 5 | 6 | 7 | 8 |
| Uncertainty (%) | 2.25 1.04 | 2.28 1.05 | 2.32 1.07 | 2.22 1.04 | 2.31 1.06 | 2.20 1.03 | 2.33 1.07 | 2.31 1.06 |
| Band | 9 | 10 | 11 | 12 | 13 | 14 | 15 | 16 |
| Uncertainy (%) | 2.22 1.04 | 2.31 1.06 | 2.31 1.06 | 2.32 1.06 | 2.14 1.01 | 2.25 1.04 | 2.25 1.04 | 2.13 1.01 |
| Band | 17 | 18 | 19 | 20 | 21 | 22 | 23 | 24 |
| Uncertainty (%) | 2.22 1.04 | 2.25 1.04 | 2.22 1.04 | 2.34 1.07 | 2.36 1.08 | 2.38 1.08 | 2.39 1.08 | 2.23 1.04 |
| Band | 25 | 26 | 27 | 28 | 29 | 30 | 31 | 32 |
| Uncertainty (%) | 2.19 1.03 | 2.06 0.99 | 1.91 0.94 | 1.93 0.95 | 1.96 0.96 | 2.22 1.04 | 1.84 0.92 | 1.77 0.90 |
© 2019 by the authors. Licensee MDPI, Basel, Switzerland. This article is an open access article distributed under the terms and conditions of the Creative Commons Attribution (CC BY) license (http://creativecommons.org/licenses/by/4.0/).
Share and Cite
Zeng, X.; Li, C. The Influence of Heterogeneity on Lunar Irradiance Based on Multiscale Analysis. Remote Sens. 2019, 11, 2696. https://doi.org/10.3390/rs11222696
Zeng X, Li C. The Influence of Heterogeneity on Lunar Irradiance Based on Multiscale Analysis. Remote Sensing. 2019; 11(22):2696. https://doi.org/10.3390/rs11222696
Chicago/Turabian StyleZeng, Xiangzhao, and Chuanrong Li. 2019. "The Influence of Heterogeneity on Lunar Irradiance Based on Multiscale Analysis" Remote Sensing 11, no. 22: 2696. https://doi.org/10.3390/rs11222696