Article

Analysis of Changes in Forest Structure using Point Clouds from Historical Aerial Photographs

Department of Agricultural Land Surveying, Cadastre and Photogrammetry, Faculty of Environmental Engineering and Land Surveying, University of Agriculture in Krakow, 31-120 Krakow, Poland
*
Author to whom correspondence should be addressed.
Remote Sens. 2019, 11(19), 2259; https://doi.org/10.3390/rs11192259
Submission received: 22 July 2019 / Revised: 6 September 2019 / Accepted: 17 September 2019 / Published: 27 September 2019

Abstract

:
Dynamic changes in land use, many of which are related to land abandonment, are taking place in many regions of the world. As a result, forest vegetation appears, which in part is a consequence of planned afforestation programs and in part has the characteristics of secondary forest succession. Monitoring of forest structure allows the range and dynamics of such changes to be identified. The aim of the study was to assess the usefulness of historical aerial photographs in the determination of forest structure. On the basis of such data, a point cloud was created which represented the forest structure in 1966. Subsequently, using airborne laser scanning data for the same area, corresponding datasets describing the situation in 2012 were created. Comparison of the two tall vegetation models made it possible to perform four analyses related to forest structure changes over a period of 46 years. The analyses were carried out in four areas in southern Poland. The analysis of the results confirmed that historical aerial photographs may be a valuable source in long-term analyses of changes in the range and height structure of areas containing tall vegetation.

Graphical Abstract

1. Introduction

The accelerating rate of climate change, together with demographic, social, and economic processes, causes several significant land-use changes [1]. These affect the growth or contraction of the surface area of crops, or changes in agricultural production trends. This increase in arable land is caused mostly by the growing rural population or the intensive expansion of large-scale agricultural holdings, including intensive monocrop farms in the tropics. The reduction in agricultural land is typical of countries with a negative birth rate and migration from rural to urban areas [2]. As a result of reduced workforce, those pieces of land are cultivated where the yield is obtained with the lowest labor input. Areas with high labor input become unattractive for farmers. Over time, such pieces of land are abandoned. In such cases, the abandonment of agricultural land primarily affects the areas that are least suitable for economically sustainable agricultural production [3] because of significant fragmentation [4], low soil quality [5], or difficult topography [6]. Climate change is another critical factor in crop abandonment as it degenerates natural conditions, particularly access to water in many areas where farming is the traditional type of land use.
Central and eastern Europe is a region where agricultural land is being abandoned intensively. This fact is related to the adjustment of agriculture to changes effected after the fall of socialism at the beginning of the 1990s [7,8]. Other important factors that affect land-use change include climate change, which is particularly severe in southern Europe, Italy, Portugal, and Spain [9]. The most common effect of the abandonment of agricultural land in Europe is the appearance of various forms of tree vegetation. This is mostly a result of planned afforestation of the least agriculturally valuable land, but many areas are dominated by secondary forest succession [10].
Land-use change monitoring is of great importance in managing the use and development of land resources [11]. The analysis of long- and short-term changes and their dynamics facilitates the development of appropriate tools for local and regional policies to support specific development directions and limit the identified rural development issues [12,13].
The pace and direction of these changes can be pinpointed using many data sources, including cadastral data and cartographic documents. Still, remote sensing data is the key source in land-cover change analysis [14,15,16]. This data can be collected using various measuring systems on airplanes, satellites, or unmanned aerial vehicles (UAVs). Geospatial data collected using remote sensing are represented in satellite images, aerial photographs, or point clouds. It is possible to determine the dynamics of land-use change [17] and analyze these changes in the height structure of tree vegetation using remote sensing data from various periods [18,19].
Historical aerial photographs may be of particular value here as they are a means of reproducing the state of a particular area from before other remote sensing techniques were available [20]. Such photographs, which were archived in virtually every country in the world since the first half of the 20th century [21], were taken with stereoscopic coverage, which provides great potential for three-dimensional (3D) documentation of past changes [22]. Modern image-processing technologies, in particular SfM (structure from motion), can compute aerotriangulation for blocks of photographs that do not have complete interior orientation data [23]. This is of particular importance when archives do not have camera calibration reports or adjustment information for some blocks.
The use of historical aerial photograph stereograms to reconstruct vegetation height profiles in a nature reserve was described by Będkowski [24], and the use of aerial photograph stereograms in multitemporal landslide studies was discussed by Kamiński [25]. In her work, Kaczmarek presented an example of the use of individual historical aerial photographs combined with other cartographic sources to study the variability of the shoreline of an artificial water reservoir [26]. In their paper on the Błędów Desert, Bryś and Gołuch [27] also used historical aerial and satellite images from various periods. St-Onge et al. [28] demonstrated that it was possible to integrate airborne laser scanning data (light detection and ranging (LiDAR) ALS) and digital stereophotogrammetry to map forest canopy height. Ullah [29] achieved similar results using a similar method of generating point clouds from images. The high consistency of tree height data from the identification of individual crowns in a photogrammetric point cloud (PPC) and a point cloud from airborne laser scanning was demonstrated by the authors of [30]. Ullah [31] indicated that photogrammetric methods aided by a digital terrain model (DTM) from airborne laser scanning yielded similar accuracies of forest tree volume calculation to pure airborne scanning data and may be used to this end when no ALS data are available. Also, Maltamo et al. [32] proved the value of point clouds generated from digital aerial photographs in decision-making processes regarding forests; they also pointed out the lower cost of this information compared to ALS data. According to Korpela [33], it is possible to obtain high-quality spatial data from historical photographs spanning 42 years when combined with airborne laser scanning data. This author also mentioned the issue of missing camera calibration data, deformed negatives in archives, and the necessity of finding spatial invariants as tie points for images taken in periods for which no aerotriangulation results are available. He emphasized the practical value of this material in extensive analyses of vegetation cover change over a long period. Similar challenges regarding historical aerial photographs were discussed by Feurer and Vinatier [34] ], who proposed the computation of orientations of photographs from various epochs in a single block using SfM algorithms.
Historical photographs are often of poor quality due to parameters of negatives and the airborne equipment used. The resolving power of lenses, which improved significantly in the second half of the 20th century, is of particular importance in this context. The average radial and tangential resolving power weighted for the whole area of the photograph (area-weighted average resolution) increased from about 50–60 line pairs per mm in the 1960s to about 110–120 line pairs per mm at the beginning of the 1990s [35]. At the same time, the resolving power of today’s lenses is more consistent over the whole area of the image and does not deteriorate toward the edges. The distortion that results in geometrical deformations of images was reduced in the aforementioned period from about +10 µm to about +2 µm. Apart from the resolving power of the lens, the lack of forward motion compensation (FCM) systems for reducing the impact of aircraft motion when the shutter is open (not to mention vibration-damping and angular-stabilization systems) affected the quality of historical aerial photographs the most. These systems were not introduced until the 1980s [35].
One of the fundamental issues when using historical aerial photography is the lack of data on interior orientation. Archives usually only store negatives and cannot provide aerotriangulation results for individual blocks of photographs. These limitations result in serious issues with obtaining reliable geometrical data from historical aerial photographs using the traditional photogrammetric approach (with a digital photogrammetric station). If the calibration report is unavailable, the interior orientation can be determined using autocalibration, which results in both interior and exterior orientation parameters. This method was successfully used by some authors [36,37]. Distortion parameters are another unknown aspect of this problem. In the case of these parameters, it is necessary to take into consideration errors resulting from the scanning of negatives [38]. These additional factors significantly increase the necessity to use a large number of ground control points.
Structure from motion (SfM) [39] and bundle adjustment [40] introduced new ways of using scanned aerial photographs [41]. The use of such detectors as SIFT (scale-invariant feature transform) [42] or SURF [43] (speeded-up robust features), their modified versions, and the Random sample consensus (RANSAC) algorithm [44] which is used to identify photograph key points, facilitates relative orienting of blocks of historical photographs [45], despite the lack of data on the interior orientation or the distortion parameters of the lens [46].
The lack of photogrammetric control photopoints and information that identifies photopoints on photographs for aerotriangulation is another problem related to historical aerial photographs. It can be resolved by establishing a number of photo-identifiable points on the ground and measuring them in relation to the spatial frame of reference in place, thus creating a new photogrammetric control for the photographs in question. If a sufficient number of photopoints are identified for a block of photographs, the interior orientation of the photographs and the distortion parameters can be treated as unknowns and determined in a joint computation together with exterior orientation using bundle adjustment. This minimizes the reprojection error between the locations of observed and predicted image points and is expressed as the sum of squares of a large number of non-linear, real-valued functions [47].
The purpose of the present study is that it proposes a method for determining long-term changes in the range and height structure of tree vegetation using modern airborne laser scanning data and historical aerial photographs with stereoscopic coverage. The authors verified the value of the resulting point clouds using four test plots with about 50 years of difference in the age of the material. To this end, the key stages of source data processing were presented, followed by examples of analyses representing an array of the possible applications of the results yielded by the method.

2. Materials and Methods
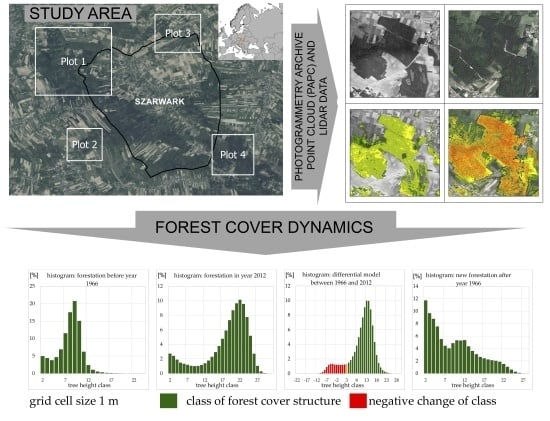
2.1. Study area

The study area is located in the Lesser Poland region of southern Poland. This area was selected for two reasons. The first one was the availability of aerial photographs of adequate quality from around 50 years before modern airborne laser scanning data (in this particular case, the data were from 1966). The other reason was the intention to research an area where significant forest vegetation range changes were noted. This applies to both a reduction and an increase in the surface area of forests, as well as several changes related to forestry approaches, including clearance and reforestation. Four test plots were eventually qualified, each exceeding 1 km2. The location of the study area (divided into four test objects) is presented in Figure 1.

2.2. Data

The study employed materials representing the historical and current state of tall vegetation in the investigated area. The time between the dates of creation of both datasets was about 50 years. The historical state was represented by aerial photographs. The study involved 52 stereograms of historical aerial photographs, making up five lines in a single block. The aerial photographs were taken on 5 June 1966. The imaging covered the area of and around Szarwark. The only information about camera parameters or the flights from which the images were taken was on the borders of these analog photographs. It included flight altitude and time data. The photographs were taken in the morning between 9:00 a.m. and noon. The border of the analog photographs contained information about the focal length of the camera (203.63 mm). The historical stereograms were digitized using a 2400-dots-per-inch (DPI) photogrammetric scanner, which resulted in a 10.57-µm pixel. Ground sampling distance was 13 cm.
The recent data come from LiDAR measurements. They represent the range and height structure of forest vegetation in 2012 when the ISOK aerial imagery project (Informatic State Protection Program) was carried out in Poland [48]. The measurement resulted in LiDAR data with a density of at least four points per square meter, and digital photographs were used to produce an orthophoto. The horizontal error did not exceed 0.4 m, and the vertical root-mean-square error (RMSE) was below 0.2 m. The study also involved vector data that represents cadastral plots. All data used in the study were provided by the Head Office of Land Surveying and Cartography in Poland.

2.3. Data Processing

Data processing consisted of several stages. It was due to the significant diversity of source data that included rasters (historical aerial photographs and orthophotos), LiDAR data, and vector cadastral databases. The following tools were used: Agisoft Metashape™ for aerial photograph processing, Microstation™ [49] with TerraSolid™ [50] and CloudCompare™ [51] for point clouds, and ArcGIS™ to analyze other datasets and combine them with the results of the tools mentioned above.
The first stage was to create a point cloud from historical aerial photographs taken with analogue cameras, referred to as a photogrammetry archive point cloud (PAPC). Such data usually lack complete information regarding aerotriangulation and camera calibration. It was, therefore, necessary when creating this dataset to adjust it to the parameters of the modern LiDAR measurement for the area, which was a sine qua non condition for further analyses.
The parameters are related to the frame of reference, point density, or point cloud accuracy. The first stage involved Agisoft Metashape™. After the scanned analog photographs were loaded, the known camera parameters were input, but these only included the focal length of the camera (203.63 mm). The pixel size (10.57 µm) was determined using the scanning resolution (2400 DPI) and the physical dimensions of the scanner. Next, fiducials were measured for the whole set of photographs. Each photograph was marked with four fiducials in the corners. This facilitated the determination of coordinates of the fiducials in mm. The coordinates of the fiducials were determined through the assumption that the principal point is the origin of the fiducial system (x0 = 0, y0 = 0). The actual coordinates of the principal point and distortion parameters were unknown. They were determined using ground control points. The photographs were aligned using Align Photos. Accuracy was set to highest. The highest option takes quite a long time and demands more computational resources, providing more effective results. Key point and tie point limits were set to 6000 points. The next stage was to add ground control points to the photographs. It was a considerable challenge to identify terrain invariants of locations with the same horizontal coordinates and elevation as almost 50 years before. Ground control points were set in the area during the measurement in 1966, but the relevant documentation was lost. Potential objects and areas that probably did not change were selected. This group included buildings, roads, and boundaries of arable land. They were then narrowed down to establish ground control points. These were most often points located on arable land where the plot boundary remained the same over the years and was consistent with ownership boundaries on cadastral maps. Having established the ground control points, the authors determined their coordinates based on an orthophoto and cadastral datasets that included boundaries of cadastral plots (see Figure 2). Both the sets used a consistent coordinate system Poland CS92 (EPSG 2180) [52]. LiDAR data and ArcGIS™ were used to compute elevation coordinates for ground control points. Ground control points were assigned elevation, and then all points were imported into Metashape™.
Exterior orientation was then established so that Poland CS92 coordinates could be assigned to the model. Thirty ground control points were used. At this stage, the fitness accuracy of the whole model was 2 m for horizontal coordinates (X, Y) and 0.5 m for vertical coordinates (Z).
The next stage was to create a point cloud. This was done using Build Dense Cloud. Quality was set to high and depth filtering was set to mild. As quality was set to high, the density of the point cloud was similar to one of the LiDAR clouds for the area. The resulting point cloud (2.3 billion points) was exported to a single *.las file. Apart from the X, Z, Y coordinates, the points in the cloud had an intensity parameter of 0 to 255 (255—white, 0—black). Next, four test plots were delineated where large changes in the range and height structure of high vegetation were noted in the study area. The test areas were selected due to the fact that there were significant changes observed in the structure of afforestation. Both forest vegetation expansion and depletion occurred. The expansion was related to the growth of forest vegetation, which increased its range and height with time. The losses were related to forest management that was realized in the studied areas. There were no fires or other disasters in the selected areas that could have caused a sudden change in vegetation structure. The final datasets were extracted using TerraSolid™ software for Microstation™. With this tool, the authors restricted the point cloud to the boundaries of the four test plots and classified it. This involved assigning each point to a layer that represented the topography or type of land cover. The classification was divided into separate stages. Firstly, topographical points were classified. Using the elevation over the ground layer, subsequent points were assigned to individual layers in the category. Points more than 2 m above the ground layer were classified as tall vegetation. If the elevation over the reference layer was 0.4 to 2 m, it was classified as medium-height vegetation. Points up to 0.4 m above the ground were classified as short vegetation. Points representing other topographical features such as buildings or infrastructure were not classified or included in the study. The classification was carried out in accordance with Polish regulations for updating databases of aerial and satellite images, orthophotos, and the digital terrain model [53].
The point cloud created from the photographs was different from the point cloud from LiDAR data. The fundamental difference was that it was not possible to extract topographical information in places with vegetation from point clouds from aerial photographs. Points in the cloud from aerial photographs correspond to points in the cloud from LiDAR data from first returns. The historical PAPC classification was performed semi-automatically. Firstly, TerraSolid™ algorithms were used to identify ground points; vegetation was classified next. Manual tools were used to correct errors of automatic classification. The classification of PAPC facilitated its calibration. The PAPC was generated with 2-m horizontal error (X, Y) and 0.5-m vertical error (Z) to correct automatic classification errors. The figures were improved during calibration of the point clouds using CloudCompare. The calibration was performed for the four plots based on points representing topographical features that could be unambiguously identified in both the point cloud from aerial photographs and in the LiDAR cloud. Four points that remained unchanged over the years were identified in each test plot. They were used to perform a Helmert transformation and calculate transformation parameters [54]. The application of the Helmert transformation (linear conformal transformation) often takes place while matching coordinate systems in geodesy [55]. The use of the Helmert transformation allows to shift the origin of the coordinate system, rotate it, and change its scale while maintaining the conformity. In this case, it was used to improve the accuracy of the point cloud position obtained from archival data based on LIDAR data. The Helmert transformation was used to improve the quality of adjusting point cloud to the real terrain model. The parameters were used to transform the whole point cloud from aerial photographs. This way, the mean fitting error was below 1 m for all coordinates on all the analyzed fragments (X—0.98 m, Y—0.88 m, Z—0.32 m). The final result of the computations mentioned above was two point clouds from two periods. The first one was obtained using LiDAR and represented the current state as of 2012. The other was obtained using PAPC and represented a historical state in 1966.
The next stage was to create a canopy height model (CHM) from the point clouds to determine the height structure of the vegetation in the study area. The CHM was created by subtracting the DTM from DSM (Digital Surface Model) containing only the high vegetation layer. On the basis of the collected data, the authors determined that there were no changes in the terrain structure of the studied area. The methodology presented in this work assumes the unchangeability of the terrain. This allowed to compare the structure of afforestation for two different periods of time.
The first step in the process of building the CHM was to create two point clouds for each test plot. The first one included the ground layer and the tall vegetation layer from LiDAR data. The other one comprised the ground layer from LiDAR data and the tall vegetation layer from PAPC. The ground LiDAR layer was the reference level in both clouds. The PAPC had no points representing the ground except for places with no vegetation. The combination of the PAPC with the ground LiDAR layer resulted in the relative height of vegetation (from ground level) for both LiDAR data and the PAPC cloud. The effect was converted into a raster. With the goal of the study in mind, only points representing tall vegetation were used for this purpose (with a minimum relative height to the ground of 2 m). The conversion was performed in ArcGIS with LASDataset to raster. The interpolation method was binning. Cell assignment type was maximum, and the void fill method was not selected. Rasters with two grid cell sizes of 1 m and 2 m were generated. Next, classes representing trees of various heights were created through reclassification. Plants with a height of 2–3 m above ground constituted class 1. Plants of 3–4 m constituted class 2. The same approach was employed for the remaining data until all vegetation had been assigned to height classes. The next stage was to create masks to represent forest areas in 1966. To this end, rasters with historical forest cover data underwent reclassification; all values exceeding 2 m above the ground were changed to 1. The next step was to use raster to polygon to perform vectorization that yielded polygons representing forest cover over 2 m tall. The individual stages of the computation are shown in Figure 3.
Having obtained data on the current and historical height structure of tall vegetation for the four selected plots, the authors performed four analyses related to the forest cover structure. The first one focused on the height structure of tall vegetation in 1966. The second one investigated changes in the height structure of forest areas over the 46 years between 1966 and 2012. In order to limit the analysis to forest areas that existed in 1966, the vector forest cover masks built from the PAPC were used. The third analysis concerned the investigation of changes in the surface area of the forest cover in the study area, for which a forest cover differential model was used. Thanks to this model, it was possible to determine areas where tall vegetation (for all practical purposes, forest vegetation) appeared and disappeared. The last analysis was intended to determine the range and height structure of tall vegetation that grew after 1966. All the analyses were performed in two variants using rasters with two different grid cell sizes: 1 m and 2 m.

3. Results

Table 1 compares the height structure of vegetation in the four test plots in 1966. It contains a juxtaposition of height classes from raster data with two grid cell sizes: 1 and 2 m. Table 2 presents data on the forest cover height structure derived from LiDAR data. The 1966 state was also analyzed using two grid cell sizes. Table 3 shows the differential forest cover model for two periods: 1966 and 2012. Table 4 contains the height structure of forest cover after 1966. Table 3 and Table 4 contain data from two sources (PAPC and LiDAR) and two grid cell sizes.
Table 5 juxtaposes the land-use structure, including areas covered by tall vegetation (for all practical purposes, this is forest resulting from afforestation of agricultural land and secondary forest succession). It includes areas covered by forest vegetation in 1966 and 2012, areas with new forest cover after 1966, and the total surface area of tall vegetation from both datasets.
The use of the PAPC and LiDAR data allowed the authors to determine changes in the surface structure of the forest cover in the investigated areas (see Figure 4). The figure was divided into four parts corresponding to the investigated plots (Plot 1 a–d, Plot 2 e–h, Plot 3 i–l, and Plot 4 m–p). Each part contains the height structure based on historical stereographic data (Figure 4a,e,i,m), the height structure of the historical forest cover based on LiDAR data (Figure 4b,f,j,n), the differential model of the historical and current forest cover (Figure 4c,g,k,o), and new forest cover that grew between 1966 and 2012 based on LiDAR data (Figure 4d,h,l,p). Figure 5 and Figure 6 contain histograms from the PAPC and LiDAR data. The figures have four columns (A–D) describing the structure of the forest cover in the four analyzed plots. The first one (A) is the forest height structure in 1966. The second element (B) is the 2012 forest cover height structure of areas that were covered in forest in 1966. The third element (C) is the 1966–2012 differential forest cover model. The last element (D) is the height structure of the forest cover grown between 1966 and 2012. Each analysis employed two variants of the raster model, with grid cell size 1 m (see Figure 5) and 2 m (see Figure 6).

4. Discussion

The analyses of the four distinct test plots helped in the assessment of the proposed method in terms of its value for the investigation of several aspects of changes in the range and height structure of forest vegetation. The surface area of the first object (Plot 1) was 1.63 km2 and was mostly covered by forest in 1966. Its height structure was dominated by two groups in 1966: the first was in the vicinity of classes 8–10; the other was in the vicinity of classes 14–18. The two groups of height classes were indicated as dominant by the raster CHM (see Figure 4a), relevant data in tables (see Table 1), and their histograms. The northern and northeastern parts of the plot exhibited class 14–18 forest cover. The central part featured class 8–10 forest cover. Compared to the 2012 data, the surface area and height structure of the vegetation changed due to the clearing and growth of trees. Trees in the highest height classes were automatically removed. Trees in classes 8–10 grew over time and, therefore, moved into classes 20–23 (see Figure 5 Plot 1B and Figure 6 Plot 1B). Also, the differential model indicated that trees classified as classes 14–18 in 1966 were automatically removed (see Figure 5 Plot 1C and Figure 6 Plot 1C). Some of them were replaced by new vegetation, but some areas were not reforested (Figure 4b). New forest cover appeared in the investigated area after 1966; its height structure indicates that the vegetation is young and dominated by classes 2–7.
The analysis of Plot 1 employed CHM data with a grid cell size of 1 m and 2 m. The type of CHM from historical photographs does not affect the assessment of the forest cover tree structure. Some differences were noted between the height structure from CHM and the LiDAR data. They involved a lower share of the lowest height classes in the CHM with a grid cell size of 2 m. This is related to the use of an algorithm for generating the CHM from the point cloud. This algorithm assigns to each cell the highest height value resulting from the cloud point analysis. This approach increases the number of cells with the highest values at the expense of cells with the lowest values.
The second object (Plot 2) of 1.13 km2 was covered by forest only in its central part in 1966. There was no forest cover in other regions. The area was mostly agricultural land. The initial (1966) height structure of the forest cover was very diverse. Class 2–4 vegetation dominated, but class 8–10 vegetation was also noticeable (see Figure 5 Plot 2A and Figure 6 Plot 2A). The existing vegetation grew with time, resulting in the fact that classes 16–19 became the largest in terms of LiDAR data. Vegetation in the whole area clearly grew. In the case of the CHM from LiDAR, the impact of cell size on the results became apparent for areas with fragmented forest cover. As in the case of Area 1, in the CHM model with cell size equal to 2 m in relation to the 1-m model, the number of classes with height below class 5 decreased in favor of classes over 16. The new forest cover after 1966 was dominated by class 2–7 vegetation.
There was no compact forest area in the next analyzed test object (Plot 3) of 1.75 km2 (Figure 4i). Several groups of trees were uniformly distributed over this area. Their height structure fell mostly in classes 2–7. The higher the trees were, the smaller the groups became (see Figure 5 Plot 3A and Figure 6 Plot 3A). The histogram of the differential model indicated that the investigated plot had negative forest cover growth (see Figure 5 Plot 1C and Figure 6 Plot 1C). New forest cover after 1966 was dominated by class 2–7 trees (see Figure 5 Plot 1D and Figure 6 Plot 1D).
The last analyzed object (Plot 4) was mostly covered by forest in 1966. This 1.69-km2 plot featured a compact group of trees in its central part. Its height structure was dominated by class 8–10 trees (see Figure 5 Plot 4A and Figure 6 Plot 4A). The trees grew over time, and no changes indicative of excessive clearing were noted. The vegetation that was dominant in 1966 grew to reach classes 22–24 in 2012.
The historical aerial photographs facilitated the determination of changes in the surface area of tall vegetation in the analyzed plots. As opposed to the height structure analysis, the assessment of the surface structure was significantly affected by the method of obtaining the CHM. This was related to the type of source data used in the CHM and the parameters of the model itself. When historical data were used (PAPC), the results were similar regardless of the grid cell size. The CHMs based on LiDAR data demonstrated significant sensitivity to grid cell size. In the CHMs with 1-m grid cell size, surface areas of forest covers were significantly lower than for the 2-m CHMs (see Table 5).

5. Conclusions

The present study demonstrated that historical aerial photographs may be a valuable source of data in temporal analysis of range and height structure changes in high-vegetation areas. The possible fields of application include the assessment of the scale of forest clearing, reforestation of such areas, and identification of areas affected by permanent agricultural land abandonment. Such analyses can additionally determine the approximate date of abandonment or commencement of afforestation based on the height of forest vegetation. If multiple sets of historical aerial photographs from various periods and LiDAR data are available, the method can be used to characterize the dynamics of high-vegetation cover changes. Current LiDAR data facilitate the use of point clouds based on historical aerial photographs even if photograph orientation data are incomplete.
The fundamental limitation of this method lies in the quality of historical source data. They must meet conditions for PAPC. If the data of the location of ground control points in aerial pictures are incomplete or missing, they can be replaced by other points that did not change over the years and can be assigned spatial coordinates. It is hard to do so automatically, which is the largest challenge of the method in the case of large-area analyses.

Author Contributions

Conceptualization, P.B., J.J. and B.M.; Resources, P.B., J.J. and B.M; Formal analysis, P.B., J.J. and B.M; Software; Writing-review & editing, P.B., J.J. and B.M.

Funding

This research was financed by the Ministry of Science and Higher Education of Poland, grant number BM—2321/KGRKiF/2018.

Conflicts of Interest

The authors declare no conflict of interest.

References

  1. Lambin, E.F.; Geist, H.J.; Lepers, E. Dynamics of Landscape and Land Cover Change in Tropical Regions. Annu. Rev. Environ. Resour. 2003, 28, 205–241. [Google Scholar] [CrossRef]
  2. Moses, C.; Robinson, D.; Barlow, J. Methods for measuring rock surface weathering and erosion: A critical review. Earth Sci. Rev. 2014, 135, 141–161. [Google Scholar] [CrossRef]
  3. Strek, Z.; Len, P.; Wojcik-Len, J. Hierarchization of Land Consolidation Works in the Rural Areas of Central Poland. IOP Conf. Ser. Earth Environ. Sci. 2019, 221, 12066. [Google Scholar] [CrossRef]
  4. Postek, P.; Leń, P.; Stręk, Ż. The proposed indicator of fragmentation of agricultural land. Ecol. Indic. 2019, 103, 581–588. [Google Scholar] [CrossRef]
  5. Janus, J. Measuring land fragmentation considering the shape of transportation network: A method to increase the accuracy of modeling the spatial structure of agriculture with case study in Poland. Comput. Electron. Agric. 2018, 148, 259–271. [Google Scholar] [CrossRef]
  6. Sikor, T.; Müller, D.; Stahl, J. Land Fragmentation and Cropland Abandonment in Albania: Implications for the Roles of State and Community in Post-Socialist Land Consolidation. World Dev. 2009, 37, 1411–1423. [Google Scholar] [CrossRef]
  7. Grešlová, P.; Štych, P.; Salata, T.; Hernik, J.; Knížková, I.; Bičík, I.; Jeleček, L.; Prus, B.; Noszczyk, T. Agroecosystem energy metabolism in Czechia and Poland in the two decades after the fall of communism: From a centrally planned system to market oriented mode of production. Land Use Policy 2019, 82, 807–820. [Google Scholar] [CrossRef]
  8. Cegielska, K.; Noszczyk, T.; Kukulska, A.; Szylar, M.; Hernik, J.; Dixon-Gough, R.; Jombach, S.; Valánszki, I.; Filepné Kovács, K. Land use and land cover changes in post-socialist countries: Some observations from Hungary and Poland. Land Use Policy 2018, 78, 1–18. [Google Scholar] [CrossRef]
  9. Terres, J.M.; Scacchiafichi, L.N.; Wania, A.; Ambar, M.; Anguiano, E.; Buckwell, A.; Coppola, A.; Gocht, A.; Källström, H.N.; Pointereau, P.; et al. Farmland abandonment in Europe: Identification of drivers and indicators, and development of a composite indicator of risk. Land Use Policy 2015, 49, 20–34. [Google Scholar] [CrossRef]
  10. Janus, J.; Bozek, P. Using ALS data to estimate afforestation and secondary forest succession on agricultural areas: An approach to improve the understanding of land abandonment causes. Appl. Geogr. 2018, 97, 128–141. [Google Scholar] [CrossRef]
  11. Sanzana, P.; Gironás, J.; Braud, I.; Branger, F.; Rodriguez, F.; Vargas, X.; Hitschfeld, N.; Muñoz, J.F.; Vicuña, S.; Mejía, A.; et al. A GIS-based urban and peri-urban landscape representation toolbox for hydrological distributed modeling. Environ. Model. Softw. 2017, 91, 168–185. [Google Scholar] [CrossRef] [Green Version]
  12. Liu, T.; Yang, X. Monitoring land changes in an urban area using satellite imagery, GIS and landscape metrics. Appl. Geogr. 2015, 56, 42–54. [Google Scholar] [CrossRef]
  13. Muchová, Z.; Tárníková, M. Land cover change and its influence on the assessment of the ecological stability. Appl. Ecol. Environ. Res. 2018, 16, 2169–2182. [Google Scholar] [CrossRef]
  14. Toure, S.I.; Stow, D.A.; Shih-chien, H.; Weeks, J.; Lopez-Carr, D. Land cover and land use change analysis using multi-spatial resolution data and object-based image analysis. Remote Sens. Environ. 2018, 210, 259–268. [Google Scholar] [CrossRef]
  15. Kolecka, N.; Kozak, J.; Kaim, D.; Dobosz, M.; Ostafin, K.; Ostapowicz, K.; Wężyk, P.; Price, B. Understanding farmland abandonment in the Polish Carpathians. Appl. Geogr. 2017, 88, 62–72. [Google Scholar] [CrossRef]
  16. Sekertekin, A.; Marangoz, A.M.; Akcin, H. Pixel-based classification analysis of land use land cover using Sentinel-2 and Landsat-8 data. Int. Arch. Photogramm. Remote Sens. Spat. Inf. Sci. ISPRS Arch. 2017, 42, 91–93. [Google Scholar] [CrossRef]
  17. Drzewiecki, W. Monitoring zmian pokrycia i użytkowania terenu na podstawie wieloczasowych obrazów teledetekcyjnych. Rocz. Geomatyki 2008, 6, 131–142. [Google Scholar]
  18. Dandois, J.P.; Ellis, E.C. High spatial resolution three-dimensional mapping of vegetation spectral dynamics using computer vision. Remote Sens. Environ. 2013, 136, 259–276. [Google Scholar] [CrossRef] [Green Version]
  19. Bozek, P.; Janus, J.; Klapa, P. Influence of canopy height model methodology on determining abandoned agricultural areas. Proc. Eng. Rural Dev. 2018, 17, 795–800. [Google Scholar]
  20. Midgley, N.G.; Tonkin, T.N. Reconstruction of former glacier surface topography from archive oblique aerial images. Geomorphology, Oxbow Books, Oxford, UK 2017, 282, 18–26. [Google Scholar] [CrossRef] [Green Version]
  21. Cowley, D.C.; Standring, R.A.; Abicht, M.J. Landscapes Through the Lens: Aerial Photographs and Historic Environment. In European Journal of Archaeology; Oxbow Books: Oxford, UK, 2012; pp. 356–359. [Google Scholar]
  22. Riquelme, A.; Del Soldato, M.; Tomás, R.; Cano, M.; Jordá Bordehore, L.; Moretti, S. Digital landform reconstruction using old and recent open access digital aerial photos. Geomorphology 2019, 329, 206–223. [Google Scholar] [CrossRef]
  23. Pinto, A.T.; Gonçalves, J.A.; Beja, P.; Honrado, J.P. From archived historical aerial imagery to informative orthophotos: A framework for retrieving the past in long-term socioecological research. Remote Sens. 2019, 11, 1388. [Google Scholar] [CrossRef]
  24. Będkowski, K.; Górski, D. Use of archive aerial photographs for reconstructing documentary profile in leon Wyczolkowski Nature Reserve of the Old Polish Yews, Wierzchlas. Arch. Fotogram. Kartogr. I Teledetekcji 2007, 17a, 23–32. [Google Scholar]
  25. Karwacki, K. Use of aerial images in research of mass movements—A case study of the Lachowice landslide (Western Carpathians, Beskid Makowski MTS). Biul. Państwowego Inst. Geol. 2016, 466, 115–122. [Google Scholar] [CrossRef]
  26. Kaczmarek, H. Using of the aerial photogrammetry and terrain measuring in monitoring shore zone of Jeziorsko Reservoir (Warta River, Central Poland). Landf. Anal. 2010, 13, 19–26. [Google Scholar]
  27. Bryś, H.; Gołuch, P. Błędowska Desert past and today—The interpretation of multi-temporal aerial photographs and satellite images. Acta Sci. Pol. Geod. Descr. Terrarum 2011, 10, 5–15. [Google Scholar]
  28. St-Onge, B.; Jumelet, J.; Cobello, M.; Véga, C. Measuring individual tree height using a combination of stereophotogrammetry and lidar. Can. J. For. Res. 2004, 34, 2122–2130. [Google Scholar] [CrossRef]
  29. Ullah, S.; Adler, P.; Dees, M.; Datta, P.; Weinacker, H.; Koch, B. Comparing image-based point clouds and airborne laser scanning data for estimating forest heights. IForest 2017, 10, 273. [Google Scholar] [CrossRef]
  30. St-Onge, B.; Audet, F.A.; Bégin, J. Characterizing the height structure and composition of a boreal forest using an individual tree crown approach applied to photogrammetric point clouds. Forests 2015, 6, 3899–3922. [Google Scholar] [CrossRef]
  31. Ullah, S.; Dees, M.; Datta, P.; Adler, P.; Koch, B. Comparing airborne laser scanning, and image-based point clouds by semi-global matching and enhanced automatic terrain extraction to estimate forest timber volume. Forests 2017, 8, 215. [Google Scholar] [CrossRef]
  32. Maltamo, M.; Malinen, J.; Packalén, P.; Suvanto, A.; Kangas, J. Nonparametric estimation of stem volume using airborne laser scanning, aerial photography, and stand-register data. Can. J. For. Res. 2006, 36, 426–436. [Google Scholar] [CrossRef]
  33. Korpela, I. Geometrically accurate time series of archived aerial images and airborne lidar data in a forest environment. Silva Fenn. 2006, 40, 109. [Google Scholar] [CrossRef]
  34. Feurer, D.; Vinatier, F. Joining multi-epoch archival aerial images in a single SfM block allows 3-D change detection with almost exclusively image information. ISPRS J. Photogramm. Remote Sens. 2018, 146, 495–506. [Google Scholar] [CrossRef] [Green Version]
  35. Kurczyński, Z. Fotogrametria; Wydawnictwo Naukowe PWN: Warszaw, Poland, 2015. [Google Scholar]
  36. Walstra, J.; Dixon, N.; Chandler, J.H. Historical aerial photographs for landslide assessment: Two case histories. Q. J. Eng. Geol. Hydrogeol. 2007, 40, 315–332. [Google Scholar] [CrossRef]
  37. Redweik, P.; Garzón, V.; Pereira, T. Sá Recovery of Stereo Aerial Coverage from 1934 and 1938 into the Digital Era. Photogramm. Rec. 2016, 31, 9–28. [Google Scholar] [CrossRef]
  38. Sevara, C. Capturing the Past for the Future: An Evaluation of the Effect of Geometric Scan Deformities on the Performance of Aerial Archival Media in Image-based Modelling Environments. Archaeol. Prospect. 2016, 23, 325–334. [Google Scholar] [CrossRef]
  39. Seccaroni, S.; Santangelo, M.; Marchesini, I.; Mondini, A.; Cardinali, M. High resolution historical topography: Getting more from archival aerial photographs. Multi. Digit. Publ. Inst. Proc. 2018. [Google Scholar] [CrossRef]
  40. Gonçalves, J.A. Automatic orientation and mosaicking of archived aerial photography using structure from motion. Int. Arch. Photogramm. Remote Sens. Spat. Inf. Sci. 2016, 40, 123. [Google Scholar]
  41. Westoby, M.J.; Brasington, J.; Glasser, N.F.; Hambrey, M.J.; Reynolds, J.M. “Structure-from-Motion” photogrammetry: A low-cost, effective tool for geoscience applications. Geomorphology 2012, 179, 300–314. [Google Scholar] [CrossRef]
  42. Zambanini, S. Feature-based groupwise registration of historical aerial images to present-day ortho-photo maps. Pattern Recognit. 2019, 90, 66–77. [Google Scholar] [CrossRef] [Green Version]
  43. Chen, H.R.; Tseng, Y.H. Study of automatic image rectification and registration of scanned historical aerial photographs. In Proceedings of the International Archives of the Photogrammetry. Remote Sens. Spat. Inf. Sci. ISPRS Arch. 2016, 41, 1229–1236. [Google Scholar]
  44. Fischler, M.A.; Bolles, R.C. Random sample consensus: A Paradigm for Model Fitting with Applications to Image Analysis and Automated Cartography. Commun. ACM 1981, 24, 381–395. [Google Scholar] [CrossRef]
  45. Vargo, L.J.; Anderson, B.M.; Horgan, H.J.; Mackintosh, A.N.; Lorrey, A.M.; Thornton, M. Using structure from motion photogrammetry to measure past glacier changes from historic aerial photographs. J. Glaciol. 2017, 63, 1105–1118. [Google Scholar] [CrossRef] [Green Version]
  46. Bianco, S.; Ciocca, G.; Marelli, D. Evaluating the Performance of Structure from Motion Pipelines. J. Imaging 2018, 4, 98. [Google Scholar] [CrossRef]
  47. Cucci, D.A.; Rehak, M.; Skaloud, J. Bundle adjustment with raw inertial observations in UAV applications. ISPRS J. Photogramm. Remote Sens. 2017, 130, 1–12. [Google Scholar] [CrossRef]
  48. Informatyczny System Osłony Kraju. Available online: https://www.isok.gov.pl/index.html (accessed on 1 May 2019).
  49. Agisft Metashape—Photogrammetric Processing of Digital Images and 3D Spatial Data Generation. Available online: https://www.agisoft.com/ (accessed on 29 August 2019).
  50. Terra Solid. Available online: https://www.terrasolid.com/ (accessed on 29 August 2019).
  51. CloudCompare. Available online: https://www.cloudcompare.com/ (accessed on 29 August 2019).
  52. European Petroleum Survey Group (EPSG) EPSG:2180. Available online: https://epsg.io/2180 (accessed on 29 August 2019).
  53. Rozporządzenie MSWiA z dnia 3 listopada 2011 r., ws. baz danych dot. Zobrazowań Lotniczych I Satelitarnych Oraz Ortofotomapy I Numerycznego Modelu Terenu. 2011, 263, 15307–15394. [Google Scholar]
  54. Watson, G.A. Computing Helmert transformations. J. Comput. Appl. Math. 2006, 197, 387–394. [Google Scholar] [CrossRef] [Green Version]
  55. Mataija, M.; Pogarčic, M.; Pogarčic, I. Helmert transformation of reference coordinating systems for geodesic purposes in local frames. Procedia Eng. 2014, 69, 168–176. [Google Scholar] [CrossRef]
Figure 1. Location of the study area (c) in Europe (a), and the Małopolskie Voivodeship (b).
Remotesensing 11 02259 g001
Figure 2. An example of the identification of ground control point located in the corner of the land parcel which did not change over the years. Both in 1966 (a) and 2012 (b), the boundary of the cadastral parcel overlapped the boundary of use.
Remotesensing 11 02259 g002
Figure 3. Scheme presenting the methodology used in the processing of archival aerial photographs.
Remotesensing 11 02259 g003
Figure 4. Comparison of height classes for four plots (Plot 1 (ad), Plot 2 (eh), Plot 3 (il), Plot 4 (mp) developed with the use of archival aerial photographs and light detection and ranging (LiDAR) data.
Remotesensing 11 02259 g004
Figure 5. Histograms of afforestation height structure for plots developed with the use of grid cell size equal to 1 m.
Remotesensing 11 02259 g005
Figure 6. Histograms of afforestation height structure for plots developed with the use of grid cell size equal to 2 m.
Remotesensing 11 02259 g006
Table 1. The forest cover height structure derived from historical stereometric photographs. The data in the table represent the share of individual classes in the forest cover structure. The table contains the percentage of classes for plots developed for a grid cell size of 1 m and 2 m.
height of tress2–3 m3–4 m4–5 m5–6 m6–7 m7–8 m8–9 m9–10 m10–11 m11–12 m12–13 m13–14 m14–15 m15–16 mGrid Cell Size
class1234567891011121314
Plot 10.771.141.201.762.944.326.057.235.874.204.105.637.798.871 m
0.831.181.201.782.984.346.117.325.884.194.245.797.858.922 m
Plot 29.7411.58.947.246.476.226.146.506.715.845.284.613.993.301 m
9.8511.78.977.156.185.965.656.036.375.565.294.774.063.562 m
Plot 312.811.510.19.168.518.017.846.745.865.164.043.222.421.651 m
9.9210.89.408.508.557.897.957.016.305.614.863.813.082.202 m
Plot 44.924.383.744.626.8711.517.520.715.06.182.341.020.530.311 m
5.114.653.693.935.528.9315.420.217.88.303.321.450.720.452 m
height of tress16–17 m17–18 m18–19 m19–20 m20–21 m21–22 m22–23 m23–24 m24–25 m25–26 m26–27 m27–28 m28–29 m29–30 mGrid Cell Size
class1516171819202122232425262728
Plot 18.998.436.995.203.742.361.320.620.310.130.050.010.00-1 m
9.018.356.805.023.652.241.280.590.270.120.040.010.00-2 m
Plot 22.441.701.110.810.530.360.230.160.090.040.020.010.00-1 m
2.762.061.321.020.660.390.260.180.120.070.030.020.00-2 m
Plot 31.310.860.450.210.100.030.000.00------1 m
1.591.280.680.360.180.070.000.00------2 m
Plot 40.150.100.050.030.020.010.010.00------1 m
0.200.140.070.040.030.010.010.01------2 m
Table 2. The forest cover height structure developed on the basis of light detection and ranging (LiDAR) data for afforested areas determined on the basis of afforestation acquired using historical stereometric photographs. The forest cover height structure was derived from LiDAR data that corresponded to forest areas in 1966. The table contains the percentage of classes for plots developed for a grid cell size of 1 m and 2 m.
height of tress2–3 m3–4 m4–5 m5–6 m6–7 m7–8 m8–9 m9–10 m10–11 m11–12 m12–13 m13–14 m14–15 m15–16 m16–17 mGrid Cell Size
class123456789101112131415
Plot 15.533.603.443.022.843.023.043.123.063.013.123.173.343.543.891 m
3.422.522.222.121.751.852.172.562.662.502.682.752.913.273.802 m
Plot 26.125.675.034.764.534.494.264.224.204.474.685.115.495.725.691 m
3.653.853.943.903.874.014.094.033.794.184.434.885.395.776.062 m
Plot 38.817.877.266.585.935.214.734.624.584.694.985.265.435.064.651 m
3.974.684.865.104.914.274.264.164.464.625.175.846.656.476.532 m
Plot 42.712.391.891.461.301.161.020.981.011.141.381.752.272.913.751 m
1.381.341.211.060.930.900.900.900.850.981.141.501.882.413.092 m
height of tress17–18 m18–19 m19–20 m20–21 m21–22 m22–23 m23–24 m24–25 m25–26 m26–27 m27–28 m28–29 m29–30 m30–31 m31–32 mGrid Cell Size
class161718192021222324252627282930
Plot 14.234.665.305.916.356.275.664.473.081.810.930.390.140.040.011 m
4.625.376.287.207.687.706.615.043.181.770.770.300.100.020.002 m
Plot 25.725.555.033.372.161.651.060.650.250.110.01----1 m
6.476.475.063.462.721.851.160.450.200.030.00----2 m
Plot 33.792.912.521.791.430.880.570.250.120.050.020.02---1 m
4.554.153.162.631.651.140.510.210.100.050.040.01---2 m
Plot 44.765.897.308.679.6310.19.557.745.162.691.020.280.000.00-1 m
4.926.097.659.0810.511.110.38.094.862.090.630.120.010.00-2 m
Table 3. The height structure changes in the investigated plots. The data in the table represent the percentage change in the forest cover structure. The table contains the percentage change of classes for plots developed for a grid cell size of 1 m and 2 m.
height of tress−24–−23 m−23–−21 m−22–−21 m−21–−20 m−20–−19 m−19–−18 m−18–−17 m−17–−16 m−16–−15 m−15–−14 m−14–−13 m−13–−12 m−12–−11 m−11–−10mGrid Cell Size
class−24−23−22−21−20−19−18−17−16−15−14−13−12−11
Plot 10.000.010.020.070.150.290.610.971.371.631.861.911.901.881 m
0.000.010.030.090.200.390.761.251.732.112.362.482.442.372 m
Plot 20.010.010.010.020.030.040.060.100.180.240.420.580.761.021 m
0.000.010.010.010.040.060.110.150.250.380.600.690.951.212 m
Plot 30.000.000.000.000.000.000.000.030.040.090.180.260.450.641 m
0.000.000.000.000.000.010.020.060.130.220.330.560.861.192 m
Plot 40.000.000.000.000.000.000.000.000.000.000.010.020.020.041 m
0.000.000.000.000.000.000.000.000.010.010.020.030.050.102 m
height of tress−10–−9 m−9–−8 m−8–−7 m−7–−6 m−6–−5 m−5–−4 m−4–−3 m−3–−2 m−2–−1 m>−1–0 m0–1 m1–2 m2–3 m3–4 mGrid Cell Size
class−10−9−8−7−6−5−4−3−2−10123
Plot 11.831.841.982.182.372.452.562.632.662.752.853.063.263.591 m
2.322.312.422.732.952.973.072.983.023.003.053.113.293.412 m
Plot 21.251.471.892.102.432.622.943.323.854.385.074.904.864.771 m
1.431.782.362.632.873.093.223.554.194.645.385.225.374.992 m
Plot 30.861.131.531.912.302.733.293.664.254.785.565.455.525.351 m
1.541.882.332.843.143.934.234.705.025.906.255.735.865.462 m
Plot 40.090.230.510.901.191.301.311.211.201.201.181.191.221.281 m
0.260.611.291.952.342.292.091.881.801.841.911.641.491.552 m
height of tress4–5 m5–6 m6–7 m7–8 m8–9 m9–10 m10–11 m11–12 m12–13 m13–14 m14–15 m15–16 m16–17 m17–18 mGrid Cell Size
class4567891011121314151617
Plot 13.964.364.755.065.034.814.494.023.543.052.522.031.460.971 m
3.643.964.054.274.274.003.743.272.892.432.041.571.220.752 m
Plot 24.584.634.724.524.414.364.123.853.523.122.682.081.541.121 m
4.944.624.474.314.133.993.432.982.562.161.981.631.280.992 m
Plot 35.234.994.874.844.534.373.993.473.142.702.151.611.190.961 m
4.864.464.484.053.803.342.932.522.031.661.180.750.570.432 m
Plot 41.501.842.352.973.824.986.297.689.079.989.958.776.584.321 m
1.812.162.743.374.235.306.417.628.388.758.306.874.702.862 m
height of tress18–19 m19–20 m20–21 m21–22 m22–23 m23–24 m24–25 m25–26 m26–27 m27–28 m28–29 m29–30 m30–31 m30–31 mGrid Cell Size
class1819202122232425262728293031
Plot 10.580.310.170.090.050.030.020.010.010.000.000.000.00-1 m
0.480.260.140.080.040.030.010.010.010.000.000.000.00-2 m
Plot 20.650.400.190.110.040.020.010.010.000.000.000.000.00-1 m
0.600.360.170.090.050.030.010.010.000.000.000.000.00-2 m
Plot 30.670.470.330.180.120.070.030.030.010.010.000.000.00-1 m
0.260.200.110.070.040.030.010.000.000.000.000.000.00-2 m
Plot 42.531.420.830.460.260.170.070.030.010.000.000.000.00-1 m
1.550.830.470.230.130.070.020.010.000.000.000.000.00-2 m
Table 4. The height structure of forest cover grown after 1966. The data in the table represent the share of individual classes in the forest cover structure. The table contains the percentage of classes for plots developed for a grid cell size of 1 m and 2 m.
height of tress2–3 m3–4 m4–5 m5–6 m6–7 m7–8 m8–9 m9–10 m10–11 m11–12 m12–13 m13–14 m14–15 m15–16 mGrid Cell Size
class1234567891011121314
Area 18.769.2410.912.29.978.388.236.474.023.252.842.502.552.621 m
5.746.468.0410.610.78.067.797.785.353.873.572.992.812.862 m
Area 212.911.711.110.69.236.254.313.313.173.153.103.073.073.161 m
9.169.309.279.248.857.515.063.773.413.283.353.393.513.692 m
Area 314.611.59.838.597.356.355.424.934.584.023.903.713.322.841 m
11.59.738.697.947.106.065.254.844.794.314.334.374.043.652 m
Area 411.79.648.757.535.494.424.014.845.295.265.334.333.593.061 m
9.068.157.547.526.104.813.974.194.915.015.435.164.263.732 m
heightof tress16–17 m17–18 m18–19 m19–20 m20–21 m21–22 m22–23 m23–24 m24–25 m25–26 m26–27 m27–28 m28–29 m29–30 mGrid Cell Size
class1516171819202122232425262728
Area 12.401.881.290.930.620.390.260.130.070.040.010.010.00-1 m
3.273.012.271.651.250.790.560.290.150.070.030.010.00-2 m
Area 22.842.512.291.801.200.670.370.170.050.020.010.00--1 m
3.603.223.252.732.001.170.700.370.130.040.020.00--2 m
Area 32.481.931.391.090.800.580.360.230.110.050.020.010.000.011 m
3.442.762.011.611.300.930.630.390.190.090.040.010.000.012 m
Area 42.632.402.232.102.021.861.491.060.600.260.080.020.00-1 m
3.102.762.542.332.142.201.861.481.020.500.170.050.01-2 m
Table 5. Forest cover surface area analysis. The table contains data for plots developed for a grid cell size of 1 m and 2 m.
NameArea (km2)Historical forest cover (%)Current forest cover (%)New forest cover, LiDAR (%)Total forest cover (%)Grid Cell Size
Plot 11.6357.0143.1215.2658.38 1 m
57.5852.2718.3670.632 m
Plot 21.1315.759.6416.1125.75 1 m
17.5714.3523.0837.422 m
Plot 31.756.474.266.7310.99 1 m
6.666.3911.6518.042 m
Plot 41.6942.0630.1618.9249.08 1 m
44.1739.0325.1964.222 m

