Next Issue
Volume 11, October-2
Previous Issue
Volume 11, September-2
 
 
remotesensing-logo

Journal Browser

Journal Browser

Remote Sens., Volume 11, Issue 19 (October-1 2019) – 146 articles

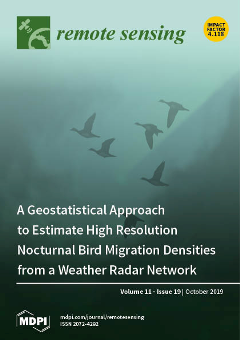
Cover Story (view full-size image): Aeroecology studies the movement of birds, bats, and insects in the lower atmosphere, often during their migration journey. Weather radars provide a unique opportunity to study continuously migratory movements at a continental scale. In this study, we tailored a geostatistical model to interpolate nocturnal bird migration intensity at high resolution (0.2 lat.–lon.–15 min.) using the European weather radar network. Within the area covered, we estimate more than 120 million birds simultaneously in flight. Local estimations can be easily visualized and retrieved from a dedicated interactive website. This work paves the way for real-time estimation of bird densities, which would be an invaluable asset for ecological and conservation purposes. View this paper.
  • Issues are regarded as officially published after their release is announced to the table of contents alert mailing list.
  • You may sign up for e-mail alerts to receive table of contents of newly released issues.
  • PDF is the official format for papers published in both, html and pdf forms. To view the papers in pdf format, click on the "PDF Full-text" link, and use the free Adobe Reader to open them.
Order results
Result details
Section
Select all
Export citation of selected articles as:
18 pages, 4752 KiB  
Article
Unmanned Aerial Vehicles (UAVs) for Monitoring Macroalgal Biodiversity: Comparison of RGB and Multispectral Imaging Sensors for Biodiversity Assessments
by Leigh Tait, Jochen Bind, Hannah Charan-Dixon, Ian Hawes, John Pirker and David Schiel
Remote Sens. 2019, 11(19), 2332; https://doi.org/10.3390/rs11192332 - 08 Oct 2019
Cited by 33 | Viewed by 7268
Abstract
Developments in the capabilities and affordability of unmanned aerial vehicles (UAVs) have led to an explosion in their use for a range of ecological and agricultural remote sensing applications. However, the ubiquity of visible light cameras aboard readily available UAVs may be limiting [...] Read more.
Developments in the capabilities and affordability of unmanned aerial vehicles (UAVs) have led to an explosion in their use for a range of ecological and agricultural remote sensing applications. However, the ubiquity of visible light cameras aboard readily available UAVs may be limiting the application of these devices for fine-scale, high taxonomic resolution monitoring. Here we compare the use of RGB and multispectral cameras deployed aboard UAVs for assessing intertidal and shallow subtidal marine macroalgae to a high taxonomic resolution. Our results show that the diverse spectral profiles of marine macroalgae naturally lend themselves to remote sensing and habitat classification. Furthermore, we show that biodiversity assessments, particularly in shallow subtidal habitats, are enhanced using six-band discrete wavelength multispectral sensors (81% accuracy, Cohen’s Kappa) compared to three-band broad channel RGB sensors (79% accuracy, Cohen’s Kappa) for 10 habitat classes. Combining broad band RGB signals and narrow band multispectral sensing further improved the accuracy of classification with a combined accuracy of 90% (Cohen’s Kappa). Despite notable improvements in accuracy with multispectral imaging, RGB sensors were highly capable of broad habitat classification and rivaled multispectral sensors for classifying intertidal habitats. High spatial scale monitoring of turbid exposed rocky reefs presents a unique set of challenges, but the limitations of more traditional methods can be overcome by targeting ideal conditions with UAVs. Full article
Show Figures

Graphical abstract

25 pages, 6150 KiB  
Article
Flood Mapping with Convolutional Neural Networks Using Spatio-Contextual Pixel Information
by Chandrama Sarker, Luis Mejias, Frederic Maire and Alan Woodley
Remote Sens. 2019, 11(19), 2331; https://doi.org/10.3390/rs11192331 - 08 Oct 2019
Cited by 44 | Viewed by 7525
Abstract
Remote sensing technology in recent years has been regarded the most important source to provide substantial information for delineating the flooding extent to the disaster management authority. There have been numerous studies proposing mathematical or statistical classification models for flood mapping. However, conventional [...] Read more.
Remote sensing technology in recent years has been regarded the most important source to provide substantial information for delineating the flooding extent to the disaster management authority. There have been numerous studies proposing mathematical or statistical classification models for flood mapping. However, conventional pixel-wise classifications methods rely on the exact match of the spectral signature to label the target pixel. In this study, we propose a fully convolutional neural networks (F-CNNs) classification model to map the flooding extent from Landsat satellite images. We utilised the spatial information from the neighbouring area of target pixel in classification. A total of 64 different models were generated and trained with a variable neighbourhood size of training samples and number of learnable filters. The training results revealed that the model trained with 3 × 3 neighbourhood sized training samples and with 32 convolutional filters achieved the best performance out of the experiments. A new set of different Landsat images covering flooded areas across Australia were used to evaluate the classification performance of the model. A comparison of our proposed classification model to the conventional support vector machines (SVM) classification model shows that the F-CNNs model was able to detect flooded areas more efficiently than the SVM classification model. For example, the F-CNNs model achieved a maximum precision rate (true positives) of 76.7% compared to 45.27% for SVM classification. Full article
(This article belongs to the Special Issue Remote Sensing of Inland Waters and Their Catchments)
Show Figures

Graphical abstract

23 pages, 7054 KiB  
Article
A Modular Processing Chain for Automated Flood Monitoring from Multi-Spectral Satellite Data
by Marc Wieland and Sandro Martinis
Remote Sens. 2019, 11(19), 2330; https://doi.org/10.3390/rs11192330 - 08 Oct 2019
Cited by 59 | Viewed by 5769
Abstract
Emergency responders frequently request satellite-based crisis information for flood monitoring to target the often-limited resources and to prioritize response actions throughout a disaster situation. We present a generic processing chain that covers all modules required for operational flood monitoring from multi-spectral satellite data. [...] Read more.
Emergency responders frequently request satellite-based crisis information for flood monitoring to target the often-limited resources and to prioritize response actions throughout a disaster situation. We present a generic processing chain that covers all modules required for operational flood monitoring from multi-spectral satellite data. This includes data search, ingestion and preparation, water segmentation and mapping of flooded areas. Segmentation of the water extent is done by a convolutional neural network that has been trained on a global dataset of Landsat TM, ETM+, OLI and Sentinel-2 images. Clouds, cloud shadows and snow/ice are specifically handled by the network to remove potential biases from downstream analysis. Compared to previous work in this direction, the method does not require atmospheric correction or post-processing and does not rely on ancillary data. Our method achieves an Overall Accuracy (OA) of 0.93, Kappa of 0.87 and Dice coefficient of 0.90. It outperforms a widely used Random Forest classifier and a Normalized Difference Water Index (NDWI) threshold method. We introduce an adaptable reference water mask that is derived by time-series analysis of archive imagery to distinguish flood from permanent water. When tested against manually produced rapid mapping products for three flood disasters (Germany 2013, China 2016 and Peru 2017), the method achieves ≥ 0.92 OA, ≥ 0.86 Kappa and ≥ 0.90 Dice coefficient. Furthermore, we present a flood monitoring application centred on Bihar, India. The processing chain produces very high OA (0.94), Kappa (0.92) and Dice coefficient (0.97) and shows consistent performance throughout a monitoring period of one year that involves 19 Landsat OLI ( μ Kappa = 0.92 and σ Kappa = 0.07 ) and 61 Sentinel-2 images ( μ Kappa = 0.92 , σ Kappa = 0.05 ). Moreover, we show that the mean effective revisit period (considering cloud cover) can be improved significantly by multi-sensor combination (three days with Sentinel-1, Sentinel-2, and Landsat OLI). Full article
Show Figures

Graphical abstract

26 pages, 5535 KiB  
Article
Assessing Spatiotemporal Variations of Landsat Land Surface Temperature and Multispectral Indices in the Arctic Mackenzie Delta Region between 1985 and 2018
by Leon Nill, Tobias Ullmann, Christof Kneisel, Jennifer Sobiech-Wolf and Roland Baumhauer
Remote Sens. 2019, 11(19), 2329; https://doi.org/10.3390/rs11192329 - 08 Oct 2019
Cited by 24 | Viewed by 5313
Abstract
Air temperatures in the Arctic have increased substantially over the last decades, which has extensively altered the properties of the land surface. Capturing the state and dynamics of Land Surface Temperatures (LSTs) at high spatial detail is of high interest as LST is [...] Read more.
Air temperatures in the Arctic have increased substantially over the last decades, which has extensively altered the properties of the land surface. Capturing the state and dynamics of Land Surface Temperatures (LSTs) at high spatial detail is of high interest as LST is dependent on a variety of surficial properties and characterizes the land–atmosphere exchange of energy. Accordingly, this study analyses the influence of different physical surface properties on the long-term mean of the summer LST in the Arctic Mackenzie Delta Region (MDR) using Landsat 30 m-resolution imagery between 1985 and 2018 by taking advantage of the cloud computing capabilities of the Google Earth Engine. Multispectral indices, including the Normalized Difference Vegetation Index (NDVI), Normalized Difference Water Index (NDWI) and Tasseled Cap greenness (TCG), brightness (TCB), and wetness (TCW) as well as topographic features derived from the TanDEM-X digital elevation model are used in correlation and multiple linear regression analyses to reveal their influence on the LST. Furthermore, surface alteration trends of the LST, NDVI, and NDWI are revealed using the Theil-Sen (T-S) regression method. The results indicate that the mean summer LST appears to be mostly influenced by the topographic exposition as well as the prevalent moisture regime where higher evapotranspiration rates increase the latent heat flux and cause a cooling of the surface, as the variance is best explained by the TCW and northness of the terrain. However, fairly diverse model outcomes for different regions of the MDR (R2 from 0.31 to 0.74 and RMSE from 0.51 °C to 1.73 °C) highlight the heterogeneity of the landscape in terms of influential factors and suggests accounting for a broad spectrum of different factors when modeling mean LSTs. The T-S analysis revealed large-scale wetting and greening trends with a mean decadal increase of the NDVI/NDWI of approximately +0.03 between 1985 and 2018, which was mostly accompanied by a cooling of the land surface given the inverse relationship between mean LSTs and vegetation and moisture conditions. Disturbance through wildfires intensifies the surface alterations locally and lead to significantly cooler LSTs in the long-term compared to the undisturbed surroundings. Full article
(This article belongs to the Special Issue Remote Sensing of Permafrost Environment Dynamics)
Show Figures

Graphical abstract

16 pages, 4787 KiB  
Letter
Integration of ZiYuan-3 Multispectral and Stereo Data for Modeling Aboveground Biomass of Larch Plantations in North China
by Guiying Li, Zhuli Xie, Xiandie Jiang, Dengsheng Lu and Erxue Chen
Remote Sens. 2019, 11(19), 2328; https://doi.org/10.3390/rs11192328 - 08 Oct 2019
Cited by 28 | Viewed by 3449
Abstract
Data saturation in optical sensor data has long been recognized as a major factor that causes underestimation of aboveground biomass (AGB) for forest sites having high AGB, but there is a lack of suitable approaches to solve this problem. The objective of this [...] Read more.
Data saturation in optical sensor data has long been recognized as a major factor that causes underestimation of aboveground biomass (AGB) for forest sites having high AGB, but there is a lack of suitable approaches to solve this problem. The objective of this research was to understand how incorporation of forest canopy features into high spatial resolution optical sensor data improves forest AGB estimation. Therefore, we explored the use of ZiYuan-3 (ZY-3) satellite imagery, including multispectral and stereo data, for AGB estimation of larch plantations in North China. The relative canopy height (RCH) image was calculated from the difference of digital surface model (DSM) data at leaf-on and leaf-off seasons, which were extracted from the ZY-3 stereo images. Image segmentation was conducted using eCognition on the basis of the fused ZY-3 multispectral and panchromatic data. Spectral bands, vegetation indices, textural images, and RCH-based variables based on this segment image were extracted. Linear regression was used to develop forest AGB estimation models, where the dependent variable was AGB from sample plots, and explanatory variables were from the aforementioned remote-sensing variables. The results indicated that incorporation of RCH-based variables and spectral data considerably improved AGB estimation performance when compared with the use of spectral data alone. The RCH-variable successfully reduced the data saturation problem. This research indicated that the combined use of RCH-variables and spectral data provided more accurate AGB estimation for larch plantations than the use of spectral data alone. Specifically, the root mean squared error (RMSE), relative RMSE, and mean absolute error values were 33.89 Mg/ha, 29.57%, and 30.68 Mg/ha, respectively, when using the spectral-only model, but they become 24.49 Mg/ha, 21.37%, and 20.37 Mg/ha, respectively, when using the combined model with RCH variables and spectral band. This proposed approach provides a new insight in reducing the data saturation problem. Full article
Show Figures

Graphical abstract

17 pages, 6942 KiB  
Article
Detecting Targets above the Earth’s Surface Using GNSS-R Delay Doppler Maps: Results from TDS-1
by Changjiang Hu, Craig Benson, Hyuk Park, Adriano Camps, Li Qiao and Chris Rizos
Remote Sens. 2019, 11(19), 2327; https://doi.org/10.3390/rs11192327 - 07 Oct 2019
Cited by 11 | Viewed by 4760
Abstract
Global Navigation Satellite System (GNSS) reflected signals can be used to remotely sense the Earth’s surface, known as GNSS reflectometry (GNSS-R). The GNSS-R technique has been applied to numerous areas, such as the retrieval of wind speed, and the detection of Earth surface [...] Read more.
Global Navigation Satellite System (GNSS) reflected signals can be used to remotely sense the Earth’s surface, known as GNSS reflectometry (GNSS-R). The GNSS-R technique has been applied to numerous areas, such as the retrieval of wind speed, and the detection of Earth surface objects. This work proposes a new application of GNSS-R, namely to detect objects above the Earth’s surface, such as low Earth orbit (LEO) satellites. To discuss its feasibility, 14 delay Doppler maps (DDMs) are first presented which contain unusually bright reflected signals as delays shorter than the specular reflection point over the Earth’s surface. Then, seven possible causes of these anomalies are analysed, reaching the conclusion that the anomalies are likely due to the signals being reflected from objects above the Earth’s surface. Next, the positions of the objects are calculated using the delay and Doppler information, and an appropriate geometry assumption. After that, suspect satellite objects are searched in the satellite database from Union of Concerned Scientists (UCS). Finally, three objects have been found to match the delay and Doppler conditions. In the absence of other reasons for these anomalies, GNSS-R could potentially be used to detect some objects above the Earth’s surface. Full article
(This article belongs to the Special Issue Applications of GNSS Reflectometry for Earth Observation)
Show Figures

Graphical abstract

22 pages, 4536 KiB  
Article
A Convolutional Neural Network Classifier Identifies Tree Species in Mixed-Conifer Forest from Hyperspectral Imagery
by Geoffrey A. Fricker, Jonathan D. Ventura, Jeffrey A. Wolf, Malcolm P. North, Frank W. Davis and Janet Franklin
Remote Sens. 2019, 11(19), 2326; https://doi.org/10.3390/rs11192326 - 06 Oct 2019
Cited by 125 | Viewed by 15128
Abstract
In this study, we automate tree species classification and mapping using field-based training data, high spatial resolution airborne hyperspectral imagery, and a convolutional neural network classifier (CNN). We tested our methods by identifying seven dominant trees species as well as dead standing trees [...] Read more.
In this study, we automate tree species classification and mapping using field-based training data, high spatial resolution airborne hyperspectral imagery, and a convolutional neural network classifier (CNN). We tested our methods by identifying seven dominant trees species as well as dead standing trees in a mixed-conifer forest in the Southern Sierra Nevada Mountains, CA (USA) using training, validation, and testing datasets composed of spatially-explicit transects and plots sampled across a single strip of imaging spectroscopy. We also used a three-band ‘Red-Green-Blue’ pseudo true-color subset of the hyperspectral imagery strip to test the classification accuracy of a CNN model without the additional non-visible spectral data provided in the hyperspectral imagery. Our classifier is pixel-based rather than object based, although we use three-dimensional structural information from airborne Light Detection and Ranging (LiDAR) to identify trees (points > 5 m above the ground) and the classifier was applied to image pixels that were thus identified as tree crowns. By training a CNN classifier using field data and hyperspectral imagery, we were able to accurately identify tree species and predict their distribution, as well as the distribution of tree mortality, across the landscape. Using a window size of 15 pixels and eight hidden convolutional layers, a CNN model classified the correct species of 713 individual trees from hyperspectral imagery with an average F-score of 0.87 and F-scores ranging from 0.67–0.95 depending on species. The CNN classification model performance increased from a combined F-score of 0.64 for the Red-Green-Blue model to a combined F-score of 0.87 for the hyperspectral model. The hyperspectral CNN model captures the species composition changes across ~700 meters (1935 to 2630 m) of elevation from a lower-elevation mixed oak conifer forest to a higher-elevation fir-dominated coniferous forest. High resolution tree species maps can support forest ecosystem monitoring and management, and identifying dead trees aids landscape assessment of forest mortality resulting from drought, insects and pathogens. We publicly provide our code to apply deep learning classifiers to tree species identification from geospatial imagery and field training data. Full article
(This article belongs to the Section Environmental Remote Sensing)
Show Figures

Graphical abstract

19 pages, 16728 KiB  
Article
Deriving a Forest Cover Map in Kyrgyzstan Using a Hybrid Fusion Strategy
by Tao Jia, Yuqian Li, Wenzhong Shi and Ling Zhu
Remote Sens. 2019, 11(19), 2325; https://doi.org/10.3390/rs11192325 - 06 Oct 2019
Cited by 5 | Viewed by 3396
Abstract
Forests have potential economic value and play a significant role in maintaining ecological balance. Considering its outdated and incomplete forest statistics, the Kyrgyzstan Republic urgently needs a forest cover map for assessing its current forest resources and assisting national policies on improving rural [...] Read more.
Forests have potential economic value and play a significant role in maintaining ecological balance. Considering its outdated and incomplete forest statistics, the Kyrgyzstan Republic urgently needs a forest cover map for assessing its current forest resources and assisting national policies on improving rural livelihood and sustainability. This study adopted a hybrid fusion strategy to develop a forest cover map for the Kyrgyzstan Republic with improved accuracy. The fusion strategy uses the merits of the GlobeLand30 in 2010 and the USGS TreeCover2010, the benefits of auxiliary geographic information, and the advantages of the stacking learning method in classification. Additionally, we explored the influence of different forest definitions, based on the tree cover percentage value in the USGS TreeCover2010, on the accuracy of forest cover. Results suggested that the accuracy of our model can be improved significantly by including auxiliary geographic features and feeding the optimal size of training samples. Thereafter, using our model, forest cover maps were derived at different tree cover threshold values in the USGS TreeCover2010. Importantly, the forest cover map at the tree cover threshold value of 40% was determined as the most accurate one with the kappa value of 0.89, whose spatial extent constitutes about 2.4% of the entire territory. This estimated forest cover percentage suggests a low estimation of forest resources based on rigorous definition, which can be valuable for reviewing and amending the current national forest policies. Full article
(This article belongs to the Section Forest Remote Sensing)
Show Figures

Graphical abstract

22 pages, 12756 KiB  
Article
CloudFCN: Accurate and Robust Cloud Detection for Satellite Imagery with Deep Learning
by Alistair Francis, Panagiotis Sidiropoulos and Jan-Peter Muller
Remote Sens. 2019, 11(19), 2312; https://doi.org/10.3390/rs11192312 - 06 Oct 2019
Cited by 56 | Viewed by 6721
Abstract
Cloud masking is of central importance to the Earth Observation community. This paper deals with the problem of detecting clouds in visible and multispectral imagery from high-resolution satellite cameras. Recently, Machine Learning has offered promising solutions to the problem of cloud masking, allowing [...] Read more.
Cloud masking is of central importance to the Earth Observation community. This paper deals with the problem of detecting clouds in visible and multispectral imagery from high-resolution satellite cameras. Recently, Machine Learning has offered promising solutions to the problem of cloud masking, allowing for more flexibility than traditional thresholding techniques, which are restricted to instruments with the requisite spectral bands. However, few studies use multi-scale features (as in, a combination of pixel-level and spatial) whilst also offering compelling experimental evidence for real-world performance. Therefore, we introduce CloudFCN, based on a Fully Convolutional Network architecture, known as U-net, which has become a standard Deep Learning approach to image segmentation. It fuses the shallowest and deepest layers of the network, thus routing low-level visible content to its deepest layers. We offer an extensive range of experiments on this, including data from two high-resolution sensors—Carbonite-2 and Landsat 8—and several complementary tests. Owing to a variety of performance-enhancing design choices and training techniques, it exhibits state-of-the-art performance where comparable to other methods, high speed, and robustness to many different terrains and sensor types. Full article
(This article belongs to the Section Remote Sensing Image Processing)
Show Figures

Graphical abstract

21 pages, 7088 KiB  
Article
Generating High Spatio-Temporal Resolution Fractional Vegetation Cover by Fusing GF-1 WFV and MODIS Data
by Guofeng Tao, Kun Jia, Xiang Zhao, Xiangqin Wei, Xianhong Xie, Xiwang Zhang, Bing Wang, Yunjun Yao and Xiaotong Zhang
Remote Sens. 2019, 11(19), 2324; https://doi.org/10.3390/rs11192324 - 05 Oct 2019
Cited by 27 | Viewed by 3381
Abstract
As an important indicator to characterize the surface vegetation, fractional vegetation cover (FVC) with high spatio-temporal resolution is essential for earth surface process simulation. However, due to technical limitations and the influence of weather, it is difficult to generate temporally continuous FVC with [...] Read more.
As an important indicator to characterize the surface vegetation, fractional vegetation cover (FVC) with high spatio-temporal resolution is essential for earth surface process simulation. However, due to technical limitations and the influence of weather, it is difficult to generate temporally continuous FVC with high spatio-temporal resolution based on a single remote-sensing data source. Therefore, the objective of this study is to explore the feasibility of generating high spatio-temporal resolution FVC based on the fusion of GaoFen-1 Wide Field View (GF-1 WFV) data and Moderate-resolution Imaging Spectroradiometer (MODIS) data. Two fusion strategies were employed to identify a suitable fusion method: (i) fusing reflectance data from GF-1 WFV and MODIS firstly and then estimating FVC from the reflectance fusion result (strategy FC, Fusion_then_FVC). (ii) fusing the FVC estimated from GF-1 WFV and MODIS reflectance data directly (strategy CF, FVC_then_Fusion). The FVC generated using strategies FC and CF were evaluated based on FVC estimated from the real GF-1 WFV data and the field survey FVC, respectively. The results indicated that strategy CF achieved higher accuracies with less computational cost than those of strategy FC both in the comparisons with FVC estimated from the real GF-1 WFV (CF:R2 = 0.9580, RMSE = 0.0576; FC: R2 = 0.9345, RMSE = 0.0719) and the field survey FVC data (CF: R2 = 0.8138, RMSE = 0.0985; FC: R2 = 0.7173, RMSE = 0.1214). Strategy CF preserved spatial details more accurately than strategy FC and had a lower probability of generating abnormal values. It could be concluded that fusing GF-1 WFV and MODIS data for generating high spatio-temporal resolution FVC with good quality was feasible, and strategy CF was more suitable for generating FVC given its advantages in estimation accuracy and computational efficiency. Full article
(This article belongs to the Special Issue Earth Radiation Budget)
Show Figures

Graphical abstract

31 pages, 14005 KiB  
Article
An Attempt to Improve Snow Depth Retrieval Using Satellite Microwave Radiometry for Rough Antarctic Sea Ice
by Stefan Kern and Burcu Ozsoy
Remote Sens. 2019, 11(19), 2323; https://doi.org/10.3390/rs11192323 - 05 Oct 2019
Cited by 5 | Viewed by 3050
Abstract
Snow depth on sea ice is a major constituent of the marine cryosphere. It is a key parameter for the derivation of sea-ice thickness from satellite altimetry. One way to retrieve the basin-scale snow depth on sea ice is by satellite microwave radiometry. [...] Read more.
Snow depth on sea ice is a major constituent of the marine cryosphere. It is a key parameter for the derivation of sea-ice thickness from satellite altimetry. One way to retrieve the basin-scale snow depth on sea ice is by satellite microwave radiometry. There is evidence from measurements and inter-comparison studies that current retrievals likely under-estimate the snow depth over deformed, rough sea ice. We follow up on an earlier study, where satellite passive microwave data were combined with information on the sea-ice topography from the satellite laser altimeter on board the Ice, Cloud and land Elevation Satellite (ICESat) in a hybrid approach. Such topography information is spatiotemporally limited because of ICESat’s operation mode. In this paper, we aim to derive a proxy for this topography information from satellite microwave radiometry. For this purpose, we co-locate parameters describing the sea-ice deformation taken from visual ship-based observations and the surface elevation standard deviation derived from ICESat laser altimetry with the microwave brightness temperatures (TB) measured via the Advanced Microwave Scanning Radiometer aboard Earth Observation Satellite (AMSR-E) and aboard Global Change Observation Mission-Water 1 (GCOM-W1) (AMSR2). We find that the TB polarization ratio at 6.9 GHz and the TB gradient ratio between 10.7 GHz (horizontal polarization) and 6.9 GHz (vertical polarization), might be suited as such a proxy. Using this proxy, we modify the above-mentioned hybrid approach and compute the snow depths on sea ice from the AMSR-E and AMSR2 data. We compare our snow depths with those of the commonly used approach, the hybrid approach, with the ship-based observations for the years 2002 through 2015 and with the measurements made by drifting buoys for the period of 2014 through 2018. We find a convincing overall agreement with the hybrid approach and some improvement over the common approach. However, our approach is sensitive to the presence of thin ice—here, the retrieved snow depths are too large; and our approach performs sub-optimally over old ice—here, the retrieved snow depths are too small. More investigations and, in particular, more evaluations are required to optimize our approach so that the snow depths retrieved for the combined AMSR-E/AMSR2 period could serve as a data set for sea-ice thickness retrieval based on satellite altimetry. Full article
Show Figures

Graphical abstract

20 pages, 7150 KiB  
Article
Greenspace Pattern and the Surface Urban Heat Island: A Biophysically-Based Approach to Investigating the Effects of Urban Landscape Configuration
by Elizabeth Jane Wesley and Nathaniel A. Brunsell
Remote Sens. 2019, 11(19), 2322; https://doi.org/10.3390/rs11192322 - 05 Oct 2019
Cited by 16 | Viewed by 4076
Abstract
Surface urban heat islands (SUHIs) are influenced by the spatial distribution of green space, which in turn can be influenced by urban planning. When studying the relationship between structure and function it is critical that the scale of observation reflects the scale of [...] Read more.
Surface urban heat islands (SUHIs) are influenced by the spatial distribution of green space, which in turn can be influenced by urban planning. When studying the relationship between structure and function it is critical that the scale of observation reflects the scale of the phenomenon being measured. To investigate the relationship between green space pattern and the SUHI in the Kansas City metropolitan area, we conducted a multi-resolution wavelet analysis of land surface temperature (LST) to determine the dominant length scales of LST production. We used these scales as extents for calculating landscape metrics on a high-resolution land cover map. We built regression models to investigate whether–controlling for the percent vegetated area–patch size, fragmentation, shape, complexity, and/or proximity can mitigate SUHIs. We found that while some of the relationships between landscape metrics and LST are significant, their explanatory power would be of little use in planning for green infrastructure. We also found that the relationships often reported between landscape metrics and LST are artifacts of the relationship between the percent of vegetation and LST. By using the dominant length scales of LST we provide a methodology for robust biophysically-based analysis of urban landscape pattern and demonstrate that the contributions of green space configuration to the SUHI are negligible. The simple result that increasing green space can lower LST regardless of configuration allows the prioritization of resources towards benefiting neighborhoods most vulnerable to the negative impacts of urban heat. Full article
(This article belongs to the Section Urban Remote Sensing)
Show Figures

Figure 1

17 pages, 5747 KiB  
Article
On C-Band Quad-Polarized Synthetic Aperture Radar Properties of Ocean Surface Currents
by Shengren Fan, Vladimir Kudryavtsev, Biao Zhang, William Perrie, Bertrand Chapron and Alexis Mouche
Remote Sens. 2019, 11(19), 2321; https://doi.org/10.3390/rs11192321 - 05 Oct 2019
Cited by 7 | Viewed by 3386
Abstract
We present new results for ocean surface current signatures in dual co- and cross-polarized synthetic aperture radar (SAR) images. C-band RADARSAT-2 quad-polarized SAR ocean scenes are decomposed into resonant Bragg scattering from regular (non-breaking) surface waves and scattering from breaking waves. Surface current [...] Read more.
We present new results for ocean surface current signatures in dual co- and cross-polarized synthetic aperture radar (SAR) images. C-band RADARSAT-2 quad-polarized SAR ocean scenes are decomposed into resonant Bragg scattering from regular (non-breaking) surface waves and scattering from breaking waves. Surface current signatures in dual co- and cross-polarized SAR images are confirmed to be governed by the modulations due to wave breaking. Due to their small relaxation scale, short Bragg waves are almost insensitive to surface currents. Remarkably, the contrast in sensitivity of the non-polarized contribution to dual co-polarized signals is found to largely exceed, by a factor of about 3, the contrast in sensitivity of the corresponding cross-polarized signals. A possible reason for this result is the co- and cross-polarized distinct scattering mechanisms from breaking waves: for the former, quasi-specular radar returns are dominant, whereas for the latter, quasi-resonant scattering from the rough breaking crests governs the backscatter intensity. Thus, the differing sensitivity can be related to distinct spectral intervals of breaking waves contributing to co- and cross-polarized scattering in the presence of surface currents. Accordingly, routinely observed current signatures in quad-polarized SAR images essentially originate from wave breaking modulations, and polarized contrasts can therefore help quantitatively retrieve the strength of surface current gradients. Full article
(This article belongs to the Special Issue Synthetic Aperture Radar Observations of Marine Coastal Environments)
Show Figures

Graphical abstract

19 pages, 8379 KiB  
Article
Drawback in the Change Detection Approach: False Detection during the 2018 Western Japan Floods
by Luis Moya, Yukio Endo, Genki Okada, Shunichi Koshimura and Erick Mas
Remote Sens. 2019, 11(19), 2320; https://doi.org/10.3390/rs11192320 - 05 Oct 2019
Cited by 17 | Viewed by 3486
Abstract
Synthetic aperture radar (SAR) images have been used to map flooded areas with great success. Flooded areas are often identified by detecting changes between a pair of images recorded before and after a certain flood. During the 2018 Western Japan Floods, the change [...] Read more.
Synthetic aperture radar (SAR) images have been used to map flooded areas with great success. Flooded areas are often identified by detecting changes between a pair of images recorded before and after a certain flood. During the 2018 Western Japan Floods, the change detection method generated significant misclassifications for agricultural targets. To evaluate whether such a situation could be repeated in future events, this paper examines and identifies the causes of the misclassifications. We concluded that the errors occurred because of the following. (i) The use of only a single pair of SAR images from before and after the floods. (ii) The unawareness of the dynamics of the backscattering intensity through time in agricultural areas. (iii) The effect of the wavelength on agricultural targets. Furthermore, it is highly probable that such conditions might occur in future events. Our conclusions are supported by a field survey of 35 paddy fields located within the misclassified area and the analysis of Sentinel-1 time series data. In addition, in this paper, we propose a new parameter, which we named “conditional coherence”, that can be of help to overcome the referred issue. The new parameter is based on the physical mechanism of the backscattering on flooded and non-flooded agricultural targets. The performance of the conditional coherence as an input of discriminant functions to identify flooded and non-flooded agricultural targets is reported as well. Full article
Show Figures

Figure 1

11 pages, 848 KiB  
Technical Note
Removal of Covariant Errors from Altimetric Wave Height Data
by Graham D. Quartly
Remote Sens. 2019, 11(19), 2319; https://doi.org/10.3390/rs11192319 - 05 Oct 2019
Cited by 8 | Viewed by 2360
Abstract
The echo waveforms received by conventional radar altimeters are interpreted by retracking algorithms to give estimates of range, wave height, and backscatter strength. However, in response to fading noise on the waveform leading edge, common retrackers, such as MLE-3 and MLE-4, show correlated [...] Read more.
The echo waveforms received by conventional radar altimeters are interpreted by retracking algorithms to give estimates of range, wave height, and backscatter strength. However, in response to fading noise on the waveform leading edge, common retrackers, such as MLE-3 and MLE-4, show correlated errors in wave height and range. This correlation is used to develop a correction to the wave height data that reduces the high-frequency variability by ∼22%, without affecting the global distribution of values. This correction also results in a closer matchup of Jason-2 and Jason-3 data during their tandem phase. Although the correction is quite straightforward in practice, the appropriate conversion factor has to be determined for each combination of altimeter and retracker. There are also remaining open questions concerning the needed low-pass filtering. Full article
(This article belongs to the Section Ocean Remote Sensing)
Show Figures

Graphical abstract

14 pages, 4455 KiB  
Article
On the Applicability of Laboratory Thermal Infrared Emissivity Spectra for Deconvolving Satellite Data of Opaque Volcanic Ash Plumes
by Daniel B. Williams and Michael S. Ramsey
Remote Sens. 2019, 11(19), 2318; https://doi.org/10.3390/rs11192318 - 05 Oct 2019
Cited by 5 | Viewed by 2856
Abstract
The ASTER Volcanic Ash Library (AVAL) is presented, developed using quantitative laboratory thermal infrared (TIR) emission spectroscopic methods, spanning the 2000–400 cm−1 (5–25 μm wavelength) range, including the Earth’s TIR atmospheric window (8–12 μm). Each spectral suite is unique owing to the [...] Read more.
The ASTER Volcanic Ash Library (AVAL) is presented, developed using quantitative laboratory thermal infrared (TIR) emission spectroscopic methods, spanning the 2000–400 cm−1 (5–25 μm wavelength) range, including the Earth’s TIR atmospheric window (8–12 μm). Each spectral suite is unique owing to the chemical composition and proportion of glass to crystals per sample and is divided into six size fractions. AVAL, used with an appropriate spectral mixture model applied to orbital multispectral TIR data, provides a unique ability to study active volcanic ash plumes. We present the first example of this application to an ash plume produced by the Sakurajima Volcano in Japan. The emissivity variations measured in ash plumes using an ever-expanding ash spectral library will provide future quantitative inputs for both atmospheric models, where the ash composition is unknown or estimated, as well as compositional probes into ongoing eruptions. Full article
Show Figures

Figure 1

19 pages, 854 KiB  
Article
sUAS-Based Remote Sensing of River Discharge Using Thermal Particle Image Velocimetry and Bathymetric Lidar
by Paul J. Kinzel and Carl J. Legleiter
Remote Sens. 2019, 11(19), 2317; https://doi.org/10.3390/rs11192317 - 05 Oct 2019
Cited by 42 | Viewed by 6273
Abstract
This paper describes a non-contact methodology for computing river discharge based on data collected from small Unmanned Aerial Systems (sUAS). The approach is complete in that both surface velocity and channel geometry are measured directly under field conditions. The technique does not require [...] Read more.
This paper describes a non-contact methodology for computing river discharge based on data collected from small Unmanned Aerial Systems (sUAS). The approach is complete in that both surface velocity and channel geometry are measured directly under field conditions. The technique does not require introducing artificial tracer particles for computing surface velocity, nor does it rely upon the presence of naturally occurring floating material. Moreover, no prior knowledge of river bathymetry is necessary. Due to the weight of the sensors and limited payload capacities of the commercially available sUAS used in the study, two sUAS were required. The first sUAS included mid-wave thermal infrared and visible cameras. For the field evaluation described herein, a thermal image time series was acquired and a particle image velocimetry (PIV) algorithm used to track the motion of structures expressed at the water surface as small differences in temperature. The ability to detect these thermal features was significant because the water surface lacked floating material (e.g., foam, debris) that could have been detected with a visible camera and used to perform conventional Large-Scale Particle Image Velocimetry (LSPIV). The second sUAS was devoted to measuring bathymetry with a novel scanning polarizing lidar. We collected field measurements along two channel transects to assess the accuracy of the remotely sensed velocities, depths, and discharges. Thermal PIV provided velocities that agreed closely ( R 2 = 0.82 and 0.64) with in situ velocity measurements from an acoustic Doppler current profiler (ADCP). Depths inferred from the lidar closely matched those surveyed by wading in the shallower of the two cross sections ( R 2 = 0.95), but the agreement was not as strong for the transect with greater depths ( R 2 = 0.61). Incremental discharges computed with the remotely sensed velocities and depths were greater than corresponding ADCP measurements by 22% at the first cross section and <1% at the second. Full article
Show Figures

Graphical abstract

18 pages, 4441 KiB  
Article
MODIS and PROBA-V NDVI Products Differ when Compared with Observations from Phenological Towers at Four Tropical Dry Forests in the Americas
by J. Antonio Guzmán Q., G. Arturo Sanchez-Azofeifa and Mário M. Espírito-Santo
Remote Sens. 2019, 11(19), 2316; https://doi.org/10.3390/rs11192316 - 04 Oct 2019
Cited by 10 | Viewed by 3611
Abstract
The Normalized Difference Vegetation Index (NDVI) is widely used to monitor vegetation phenology and productivity around the world. Over the last few decades, phenology monitoring at large scales has been possible due to the information and metrics derived from satellite sensors such as [...] Read more.
The Normalized Difference Vegetation Index (NDVI) is widely used to monitor vegetation phenology and productivity around the world. Over the last few decades, phenology monitoring at large scales has been possible due to the information and metrics derived from satellite sensors such as the Moderate Resolution Imaging Spectroradiometer (MODIS) or the Project for On-Board Autonomy–Vegetation (PROBA-V). However, due to their temporal and spatial resolution, adequate ground comparison is lacking. In this paper, we analyze how NDVI products from MODIS (Aqua and Terra) and PROBA-V predict vegetation phenology when compared with near-surface observations. We conduct this comparison at four tropical dry forests (TDFs) in the Americas. We undertake this study by comparing the following: (i) Dissimilarities of the standardized NDVI (NDVIS) using dynamic time warping, (ii) the differences of daily NDVIS between seasons and ENSO months using generalized linear models, and (iii) phenometrics derived from NDVI time series. Overall, our results suggest that NDVIS from satellite observations present DTW distances (dissimilarities) between 2.98 and 46.57 (18.91 ± 12.31) when compared with near-surface observations. Furthermore, NDVIS comparisons reveal that overall differences between satellite and near-surface observations are close to zero, but this tends to differ between seasons or when El Nino Southern Oscillation (ENSO) is present. Phenometrics comparisons show that metrics derived from satellite observations such as green-up, maturity, and start and end of the wet season strongly correlate with those from near-surface observations. In contrast, phenometrics that describe the day of the highest or lowest NDVI tend to be inconsistent with those from near-surface observations. All findings were observed independently of the NDVI source. Our results suggest that satellite-based NDVI products tend to be inconsistent descriptors of vegetation events on tropical deciduous forests in comparison with near-surface observations. These results reinforce the idea that satellite-based NDVI products should be used and interpreted with great caution and only in ecosystems with well-established knowledge of their vegetation phenology. Full article
(This article belongs to the Section Forest Remote Sensing)
Show Figures

Graphical abstract

23 pages, 2333 KiB  
Article
Fast Reproducible Pansharpening Based on Instrument and Acquisition Modeling: AWLP Revisited
by Gemine Vivone, Luciano Alparone, Andrea Garzelli and Simone Lolli
Remote Sens. 2019, 11(19), 2315; https://doi.org/10.3390/rs11192315 - 04 Oct 2019
Cited by 50 | Viewed by 3319
Abstract
Pansharpening is the process of merging the spectral resolution of a multi-band remote-sensing image with the spatial resolution of a co-registered single-band panchromatic observation of the same scene. Conceived and contextualized over 30 years ago, panharpening methods have progressively become more and more [...] Read more.
Pansharpening is the process of merging the spectral resolution of a multi-band remote-sensing image with the spatial resolution of a co-registered single-band panchromatic observation of the same scene. Conceived and contextualized over 30 years ago, panharpening methods have progressively become more and more sophisticated, but simultaneously they have started producing fewer and fewer reproducible results. Their recent proliferation is most likely due to the lack of standardized assessment procedures and especially to the use of non-reproducible results for benchmarking. In this paper, we focus on the reproducibility of results and propose a modified version of the popular additive wavelet luminance proportional (AWLP) method, which exhibits all the features necessary to become the ideal benchmark for pansharpening: high performance, fast algorithm, absence of any manual optimization, reproducible results for any dataset and landscape, thanks to: (i) spatial analysis filter matching the modulation transfer function (MTF) of the instrument; (ii) spectral transformation implicitly accounting for the spectral responsivity functions (SRF) of the multispectral scanner; (iii) multiplicative detail-injection model with correction of the path-radiance term introduced by the atmosphere. The revisited AWLP has been comparatively evaluated with some of the high performing methods in the literature, on three different datasets from different instruments, with both full-scale and reduced-scale assessments, and achieves the first place, on average, in the ranking of methods providing reproducible results. Full article
Show Figures

Graphical abstract

23 pages, 5170 KiB  
Article
Assessment of IMERG-V06 Precipitation Product over Different Hydro-Climatic Regimes in the Tianshan Mountains, North-Western China
by Muhammad Naveed Anjum, Ijaz Ahmad, Yongjian Ding, Donghui Shangguan, Muhammad Zaman, Muhammad Wajid Ijaz, Kaleem Sarwar, Haidong Han and Min Yang
Remote Sens. 2019, 11(19), 2314; https://doi.org/10.3390/rs11192314 - 04 Oct 2019
Cited by 48 | Viewed by 3764
Abstract
This study presents an assessment of the version-6 (V06) of the Integrated Multi-satellitE Retrievals for Global Precipitation Measurement (IMERG) product from June 2014 to December 2017 over different hydro-climatic regimes in the Tianshan Mountains. The performance of IMERG-V06 was compared with IMERG-V05 and [...] Read more.
This study presents an assessment of the version-6 (V06) of the Integrated Multi-satellitE Retrievals for Global Precipitation Measurement (IMERG) product from June 2014 to December 2017 over different hydro-climatic regimes in the Tianshan Mountains. The performance of IMERG-V06 was compared with IMERG-V05 and the Tropical Rainfall Measuring Mission (TRMM) 3B42V7 precipitation products. The precipitation products were assessed against gauge-based daily and monthly precipitation observations over the entire spatial domain and five hydro-climatologically distinct sub-regions. Results showed that: (1) The spatiotemporal variability of average daily precipitation over the study domain was well represented by all products. (2) All products showed better correlations with the monthly gauge-based observations than the daily data. Compared to 3B42V7, both IMERG products presented a better agreement with gauge-based observations. (3) The estimation skills of all precipitation products showed significant spatial variations. Overall performance of all precipitation products was better in the Eastern region compared to the Middle and Western regions. (4) Satellite products were able to detect tiny precipitation events, but they were uncertain in capturing light and moderate precipitation events. (5) No significant improvements in the precipitation estimation skill of IMERG-V06 were found as compared to IMERG-V05. We deduce that the IMERG-V06 precipitation detection capability could not outperform the efficiency of IMERG-V05. This comparative evaluation of the research products of Global Precipitation Measurement (GPM) and TRMM products in the Tianshan Mountains is useful for data users and algorithm developers. Full article
Show Figures

Figure 1

14 pages, 2543 KiB  
Article
Quantifying Tidal Fluctuations in Remote Sensing Infrared SST Observations
by Cristina González-Haro, Aurélien Ponte and Emmanuelle Autret
Remote Sens. 2019, 11(19), 2313; https://doi.org/10.3390/rs11192313 - 04 Oct 2019
Cited by 3 | Viewed by 3059
Abstract
The expected amplitude of fixed-point sea surface temperature (SST) fluctuations induced by barotropic and baroclinic tidal flows is estimated from tidal current atlases and SST observations. The fluctuations considered are the result of the advection of pre-existing SST fronts by tidal currents. They [...] Read more.
The expected amplitude of fixed-point sea surface temperature (SST) fluctuations induced by barotropic and baroclinic tidal flows is estimated from tidal current atlases and SST observations. The fluctuations considered are the result of the advection of pre-existing SST fronts by tidal currents. They are thus confined to front locations and exhibit fine-scale spatial structures. The amplitude of these tidally induced SST fluctuations is proportional to the scalar product of SST frontal gradients and tidal currents. Regional and global estimations of these expected amplitudes are presented. We predict barotropic tidal motions produce SST fluctuations that may reach amplitudes of 0.3 K. Baroclinic (internal) tides produce SST fluctuations that may reach values that are weaker than 0.1 K. The amplitudes and the detectability of tidally induced fluctuations of SST are discussed in the light of expected SST fluctuations due to other geophysical processes and instrumental (pixel) noise. We conclude that actual observations of tidally induced SST fluctuations are a challenge with present-day observing systems. Full article
(This article belongs to the Special Issue Ten Years of Remote Sensing at Barcelona Expert Center)
Show Figures

Graphical abstract

18 pages, 2101 KiB  
Article
Four Dimensional Mapping of Vegetation Moisture Content Using Dual-Wavelength Terrestrial Laser Scanning
by Ahmed Elsherif, Rachel Gaulton and Jon Mills
Remote Sens. 2019, 11(19), 2311; https://doi.org/10.3390/rs11192311 - 04 Oct 2019
Cited by 10 | Viewed by 5206
Abstract
Recently, terrestrial laser scanning (TLS) has shown potential in measuring vegetation biochemical traits in three dimensions (3D) by using reflectance derived from backscattered intensity data. The 3D estimates can provide information about the vertical heterogeneity of canopy biochemical traits which affects canopy reflectance [...] Read more.
Recently, terrestrial laser scanning (TLS) has shown potential in measuring vegetation biochemical traits in three dimensions (3D) by using reflectance derived from backscattered intensity data. The 3D estimates can provide information about the vertical heterogeneity of canopy biochemical traits which affects canopy reflectance but cannot be measured from spaceborne and airborne optical remote sensing data. Leaf equivalent water thickness (EWT), a metric widely used in vegetation health monitoring, has been successfully linked to the normalized difference index (NDI) of near and shortwave infrared wavelengths at the leaf level. However, only two previous studies have linked EWT to NDI at the canopy level in field campaigns. In this study, an NDI consisting of 808 and 1550 nm wavelengths was used to generate 3D EWT estimates at the canopy level in a broadleaf mixed-species tree plot during and after a heatwave. The relative error in EWT estimates was 6% across four different species. Temporal changes in EWT were measured, and the accuracy varied between trees, a factor of the errors in EWT estimates on both dates. Vertical profiles of EWT were generated for six trees and showed vertical heterogeneity and variation between species. The change in EWT vertical profiles during and after the heatwave differed between trees, demonstrating that trees reacted in different ways to the drought condition. Full article
Show Figures

Figure 1

4 pages, 158 KiB  
Editorial
Editorial to Special Issue “Multispectral Image Acquisition, Processing, and Analysis”
by Benoit Vozel, Vladimir Lukin and Yakoub Bazi
Remote Sens. 2019, 11(19), 2310; https://doi.org/10.3390/rs11192310 - 04 Oct 2019
Cited by 1 | Viewed by 2315
Abstract
This Special Issue was announced in March 2018 [...] Full article
(This article belongs to the Special Issue Multispectral Image Acquisition, Processing and Analysis)
11 pages, 2612 KiB  
Letter
Burn Severity and Post-Fire Land Surface Albedo Relationship in Mediterranean Forest Ecosystems
by Carmen Quintano, Alfonso Fernandez-Manso, Elena Marcos and Leonor Calvo
Remote Sens. 2019, 11(19), 2309; https://doi.org/10.3390/rs11192309 - 03 Oct 2019
Cited by 13 | Viewed by 2737
Abstract
Our study explores the relationship between land surface albedo (LSA) changes and burn severity, checking whether the LSA is an indicator of burn severity, in a large forest fire (117.75 km2, Spain). The LSA was obtained from Landsat data. In particular, [...] Read more.
Our study explores the relationship between land surface albedo (LSA) changes and burn severity, checking whether the LSA is an indicator of burn severity, in a large forest fire (117.75 km2, Spain). The LSA was obtained from Landsat data. In particular, we used an immediately-after-fire scene, a year-after-fire scene and a pre-fire one. The burn severity (three levels) was assessed in 111 field plots by using the Composite Burn Index (CBI). The potentiality of remotely sensed LSA as an indicator for the burn severity was tested by a one-way analysis of variance, correlation analysis and regression models. Specifically, we considered the total shortwave, visible, and near-infrared LSA. Immediately after the fire, we observed a decrease in the LSA for all burn severity levels (up to 0.631). A small increase in the LSA was found (up to 0.0292) a year after the fire. The maximum adjusted coefficient of determination (R2adj) of the linear regression model between the immediately post-fire LSA image and the CBI values was approximately 67%. Fisher’s least significance difference test showed that two burn severity levels could be discriminated by the immediately post-fire LSA image. Our results demonstrate that the magnitude of the changes in the LSA is related to the burn severity with a statistical significance, suggesting the potentiality of immediately-after-fire remotely sensed LSA for estimating the burn severity as an alternative to other satellite-based methods. However, the persistency of these changes in time should be evaluated in future research. Full article
Show Figures

Graphical abstract

21 pages, 13187 KiB  
Article
Identifying Vegetation in Arid Regions Using Object-Based Image Analysis with RGB-Only Aerial Imagery
by Micha Silver, Arti Tiwari and Arnon Karnieli
Remote Sens. 2019, 11(19), 2308; https://doi.org/10.3390/rs11192308 - 03 Oct 2019
Cited by 16 | Viewed by 5924
Abstract
Vegetation state is usually assessed by calculating vegetation indices (VIs) derived from remote sensing systems where the near infrared (NIR) band is used to enhance the vegetation signal. However VIs are pixel-based and require both visible and NIR bands. Yet, most archived photographs [...] Read more.
Vegetation state is usually assessed by calculating vegetation indices (VIs) derived from remote sensing systems where the near infrared (NIR) band is used to enhance the vegetation signal. However VIs are pixel-based and require both visible and NIR bands. Yet, most archived photographs were obtained with cameras that record only the three visible bands. Attempts to construct VIs with the visible bands alone have shown only limited success, especially in drylands. The current study identifies vegetation patches in the hyperarid Israeli desert using only the visible bands from aerial photographs by adapting an alternative geospatial object-based image analysis (GEOBIA) routine, together with recent improvements in preprocessing. The preprocessing step selects a balanced threshold value for image segmentation using unsupervised parameter optimization. Then the images undergo two processes: segmentation and classification. After tallying modeled vegetation patches that overlap true tree locations, both true positive and false positive rates are obtained from the classification and receiver operating characteristic (ROC) curves are plotted. The results show successful identification of vegetation patches in multiple zones from each study area, with area under the ROC curve values between 0.72 and 0.83. Full article
(This article belongs to the Special Issue Object Based Image Analysis for Remote Sensing)
Show Figures

Graphical abstract

27 pages, 3526 KiB  
Article
Estimating High Spatio-Temporal Resolution Rainfall from MSG1 and GPM IMERG Based on Machine Learning: Case Study of Iran
by Nazli Turini, Boris Thies and Joerg Bendix
Remote Sens. 2019, 11(19), 2307; https://doi.org/10.3390/rs11192307 - 03 Oct 2019
Cited by 13 | Viewed by 3723
Abstract
A new satellite-based technique for rainfall retrieval in high spatio-temporal resolution (3 km, 15 min) for Iran is presented. The algorithm is based on the infrared bands of the Meteosat Second Generation Spinning Enhanced Visible and Infrared Imager (MSG SEVIRI). Random forest models [...] Read more.
A new satellite-based technique for rainfall retrieval in high spatio-temporal resolution (3 km, 15 min) for Iran is presented. The algorithm is based on the infrared bands of the Meteosat Second Generation Spinning Enhanced Visible and Infrared Imager (MSG SEVIRI). Random forest models using microwave-only rainfall information of the Integrated Multi-SatEllite Retrieval for the Global Precipitation Measurement (GPM) (IMERG) product as a reference were developed to (i) delineate the rainfall area and (ii) to assign the rainfall rate. The method was validated against independent microwave-only GPM IMERG rainfall data not used for model training. Additionally, the new technique was validated against completely independent gauge station data. The validation results show a promising performance of the new rainfall retrieval technique, especially when compared to the GPM IMERG IR-only rainfall product. The standard verification scored an average Heidke Skill Score of 0.4 for rain area delineation and an average R between 0.1 and 0.7 for rainfall rate assignment, indicating uncertainties for the Lut Desert area and regions with high altitude gradients. Full article
(This article belongs to the Section Atmospheric Remote Sensing)
Show Figures

Graphical abstract

18 pages, 5458 KiB  
Article
The Effect of Mineral Sediments on Satellite Chlorophyll-a Retrievals from Line-Height Algorithms Using Red and Near-Infrared Bands
by Chuiqing Zeng and Caren Binding
Remote Sens. 2019, 11(19), 2306; https://doi.org/10.3390/rs11192306 - 03 Oct 2019
Cited by 16 | Viewed by 3792
Abstract
Red and near-infrared line-height algorithms such as the maximum chlorophyll index (MCI) are often considered optimal for remote sensing of chlorophyll-a (Chl-a) in turbid eutrophic waters, under the assumption of minimal influence from mineral sediments. This study investigated the impact of mineral turbidity [...] Read more.
Red and near-infrared line-height algorithms such as the maximum chlorophyll index (MCI) are often considered optimal for remote sensing of chlorophyll-a (Chl-a) in turbid eutrophic waters, under the assumption of minimal influence from mineral sediments. This study investigated the impact of mineral turbidity on line-height algorithms using MCI as a primary example. Inherent optical properties from two turbid eutrophic lakes were used to simulate reflectance spectra. The simulated results: (1) confirmed a non-linear relationship between Chl-a and MCI; (2) suggested optimal use of the MCI at Chl-a < ~100 mg/m3 and saturation of the index at Chl-a ~300 mg/m3; (3) suggested significant variability in the MCI:Chl-a relationship due to mineral scattering, resulting in an RMSE in predicted Chl-a of ~23 mg/m3; and (4) revealed elevated Chl a retrievals and potential false positive algal bloom reports for sediment concentrations > 20 g/m3. A novel approach combining both MCI and its baseline slope, MCIslope reduced the RMSE to ~5 mg/m3. A quality flag based on MCIslope was proposed to mask erroneously high Chl-a retrievals and reduce the risk of false positive bloom reports in highly turbid waters. Observations suggest the approach may be valuable for all line-height-based Chl-a algorithms. Full article
Show Figures

Graphical abstract

16 pages, 1388 KiB  
Article
Trends in Remote Sensing Accuracy Assessment Approaches in the Context of Natural Resources
by Lucia Morales-Barquero, Mitchell B. Lyons, Stuart R. Phinn and Chris M. Roelfsema
Remote Sens. 2019, 11(19), 2305; https://doi.org/10.3390/rs11192305 - 03 Oct 2019
Cited by 56 | Viewed by 7243
Abstract
The utility of land cover maps for natural resources management relies on knowing the uncertainty associated with each map. The continuous advances typical of remote sensing, including the increasing availability of higher spatial and temporal resolution satellite data and data analysis capabilities, have [...] Read more.
The utility of land cover maps for natural resources management relies on knowing the uncertainty associated with each map. The continuous advances typical of remote sensing, including the increasing availability of higher spatial and temporal resolution satellite data and data analysis capabilities, have created both opportunities and challenges for improving the application of accuracy assessment. There are well established accuracy assessment methods, but their underlying assumptions have not changed much in the last couple decades. Consequently, revisiting how map error and accuracy have been performed and reported over the last two decades is timely, to highlight areas where there is scope for better utilization of emerging opportunities. We conducted a quantitative literature review on accuracy assessment practices for mapping via remote sensing classification methods, in both terrestrial and marine environments. We performed a structured search for land and benthic cover mapping, limiting our search to journals within the remote sensing field, and papers published between 1998–2017. After an initial screening process, we assembled a database of 282 papers, and extracted and standardized information on various components of their reported accuracy assessments. We discovered that only 56% of the papers explicitly included an error matrix, and a very limited number (14%) reported overall accuracy with confidence intervals. The use of kappa continues to be standard practice, being reported in 50.4% of the literature published on or after 2012. Reference datasets used for validation were collected using a probability sampling design in 54% of the papers. For approximately 11% of the studies, the sampling design used could not be determined. No association was found between classification complexity (i.e. number of classes) and measured accuracy, independent from the size of the study area. Overall, only 32% of papers included an accuracy assessment that could be considered reproducible; that is, they included a probability-based sampling scheme to collect the reference dataset, a complete error matrix, and provided sufficient characterization of the reference datasets and sampling unit. Our findings indicate that considerable work remains to identify and adopt more statistically rigorous accuracy assessment practices to achieve transparent and comparable land and benthic cover maps. Full article
Show Figures

Graphical abstract

17 pages, 20902 KiB  
Article
Evaluation of TsHARP Utility for Thermal Sharpening of Sentinel-3 Satellite Images Using Sentinel-2 Visual Imagery
by Hanna Huryna, Yafit Cohen, Arnon Karnieli, Natalya Panov, William P. Kustas and Nurit Agam
Remote Sens. 2019, 11(19), 2304; https://doi.org/10.3390/rs11192304 - 03 Oct 2019
Cited by 27 | Viewed by 4856
Abstract
A spatially distributed land surface temperature is important for many studies. The recent launch of the Sentinel satellite programs paves the way for an abundance of opportunities for both large area and long-term investigations. However, the spatial resolution of Sentinel-3 thermal images is [...] Read more.
A spatially distributed land surface temperature is important for many studies. The recent launch of the Sentinel satellite programs paves the way for an abundance of opportunities for both large area and long-term investigations. However, the spatial resolution of Sentinel-3 thermal images is not suitable for monitoring small fragmented fields. Thermal sharpening is one of the primary methods used to obtain thermal images at finer spatial resolution at a daily revisit time. In the current study, the utility of the TsHARP method to sharpen the low resolution of Sentinel-3 thermal data was examined using Sentinel-2 visible-near infrared imagery. Compared to Landsat 8 fine thermal images, the sharpening resulted in mean absolute errors of ~1 °C, with errors increasing as the difference between the native and the target resolutions increases. Part of the error is attributed to the discrepancy between the thermal images acquired by the two platforms. Further research is due to test additional sites and conditions, and potentially additional sharpening methods, applied to the Sentinel platforms. Full article
Show Figures

Graphical abstract

21 pages, 2021 KiB  
Article
Multi-Channel Weather Radar Echo Extrapolation with Convolutional Recurrent Neural Networks
by Quang-Khai Tran and Sa-kwang Song
Remote Sens. 2019, 11(19), 2303; https://doi.org/10.3390/rs11192303 - 02 Oct 2019
Cited by 37 | Viewed by 5208
Abstract
This article presents an investigation into the problem of 3D radar echo extrapolation in precipitation nowcasting, using recent AI advances, together with a viewpoint from Computer Vision. While Deep Learning methods, especially convolutional recurrent neural networks, have been developed to perform extrapolation, most [...] Read more.
This article presents an investigation into the problem of 3D radar echo extrapolation in precipitation nowcasting, using recent AI advances, together with a viewpoint from Computer Vision. While Deep Learning methods, especially convolutional recurrent neural networks, have been developed to perform extrapolation, most works use 2D radar images rather than 3D images. In addition, the very few ones which try 3D data do not show a clear picture of results. Through this study, we found a potential problem in the convolution-based prediction of 3D data, which is similar to the cross-talk effect in multi-channel radar processing but has not been documented well in the literature, and discovered the root cause. The problem was that, when we generated different channels using one receptive field, some information in a channel, especially observation errors, might affect other channels unexpectedly. We found that, when using the early-stopping technique to avoid over-fitting, the receptive field did not learn enough to cancel unnecessary information. If we increased the number of training iterations, this effect could be reduced but that might worsen the over-fitting situation. We therefore proposed a new output generation block which generates each channel separately and showed the improvement. Moreover, we also found that common image augmentation techniques in Computer Vision can be helpful for radar echo extrapolation, improving testing mean squared error of employed models at least 20% in our experiments. Full article
Show Figures

Figure 1

Previous Issue
Back to TopTop