Retrieving Leaf Chlorophyll Content by Incorporating Variable Leaf Surface Reflectance in the PROSPECT Model

 , , ,
, , ,
Abstract
:1. Introduction
2. Data
2.1. Datasets
2.2. Leaf Spectral Measurements
2.3. Leaf Biochemical Constituent Determination by Destructive Sampling
3. Methods
3.1. Addition of a Surface Layer with a Variable Refractive Index
3.2. Model Calibration
3.2.1. Determination of N, f′surf and fin
3.2.2. Adjustment of the Specific Absorption Coefficients
3.2.3. Cross Calibration
3.3. Model Validation: Criteria for the Comparison of Model Performance
3.4. Model Sensitivity
3.4.1. Global Sensitivity Analysis
3.4.2. Sensitivity of Model Calibration
3.4.3. Sensitivity of Model Performance
4. Results
4.1. Validation of Model Performances
4.1.1. Recalibrated Specific Absorption Coefficients
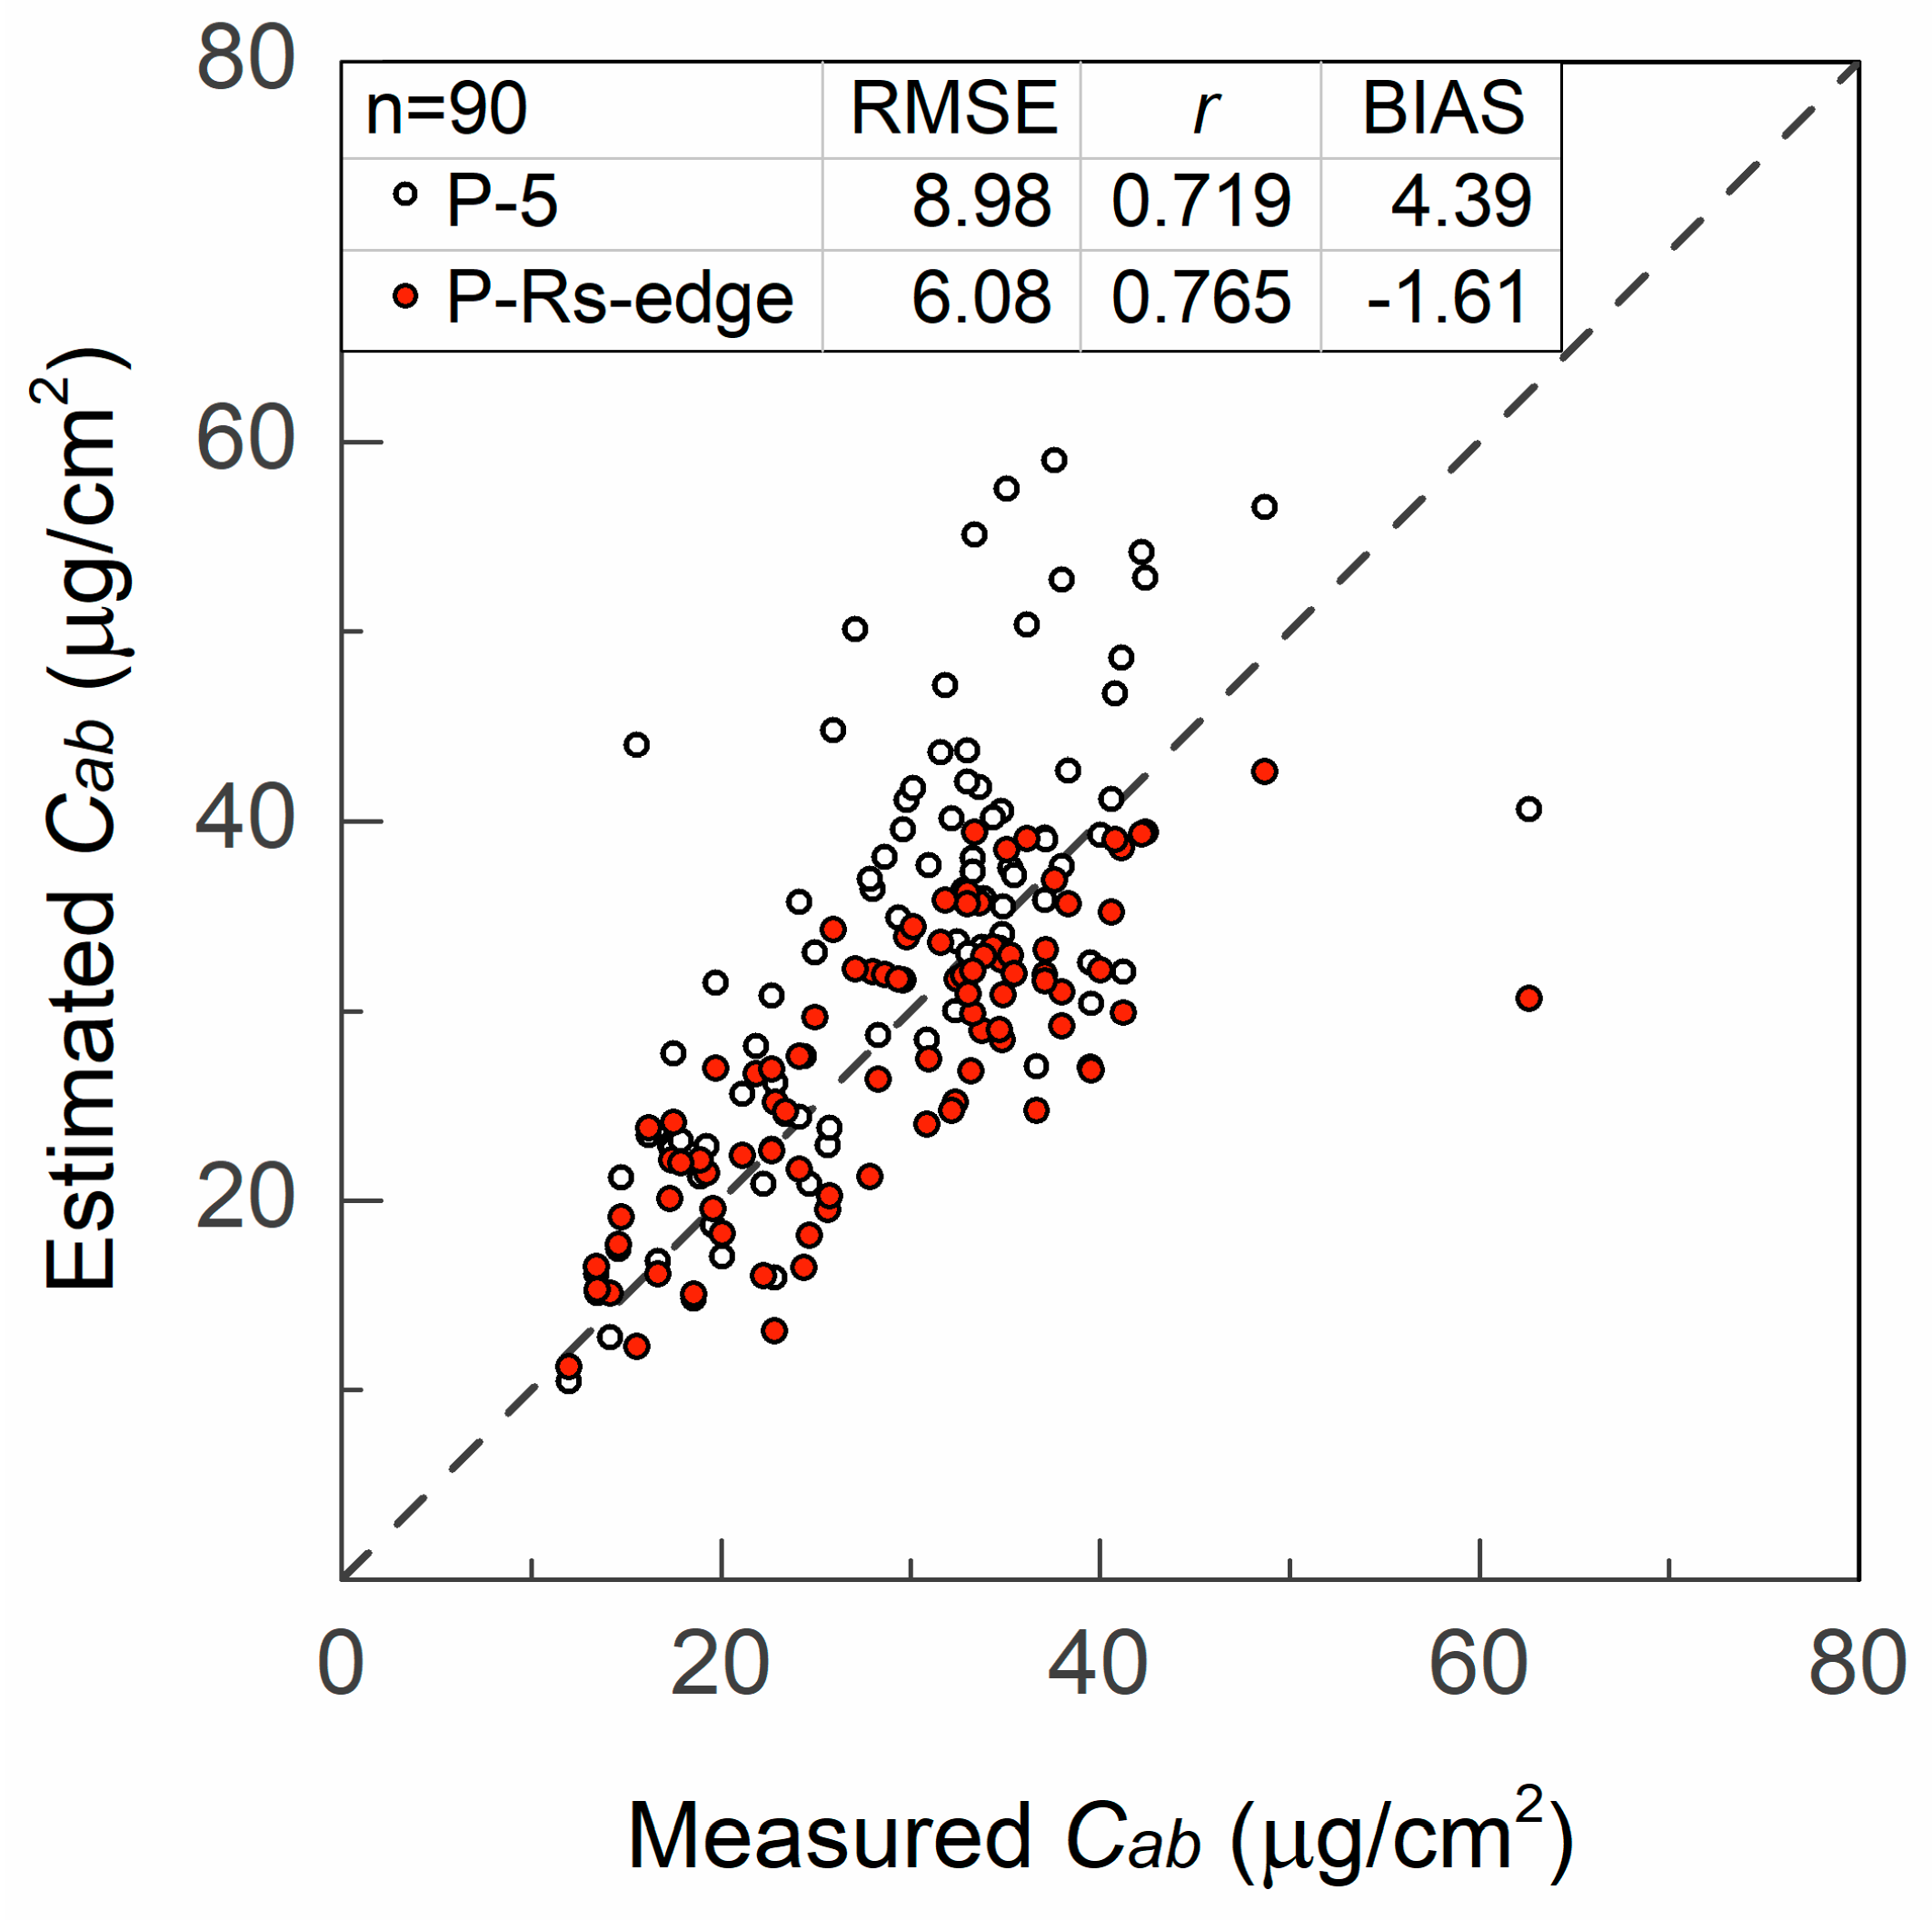
4.1.2. Chlorophyll Content Estimation
4.1.3. Spectra Reconstruction
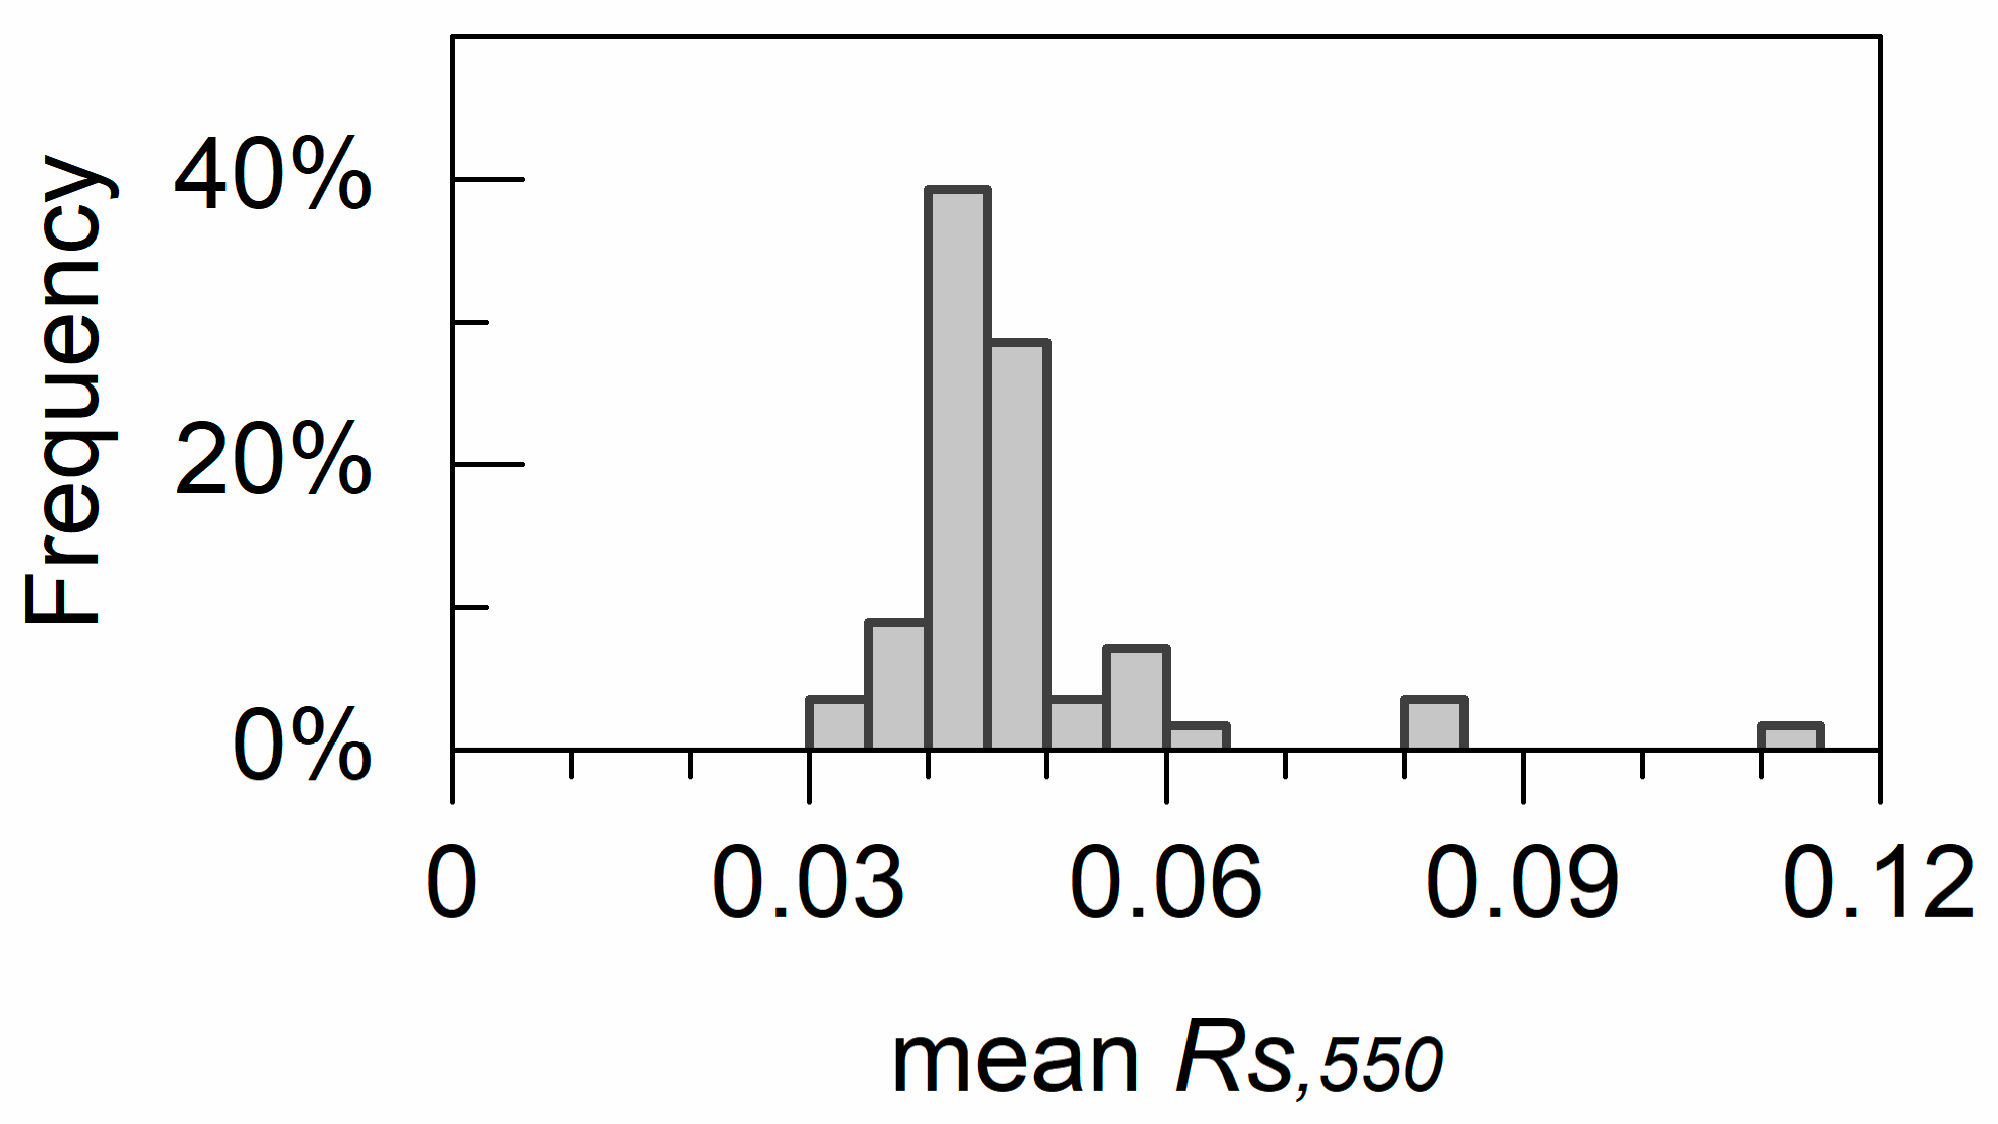
4.2. Estimated Leaf Surface Reflectance and Refractive Indices
4.3. Sensitivity to the Uncertainty Associated with Rs
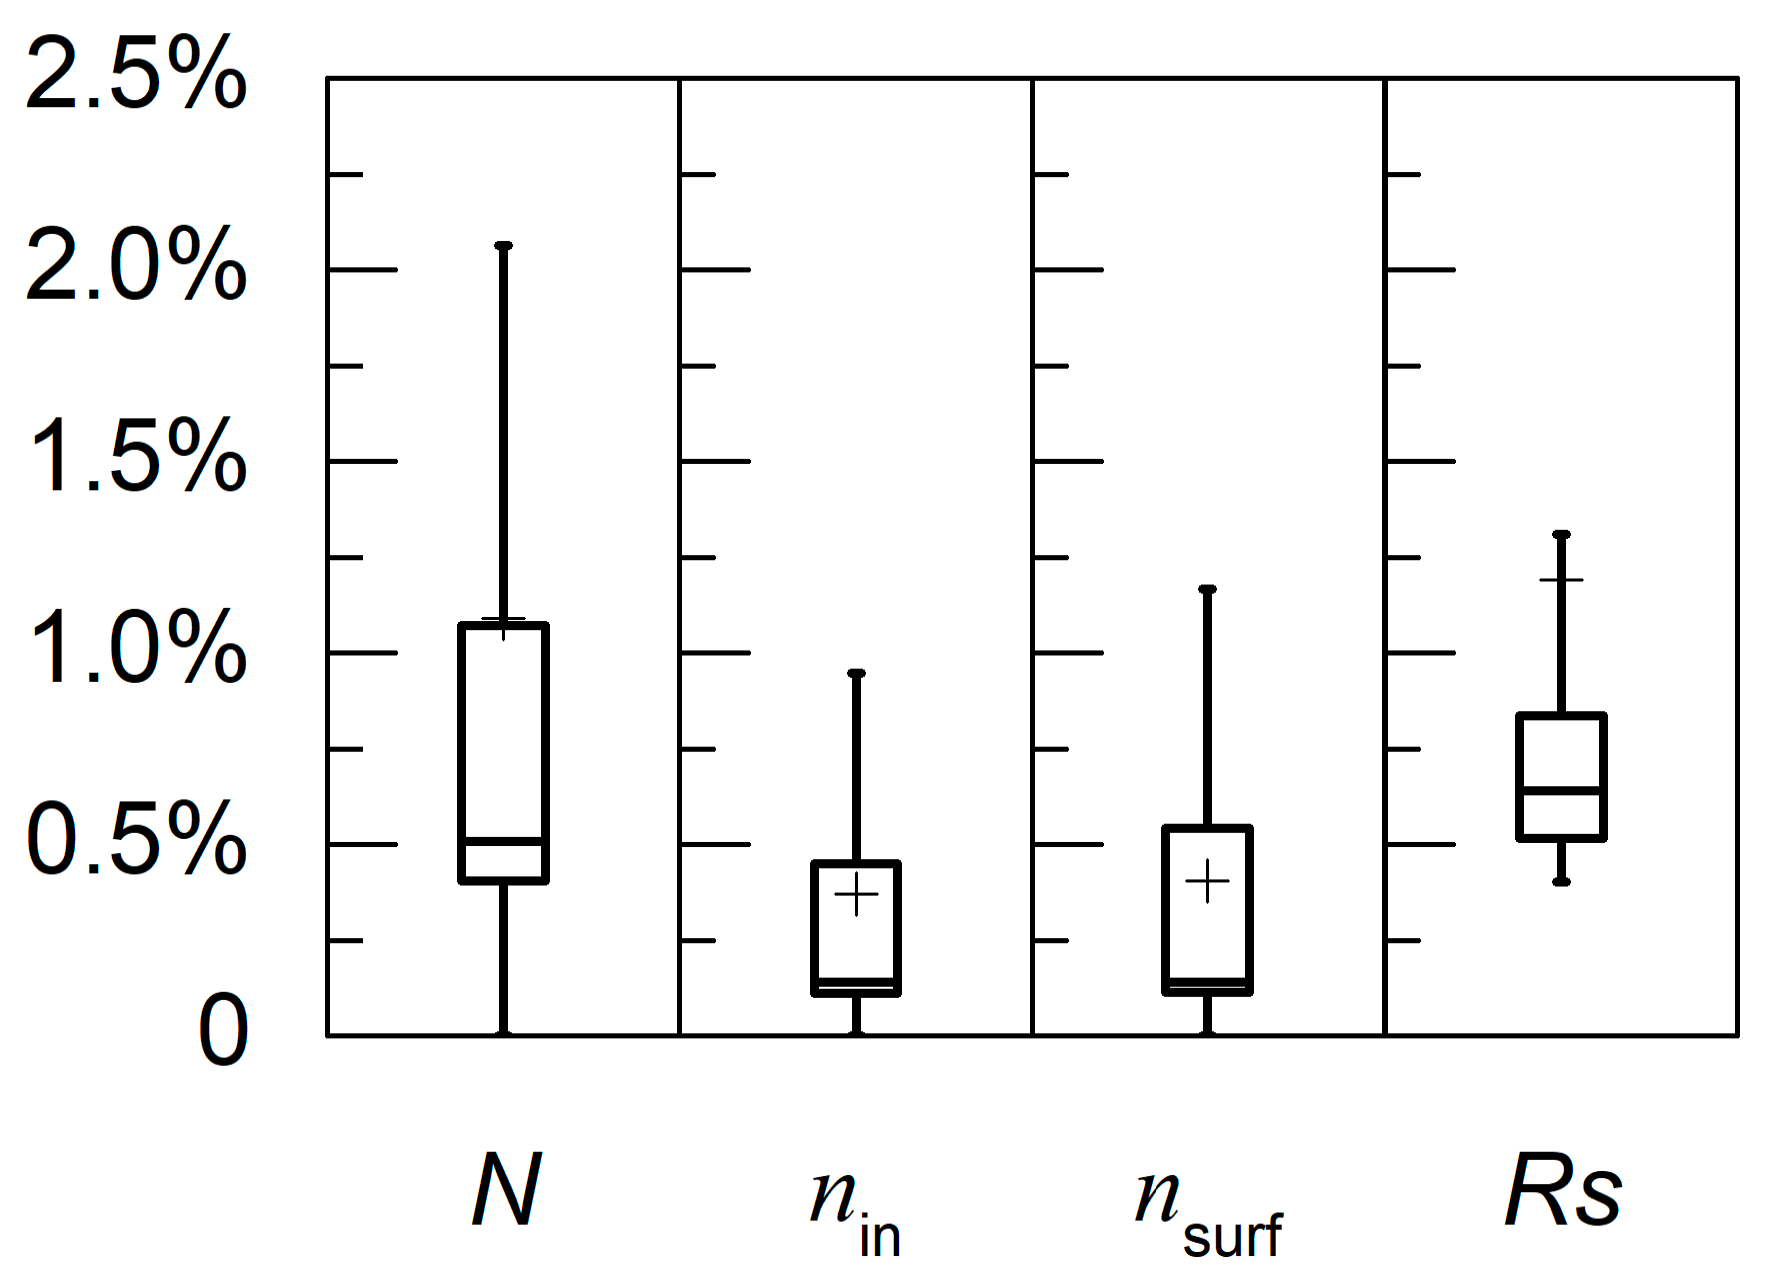
4.3.1. Global Sensitivity Analysis
4.3.2. Sensitivity of Model Calibration
4.3.3. Chlorophyll Content Retrieval
5. Discussion
5.1. Effects of Leaf Surface Reflectance on Chlorophyll Estimation
5.2. Improvements on Needle Leaf Chlorophyll Content Retrieval
5.3. Leaf Surface Reflectance and Refractive Indices
6. Conclusions
Author Contributions
Funding
Acknowledgments
Conflicts of Interest
Appendix A

| N | The structure parameter in PROSPECT |
| Cab | Leaf total chlorophyll content |
| Cxc | Leaf total carotenoids content |
| EWT | Equivalent water thickness (leaf water content) |
| LMA | Leaf mass per area (leaf dry matter content) |
| R | Leaf total directional-hemispherical reflectance |
| T | Leaf total directional-hemispherical transmittance |
| Rs | Leaf surface layer reflectance |
| nP3 (λ) | The refractive index used in PROSPECT-3 |
| nsurf (λ) | The refractive index of the surface layer |
| nin (λ) | The refractive index of interior layers |
| f′surf | nsurf (λ) / nin (λ) |
| fin | nin (λ) / nP3 (λ) |
| ID | Species (Latin Name) | Rs | Characteristics of Leaf Upper Surface | ||
|---|---|---|---|---|---|
| Mean | Min | Max | |||
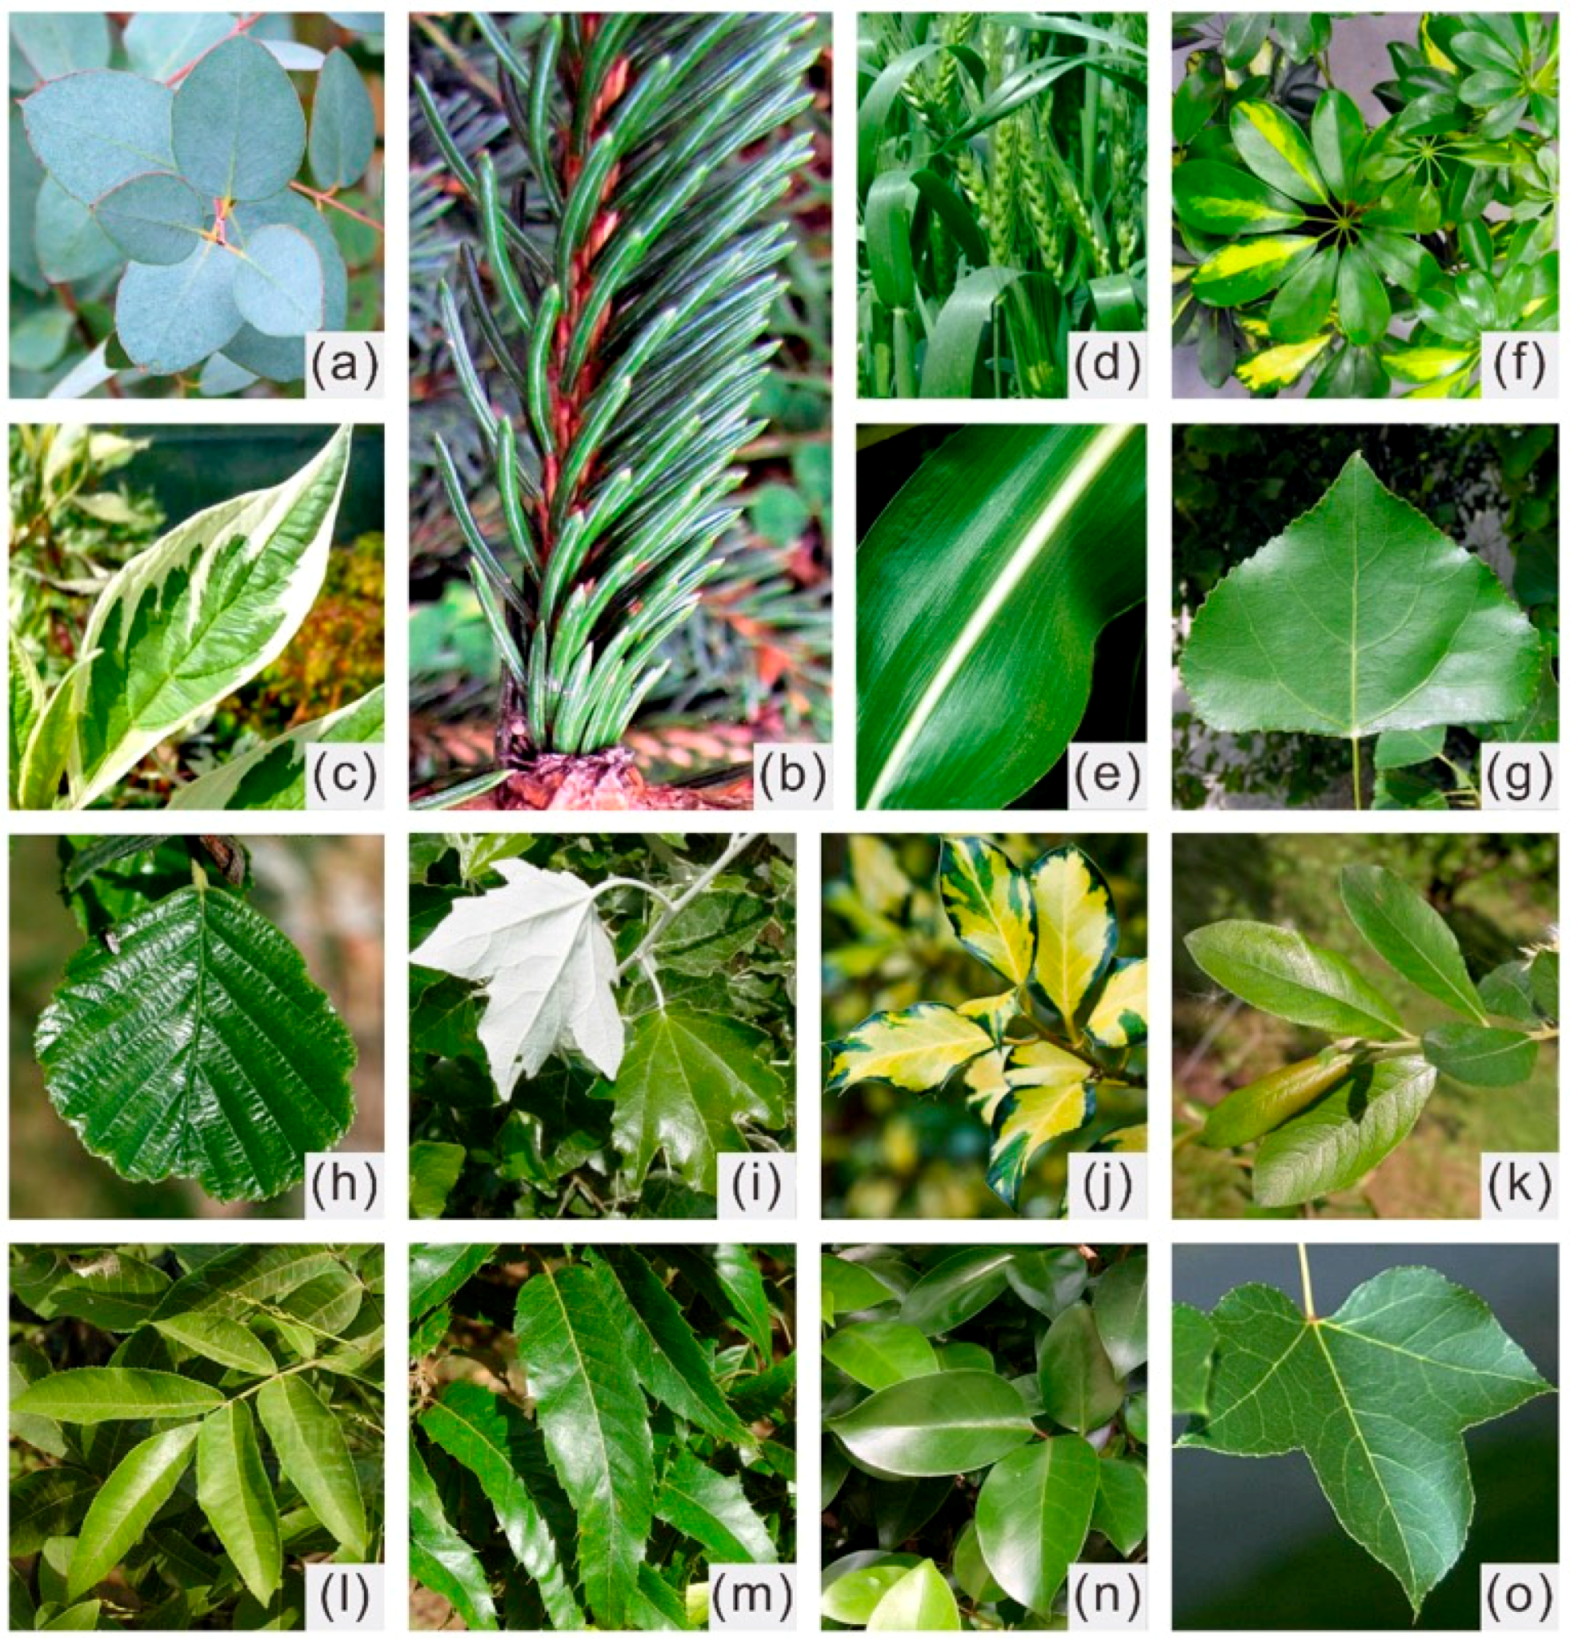
| (a) | Eucalyptus gunnii | 0.112 | 0.111 | 0.112 | waxy; grey-green; thick |
| (b) | Picea mariana (Mill.) | 0.082 | 0.042 | 0.164 | waxy; needle |
| (c) | Cornus alba ‘Elegantissima’ | 0.080 | 0.069 | 0.095 | glabrous green; pubescent with short white appressed trichomes |
| (d) | Triticum aestivum | 0.063 | 0.036 | 0.093 | waxy, or pubescent |
| (e) | Zea mays | 0.057 | 0.050 | 0.065 | waxy, or pubescent |
| (f) | Schefflera arboricola ‘Gold Capella’ | 0.057 | 0.028 | 0.075 | leathery; glabrous |
| (g) | Populus nigra | 0.055 | 0.047 | 0.060 | thin leathery; glabrous |
| (h) | Alnus glutinosa | 0.054 | 0.049 | 0.059 | leathery; glabrous; dark green |
| (i) | Populus alba | 0.052 | 0.050 | 0.054 | glabrous |
| (j) | Ilex aquifolium ‘Golden Milkboy’ | 0.049 | 0.049 | 0.049 | leathery; shiny; dark green; hard |
| (k) | Salix atrocinerea | 0.048 | 0.047 | 0.051 | dull or slightly glossy; pubescent or pilose (hairs white) |
| (l) | Cyclocarya paliurus | 0.046 | 0.044 | 0.049 | glabrous |
| (m) | Quercus acutissima | 0.045 | 0.037 | 0.057 | glabrous |
| (n) | Ligustrum lucidum | 0.044 | 0.039 | 0.050 | leathery or papery; glabrous |
| (o) | Liquidambar formosana | 0.044 | 0.040 | 0.054 | glabrous |

References
- Comar, A.; Baret, F.; Obein, G.; Simonot, L.; Meneveaux, D.; Viénot, F.; de Solan, B. ACT: A leaf BRDF model taking into account the azimuthal anisotropy of monocotyledonous leaf surface. Remote Sens. Environ. 2014, 143, 112–121. [Google Scholar] [CrossRef]
- Bousquet, L.; Lachérade, S.; Jacquemoud, S.; Moya, I. Leaf BRDF measurements and model for specular and diffuse components differentiation. Remote Sens. Environ. 2005, 98, 201–211. [Google Scholar] [CrossRef]
- Maccioni, A.; Agati, G.; Mazzinghi, P. New vegetation indices for remote measurement of chlorophylls based on leaf directional reflectance spectra. J. Photochem. Photobiol. B Biol. 2001, 61, 52–61. [Google Scholar] [CrossRef]
- Levizou, E.; Drilias, P.; Psaras, G.K.; Manetas, Y. Nondestructive assessment of leaf chemistry and physiology through spectral reflectance measurements may be misleading when changes in trichome density co-occur. New Phytol. 2005, 165, 463–472. [Google Scholar] [CrossRef] [PubMed]
- Sims, D.A.; Gamon, J.A. Relationships between leaf pigment content and spectral reflectance across a wide range of species, leaf structures and developmental stages. Remote Sens. Environ. 2002, 81, 337–354. [Google Scholar] [CrossRef]
- Cameron, K.D.; Teece, M.A.; Smart, L.B. Increased accumulation of cuticular wax and expression of lipid transfer protein in response to periodic drying events in leaves of tree tobacco. Plant Physiol. 2006, 140, 176–183. [Google Scholar] [CrossRef]
- Grant, L.; Daughtry, C.S.T.; Vanderbilt, V.C. Polarized and specular reflectance variation with leaf surface features. Physiol. Plant. 1993, 88, 1–9. [Google Scholar] [CrossRef]
- Pfündel, E.E.; Agati, G.; Cerovic, Z.G. Optical Properties of Plant Surfaces. In Annual Plant Reviews Volume 23: Biology of the Plant Cuticle; Blackwell Publishing Ltd.: Oxford, UK, 2006; pp. 216–249. [Google Scholar]
- Baldini, E.; Facini, O.; Nerozzi, F.; Rossi, F.; Rotondi, A. Leaf characteristics and optical properties of different woody species. Trees 1997, 12, 73–81. [Google Scholar] [CrossRef]
- Ehleringer, J.; Björkman, O.; Mooney, H.A. Leaf pubescence: Effects on absorptance and photosynthesis in a desert shrub. Science 1976, 192, 376–377. [Google Scholar] [CrossRef]
- Holmes, M.G.; Keiller, D.R. Effects of pubescence and waxes on the reflectance of leaves in the ultraviolet and photosynthetic wavebands: A comparison of a range of species. Plant Cell Environ. 2002, 25, 85–93. [Google Scholar] [CrossRef]
- Breece, H.T.; Holmes, R.A. Bidirectional Scattering Characteristics of Healthy Green Soybean and Corn Leaves in Vivo. Appl. Opt. 1971, 10, 119–127. [Google Scholar] [CrossRef] [PubMed]
- Jay, S.; Bendoula, R.; Hadoux, X.; Féret, J.-B.; Gorretta, N. A physically-based model for retrieving foliar biochemistry and leaf orientation using close-range imaging spectroscopy. Remote Sens. Environ. 2016, 177, 220–236. [Google Scholar] [CrossRef] [Green Version]
- Vanderbilt, V.C.; Grant, L. Polarization photometer to measure bidirectional reflectance factor R (55°, 0°; 55°, 180°) of leaves. Opt. Eng. 1986, 25, 1002–1012. [Google Scholar] [CrossRef]
- Verrelst, J.; Camps-Valls, G.; Muñoz-Marí, J.; Rivera, J.P.; Veroustraete, F.; Clevers, J.G.; Moreno, J. Optical remote sensing and the retrieval of terrestrial vegetation bio-geophysical properties—A review. ISPRS J. Photogramm. Remote Sens. 2015, 108, 273–290. [Google Scholar] [CrossRef]
- Gitelson, A.A.; Gritz, Y.; Merzlyak, M.N. Relationships between leaf chlorophyll content and spectral reflectance and algorithms for non-destructive chlorophyll assessment in higher plant leaves. J. Plant Physiol. 2003, 160, 271–282. [Google Scholar] [CrossRef]
- Croft, H.; Chen, J.M.; Zhang, Y. The applicability of empirical vegetation indices for determining leaf chlorophyll content over different leaf and canopy structures. Ecol. Complex. 2014, 17, 119–130. [Google Scholar] [CrossRef]
- Jacquemoud, S.; Baret, F. PROSPECT: A model of leaf optical properties spectra. Remote Sens. Environ. 1990, 34, 75–91. [Google Scholar] [CrossRef]
- Combal, B.; Baret, F.; Weiss, M.; Trubuil, A.; Macé, D.; Pragnère, A.; Myneni, R.; Knyazikhin, Y.; Wang, L. Retrieval of canopy biophysical variables from bidirectional reflectance: Using prior information to solve the ill-posed inverse problem. Remote Sens. Environ. 2003, 84, 1–15. [Google Scholar] [CrossRef]
- Darvishzadeh, R.; Skidmore, A.; Schlerf, M.; Atzberger, C. Inversion of a radiative transfer model for estimating vegetation LAI and chlorophyll in a heterogeneous grassland. Remote Sens. Environ. 2008, 112, 2592–2604. [Google Scholar] [CrossRef]
- Jacquemoud, S.; Ustin, S.L.; Verdebout, J.; Schmuck, G.; Andreoli, G.; Hosgood, B. Estimating Leaf Biochemistry Using the PROSPECT Leaf Optical Properties Model. Remote Sens. Environ. 1996, 56, 194–202. [Google Scholar] [CrossRef]
- Barry, K.; Newnham, G. Quantification of chlorophyll and carotenoid pigments in eucalyptus foliage with the radiative transfer model PROSPECT 5 is affected by anthocyanin and epicuticular waxes. In Proceedings of the Geospatial Science Research Symposium—GSR_2, Melbourne, Australia, 10–12 December 2012; pp. 1–7. [Google Scholar]
- Barry, K.M.; Newnham, G.J.; Stone, C. Estimation of chlorophyll content in Eucalyptus globulus foliage with the leaf reflectance model PROSPECT. Agric. For. Meteorol. 2009, 149, 1209–1213. [Google Scholar] [CrossRef]
- Féret, J.B.; Gitelson, A.A.; Noble, S.D.; Jacquemoud, S. PROSPECT-D: Towards modeling leaf optical properties through a complete lifecycle. Remote Sens. Environ. 2017, 193, 204–215. [Google Scholar] [CrossRef] [Green Version]
- Li, D.; Cheng, T.; Jia, M.; Zhou, K.; Lu, N.; Yao, X.; Tian, Y.; Zhu, Y.; Cao, W. PROCWT: Coupling PROSPECT with continuous wavelet transform to improve the retrieval of foliar chemistry from leaf bidirectional reflectance spectra. Remote Sens. Environ. 2018, 206, 1–14. [Google Scholar] [CrossRef]
- Gerber, F.; Marion, R.; Olioso, A.; Jacquemoud, S.; Ribeiro da Luz, B.; Fabre, S. Modeling directional–hemispherical reflectance and transmittance of fresh and dry leaves from 0.4 μm to 5.7 μm with the PROSPECT-VISIR model. Remote Sens. Environ. 2011, 115, 404–414. [Google Scholar] [CrossRef]
- Clark, J.B.; Lister, G.R. Photosynthetic Action Spectra of Trees. Plant Physiol. 1975, 55, 407–413. [Google Scholar] [CrossRef] [PubMed] [Green Version]
- Féret, J.-B.; François, C.; Asner, G.P.; Gitelson, A.A.; Martin, R.E.; Bidel, L.P.R.; Ustin, S.L.; le Maire, G.; Jacquemoud, S. PROSPECT-4 and 5: Advances in the leaf optical properties model separating photosynthetic pigments. Remote Sens. Environ. 2008, 112, 3030–3043. [Google Scholar] [CrossRef]
- Lichtenthaler, H.K. Chlorophylls and carotenoids: Pigments of photosynthetic biomembranes. Methods Enzymol. 1987, 148, 350–381. [Google Scholar]
- Minocha, R.; Martinez, G.; Lyons, B.; Long, S. Development of a standardized methodology for quantifying total chlorophyll and carotenoids from foliage of hardwood and conifer tree species. Can. J. For. Res. 2009, 39, 849–861. [Google Scholar] [CrossRef]
- Zarco-Tejada, P.J.; Miller, J.R.; Harron, J.; Hu, B.; Noland, T.L.; Goel, N.; Mohammed, G.H.; Sampson, P. Needle chlorophyll content estimation through model inversion using hyperspectral data from boreal conifer forest canopies. Remote Sens. Environ. 2004, 89, 189–199. [Google Scholar] [CrossRef]
- Harron, J. Optical Properties of Phytoelements in Conifers. Master’s Thesis, York University, North York, ON, Canada, 2000. [Google Scholar]
- Zhang, Y.; Chen, J.M.; Miller, J.R.; Noland, T.L. Retrieving chlorophyll content in conifer needles from hyperspectral measurements. Can. J. Remote Sens. 2008, 34, 296–310. [Google Scholar]
- Zarco-Tejada, P.J.; Miller, J.R.; Mohammed, G.H.; Noland, T.L. Chlorophyll Fluorescence Effects on Vegetation Apparent Reflectance: I. Leaf-Level Measurements and Model Simulation. Remote Sens. Environ. 2000, 74, 582–595. [Google Scholar] [CrossRef]
- Croft, H.; Chen, J.M. Leaf pigment content. In Comprehensive Remote Sensing; Liang, S., Ed.; Elsevier: Oxford, UK, 2018; pp. 117–142. [Google Scholar]
- Wellburn, A.R. The Spectral Determination of Chlorophylls a and b, as well as Total Carotenoids, Using Various Solvents with Spectrophotometers of Different Resolutions. J. Plant Physiol. 1994, 144, 307–313. [Google Scholar] [CrossRef]
- Allen, W.A.; Gausman, H.W.; Richardson, A.J.; Thomas, J.R. Interaction of isotropic light with a compact plant leaf. J. Opt. Soc. Am. 1969, 59, 1376–1379. [Google Scholar] [CrossRef]
- Lucarini, V.; Saarinen, J.; Peiponen, K.; Vartiainen, E. Kramers-Kronig Relations in Optical Materials Research; Rhodes, W.T., Ed.; Springer: Berlin, Germany, 2005; Volume 110, p. 162. [Google Scholar]
- Chen, M.; Weng, F. Kramers-Kronig analysis of leaf refractive index with the PROSPECT leaf optical property model. J. Geophys. Res. 2012, 117. [Google Scholar] [CrossRef] [Green Version]
- D’Errico, J. Fminsearchbnd. MATLAB Central File Exchange. 2012. Available online: https://ww2.mathworks.cn/matlabcentral/fileexchange/8277-fminsearchbnd-fminsearchcon (accessed on 19 March 2014).
- Gausman, H.W.; Allen, W.A.; Escobar, D.E. Refractive Index of Plant Cell Walls. Appl. Opt. 1974, 13, 109–111. [Google Scholar] [CrossRef] [PubMed]
- Cannavó, F. Sensitivity analysis for volcanic source modeling quality assessment and model selection. Comput. Geosci. 2012, 44, 52–59. [Google Scholar] [CrossRef]
- Jacquemoud, S.; Verhoef, W.; Baret, F.; Bacour, C.; Zarco-Tejada, P.J.; Asner, G.P.; François, C.; Ustin, S.L. PROSPECT + SAIL models: A review of use for vegetation characterization. Remote Sens. Environ. 2009, 113, S56–S66. [Google Scholar] [CrossRef]


| ANGERS | XS | BM | JTL | NX | Crop_UT | Needle_Zh | |
|---|---|---|---|---|---|---|---|
| Year | 2003 | 2014 | 2015 | 2015 | 2014 | 2013 | 2003–2004 |
| Number of samples | 276 | 175 | 54 | 35 | 140 | 152 | 90 |
| Number of species | 43 | 2 (a) | 8 (b) | 1 (c) | 1 (d) | 2 (e) | 1 (f) |
| Spectral measurement devices | ASD FieldSpec Integrating sphere (IS) | ASD FieldSpec 3 ASD RTS-3ZC IS | ASD FieldSpec Pro FR Li-COR 1800 IS | ASD FieldSpec Pro FR Li-COR 1800 IS | |||
| Spectral sampling | 1.4 nm (400–1000 nm), 2 nm (1000–2500 nm) | ||||||
| Solvent for pigments | Ethanol 95% | Acetone 100% | DMF * | DMF | |||
| Method for pigments | [29] | [29] | [30] | [31] | |||
| Chlorophyll (µg/cm2) | |||||||
| Max | 106.7 | 93.8 | 80.8 | 83.9 | 71.7 | 92.5 | 62.6 |
| Min | 0.8 | 16.8 | 1.4 | 30.1 | 20.1 | 0.4 | 12.0 |
| Mean | 33.9 | 50.9 | 40.1 | 56.1 | 44.0 | 43.6 | 29.3 |
| SD ** | 21.7 | 15.5 | 15.5 | 15.9 | 11.2 | 20.3 | 9.1 |
| Carotenoids (µg/cm2) | |||||||
| Max | 25.3 | 17.2 | 16.7 | 15.2 | 12.8 | \ | 10.3 |
| Min | 0.0 | 3.8 | 4.4 | 6.8 | 3.9 | \ | 3.2 |
| Mean | 8.7 | 9.9 | 9.9 | 10.7 | 8.0 | \ | 6.3 |
| SD | 5.1 | 2.9 | 2.7 | 2.3 | 1.9 | \ | 1.6 |
| Water (g/m2) | \ | ||||||
| Max | 340.0 | 144.8 | 206.1 | 312.0 | 168.8 | \ | \ |
| Min | 43.9 | 59.0 | 65.0 | 143.8 | 84.4 | \ | \ |
| Mean | 116.2 | 102.9 | 115.3 | 213.6 | 117.2 | \ | \ |
| SD | 48.6 | 15.9 | 29.1 | 47.0 | 16.1 | \ | \ |
| Dry matter (g/m2) | \ | ||||||
| Max | 331.0 | 166.2 | 145.6 | 185.9 | 56.1 | \ | \ |
| Min | 16.6 | 55.4 | 49.0 | 67.0 | 8.7 | \ | \ |
| Mean | 52.4 | 100.9 | 81.8 | 122.6 | 33.2 | \ | \ |
| SD | 36.7 | 24.7 | 21.8 | 26.9 | 6.0 | \ | \ |
| Variable | Range of Sobol Set |
|---|---|
| N | 1–3 |
| f′surf | 1–1.1 |
| fin | 0.76–1.15 |
| Cab | 0–120 (µg/cm2) |
| Cxc | 0–3 (µg/cm2) |
| EWT | 40–345 (g/m2) |
| LMA | 17–330 (g/m2) |
© 2019 by the authors. Licensee MDPI, Basel, Switzerland. This article is an open access article distributed under the terms and conditions of the Creative Commons Attribution (CC BY) license (http://creativecommons.org/licenses/by/4.0/).
Share and Cite
Qiu, F.; Chen, J.M.; Croft, H.; Li, J.; Zhang, Q.; Zhang, Y.; Ju, W. Retrieving Leaf Chlorophyll Content by Incorporating Variable Leaf Surface Reflectance in the PROSPECT Model. Remote Sens. 2019, 11, 1572. https://doi.org/10.3390/rs11131572
Qiu F, Chen JM, Croft H, Li J, Zhang Q, Zhang Y, Ju W. Retrieving Leaf Chlorophyll Content by Incorporating Variable Leaf Surface Reflectance in the PROSPECT Model. Remote Sensing. 2019; 11(13):1572. https://doi.org/10.3390/rs11131572
Chicago/Turabian StyleQiu, Feng, Jing M. Chen, Holly Croft, Jing Li, Qian Zhang, Yongqin Zhang, and Weimin Ju. 2019. "Retrieving Leaf Chlorophyll Content by Incorporating Variable Leaf Surface Reflectance in the PROSPECT Model" Remote Sensing 11, no. 13: 1572. https://doi.org/10.3390/rs11131572