Deformations and Morphology Changes Associated with the 2016–2017 Eruption Sequence at Bezymianny Volcano, Kamchatka

 , ,
, ,
Abstract
:
1. Introduction
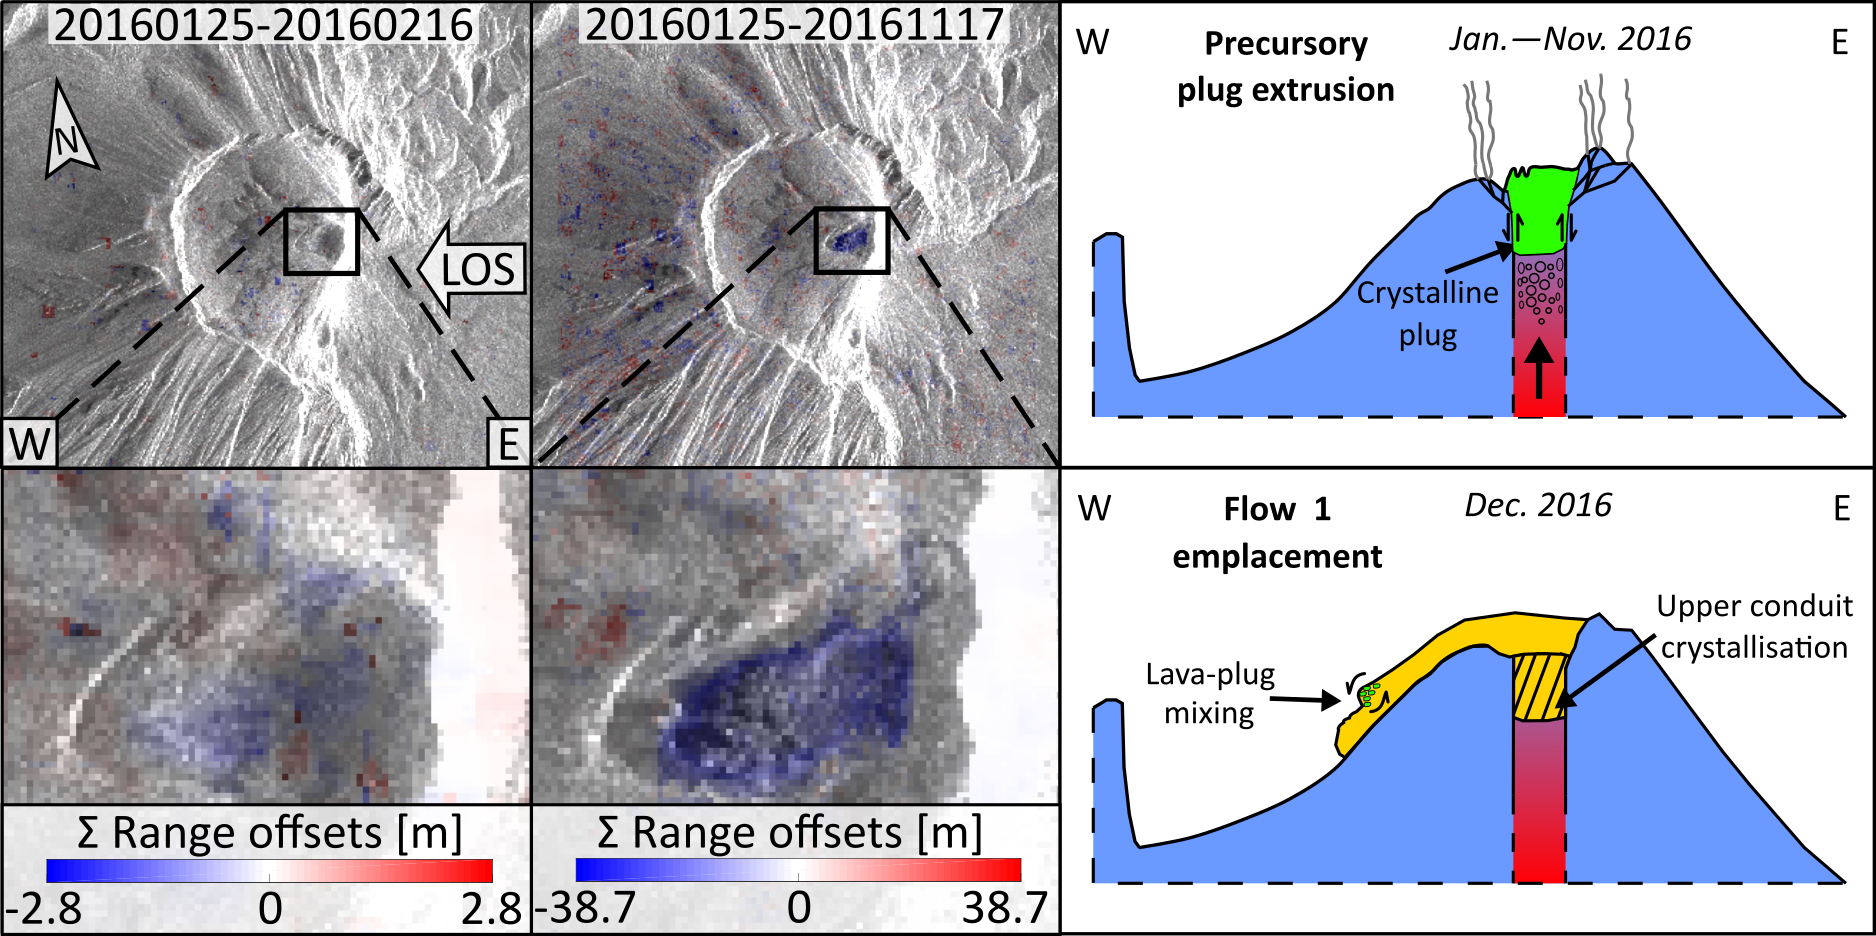
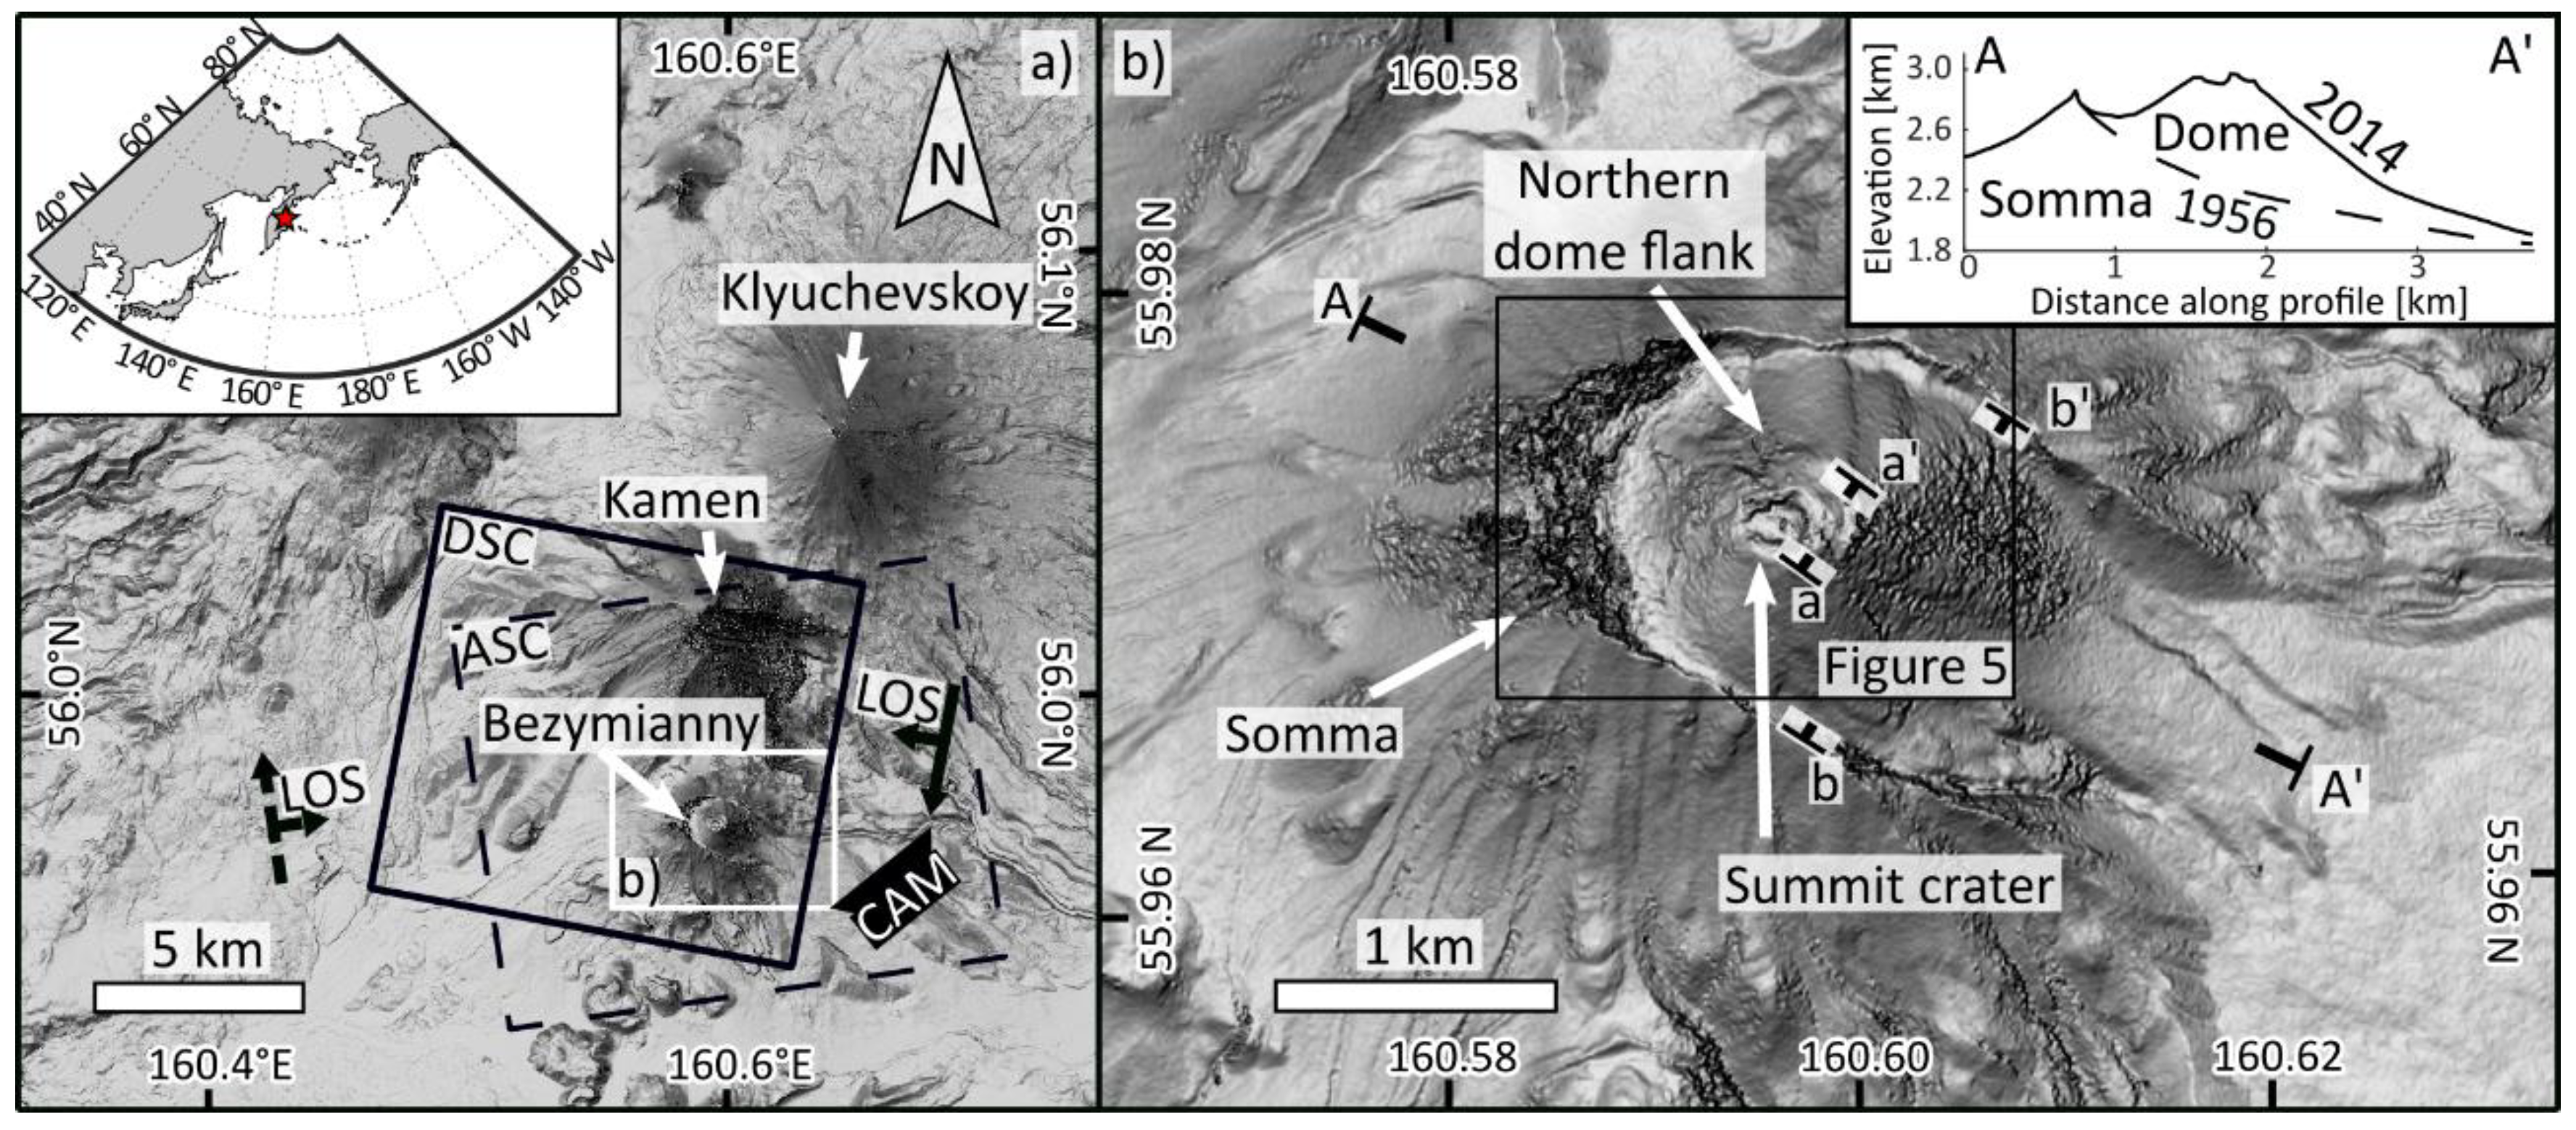
2. Bezymianny
2.1. Volcanological Background
2.2. Monitoring Activities at Bezymianny
3. Data and Methods
3.1. Camera Monitoring and Mimatsu-Diagrams
3.2. Synthetic Aperture Radar (SAR)
3.2.1. SAR Data Set and Amplitude Images
3.2.2. SAR Co-registration and Pixel Offset Measurements
4. Results
4.1. Precursory Ground Movement
4.1.1. Precursory TSX Observations
4.1.2. Precursory Webcam Observations
4.2. Co-eruptive Ground Movement Observations
4.2.1. Co-eruptive TSX Observations
4.2.2. Co-eruptive Webcam Observations
4.3. Three Stage activity
5. Discussion
5.1. Limitations
5.2. Implications and Interpretations of Eruptive Events
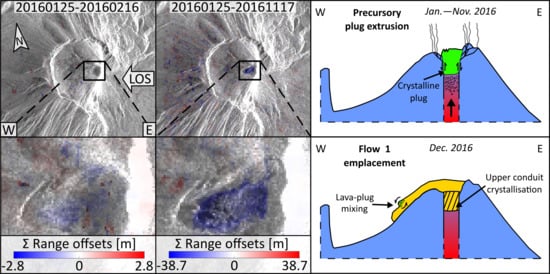
5.2.1. Precursory Deformation
5.2.2. Effusive 5 December 2016–7 March 2017 Eruption
5.2.3. Exogenous and Endogenous Dome Growth—Comparison with other Volcanoes
6. Conclusions
Supplementary Materials
Author Contributions
Funding
Acknowledgments
Conflicts of Interest
Appendix A
Error estimation for offset measurements during the precursory plug extrusion
References
- Sheldrake, T.E.; Sparks, R.S.J.; Cashman, K.V.; Wadge, G.; Aspinall, W.P. Similarities and differences in the historical records of lava dome-building volcanoes: Implications for understanding magmatic processes and eruption forecasting. Earth Sci. Rev. 2016, 160, 240–263. [Google Scholar] [CrossRef] [Green Version]
- Ogburn, S.E.; Loughlin, S.C.; Calder, E.S. The association of lava dome growth with major explosive activity (VEI ≥ 4): DomeHaz, a global dataset. Bull. Volcanol. 2015, 77, 40. [Google Scholar] [CrossRef]
- Voight, B.; Elsworth, D. Instability and collapse of hazardous gas-pressurized lava domes. Geophys. Res. Lett. 2000, 27, 1–4. [Google Scholar] [CrossRef]
- Huppert, H.E.; Shepherd, J.B.; Sigurdsson, H.; Sparks, R.S.J. On lava dome growth, with application to the 1979 lava extrusion of the Soufrière of St. Vincent. J. Volcanol. Geotherm. Res. 1982, 14, 199–222. [Google Scholar] [CrossRef]
- Fink, J.H.; Malin, M.C.; Anderson, S.W. Intrusive and extrusive growth of the Mount St. Helens lava dome. Nature 1990, 348, 435–437. [Google Scholar] [CrossRef]
- Nakada, S.; Shimizu, H.; Ohta, K. Overview of the 1990–1995 eruption at Unzen Volcano. J. Volcanol. Geotherm. Res. 1999, 89, 1–22. [Google Scholar] [CrossRef]
- Watts, R.B.; Herd, R.A.; Sparks, R.S.J.; Young, S.R. Growth patterns and emplacement of the andesitic lava dome at Soufrière Hills Volcano, Montserrat. Geol. Soc. Lond. Mem. 2002, 21, 115–152. [Google Scholar] [CrossRef]
- Sparks, R.S.J. Forecasting volcanic eruptions. Earth Planet. Sci. Lett. 2003, 210, 1–15. [Google Scholar] [CrossRef]
- Salzer, J.T.; Nikkhoo, M.; Walter, T.R.; Sudhaus, H.; Reyes-Dávila, G.; Bretón, M.; Arámbula, R. Satellite radar data reveal short-term pre-explosive displacements and a complex conduit system at Volcán de Colima, Mexico. Front. Earth Sci. 2014, 2, 12. [Google Scholar] [CrossRef]
- Lu, Z.; Dzurisin, D.; Biggs, J.; Wicks, C.; McNutt, S. Ground surface deformation patterns, magma supply, and magma storage at Okmok volcano, Alaska, from InSAR analysis: 1. Intereruption deformation, 1997–2008. J. Geophys. Res. Solid Earth 2010, 115, B00B02. [Google Scholar] [CrossRef]
- Massonnet, D.; Feigl, K.L. Radar interferometry and its application to changes in the Earth’s surface. Rev. Geophys. 1998, 36, 441–500. [Google Scholar] [CrossRef]
- James, M.R.; Pinkerton, H.; Robson, S. Image-based measurement of flux variation in distal regions of active lava flows. Geochem. Geophys. Geosy. 2007, 8, 3. [Google Scholar] [CrossRef]
- Walter, T.R. Low cost volcano deformation monitoring: Optical strain measurement and application to Mount St. Helens data. Geophys. J. Int. 2011, 186, 699–705. [Google Scholar] [CrossRef]
- Pallister, J.S.; Schneider, D.J.; Griswold, J.P.; Keeler, R.H.; Burton, W.C.; Noyles, C.; Newhall, C.G.; Ratdomopurbo, A. Merapi 2010 eruption-chronology and extrusion rates monitored with satellite radar and used in eruption forecasting. J. Volcanol. Geotherm. Res. 2013, 261, 144–152. [Google Scholar] [CrossRef]
- Wadge, G.; Cole, P.; Stinton, A.; Komorowski, J.-C.C.; Stewart, R.; Toombs, A.C.; Legendre, Y. Rapid topographic change measured by high-resolution satellite radar at Soufrière Hills Volcano, Montserrat, 2008–2010. J. Volcanol. Geotherm. Res. 2011, 199, 142–152. [Google Scholar] [CrossRef]
- Wang, T.; Poland, M.P.; Lu, Z. Dome growth at Mount Cleveland, Aleutian Arc, quantified by time series TerraSAR-X imagery. Geophys. Res. Lett. 2015, 42, 10. [Google Scholar] [CrossRef]
- Major, J.J.; Dzurisin, D.; Schilling, S.P.; Poland, M.P. Monitoring lava-dome growth during the 2004–2008 Mount St. Helens, Washington, eruption using oblique terrestrial photography. Earth Planet. Sci. Lett. 2009, 286, 243–254. [Google Scholar] [CrossRef]
- Koulakov, I.; Abkadyrov, I.; Al Arifi, N.; Deev, E.; Droznina, S.; Gordeev, E.I. Three different types of plumbing system beneath the neighboring active volcanoes of Tolbachik, Bezymianny, and Klyuchevskoy in Kamchatka. J. Geophys. Res. Solid Earth 2017, 122, 3852–3874. [Google Scholar] [CrossRef]
- Shapiro, N.M.; Droznin, D.V.; Droznina, S.Y.; Senyukov, S.L.; Gusev, A.A.; Gordeev, E.I. Deep and shallow long-period volcanic seismicity linked by fluid-pressure transfer. Nat. Geosci. 2017, 10, 442–445. [Google Scholar] [CrossRef]
- Thelen, W.; West, M.; Senyukov, S. Seismic characterization of the fall 2007 eruptive sequence at Bezymianny Volcano, Russia. J. Volcanol. Geotherm. Res. 2010, 194, 201–213. [Google Scholar] [CrossRef]
- Shcherbakov, V.D.; Plechov, P.Y.; Izbekov, P.E.; Shipman, J.S. Plagioclase zoning as an indicator of magma processes at Bezymianny Volcano, Kamchatka. Contrib. Mineral. Petrol. 2011, 162, 83–99. [Google Scholar] [CrossRef]
- Turner, S.J.; Izbekov, P.; Langmuir, C. The magma plumbing system of Bezymianny Volcano: Insights from a 54 year time series of trace element whole-rock geochemistry and amphibole compositions. J. Volcanol. Geotherm. Res. 2013, 263, 108–121. [Google Scholar] [CrossRef]
- Braitseva, O.A.; Melekestsev, I.V.; Bogoyavlenskaya, G.E.; Maksimov, A.P. Bezymyannyi: Eruptive history and dynamics. Volcanol. Seismol. 1991, 12, 165–194. [Google Scholar]
- Gorshkov, G.S. Gigantic eruption of the volcano Bezymianny. Bull. Volcanol. 1959, 20, 77–109. [Google Scholar] [CrossRef]
- Bogoyavlenskaya, G.Y.; Braitseva, O.A.; Melekestsev, I.V.; Maksimov, A.P.; Ivanov, B.V. Bezymianny volcano. In Active Volcanoes of Kamchatka; Fedotov, S.A., Masurenkov, Y.P., Eds.; Moscow Nauka Publishers: Moscow, Russia, 1991; Volume 1, pp. 195–197. [Google Scholar]
- Belousov, A. Deposits of the 30 March 1956 directed blast at Bezymianny volcano, Kamchatka, Russia. Bull. Volcanol. 1996, 57, 649–662. [Google Scholar] [CrossRef] [Green Version]
- Lipman, P.W.; Moore, J.G.; Swanson, D.A. Bulging of the north flank before the May 18 eruption-geodetic data. In The 1980 Eruptions of Mount St. Helens, Washington; Lipman, P.W., Mullineaux, D.R., Eds.; United States Geological Survey: Reston, VA, USA, 1981; pp. 143–155. [Google Scholar]
- Voight, B.; Glicken, H.; Janda, R.J.; Douglass, P.M. Catastrophic rockslide avalanche of May 18. In The 1980 Eruptions of Mount St. Helens, Washington; Lipman, P.W., Mullineaux, D.R., Eds.; United States Geological Survey: Reston, VA, USA, 1981; pp. 347–377. [Google Scholar]
- Belousov, A.; Voight, B.; Belousova, M. Directed blasts and blast-generated pyroclastic density currents: A comparison of the Bezymianny 1956, Mount St Helens 1980, and Soufrière Hills, Montserrat 1997 eruptions and deposits. Bull. Volcanol. 2007, 69, 701–740. [Google Scholar] [CrossRef]
- Belousov, A.; Voight, B.; Belousova, M.; Petukhin, A. Pyroclastic surges and flows from the 8–10 May 1997 explosive eruption of Bezymianny volcano, Kamchatka, Russia. Bull. Volcanol. 2002, 64, 455–471. [Google Scholar] [CrossRef]
- Girina, O.A. Chronology of Bezymianny Volcano activity, 1956–2010. J. Volcanol. Geotherm. Res. 2013, 263, 22–41. [Google Scholar] [CrossRef]
- Carter, A.J.; Ramsey, M.S.; Belousov, A.B. Detection of a new summit crater on Bezymianny Volcano lava dome: Satellite and field-based thermal data. Bull. Volcanol. 2007, 69, 811–815. [Google Scholar] [CrossRef]
- Dvigalo, V.N.; Svirid, I.Y.; Shevchenko, A.V.; Sokorenko, A.V.; Demyanchuk, Y.V. Active volcanoes of Northern Kamchatka as seen from aerophotogrammetric data in 2010. In Proceedings of regional conference “Volcanism and associated processes”; Institute of Volcanology and Seismology FEB RAS: Petropavlovsk-Kamchatsky: Petropavlovsk-Kamchatsky, Russia, 2011; pp. 26–36. (In Russian) [Google Scholar]
- Chebrov, V.N.; Droznin, D.V.; Kugaenko, Y.A.; Levina, V.I.; Senyukov, S.L.; Sergeev, V.A. The system of detailed seismological observations in Kamchatka in 2011. J. Volcanol. Seismol. 2013, 7, 16–36. [Google Scholar] [CrossRef]
- Senyukov, S.L. Monitoring and prediction of volcanic activity in Kamchatka from seismological data: 2000–2010. J. Volcanol. Seismol. 2013, 7, 86–97. [Google Scholar] [CrossRef]
- West, M.E. Recent eruptions at Bezymianny volcano-A seismological comparison. J. Volcanol. Geotherm. Res. 2013, 263, 42–57. [Google Scholar] [CrossRef]
- Ramsey, M.; Dehn, J. Spaceborne observations of the 2000 Bezymianny, Kamchatka eruption: The integration of high-resolution ASTER data into near real-time monitoring using AVHRR. J. Volcanol. Geotherm. Res. 2004, 135, 127–146. [Google Scholar] [CrossRef]
- Carter, A.J.; Girina, O.; Ramsey, M.S.; Demyanchuk, Y.V. ASTER and field observations of the 24 December 2006 eruption of Bezymianny Volcano, Russia. Remote Sens. Environ. 2008, 112, 2569–2577. [Google Scholar] [CrossRef]
- Van Manen, S.M.; Dehn, J.; Blake, S. Satellite thermal observations of the Bezymianny lava dome 1993–2008: Precursory activity, large explosions, and dome growth. J. Geophys. Res. Solid Earth 2010, 115, 1–20. [Google Scholar] [CrossRef]
- Monitoring of Volcanic Activity in Kamchatka. Available online: http://www.emsd.ru/~ssl/monitoring/main.htm (accessed on 30 September 2017).
- Johnson, J.B.; Lees, J.M.; Gerst, A.; Sahagian, D.; Varley, N. Long-period earthquakes and co-eruptive dome inflation seen with particle image velocimetry. Nature 2008, 456, 377–381. [Google Scholar] [CrossRef]
- Walter, T.R.; Ratdomopurbo, A.; Subandriyo; Aisyah, N.; Brotopuspito, K.S.; Salzer, J.; Lühr, B. Dome growth and coulée spreading controlled by surface morphology, as determined by pixel offsets in photographs of the 2006 Merapi eruption. J. Volcanol. Geotherm. Res. 2013, 261, 121–129. [Google Scholar] [CrossRef]
- Chebrov, V.N.; Droznin, D.V.; Zakharchenko, N.Z.; Melnikov, D.V.; Mishatkin, V.N.; Nuzhdina, I.N. The development of the system of integrated instrumental monitoring of volcanoes in the Far East region. Seism. Instrum. 2013, 49, 254–264. [Google Scholar] [CrossRef]
- Chaussard, E. A low-cost method applicable worldwide for remotely mapping lava dome growth. J. Volcanol. Geotherm. Res. 2017, 341, 33–41. [Google Scholar] [CrossRef]
- Di Traglia, F.; Nolesini, T.; Ciampalini, A.; Solari, L.; Frodella, W.; Bellotti, F. Tracking morphological changes and slope instability using spaceborne and ground-based SAR data. Geomorphology 2018, 300, 95–112. [Google Scholar] [CrossRef]
- Arnold, D.W.D.; Biggs, J.; Wadge, G.; Mothes, P. Remote sensing of environment using satellite radar amplitude imaging for monitoring syn-eruptive changes in surface morphology at an ice-capped stratovolcano. Remote Sens. Environ. 2018, 209, 480–488. [Google Scholar] [CrossRef]
- Arnold, D.W.D.; Biggs, J.; Dietterich, H.R.; Vargas, S.V.; Wadge, G.; Mothes, P. Lava flow morphology at an erupting andesitic stratovolcano: A satellite perspective on El Reventador, Ecuador. J. Volcanol. Geotherm. Res. 2019, 372, 34–47. [Google Scholar] [CrossRef]
- Mittermayer, J.; Wollstadt, S.; Prats-Iraola, P.; Scheiber, R. The TerraSAR-X staring spotlight mode concept. IEEE Trans. Geosci. Remote Sens. 2014, 52, 3695–3706. [Google Scholar] [CrossRef]
- Michel, R.; Avouac, J.-P.; Taboury, J. Measuring ground displacements from SAR amplitude images: Application to the Landers earthquake. Geophys. Res. Lett. 1999, 26, 875–878. [Google Scholar] [CrossRef]
- Werner, C.; Wegmüller, U.; Strozzi, T.; Wiesmann, A. GAMMA SAR and interferometric processing software. In Proceedings of the ERS-ENVISAT Symposium, Gothenburg, Sweden, 16–20 October 2000. [Google Scholar]
- Poland, M.P.; Dzurisin, D.; LaHusen, R.G.; Major, J.J.; Lapcewich, D.; Endo, E.T. Remote camera observations of lava dome growth at Mount St. Helens, Washington, October 2004 to February 2006. US Geol. Surv. Prof. Pap. 2008, 1750, 225–236. [Google Scholar]
- Wang, T.; Jonsson, S. Improved SAR amplitude image offset measurements for deriving three-dimensional coseismic displacements. Sel. Top. Appl. Earth Obs. Remote Sens. 2015, 8, 3271–3278. [Google Scholar] [CrossRef]
- Zimmer, M.; Walter, T.R.; Kujawa, C.; Gaete, A.; Franco-Marin, L. Thermal and gas dynamic investigations at Lastarria volcano, Northern Chile. The influence of precipitation and atmospheric pressure on the fumarole temperature and the gas velocity. J. Volcanol. Geotherm. Res. 2017, 346, 134–140. [Google Scholar] [CrossRef]
- López, T.; Ushakov, S.; Izbekov, P.; Tassi, F.; Cahill, C.; Neill, O.; Werner, C. Constraints on magma processes, subsurface conditions, and total volatile flux at Bezymianny Volcano in 2007–2010 from direct and remote volcanic gas measurements. J. Volcanol. Geotherm. Res. 2013, 263, 92–107. [Google Scholar] [CrossRef]
- Casadevall, T.J.; Rose, W.; Gerlach, T.; Greenland, L.P.; Ewert, J.; Wunderman, R.; Symonds, R. Gas emissions and the eruptions of Mount St. Helens through 1982. Science 1983, 221, 1383–1385. [Google Scholar] [CrossRef]
- Husain, T.; Elsworth, D.; Voight, B.; Mattioli, G.; Jansma, P. Influence of extrusion rate and magma rheology on the growth of lava domes: Insights from particle-dynamics modeling. J. Volcanol. Geotherm. Res. 2014, 285, 100–117. [Google Scholar] [CrossRef]
- Harnett, C.E.; Thomas, M.E.; Purvance, M.D.; Neuberg, J. Using a discrete element approach to model lava dome emplacement and collapse. J. Volcanol. Geotherm. Res. 2018, 359, 68–77. [Google Scholar] [CrossRef]
- Farrell, J.; Karson, J.; Soldati, A. Multiple-generation folding and non-coaxial strain of lava crusts. Bull. Volcanol. 2018, 80, 84. [Google Scholar] [CrossRef]
- Anderson, S.W.; Stofan, E.R.; Plaut, J.J.; Crown, D.A. Block size distributions on silicic lava flow surfaces: Implications for emplacement conditions. Geol. Soc. Am. Bull. 1998, 110, 1258–1267. [Google Scholar] [CrossRef]
- Rincón, M.; Márquez, A.; Herrera, R. Contrasting catastrophic eruptions predicted by different intrusion and collapse scenarios. Sci. Rep. 2018, 8, 6178. [Google Scholar] [CrossRef] [PubMed] [Green Version]
- Melnik, O.; Sparks, R.S.J. Nonlinear dynamics of lava dome extrusion. Nature 1999, 402, 37–41. [Google Scholar] [CrossRef]
- Matthews, S.J.; Gardeweg, M.C.; Sparks, R.S.J. The 1984 to 1996 cyclic activity of Lascar Volcano, northern Chile: Cycles of dome growth, dome subsidence, degassing and explosive eruptions. Bull. Volcanol. 1997, 59, 72–82. [Google Scholar] [CrossRef]
- Varley, N.R.; Arámbula-Mendoza, R.; Reyes-Dávila, G.; Stevenson, J.; Harwood, R. Long-period seismicity during magma movement at Volcán de Colima. Bull. Volcanol. 2010, 72, 1093–1107. [Google Scholar] [CrossRef]
- Pinel, V.; Jaupart, C. Magma chamber behavior beneath a volcanic edifice. J. Geophys. Res. 2003, 108, 1–17. [Google Scholar] [CrossRef]
- Westaway, R.M.; Lane, S.N.; Hicks, D.M. The development of an automated correction procedure for digital photogrammetry for the study of wide, shallow, gravel-bed rivers. Earth Surf. Process. Landf. 2000, 25, 209–226. [Google Scholar] [CrossRef]
- Durand, V.; Mangeney, A.; Haas, F.; Jia, X.; Bonilla, F.; Peltier, A. On the link between external forcings and slope instabilities in the Piton de la Fournaise Summit Crater, Reunion Island. J. Geophys. Res. Earth Surf. 2018, 123, 2422–2442. [Google Scholar] [CrossRef]
- Brasington, J.; Rumsby, B.T.; McVey, R.A. Monitoring and modelling morphological change in a braided gravel-bed river using high resolution GPS-based survey. Earth Surf. Process. Landf. 2000, 25, 973–990. [Google Scholar] [CrossRef]
- Lane, S.N.; Westaway, R.M.; Hicks, D.M. Estimation of erosion and deposition volumes in a large, gravel-bed, braided river using synoptic remote sensing. Earth Surf. Process. Landf. 2003, 28, 249–271. [Google Scholar] [CrossRef]
- Bennett, G.L.; Molnar, P.; Eisenbeiss, H.; Mcardell, B.W. Erosional power in the Swiss Alps: Characterization of slope failure in the Illgraben. Earth Surf. Process. Landf. 2012, 37, 1627–1640. [Google Scholar] [CrossRef]


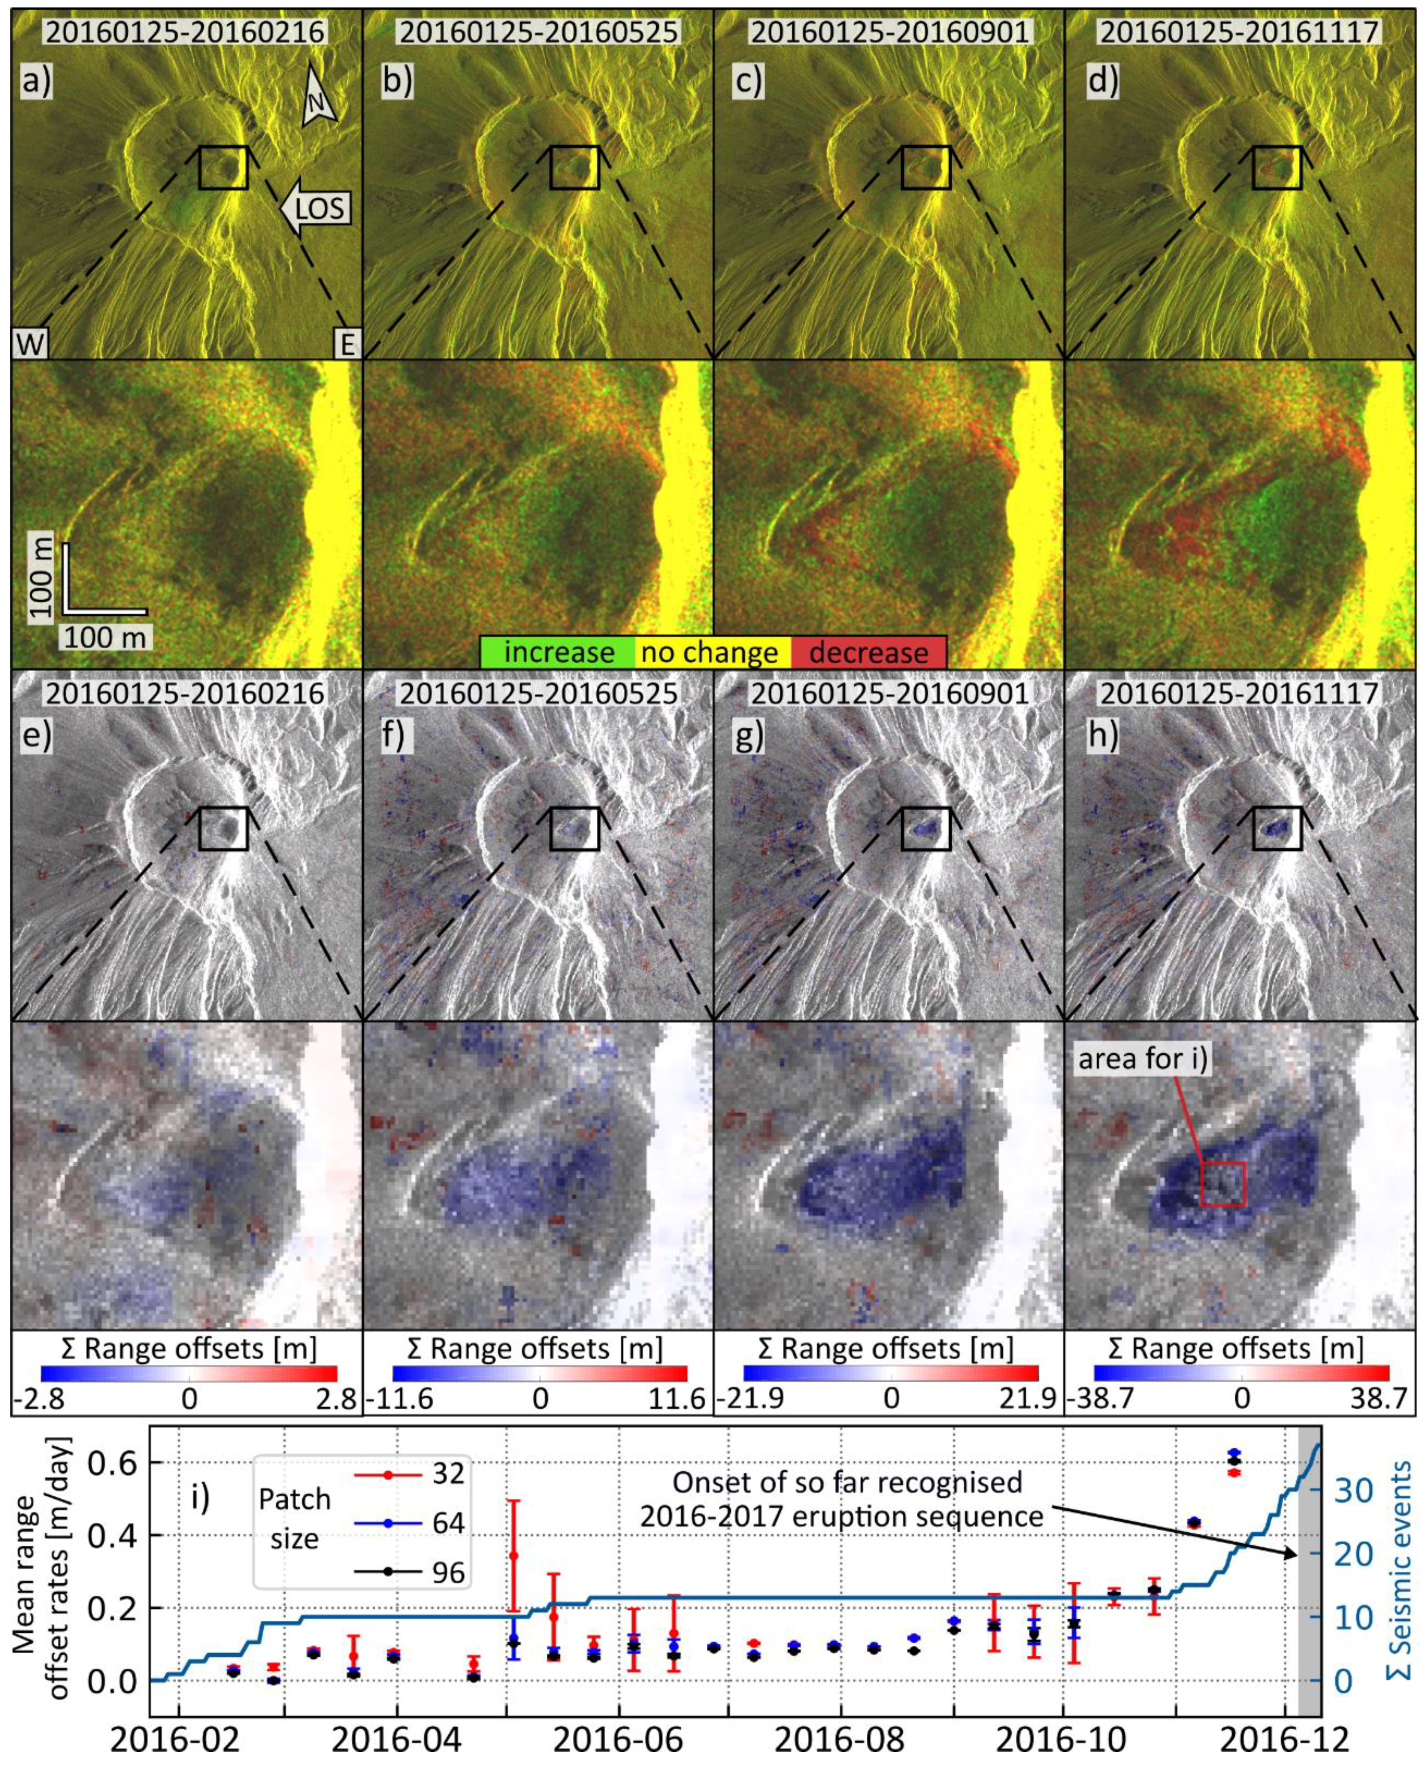
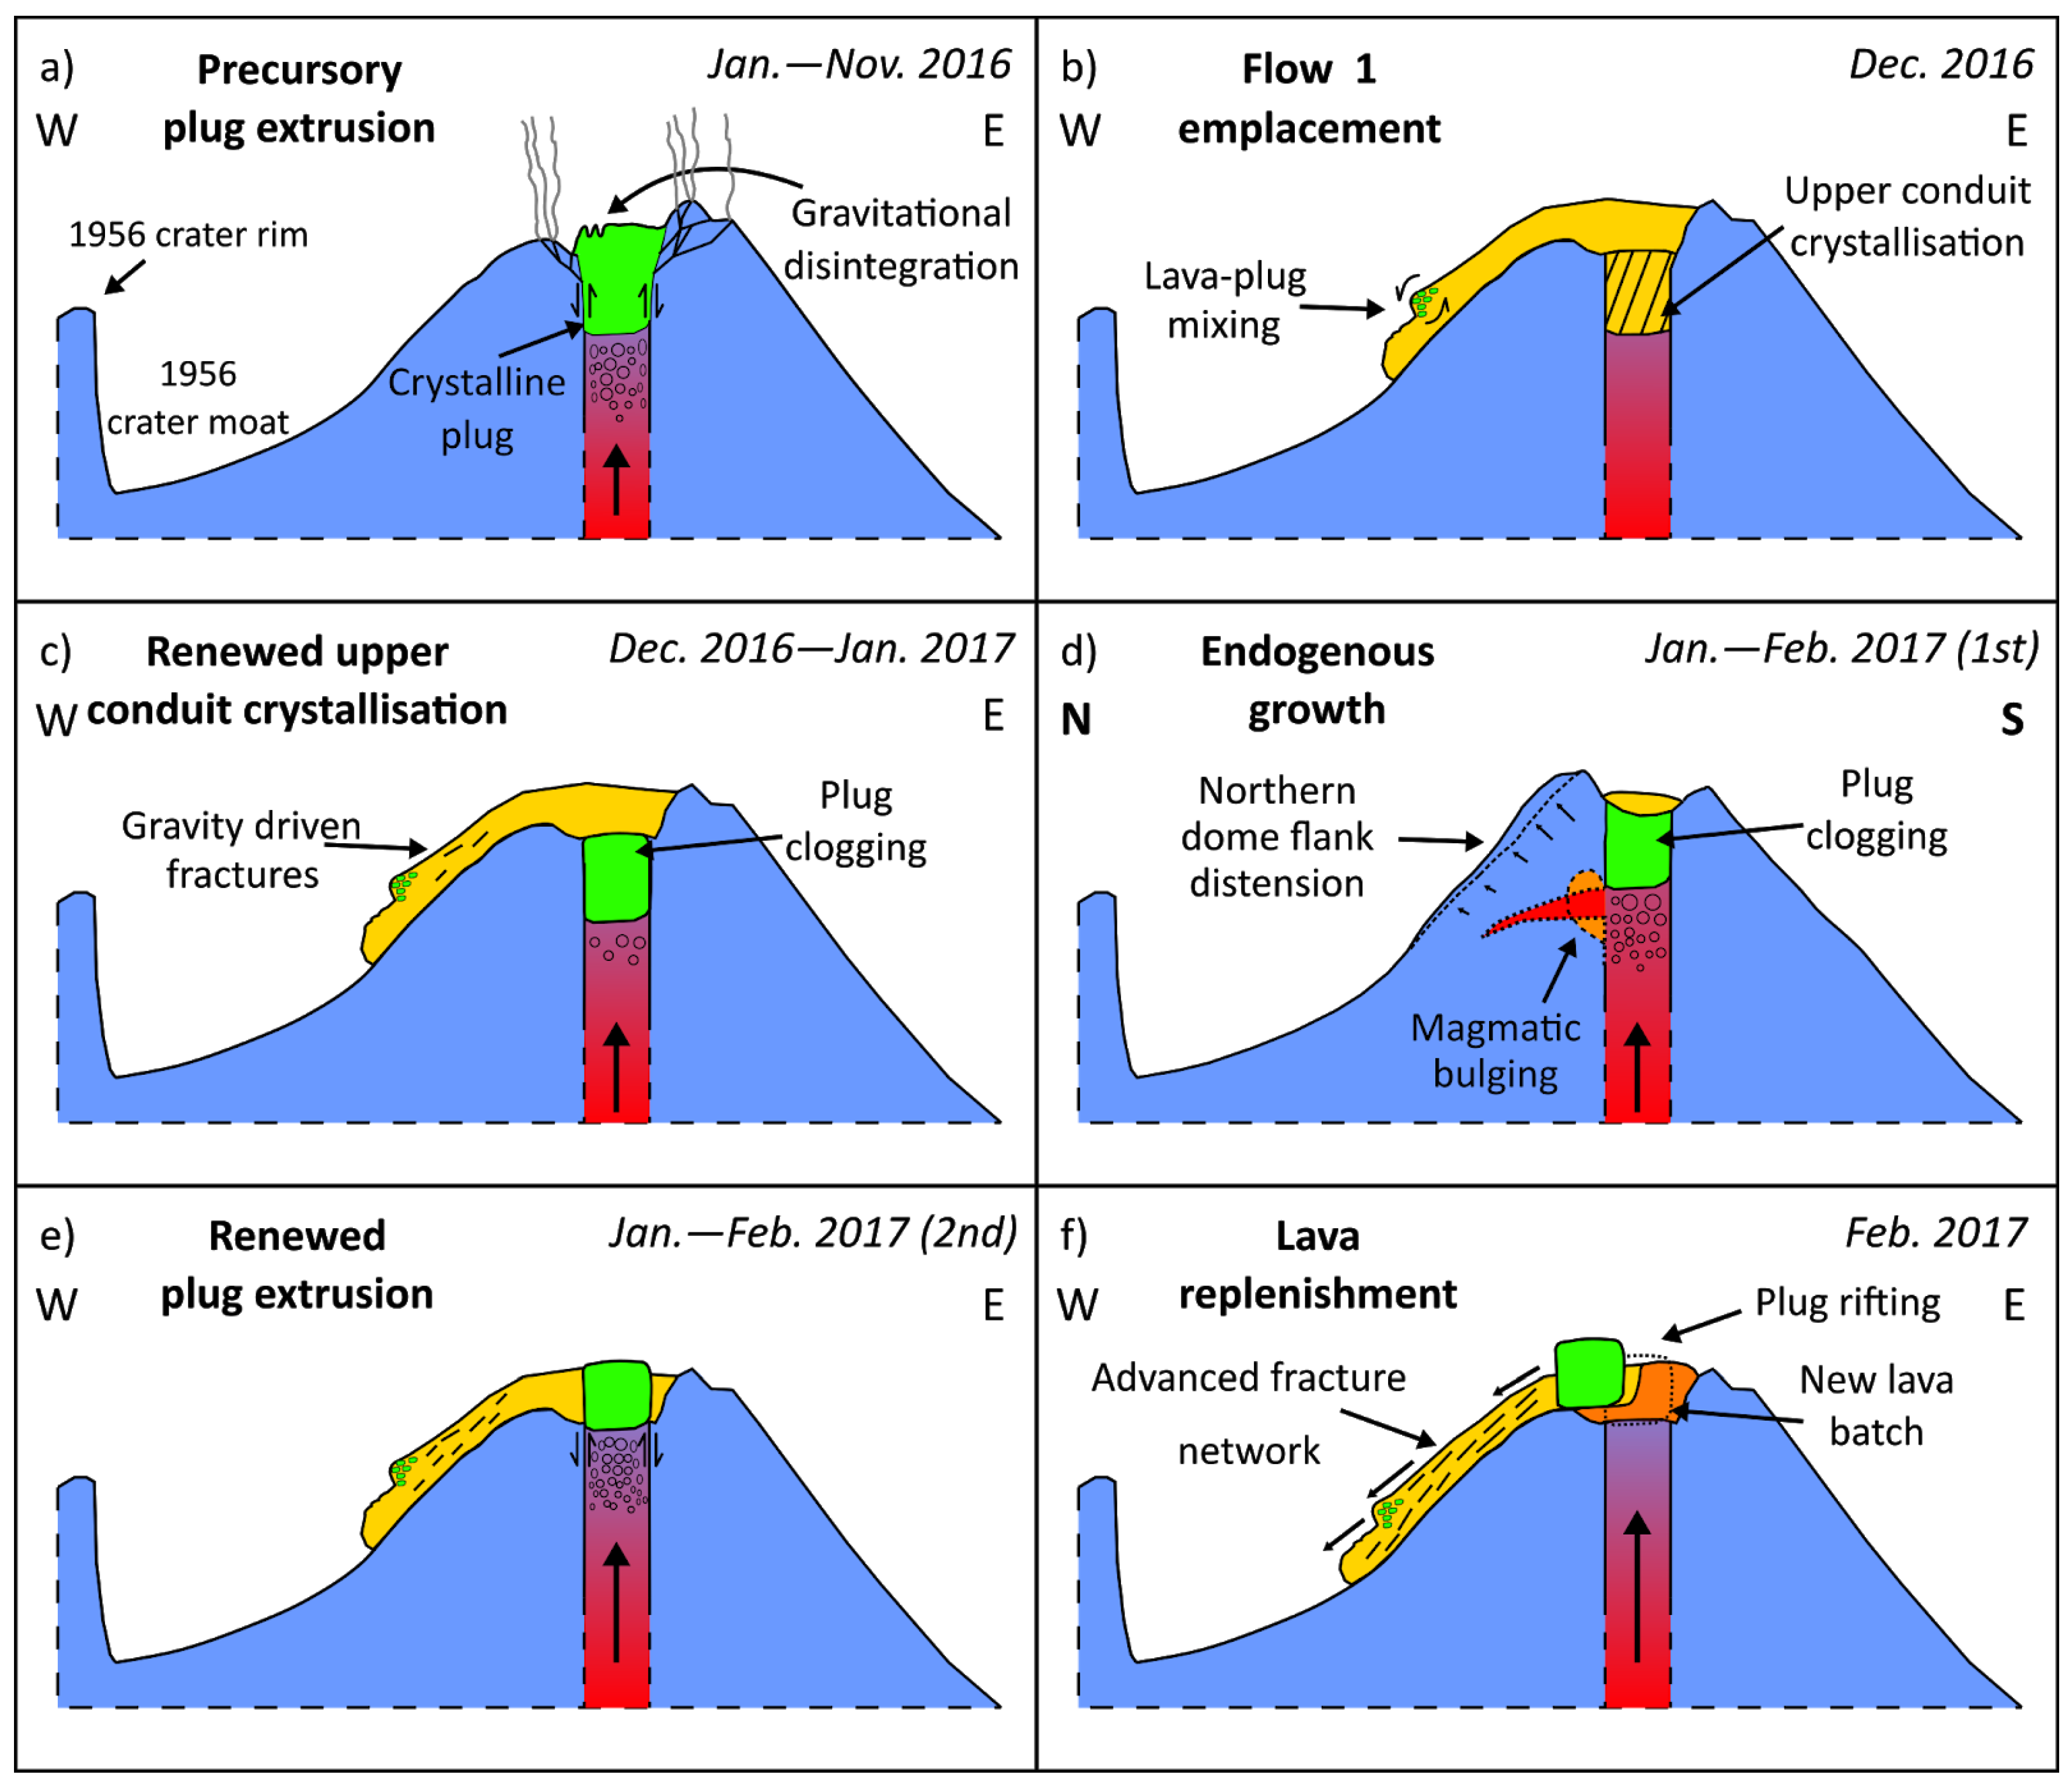
| Observation period | Description |
|---|---|
| January–April 2016 | Discontinuous plug extrusion (ra-rates: 0–0.08 m d−1) |
| Weak seismicity between (January and March 2016) | |
| May–August 2016 | Near constant plug extrusion (ra-rate: 0.07–0.13 m d−1) |
| Brief seismicity in May 2016 | |
| Intermittent (apparent) translucent degassing at Bezymianny | |
| Klyuchevskoy active (steaming) | |
| July 2016: onset of tensile crack formation at eastern summit rim | |
| September 2016 | Faster plug extrusion (ra-rate: 0.15 m d−1) |
| Klyuchevskoy active (steaming) | |
| Onset of plug disintegration at the western portion | |
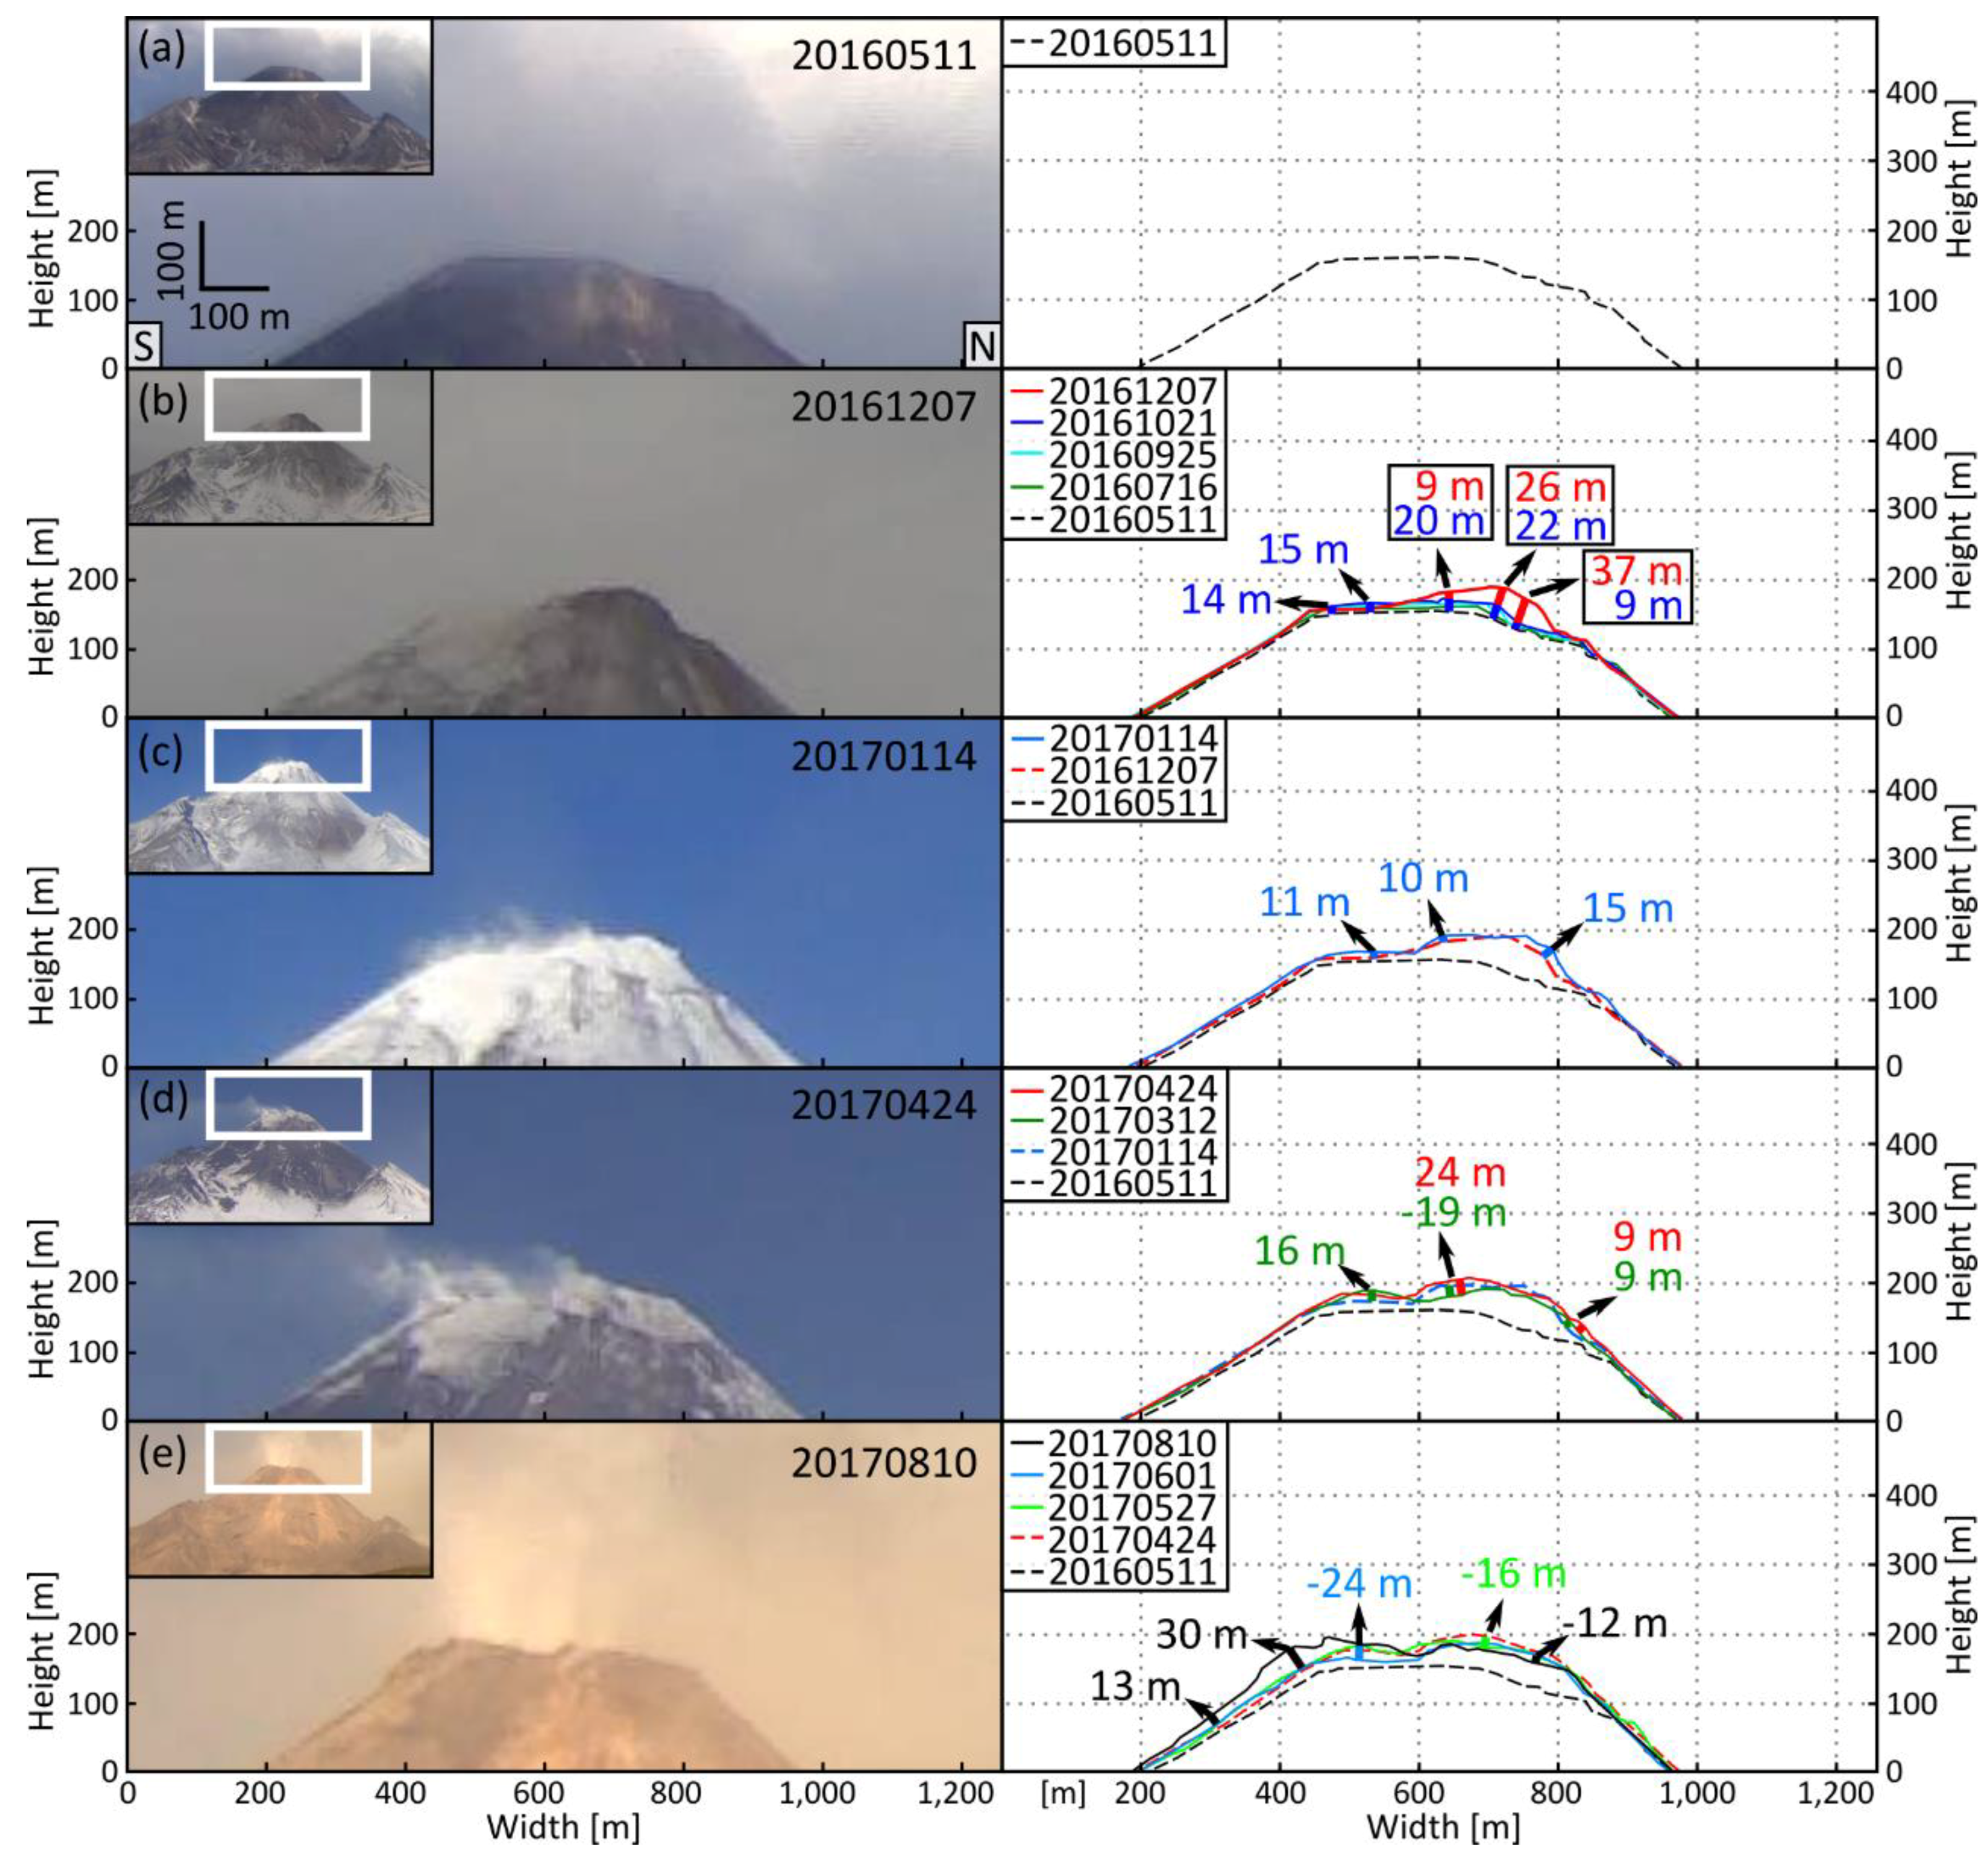
| October 2016 | Onset of eastern summit uplift (9–22 m in Mimatsu diagram) |
| Increased plug extrusion rates (ra-rate: 0.24 m d−1) | |
| Further widening of tensile cracks | |
| November–beginning of December 2016 | Accelerated plug extrusion (ra-rate: 0.43–0.63 m d−1) |
| Onset of continuous seismicity | |
| Substantial widening of summit rim tensile cracks | |
| Strong disintegration of precursory plug | |
| Significant summit uplift (9–37 m in Mimatsu diagram) | |
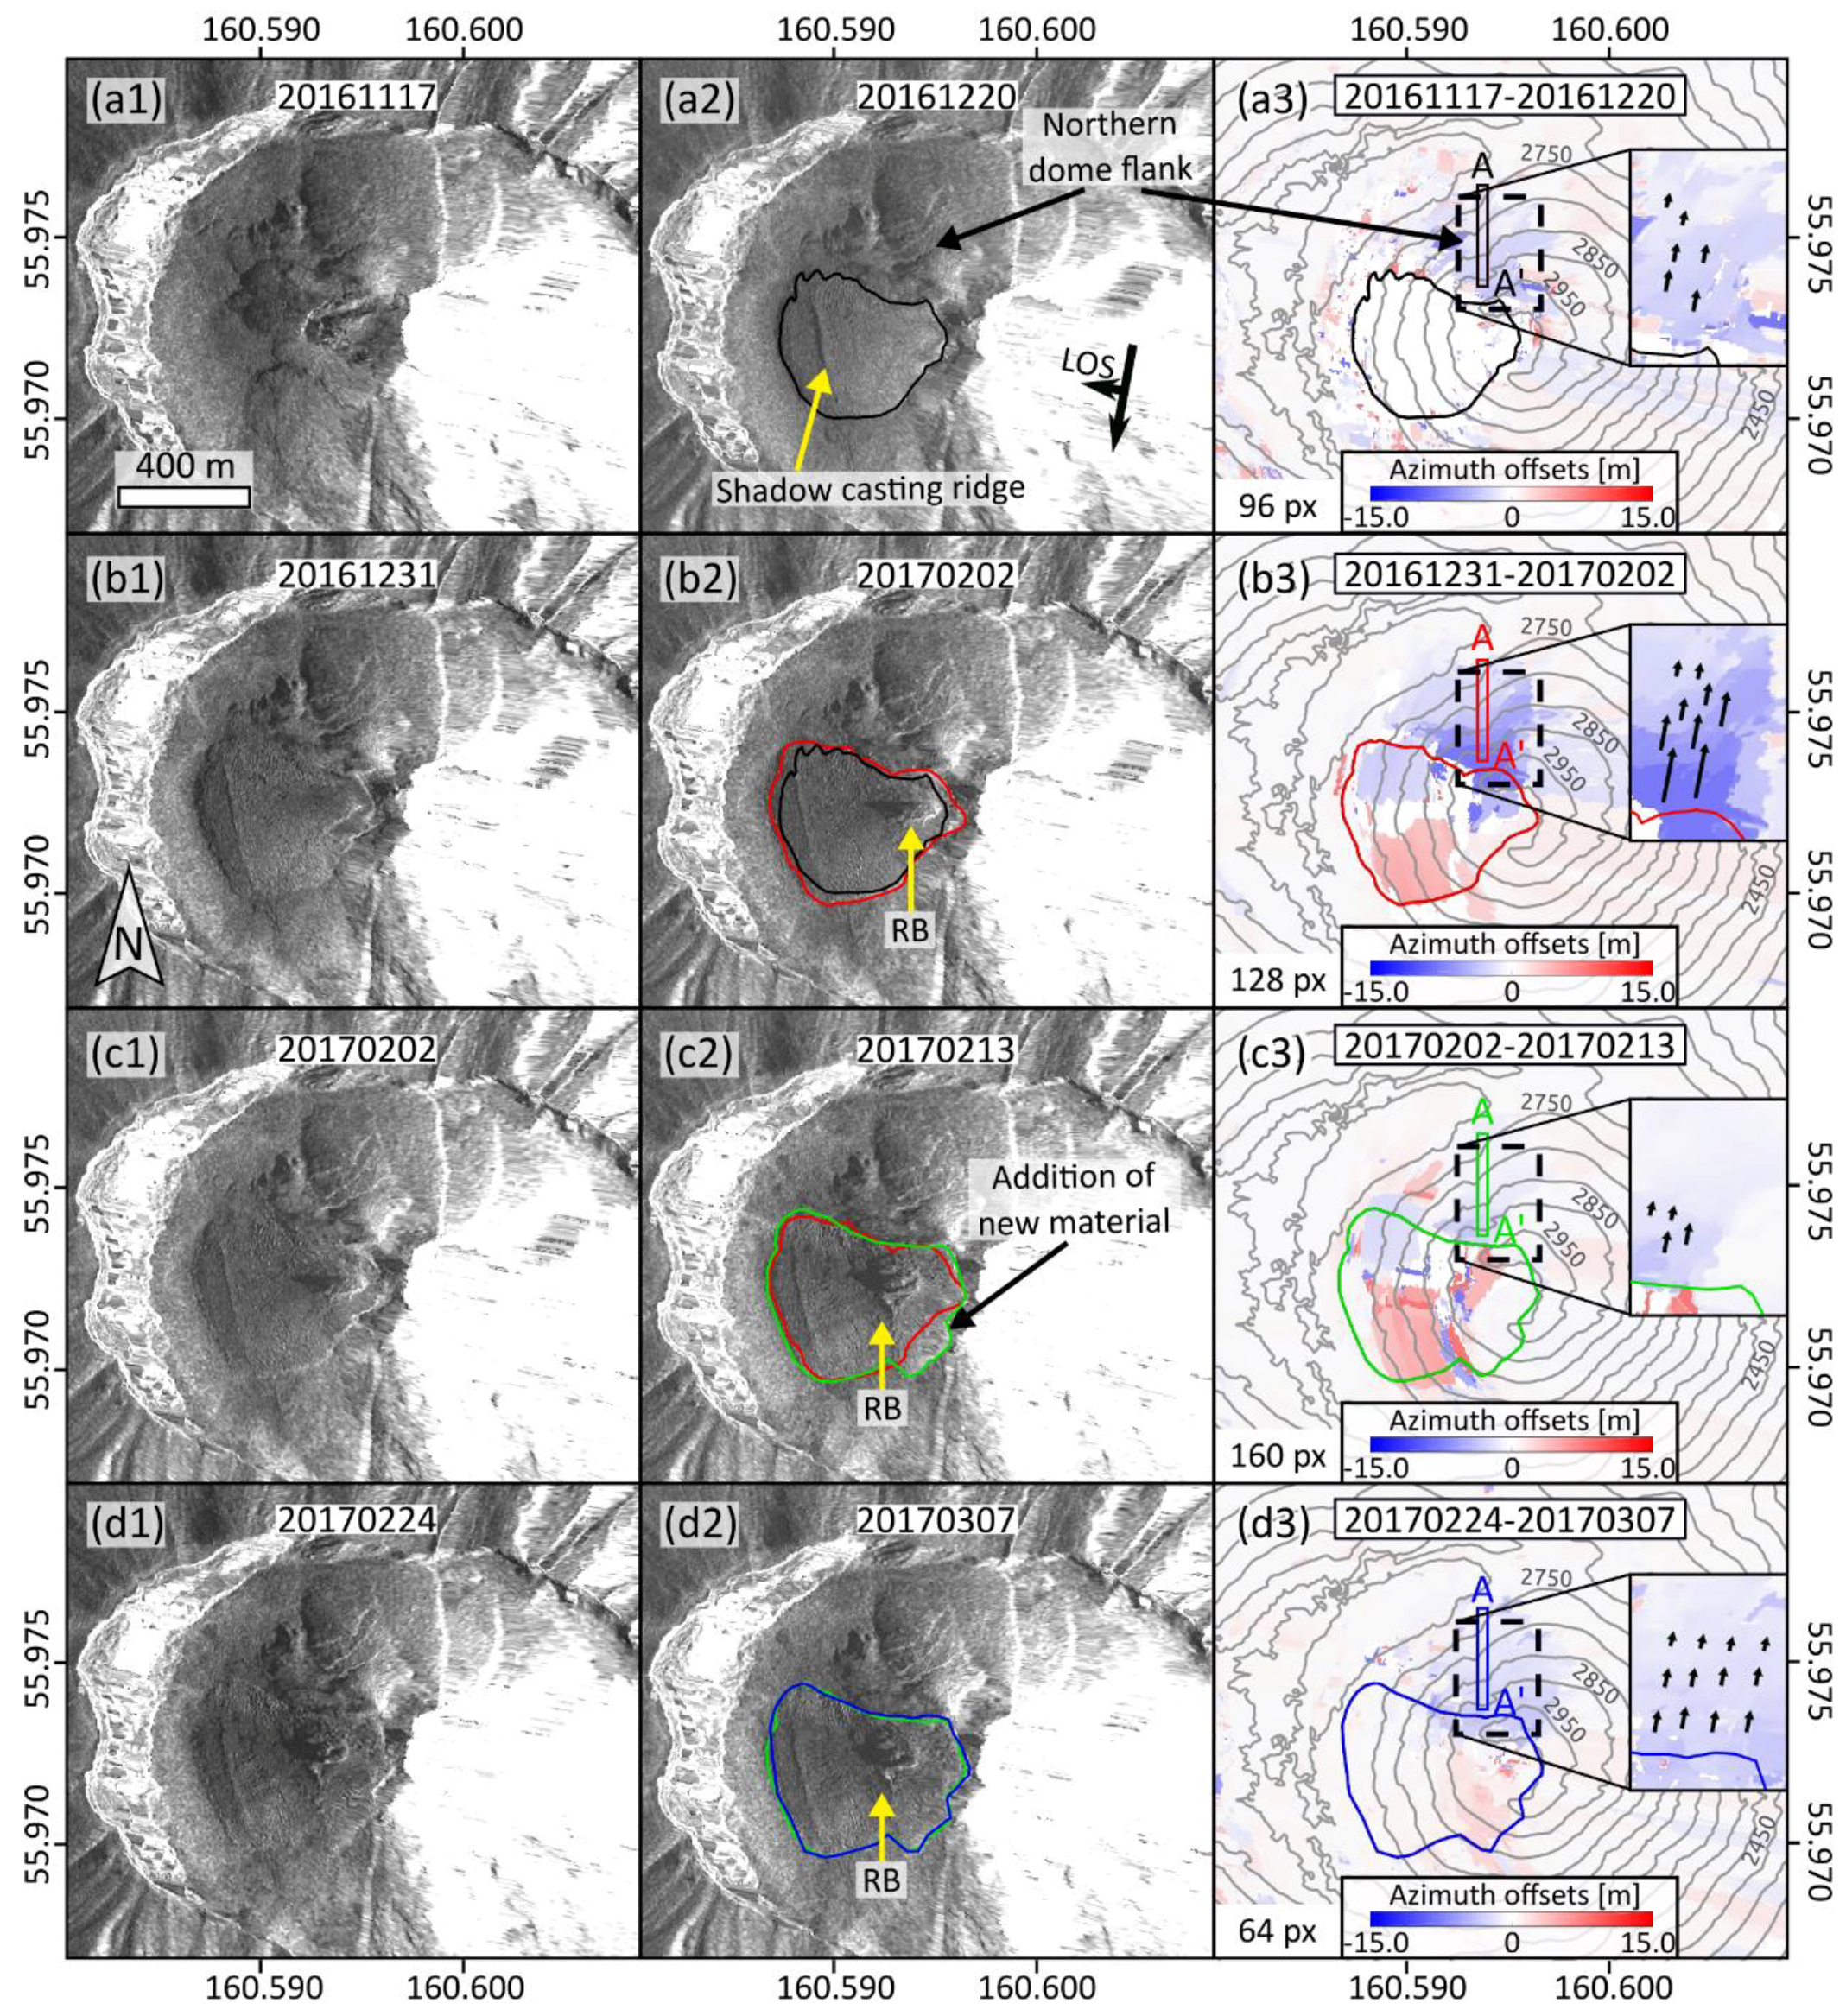
| December 2016 | Persistently increasing seismicity |
| Inelastic bulging of northern composite dome (17 November–20 December 2016; az-rate: 0.05–0.1 m d−1) related to magmatic fluid intrusion | |
| Az-rates of 1st flank bulging increased towards the summit | |
| Bulging occurred likely prior to emplacement of flow 1 (SAR-scene: 20 December 2016) | |
| Flow perpendicular shadow-casting ridge interpreted as compressional fold due to lava-plug mixing | |
| End of December 2016–beginning of February 2017 | Minor destruction of previously determined summit uplift in Mimatsu diagram |
| Inferred upper conduit solidification (formation of plug 2) that clogged the vent | |
| Inelastic bulging of northern carapace (31 December 2016–2 February 2017; az-rate: ~0.1–0.6 m d−1) related to magmatic fluid intrusion | |
| Az-rates of 2nd flank bulging increased towards the summit | |
| Substantial increase of seismicity during second half of January 2017 | |
| Extrusion of plug 2 | |
| Intrusion and plug 2 extrusion possibly related to enhanced seismicity | |
| Mid of February–beginning of March 2017 | Repeated inelastic bulging of northern carapace (2–13 February 2017; az-rate: ~0.1–0.3 m d−1) related to magmatic fluid intrusion |
| Lava replenishment at summit that pushed plug 2 westwards | |
| Repeated inelastic bulging of northern carapace (24 February–7 March 2017; az-rate: ~0.1–0.4 m d−1) related to magmatic fluid intrusion | |
| Az-rates of the 3rd and 4th bulging events increased towards the summit | |
| Strongly enhanced seismic activity | |
| Inferred upper conduit crystallisation by end of February and beginning of March 2017 | |
| March 2017 | Significant increase in seismic activity |
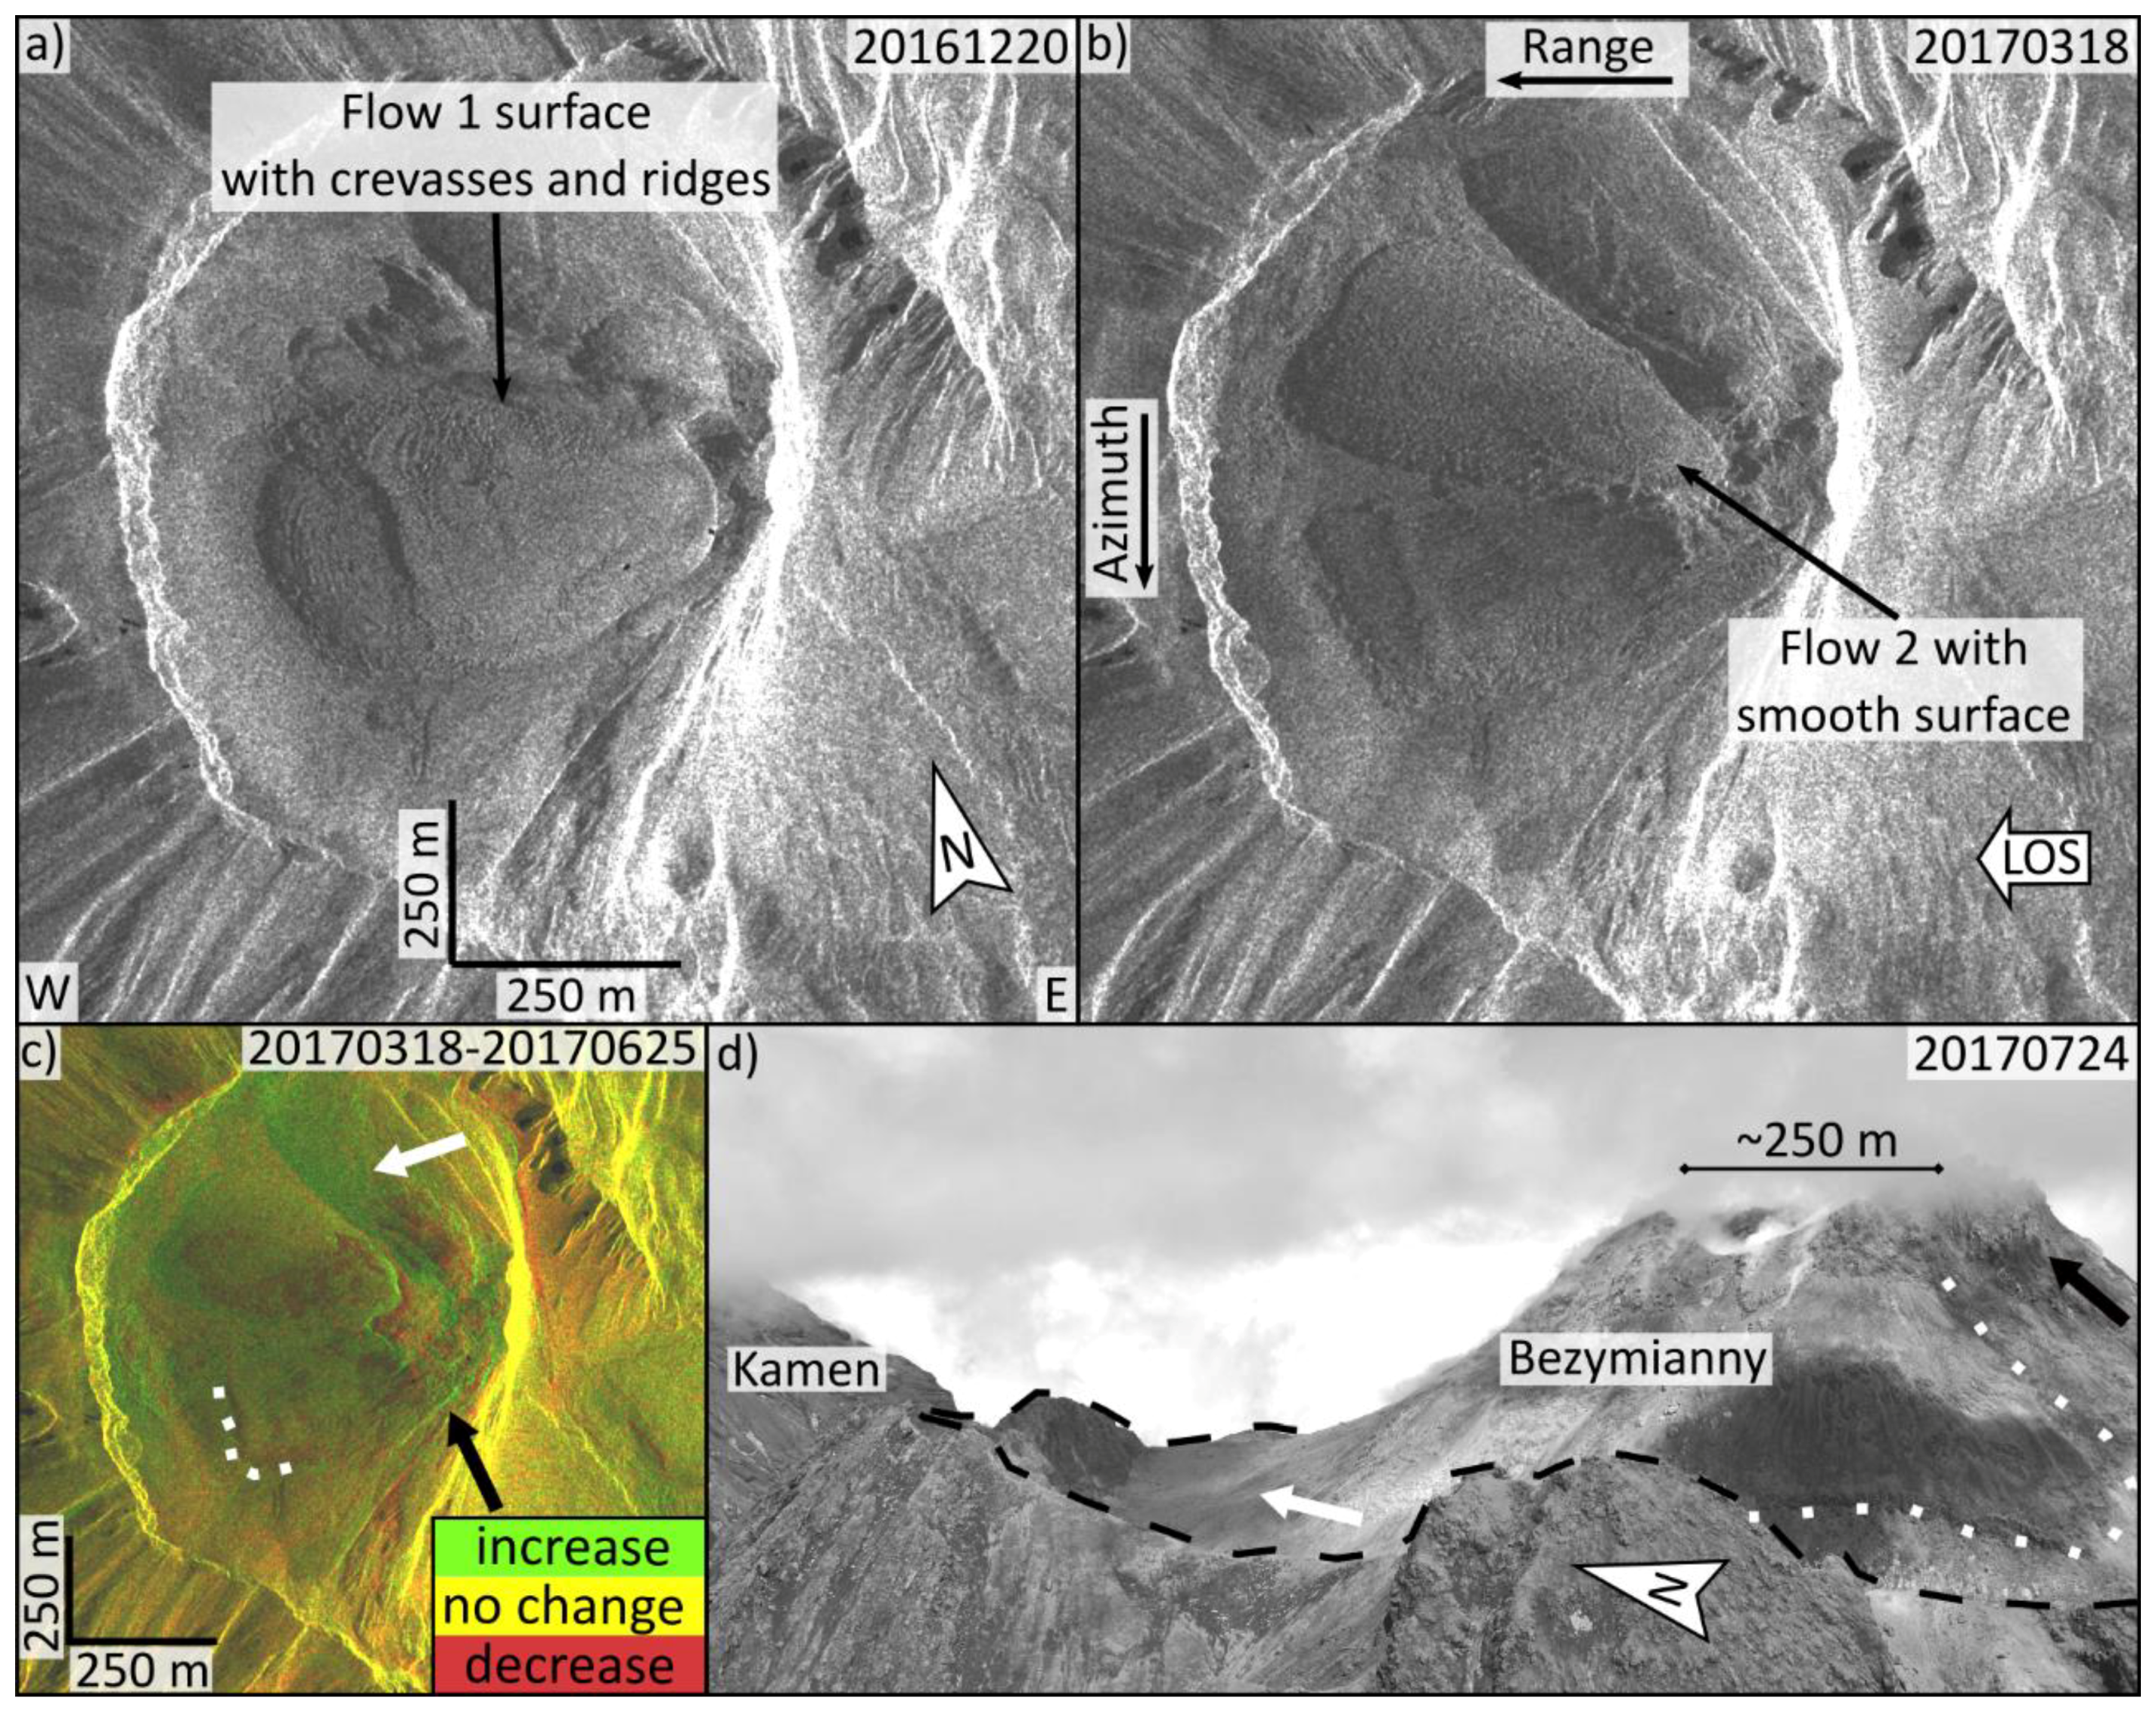
| Explosive eruption on 9 March 2017 | |
| Emplacement of flow 2 (SAR-scene: 18 March 2017) | |
| Smooth reflectivity characteristics of flow 2 due to thorough degassing in reservoir | |
| June 2017 | Strongest explosive eruption on 16 June 2017 depicted by solely deposition of pyroclastic deposits |
| Summit bulge significantly destroyed, appearance of new extrusive body at southern summit | |
| Southern summit crater extrusion (up to 30 m in Mimatsu diagram) not clearly resolved in SAR data |
© 2019 by the authors. Licensee MDPI, Basel, Switzerland. This article is an open access article distributed under the terms and conditions of the Creative Commons Attribution (CC BY) license (http://creativecommons.org/licenses/by/4.0/).
Share and Cite
Mania, R.; Walter, T.R.; Belousova, M.; Belousov, A.; Senyukov, S.L. Deformations and Morphology Changes Associated with the 2016–2017 Eruption Sequence at Bezymianny Volcano, Kamchatka. Remote Sens. 2019, 11, 1278. https://doi.org/10.3390/rs11111278
Mania R, Walter TR, Belousova M, Belousov A, Senyukov SL. Deformations and Morphology Changes Associated with the 2016–2017 Eruption Sequence at Bezymianny Volcano, Kamchatka. Remote Sensing. 2019; 11(11):1278. https://doi.org/10.3390/rs11111278
Chicago/Turabian StyleMania, René, Thomas R. Walter, Marina Belousova, Alexander Belousov, and Sergey L. Senyukov. 2019. "Deformations and Morphology Changes Associated with the 2016–2017 Eruption Sequence at Bezymianny Volcano, Kamchatka" Remote Sensing 11, no. 11: 1278. https://doi.org/10.3390/rs11111278