Monitoring of the 2015 Villarrica Volcano Eruption by Means of DLR’s Experimental TET-1 Satellite

 , ,
, ,
Abstract
:
1. Introduction
1.1. Villarrica Volcano
1.2. Satellite-Based Thermal Remote Sensing of Volcanoes
2. Materials and Methods
2.1. Satellite Data
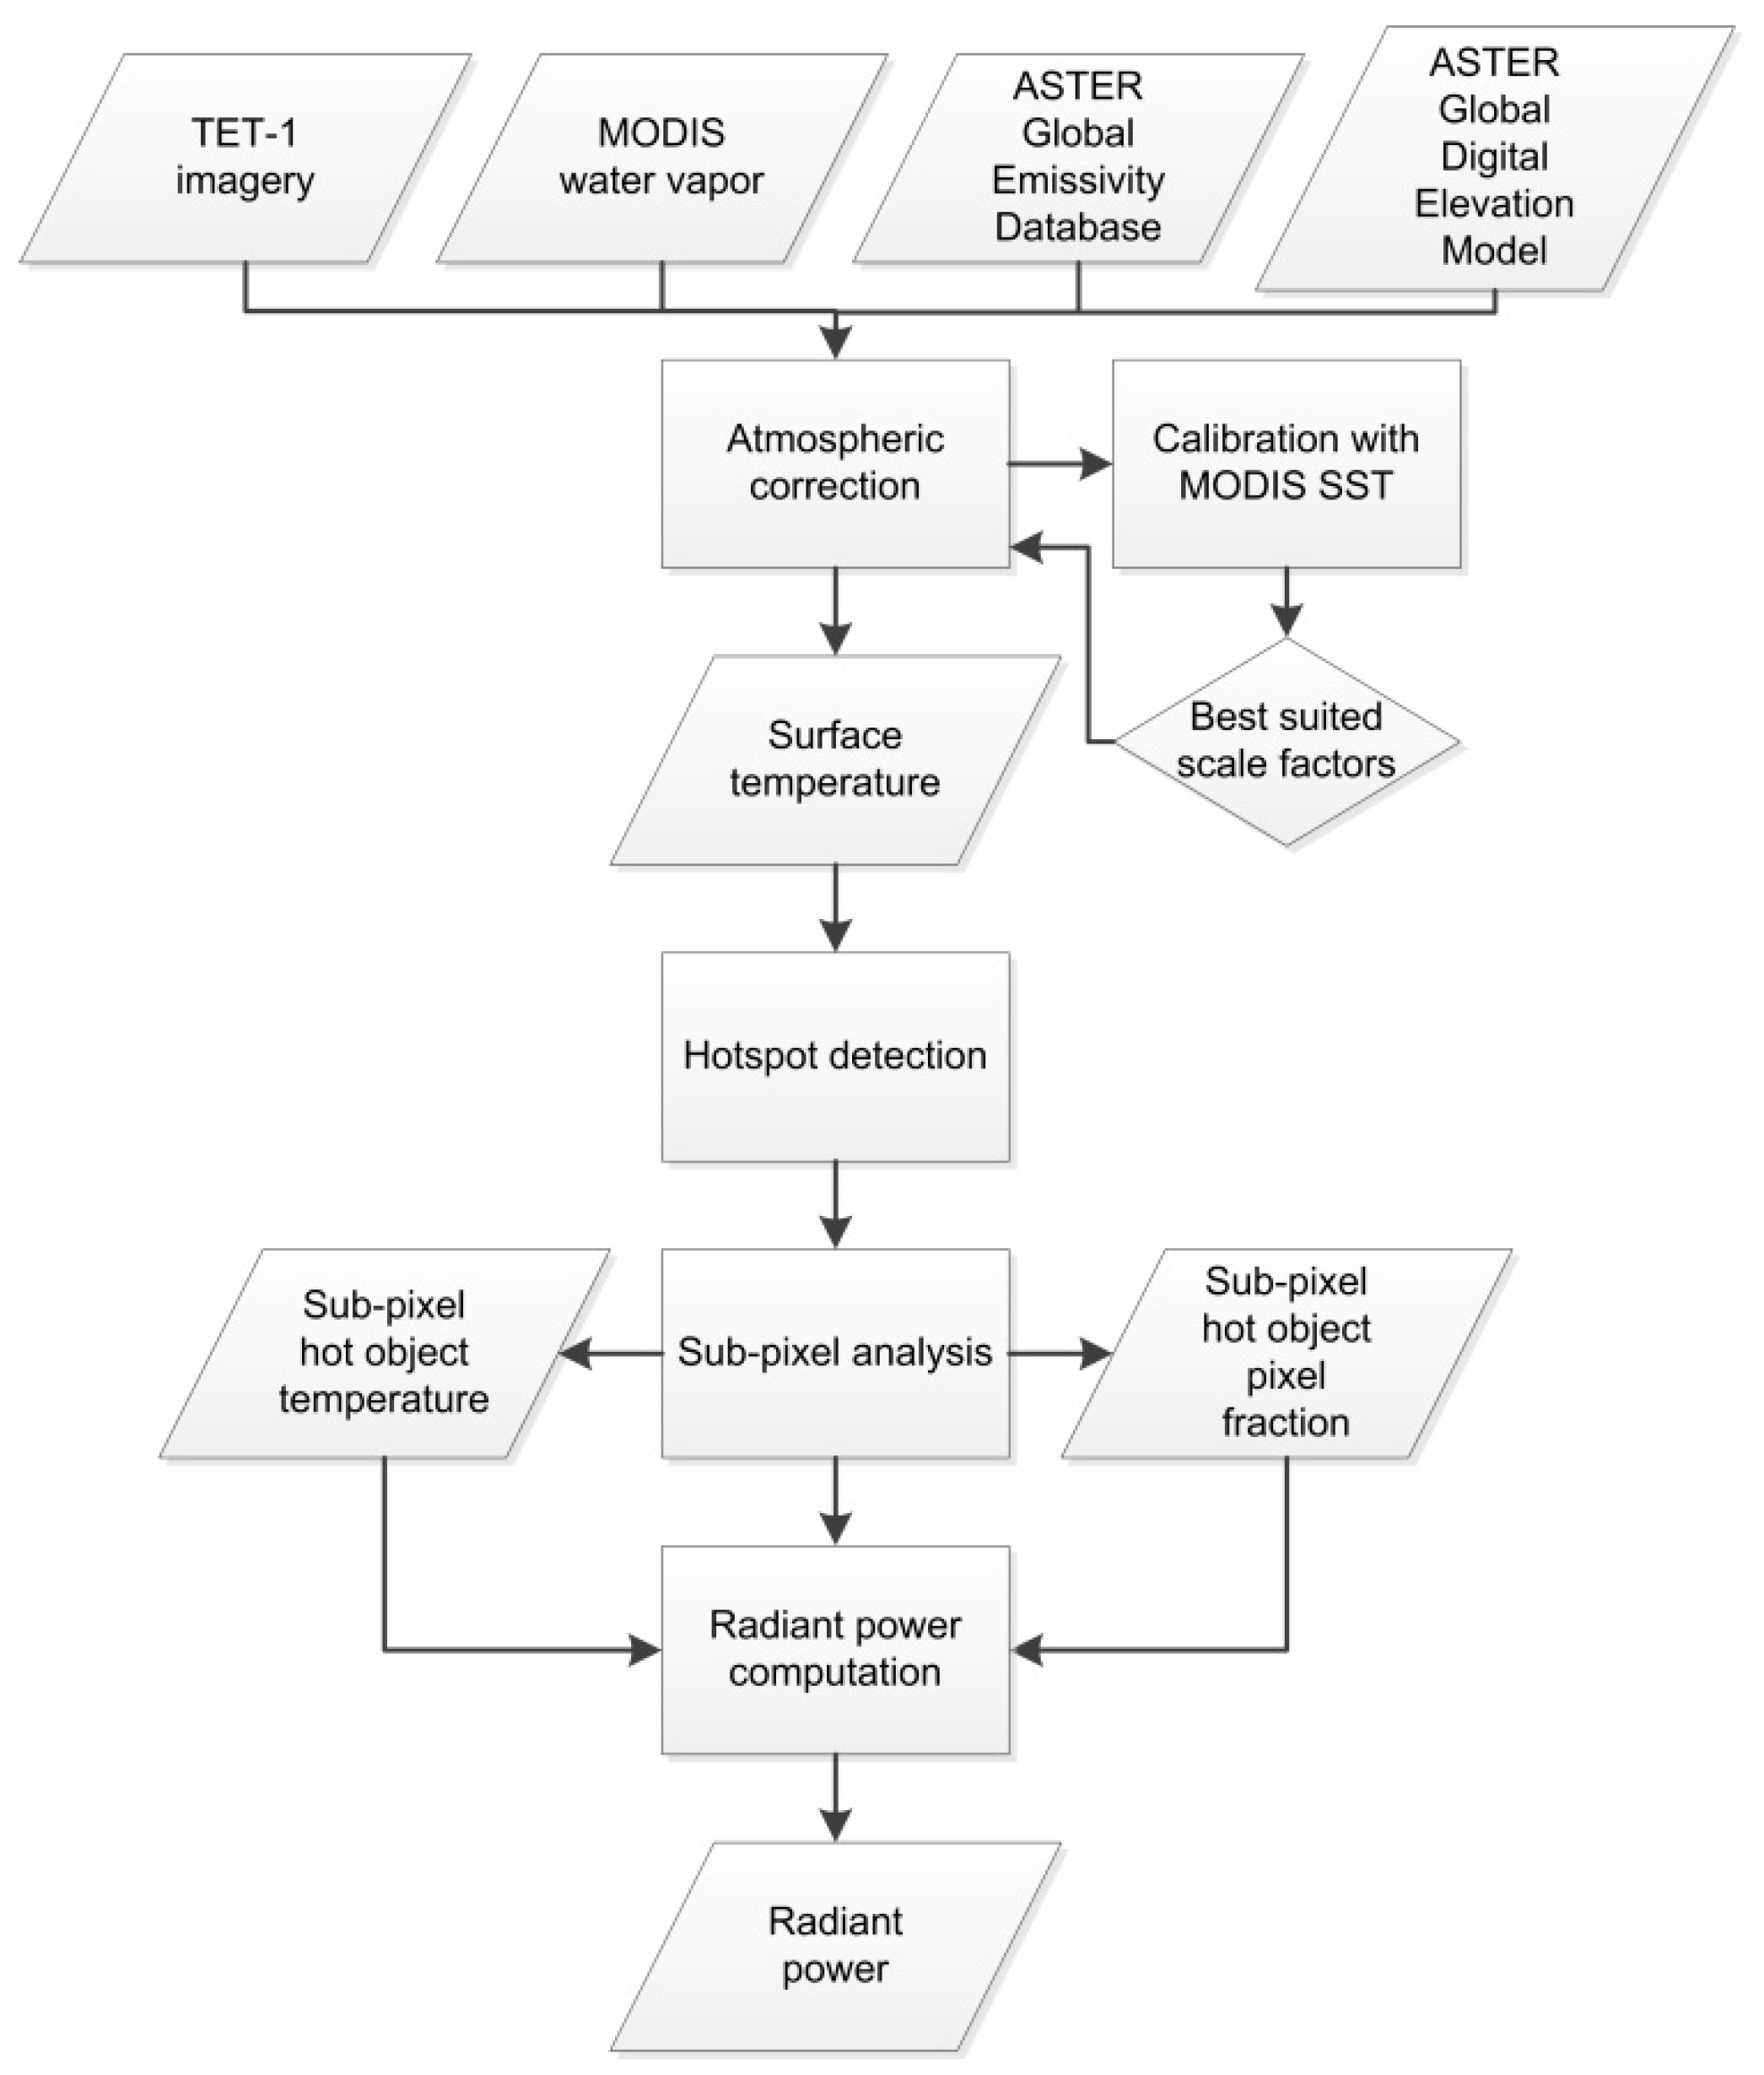
2.2. Methods
2.2.1. Atmospheric Correction of TET-1 Thermal Imagery
2.2.2. Calibration by means of MODIS Sea Surface Temperature
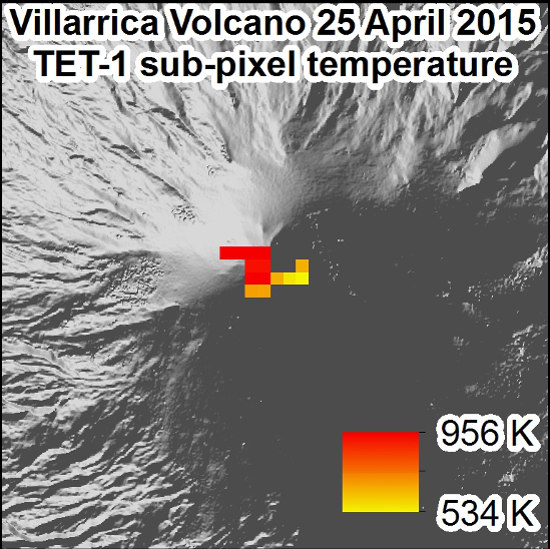
2.2.3. Hotspot Detection and Subpixel Analysis
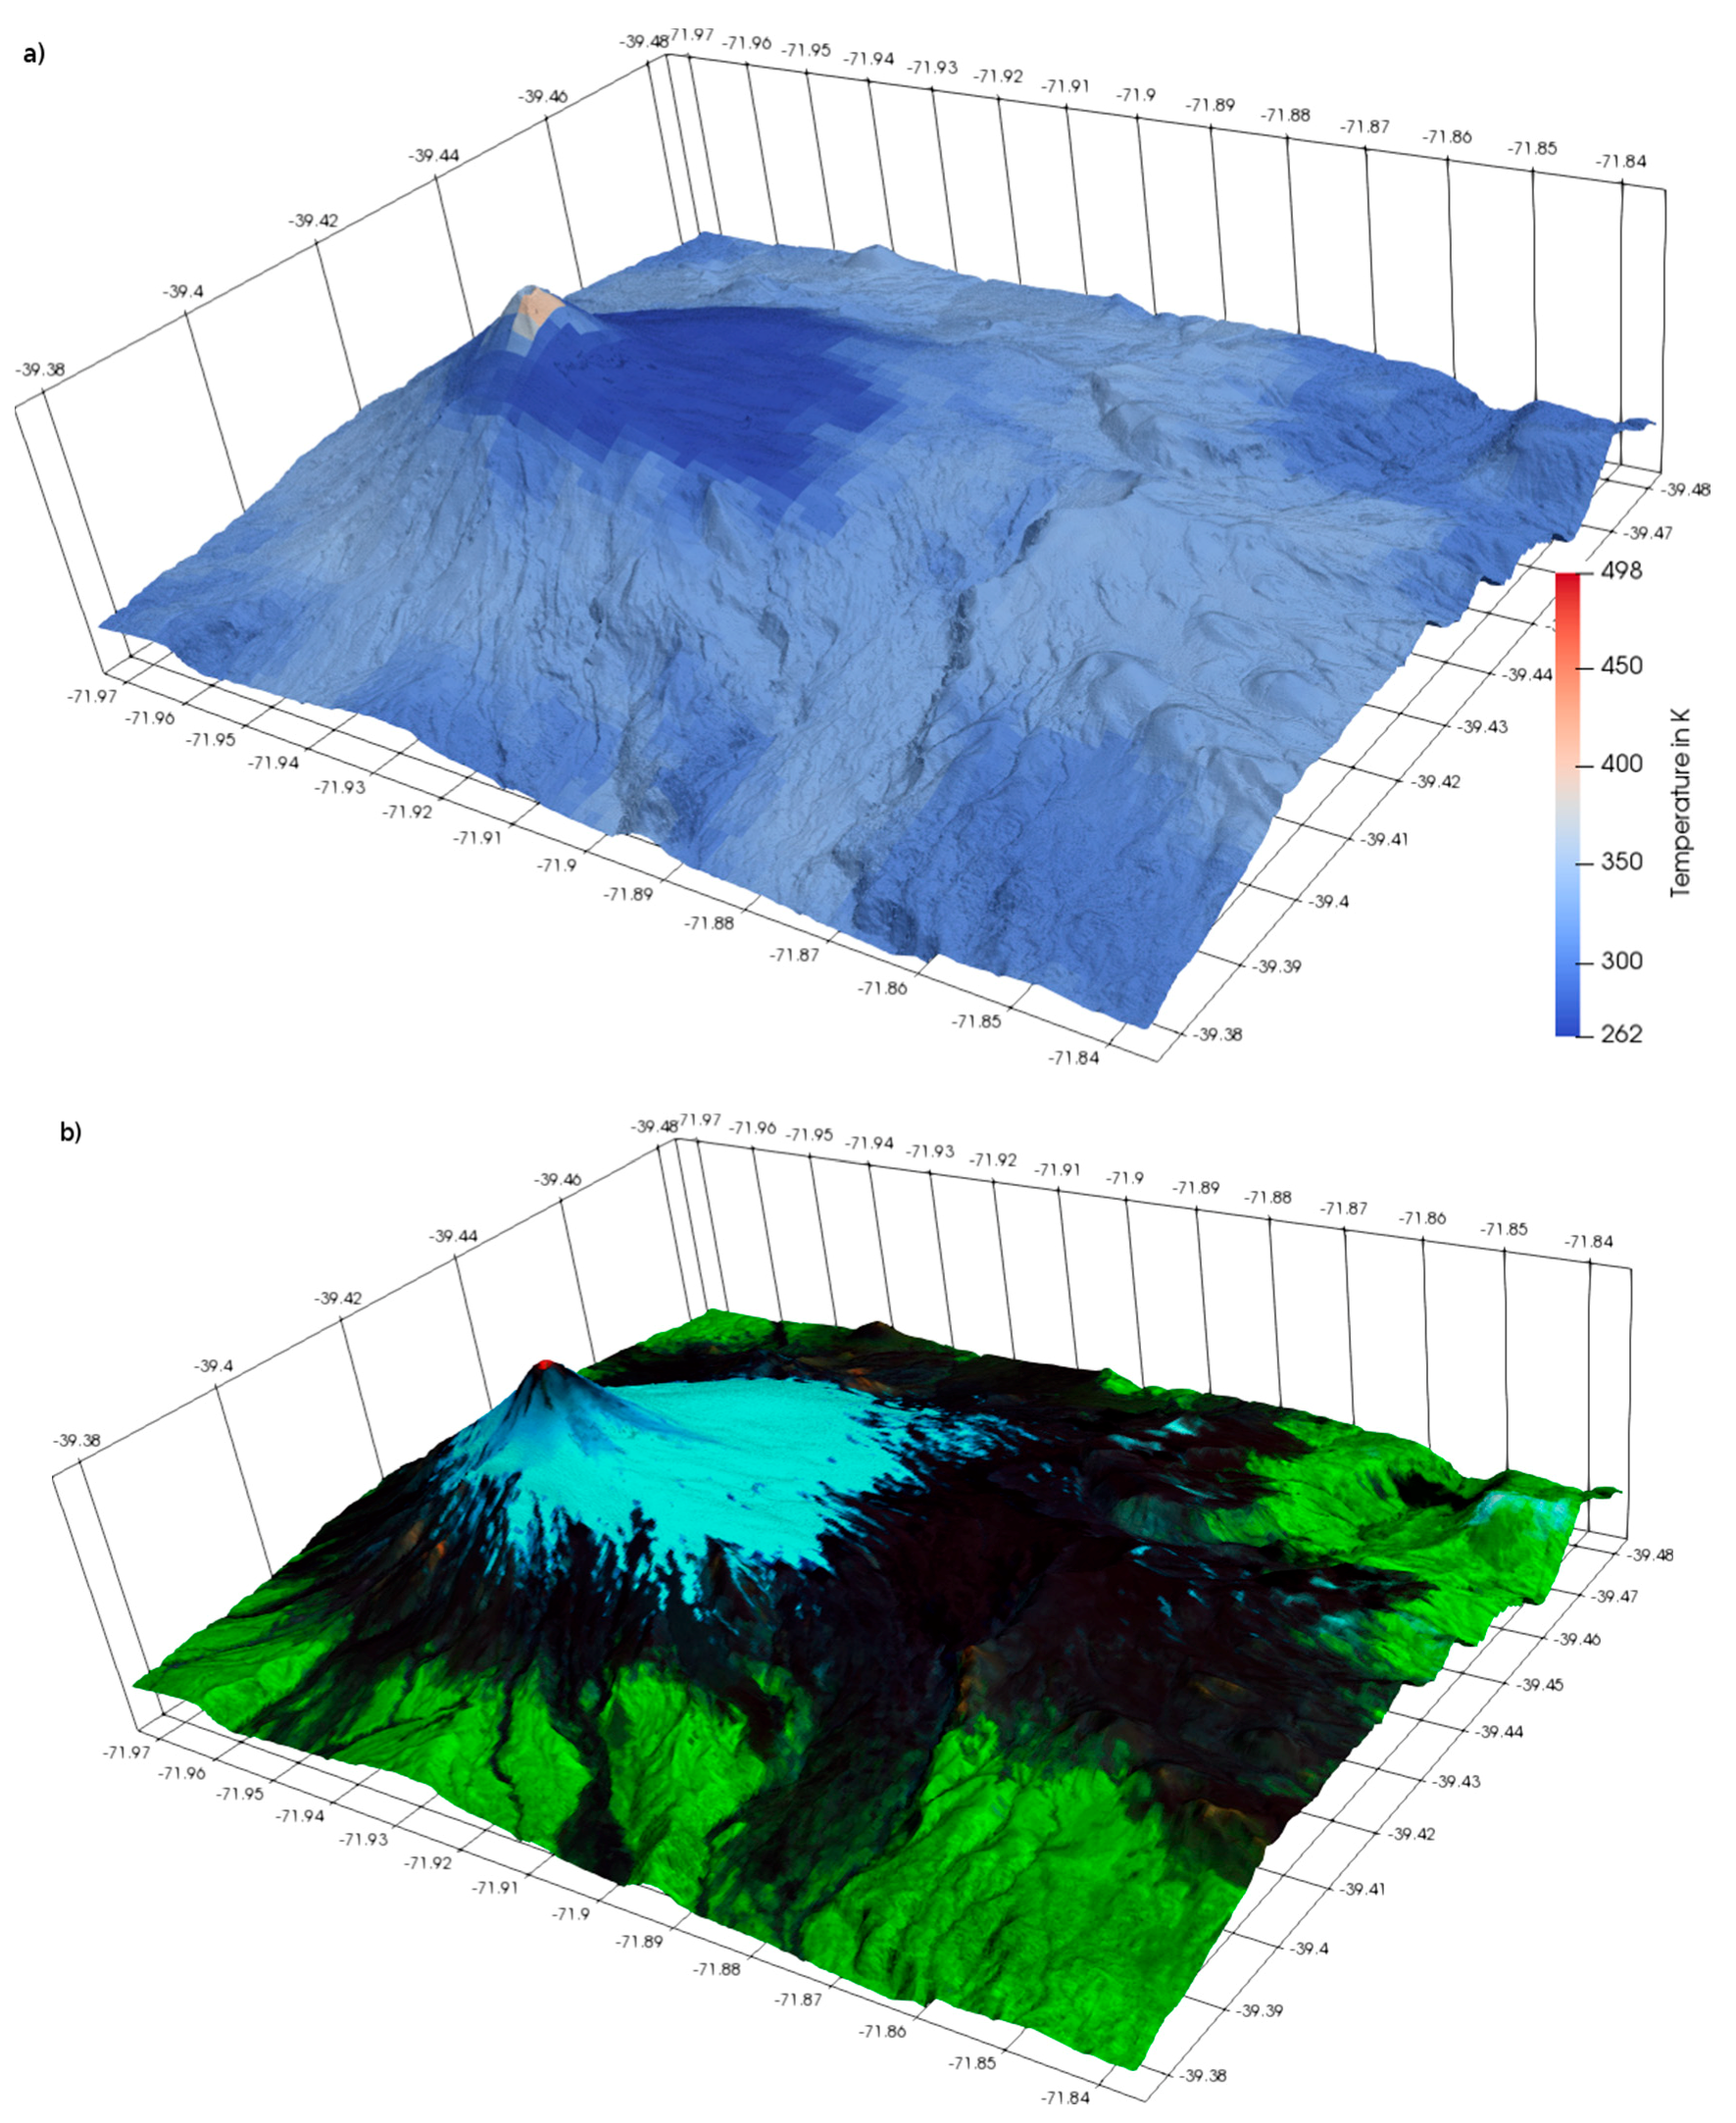
2.2.4. Detection of Surface Changes
3. Results
3.1. Optimal Scale Factors
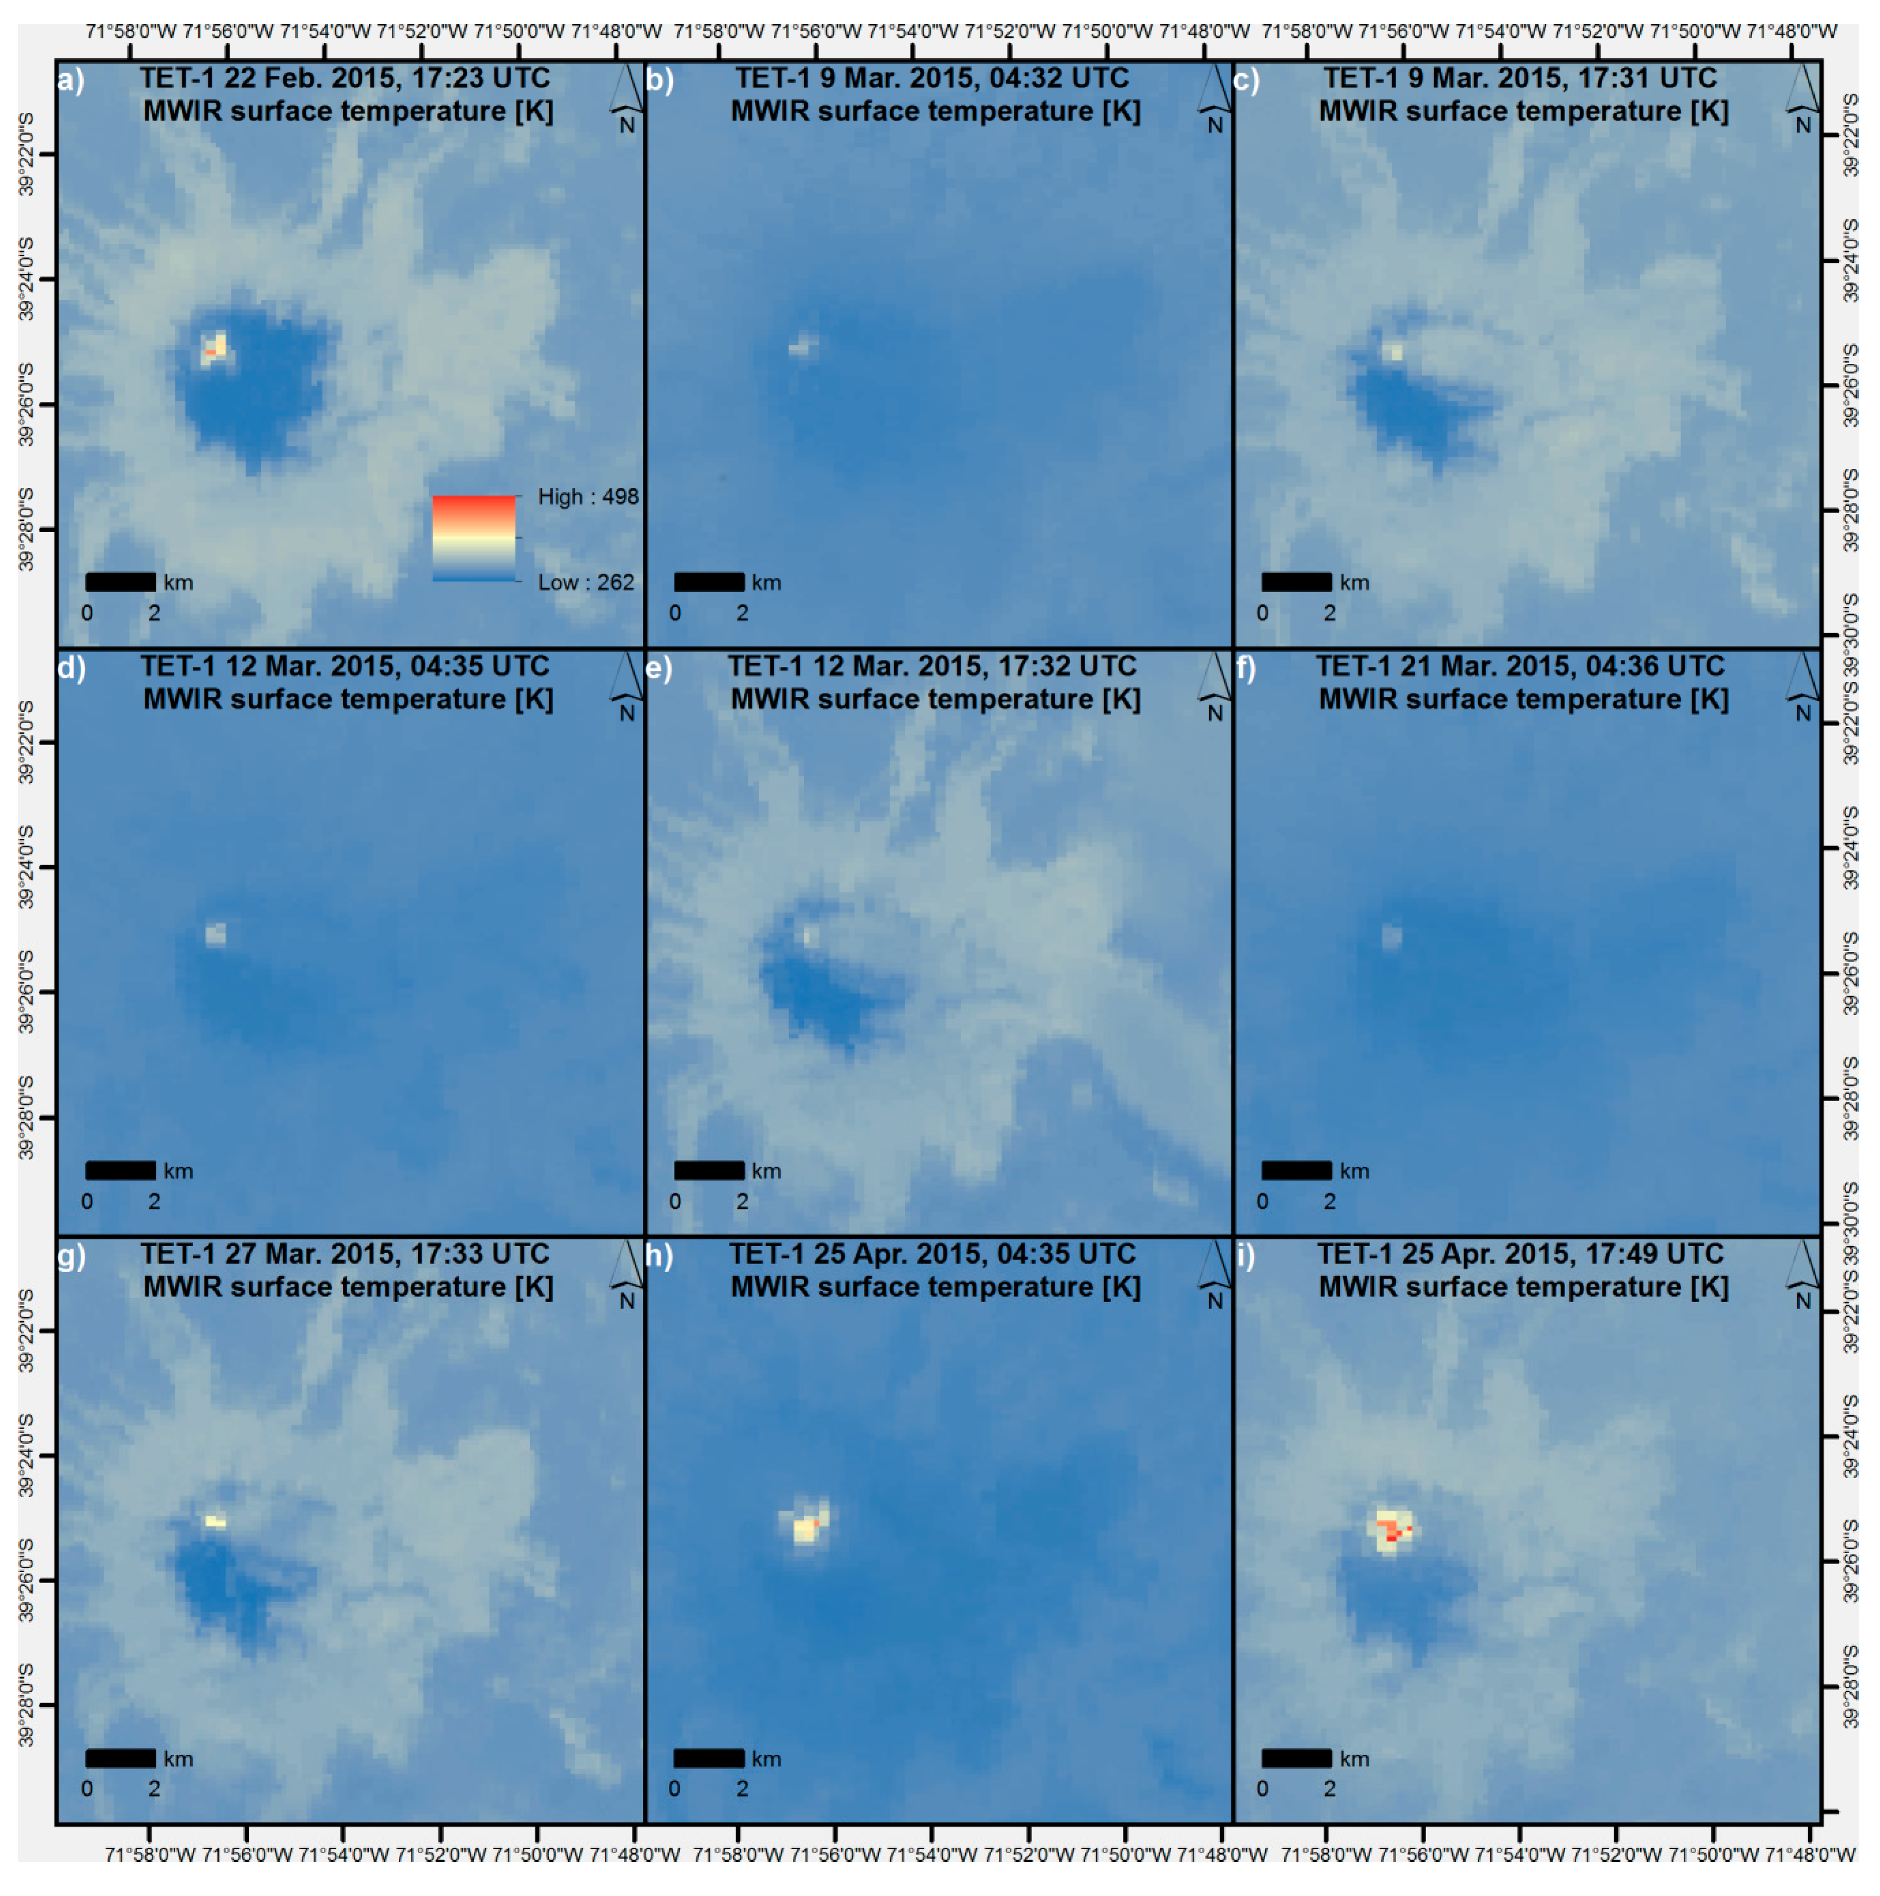
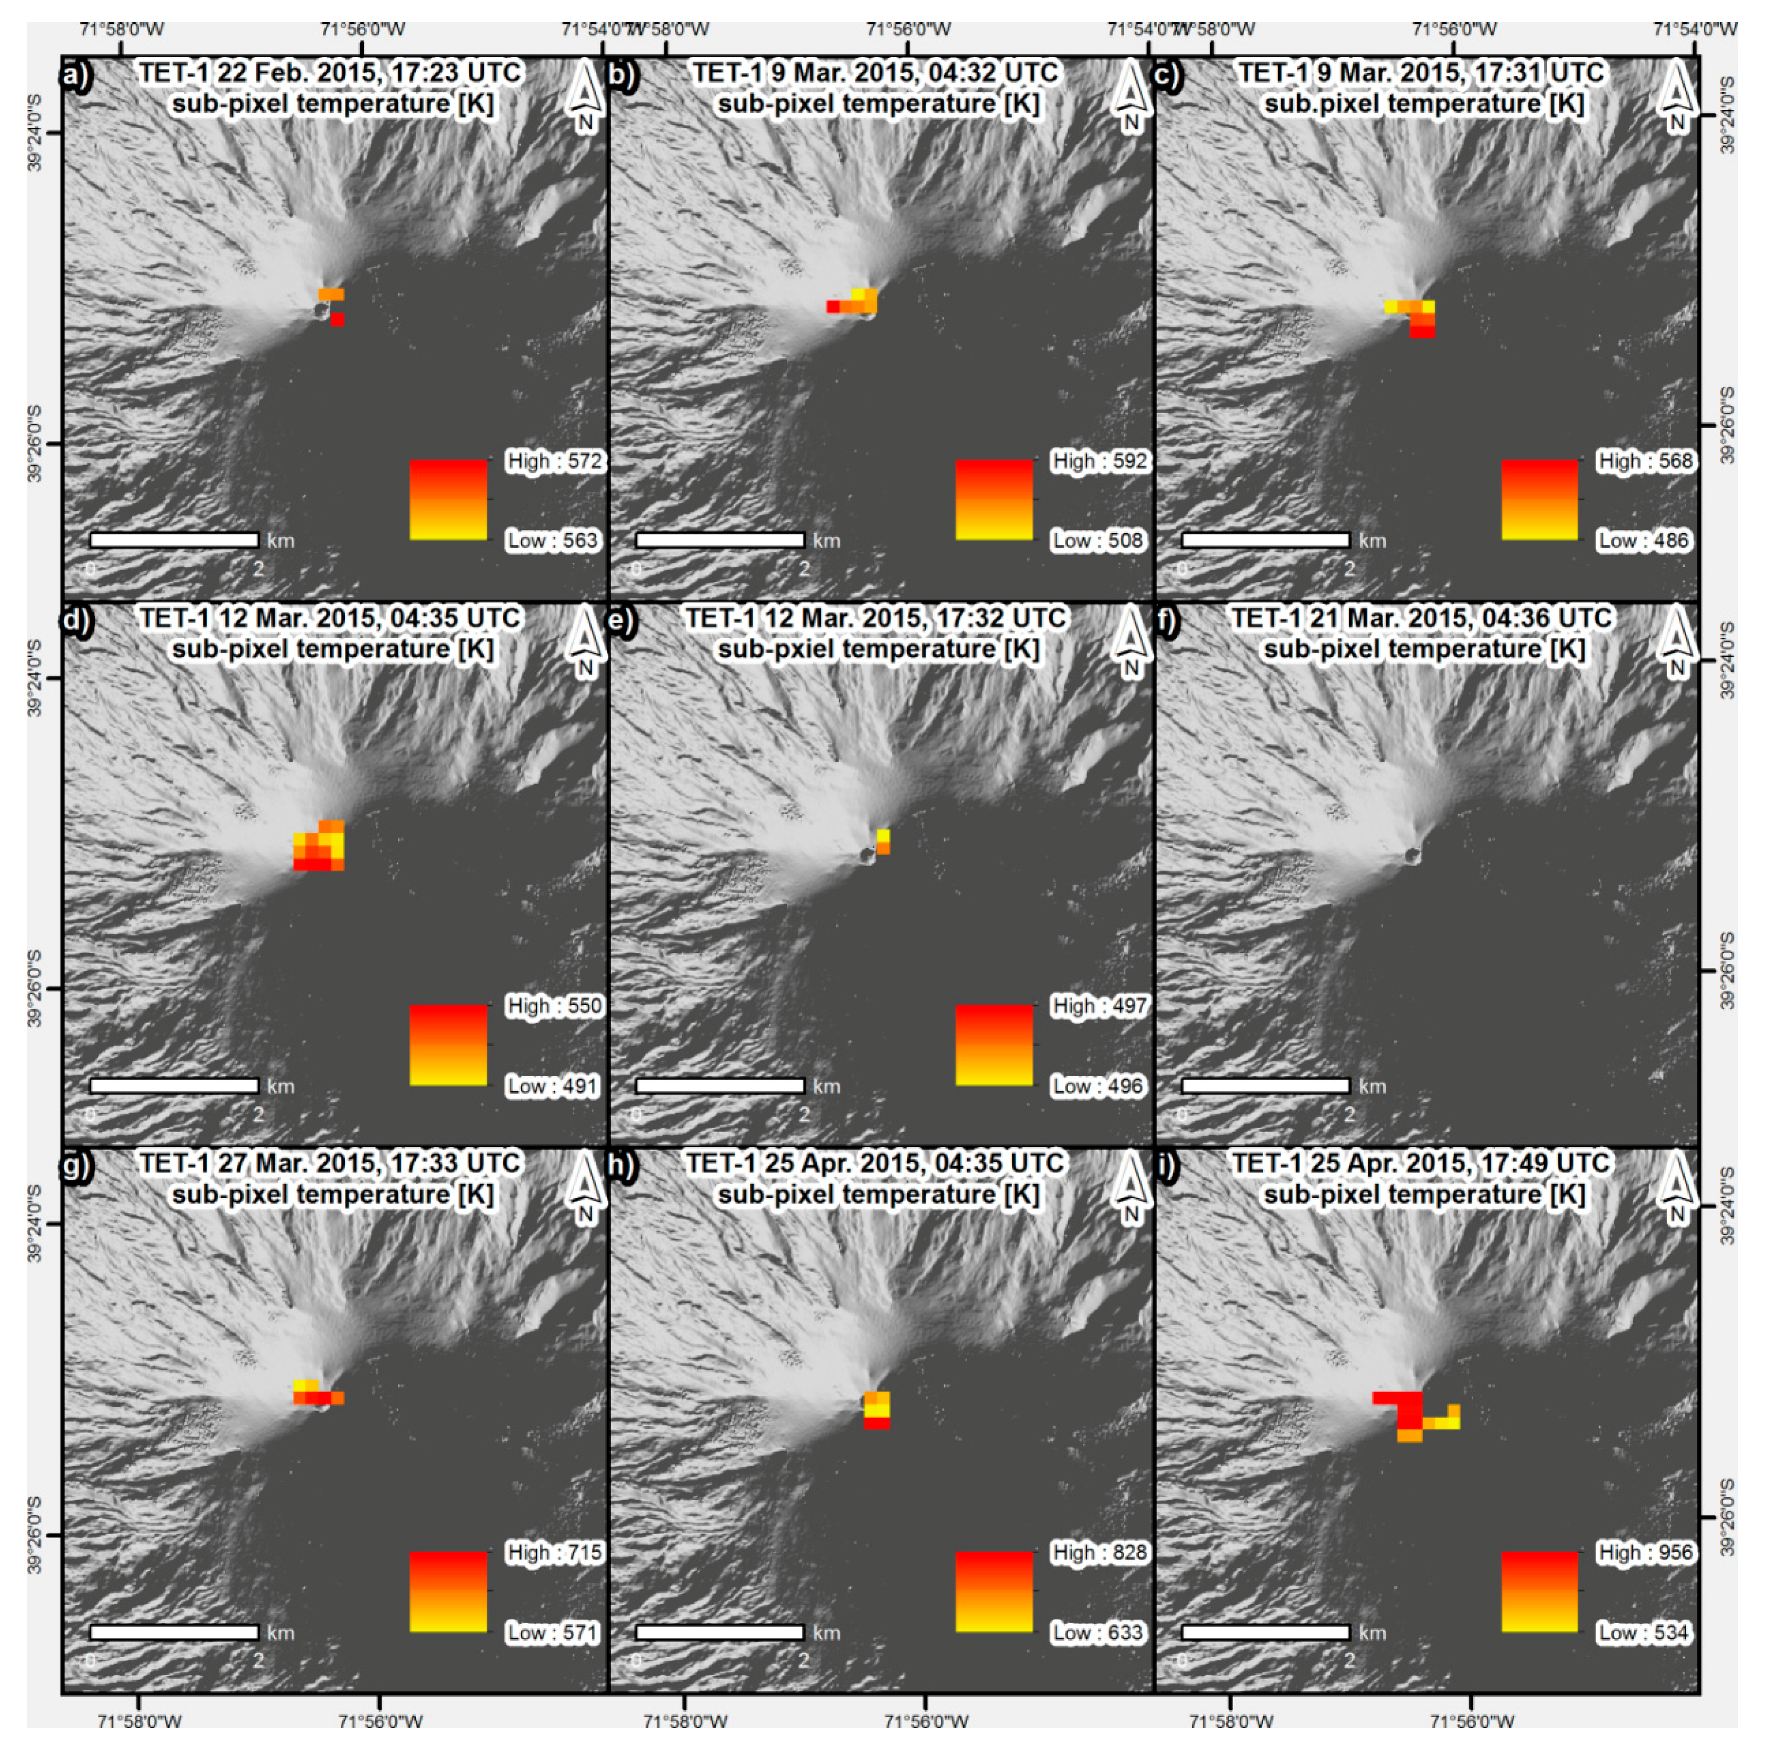
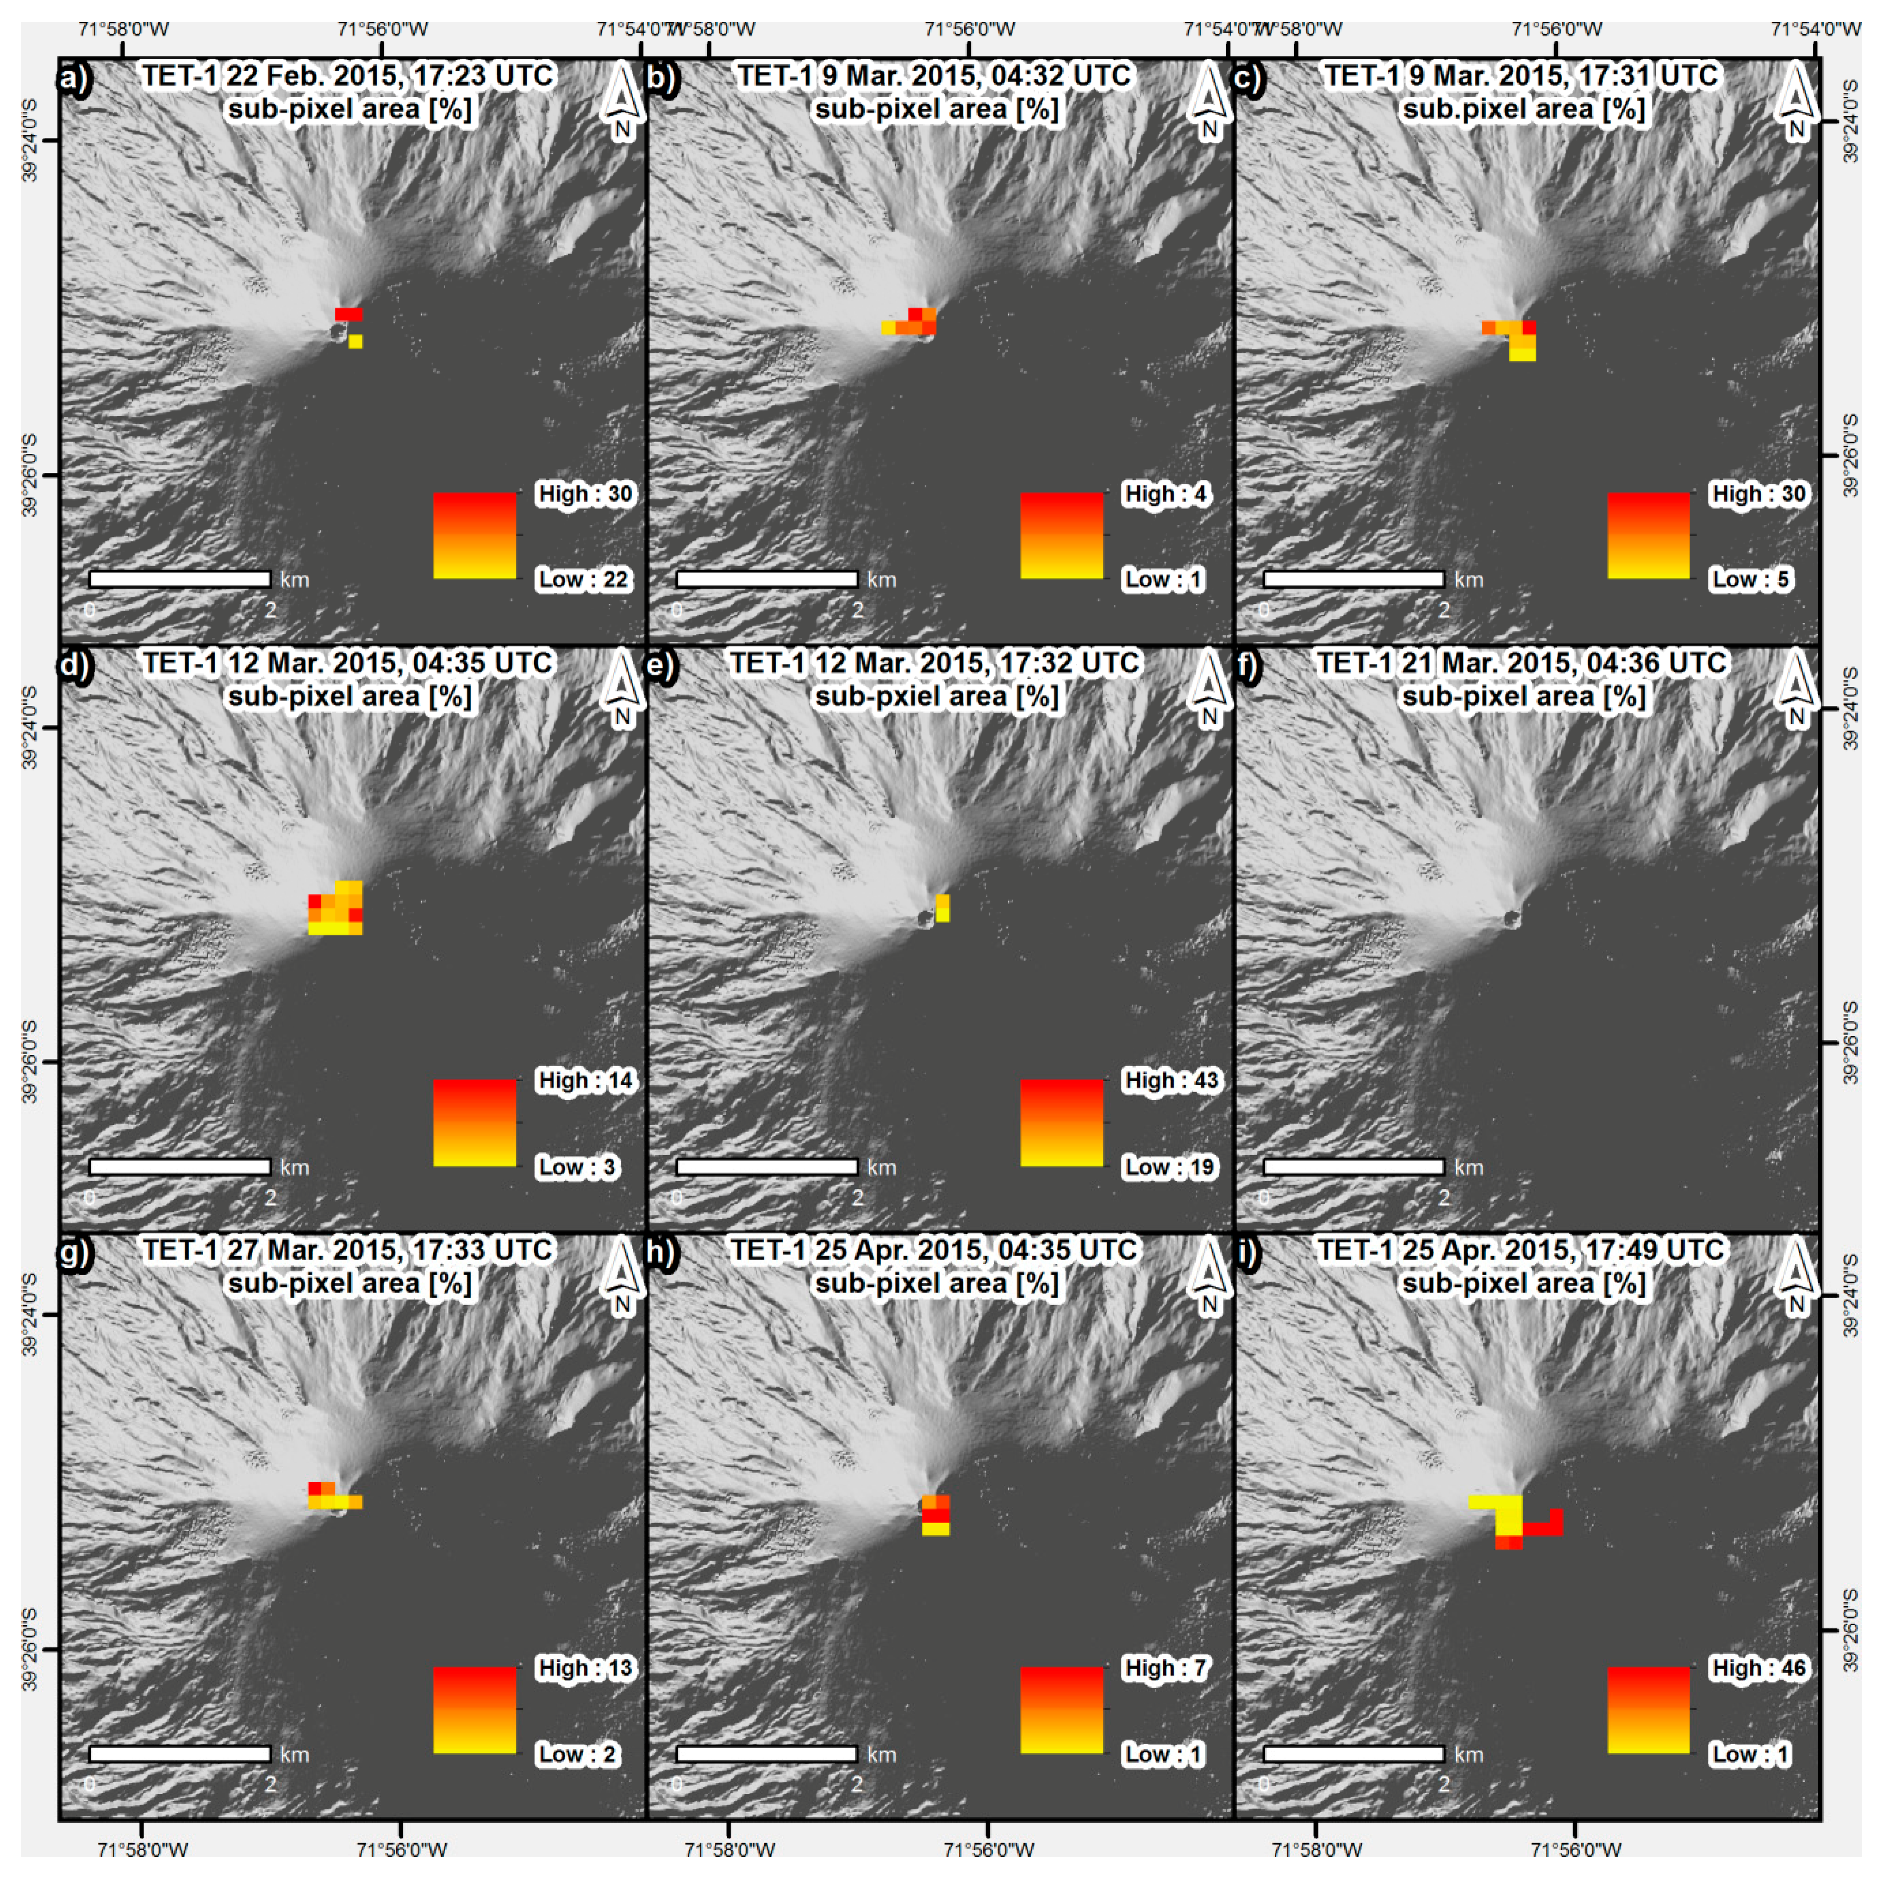
3.2. Hotspot Detection and Subpixel Analysis
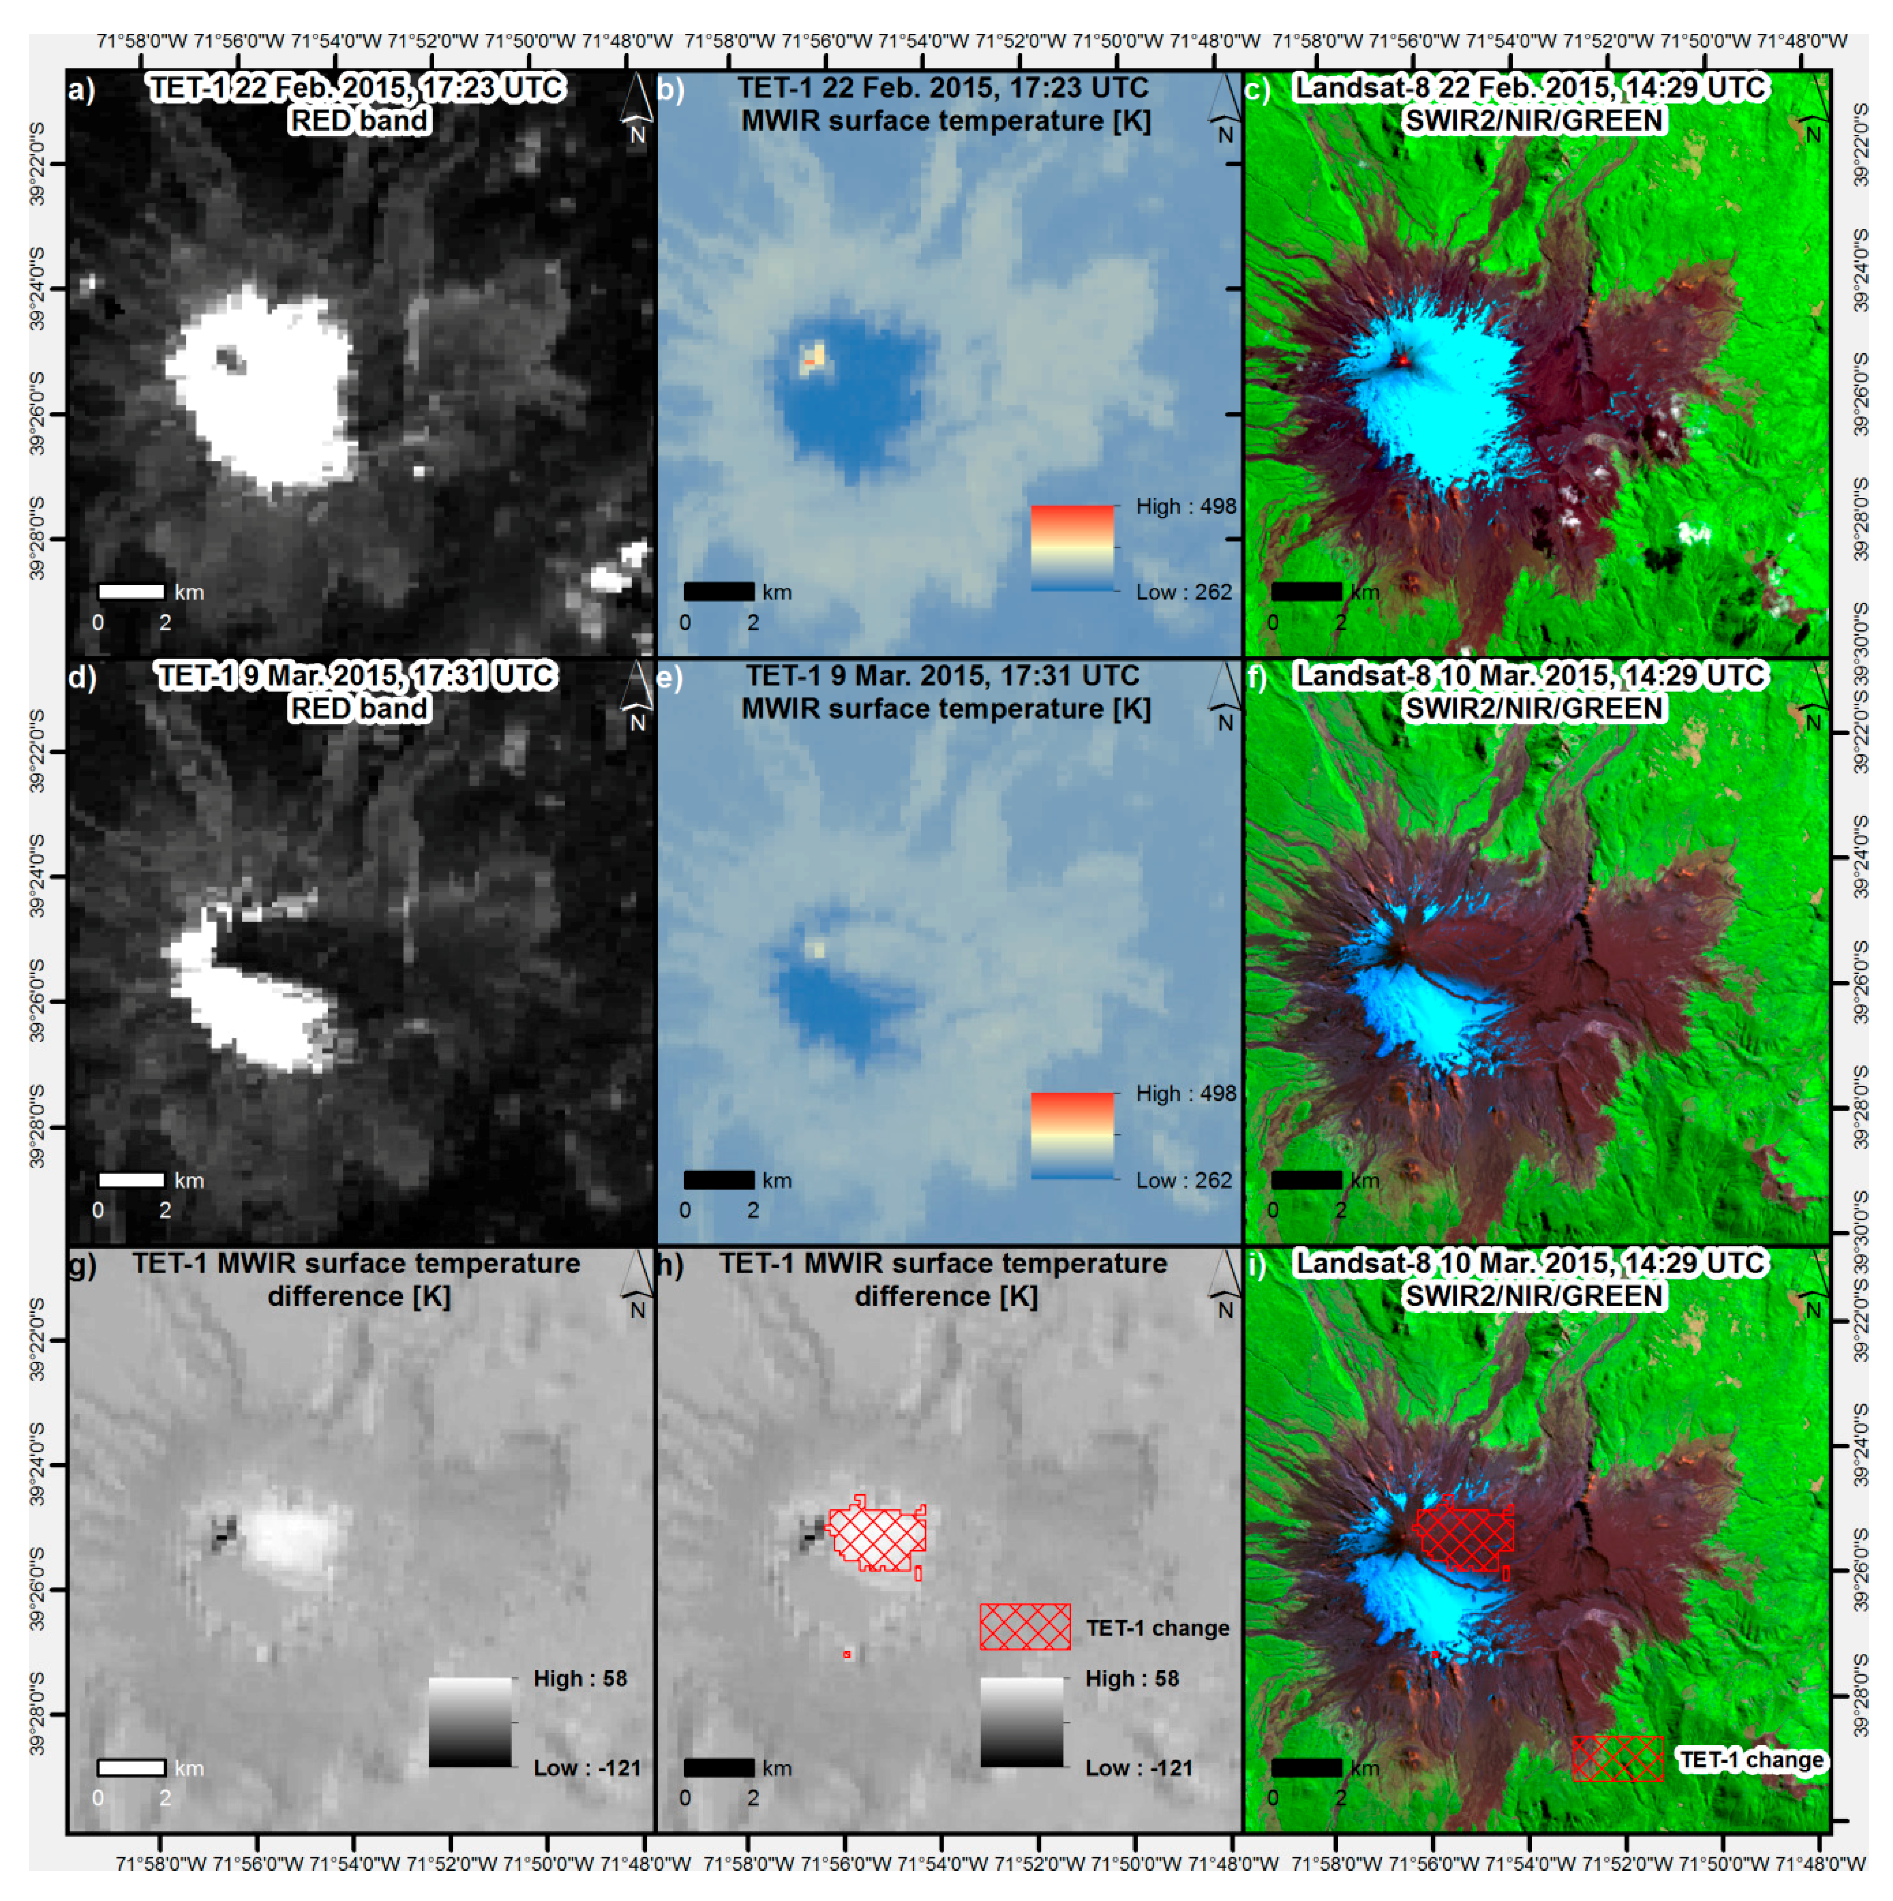
3.3. Detection of Surface Changes
4. Discussion
4.1. Calibration by Means of MODIS Sea Surface Temperature
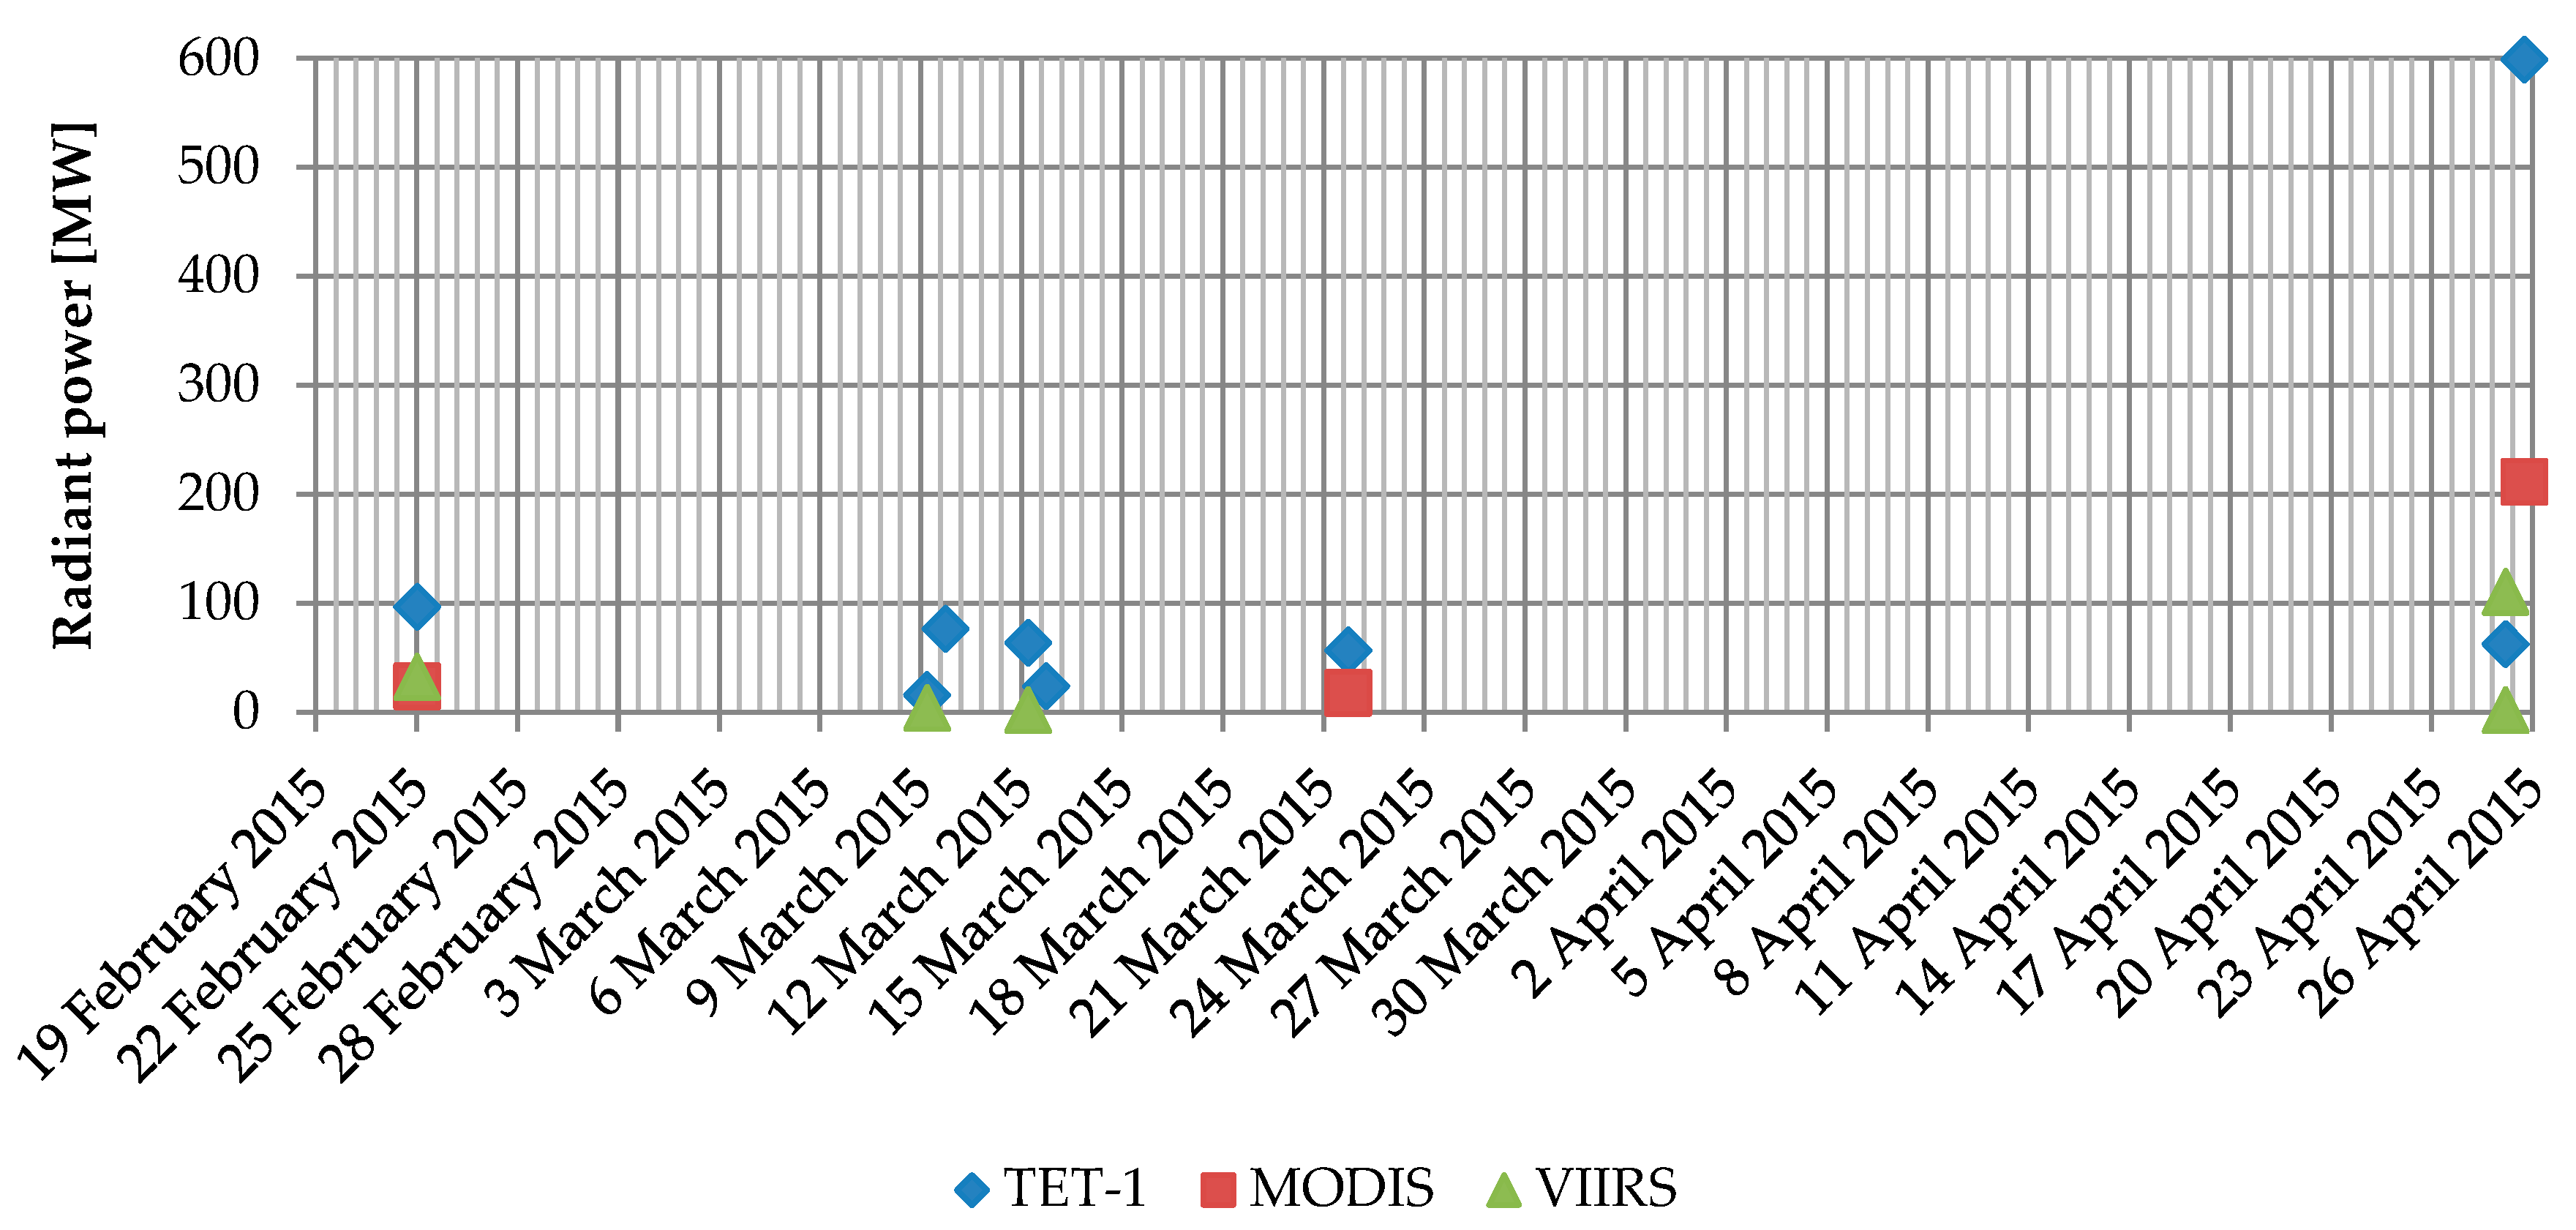
4.2. Comparison with MODIS and VIIRS Hotspots
4.3. Comparison with Independent Observations
4.4. Influence of the Off-nadir Angle and the Depth/Width of the Crater
4.5. Detection of Surface Changes
5. Conclusions
Author Contributions
Funding
Acknowledgments
Conflicts of Interest
References
- Moussallam, Y.; Bani, P.; Curtis, A.; Banie, T.; Moussellam, M.; Peters, N.; Schipper, C.I.; Aiuppa, A.; Giudice, G.; Amigo, A.; et al. Sustaining Persistent Lava Lakes: Observations from High-Resolution Gas Measurements at Villarrica Volcano, Chile. Earth Planet. Sci. Lett. 2016, 454, 237–247. [Google Scholar] [CrossRef]
- Patrick, M.R.; Orr, T.; Sutton, A.J.; Lev, E.; Thelen, W.; Fee, D. Shallowly driven fluctuations in lava lake outgassing (gas pistoning), Kilauea Volcano. Earth Planet. Sci Lett. 2016, 433, 326–338. [Google Scholar] [CrossRef]
- Bani, P.; Oppenheimer, C.; Tsanev, V.; Carn, S.; Cronin, S.; Crimp, R.; Calkins, J.; Charley, D.; Lardy, M.; Roberts, T. Surge in Sulphur and halogen degassing from Ambrym volcano, Vanuatu. Bull. Volcanol. 2009, 71, 115–1168. [Google Scholar] [CrossRef]
- Rymer, H.; de Vries, B.V.; Stix, J.; Williams-Jones, G. Pit crater structure and processes governing persistent activity at Masaya Volcano, Nicaragua. Bull. Volcanol. 1998, 59, 345–355. [Google Scholar] [CrossRef]
- Harris, A.J.L.; Flynn, L.P.; Rothery, D.A.; Oppenheimer, C.; Sherman, S.B. Mass flux Measurements at Active Lava Lakes: Implications for Magma Recycling. J. Geophys. Res. Solid Earth 1999, 104, 7117–7136. [Google Scholar] [CrossRef]
- Sawyer, G.M.; Oppenheimer, C.; Tsanev, V.; Yirgu, G. Magmatic degassing at Erta ‘Ale volcano, Ethiopia. J. Volcanol. Geotherm. Res. 2008, 178, 837–846. [Google Scholar] [CrossRef]
- Calkins, J.; Oppenheimer, C.; Kyle, P.R. Ground-based thermal imaging of lava lakes at Erebus volcano, Antarctica. J. Volcanol. Geotherm. Res. 2008, 177, 695–704. [Google Scholar] [CrossRef]
- Campion, R. New laval lake at Nyamuragira volcano revealed by combined ASTER and OMI SO2 measurements. Geophys. Res. Lett. 2014, 41, 7485–7492. [Google Scholar] [CrossRef]
- Coppola, D.; Campion, R.; Laiolo, M.; Cuoco, E.; Balagizi, C.; Ripepe, M.; Cigolini, C.; Tedesco, D. Birth of a lava lake: Nyamulagira volcano 2011–2015. Bull. Volcanol. 2016, 78. [Google Scholar] [CrossRef]
- Rivera, A.; Bown, F. Recent glacier variations on active ice capped volcanoes in the Southern Volcanic Zone (37°–46°S), Chilean Andes. J. South Am. Earth Sci. 2013, 45, 345–356. [Google Scholar] [CrossRef]
- Ripepe, M.; Marchetti, E.; Bonadonna, C.; Harris, A.J.L.; Pioli, L.; Ulivieri, G. Monochromatic infrasonic tremor driven by persistent degassing and convection at Villarrica Volcano, Chile. Geophys. Res. Lett. 2010, 37. [Google Scholar] [CrossRef] [Green Version]
- Shinohara, H.; Witter, J.B. Volcanic gases emitted during mild Strombolian activity of Villarrica volcano, Chile. Geophys. Res. Lett. 2005, 32. [Google Scholar] [CrossRef] [Green Version]
- Witter, J.B.; Kress, V.C.; Delmelle, P.; Stix, J. Volatile degassing, petrology, and magma dynamics of the Villarrica Lava Lake, Southern Chile. J. Volcanol. Geotherm. Res. 2004, 134, 303–337. [Google Scholar] [CrossRef]
- Palma, J.L.; Calder, E.S.; Basualto, D.; Blake, S.; Rothery, D.A. Correlations between SO2 flux, seismicity, and outgassing activity at the open vent of Villarrica volcano, Chile. J. Geophys. Res. Solid Earth 2008, 113, B10. [Google Scholar] [CrossRef]
- Aiuppa, A.; Bitetto, M.; Francofonte, V.; Velasquez, G.; Parra, C.B.; Giudice, G.; Liuzzo, M.; Moretti, R.; Moussallam, Y.; Peters, N.; et al. CO2-gas precursor to the March 2015 Villarrica volcano eruption. Geochem. Geophys. Geosyst. 2017, 18, 2120–2132. [Google Scholar] [CrossRef]
- Goto, A.; Johnson, J.B. Monotonic infrasound and Helmholtz resonance at Volcan Villarrica (Chile). Geophys. Res. Lett 2011, 38, L06301. [Google Scholar] [CrossRef]
- Bertin, D.; Amigo, A.; Bertin, L. Erupción del volcán Villarrica 2015: Productos emitidos y volumen involucrado. In Proceedings of the XIV Congreso Geológico Chileno, La Serena, Chile, 4–8 October 2015; Volume III, pp. 249–252. [Google Scholar]
- Johnson, J.B.; Palma, J.L. Lahar infrasound associated with Volcán Villarrica’s 3 March 2015 eruption. Geophys. Res. Lett. 2015, 42, 6324–6331. [Google Scholar] [CrossRef]
- Harris, A.J.L.; De Groeve, T.; Carn, S.A.; Garel, F. Risk evaluation, Detection and Simulation during Effusive Eruption Disasters. In Detecting, Modelling and Responding to Effusive Eruptions; Harris, A.J.L., De Groeve, T., Garel, F., Carn, S.A., Eds.; Geological Society: London, UK, 2016; Volume 426, pp. 1–22. [Google Scholar] [CrossRef]
- Harris, A.J.L. Effusive crisis at Piton de la Fournaise 2014–2015: A Review of a Multi-National Response Model. J. App. Volcanol. 2017, 6. [Google Scholar] [CrossRef]
- Harris, A.J.L. Thermal Remote Sensing of Active Volcanoes. A User’s Manual; Cambridge University Press: Cambridge, UK, 2013; p. 736. [Google Scholar] [CrossRef]
- Blackett, M. An Overview on Infrared Remote Sensing of Volcanic Activity. J. Imaging 2017, 3, 13. [Google Scholar] [CrossRef]
- Harris, A.J.L.; Baloga, S.M. lava discharge rates from satellite-measured heat flux. Geophys. Res. Lett. 2009, 36, L19302. [Google Scholar] [CrossRef]
- Harris, A.J.L.; Dehn, J.; Calvari, S. Lava effusion rate definition and measurement: A Review. Bull. Volcanol. 2007, 70, 1–22. [Google Scholar] [CrossRef]
- Wright, R.; Flynn, L.; Garbeil, H.; Harris, A.; Piler, E. Automated volcanic eruption detection using MODIS. Remote Sens. Environ. 2002, 82, 135–155. [Google Scholar] [CrossRef] [Green Version]
- Kervyn, M.; Ernst, G.G.J.; Harris, A.J.L.; Belton, F.; Mbede, E.; Jacobs, P. Thermal remote sensing of the low-intensity carbonatite volcanism of Oldoinyo Lengai, Tanzania. Int. J. Remote Sens. 2008, 29, 6467–6499. [Google Scholar] [CrossRef]
- Coppola, D.; Laiolo, M.; Cigolini, C.; Delle Donne, D.; Ripepe, M. Enhanced volcanic hot-spot detection using MODIS IR data: Results from the MIROVA system. In Detecting, Modelling and Responding to Effusive Eruptions; Harris, A.J.L., De Groeve, T., Garel, F., Carn, S.A., Eds.; Geological Society: London, UK, 2016; Volume 426. [Google Scholar] [CrossRef]
- Coppola, D.; Laiolo, M.; Cigolini, C.; Orozco, G. The 2008 “Silent” Eruption of Nevados de Chillán (Chile) detected from space: Effusive rates and trends from the MIROVA system. J. Volcanol. Geotherm. Res. 2016, 327, 322–329. [Google Scholar] [CrossRef]
- Spampinato, L.; Ganci, G.; Hernández, P.A.; Calvo, D.; Pérez, N.M.; Calvari, S.; Del Negro, C.; Yalire, M.M. Thermal insights into the dynamics of Nyiragongo lava lake from gound and satellite measurements. J. Geophys. Res. Solid Earth 2013, 118, 5771–5784. [Google Scholar] [CrossRef]
- Blackett, M. Early Analysis of Landsat-8 Thermal Infrared Sensor Imagery of Volcanic Activity. Remote Sens. 2014, 6, 2282–2295. [Google Scholar] [CrossRef] [Green Version]
- Fischer, C.; Klein, D.; Kerr, G.; Stein, E.; Lorenz, E.; Frauenberger, O.; Borg, E. Data Validation and Case Studies using the TET-1 Thermal Infrared Satellite System. Int. Arch. Photogramm. Remote Sens. Spat. Inf. Sci. 2015, XL-7/W3, 1177–1182. [Google Scholar] [CrossRef] [Green Version]
- Zakšek, K.; Hort, M.; Lorenz, E. Satellite and Ground Based Thermal Observation of the 2014 Effusive Eruption at Stromboli Volcano. Remote Sens. 2015, 7, 17190–171211. [Google Scholar] [CrossRef]
- Berk, A.; Hawes, F.; van den Bosch, J.; Anderson, G.P. MODTRAN5.4.0 User’s Manual; Spectral Sciences Inc.: Burlington, MA, USA, 2016. [Google Scholar]
- Salisbury, J.W.; D’Aria, D.M. Emissivity of terrestrial materials in the 3–5 µm atmospheric window. Remote Sens. Environ. 1994, 47, 345–361. [Google Scholar] [CrossRef]
- Giglio, L.; Kendall, J.D.; Justice, C.O. Evaluation of global fire detection algorithms using simulated AVHRR infrared data. Int. J. Remote Sens. 1999, 20, 1947–1985. [Google Scholar] [CrossRef]
- Klein, D.; Richter, R.; Strobl, C.; Schläpfer, D. Solar Influence on Fire Radiative Power. IEEE Trans. Geosci. Remote Sens. under review.
- Dozier, J. A method for satellite identification of surface temperature fields of subpixel resolution. Remote Sens. Environ. 1981, 11, 221–229. [Google Scholar] [CrossRef]
- Zhukov, B.; Lorenz, E.; Oertel, D.; Wooster, M.; Roberts, G. Space-borne detection and characterization of fires during the bi-spectral infrared detection (BIRD) experimental small satellite mission (2001–2004). Remote Sens. Environ. 2006, 100, 29–51. [Google Scholar] [CrossRef]
- Halle, W.; Asam, S.; Borg, E.; Fischer, C.; Frauenberger, O.; Lorenz, E.; Klein, D.; Nolde, M.; Paproth, C.; Plank, S.; et al. FireBIRD–small satellite or wild fire assessment. In Proceedings of the International Geoscience and Remote Sensing Symposium IGARSS, Valencia, Spain, 22–27 July 2018. [Google Scholar]
- Justice, C.; Giglio, L.; Boschetti, L.; Roy, D.; Csiszar, I.; Morisette, J.; Kaufman, Y. Modis Fire Products; Algorithm Technical Background Document; NASA Goddard Space Flight Center: Greenbelt, MD, USA, 2006. [Google Scholar]
- Visible Infrared Imaging Radiometer Suite (VIIRS) 375 m Active Fire Detection and Characterization Algorithm Theoretical Basis Document 1.0. Available online: https://viirsland.gsfc.nasa.gov/PDF/VIIRS_activefire_375m_ ATBD.pdf (accessed on 19 June 2018).
- NASA. Fire Information for Resource Management System (FIRMS). Available online: https://firms.modaps.eosdis.nasa.gov (accessed on 19 June 2018).
- Aiuppa, A.; Maarten de Moor, J.; Arellano, S.; Coppola, D.; Francofonte, V.; Galle, B.; Giudice, G.; Liuzzo, M.; Mendoza, E.; Saballos, A.; et al. Tracking Formation of a Lava Lake from Ground and Space: Masaya Volcano (Nicaragua), 2014–2017. Geochem. Geophys. Geosys. 2018, 19, 496–515. [Google Scholar] [CrossRef]


| Acquisition Date & Time | Local Time, Chile | Satellite | Sensor Type | MODIS Water Vapor Acquisition Date & Time |
|---|---|---|---|---|
| 22 February 2015, 14:29 UTC | 10:29 | Landsat-8 | MS, thermal | - |
| 22 February 2015, 17:23 UTC | 13:23 | TET-1 | Thermal | 22 February 2015, 18:10 UTC |
| 9 March 2015, 04:32 UTC | 00:32 | TET-1 | Thermal | 9 March 2015, 03:45 UTC |
| 9 March 2015, 17:31 UTC | 13:31 | TET-1 | Thermal | 9 March 2015, 19:05 UTC |
| 10 March 2015, 14:29 UTC | 10:29 | Landsat-8 | MS, thermal | - |
| 12 March 2015, 04:35 UTC | 00:35 | TET-1 | Thermal | 12 March 2015, 04:15 UTC |
| 12 March 2015, 17:32 UTC | 13:32 | TET-1 | Thermal | 12 March 2015, 15:20 UTC |
| 21 March 2015, 04:36 UTC1 | 00:36 | TET-1 | Thermal | 21 March 2015, 04:10 UTC |
| 26 March 2015, 14:29 UTC | 10:29 | Landsat-8 | MS, thermal | - |
| 27 March 2015, 17:33 UTC | 14:33 | TET-1 | Thermal | 27 March 2015, 18:50 UTC |
| 25 April 2015, 04:35 UTC | 00:35 | TET-1 | Thermal | 25 April 2015, 03:05 UTC |
| 25 April 2015, 17:49 UTC1 | 13:49 | TET-1 | Thermal | 25 April 2015, 18:20 UTC |
| Channel | Wavelength (µm) | Looking Angle (°) |
|---|---|---|
| GREEN | 0.460–0.560 | 6° forward |
| RED | 0.565–0.725 | Nadir |
| NIR | 0.790–0.930 | 6° backward |
| MWIR | 3.400–4.200 | Nadir |
| LWIR | 8.500–9.300 | Nadir |
| Scale Factor | MWIR Δ MODIS SST to TET-1 SST (K) | LWIR Δ MODIS SST to TET-1 SST (K) |
|---|---|---|
| 1.00 | +2.84 | +2.33 |
| 1.05 | +1.04 | −0.62 |
| 1.10 | +0.02 | −3.48 |
| Scale Factor | MWIR Δ MODIS SST to TET-1 SST (K) | LWIR Δ MODIS SST to TET-1 SST (K) |
|---|---|---|
| 1.00 | +4.07 | +4.98 |
| 1.05 | +2.85 | +2.17 |
| 1.10 | +1.54 | −0.73 |
| 1.15 | +0.28 | −3.52 |
| TET-1 Acquisition Date & Time [UTC]; Off-Nadir Angle | TET-1 Integrated Radiant Power [MW] | MODIS Acquisition: Time Difference to TET-1 | MODIS Integrated Radiant Power [MW] | VIIRS Acquisition: Time Difference to TET-1 | VIIRS Integrated Radiant Power [MW] |
|---|---|---|---|---|---|
| 22 February 2015, 17:23; +19.4° | 96.7 | −11 h 12 min | 24.3 | −11 h 45 min | 32.7 |
| 9 March 2015, 04:32; −21.9° | 15.7 | - | NO | +1 h 25 min | 4.1 |
| 9 March 2015, 17:31; +6.0° | 76.5 | - | NO | - | NO |
| 12 March 2015, 04:35; −20.5° | 63.9 | - | NO | +26 min | 1.9 |
| 12 March 2015, 17:32; +5.0° | 24.5 | - | NO | - | NO |
| 21 March 2015, 04:36; −28.5° | NO | - | NO | - | NO |
| 27 March 2015, 17:33; +4.2° | 56.7 | −11 h 47 min | 18.0 | - | NO |
| 25 April 2015, 04:35; +8.4° | 62.4 | - | NO | −4 min | 1.9 |
| +1 h 40 min | 110.5 | ||||
| 25 April 2015, 17:49; −18.0° | 599.0 | +23 min | 211.6 | - | NO |
© 2018 by the authors. Licensee MDPI, Basel, Switzerland. This article is an open access article distributed under the terms and conditions of the Creative Commons Attribution (CC BY) license (http://creativecommons.org/licenses/by/4.0/).
Share and Cite
Plank, S.; Nolde, M.; Richter, R.; Fischer, C.; Martinis, S.; Riedlinger, T.; Schoepfer, E.; Klein, D. Monitoring of the 2015 Villarrica Volcano Eruption by Means of DLR’s Experimental TET-1 Satellite. Remote Sens. 2018, 10, 1379. https://doi.org/10.3390/rs10091379
Plank S, Nolde M, Richter R, Fischer C, Martinis S, Riedlinger T, Schoepfer E, Klein D. Monitoring of the 2015 Villarrica Volcano Eruption by Means of DLR’s Experimental TET-1 Satellite. Remote Sensing. 2018; 10(9):1379. https://doi.org/10.3390/rs10091379
Chicago/Turabian StylePlank, Simon, Michael Nolde, Rudolf Richter, Christian Fischer, Sandro Martinis, Torsten Riedlinger, Elisabeth Schoepfer, and Doris Klein. 2018. "Monitoring of the 2015 Villarrica Volcano Eruption by Means of DLR’s Experimental TET-1 Satellite" Remote Sensing 10, no. 9: 1379. https://doi.org/10.3390/rs10091379