Article

China’s 1 km Merged Gauge, Radar and Satellite Experimental Precipitation Dataset

1
National Meteorological Information Center, Beijing 100081, China
2
School of Civil Engineering and Environmental Science, University of Oklahoma, Norman, OK 73072, USA
*
Author to whom correspondence should be addressed.
Remote Sens. 2018, 10(2), 264; https://doi.org/10.3390/rs10020264
Submission received: 16 December 2017 / Revised: 21 January 2018 / Accepted: 2 February 2018 / Published: 8 February 2018

Abstract

:
Based on high-density gauge precipitation observations, high-resolution weather radar quantitative precipitation estimation (QPE) and seamless satellite-based precipitation estimates, a 1-km experimental gauge-radar-satellite merged precipitation dataset has been developed using the proposed local gauge correction (LGC) and optimal interpolation (OI) merging strategies. First, hourly precipitation analyses from approximately 40,000 automatic weather stations at 0.01° resolution were used to correct bias in the radar QPE Group System (QPEGS), developed by the China Meteorological Administration (CMA) and the Climate Prediction Center Morphing (CMORPH) precipitation products. As precipitation events tend to have a more localized distribution at the hourly and 0.01° resolutions, three core parameters were improved using the OI method. (a) The spatial dependence of the error variance for radar QPE was accounted for over six sub-regions in China and is shown as a non-linear function of the gauge precipitation analysis. (b) The spatial dependence of error correlation for the radar QPE decreased exponentially with distance. (c) The error of the hourly gauge-based precipitation analysis was quantified as a function of the precipitation amount and the gauge network density, using the Monte Carlo method to randomly sample the gauge observations over the dense gauge network. The performance of the 1-km experimental gauge-radar-satellite merged precipitation dataset (named as China Merged Precipitation Analysis: CMPA_1km) was assessed at 6 h-temporal resolutions and 0.03° × 0.03° spatial resolution using precipitation observations from 208 independent hydrological stations as a reference. Compared with radar QPE and CMORPH, the CMPA-1km showed obviously better accuracy in all sub-regions and during all seasons. In contrast, gauge analysis and CMPA-1km shared similar accuracy, but the latter could estimate heavy precipitation more accurately than the former, as well as the latter has the advantage of seamless spatial coverage. However, the CMPA-1km exhibits larger uncertainty during the cold season compared to the warm season, which will need further improvement in future work. The downscaled bias-corrected 0.01° resolution CMORPH was employed to fill the gaps in regions, mainly in Western China and the Tibetan Plateau, where gauge and radar measurements are limited.

Graphical Abstract

1. Introduction

Urban floods, flash floods and landslides due to heavy rainfall are a few of the world’s most severe natural disasters. In China, these disasters can result in thousands of deaths and injuries and huge economic losses. According to a report from the State Flood Control and Drought Relief Headquarters office, 20 rounds of severe rainstorms across 26 provinces in China resulted in 32 million injuries and 186 deaths during the months of June and July in 2016 [1]. Therefore, with the development of the regional, high spatiotemporal, numerical weather prediction (NWP) model and the distributed hydrological model, a high-resolution (such as 1 km) precipitation product is urgently needed to verify the performance of the NWP model and to force the hydrological model. However, precipitation measurements at small spatial and short temporal scales are still a great challenge because of the high spatiotemporal variation and nonlinear nature of precipitation [2].
Currently, surface precipitation is predominantly measured using rain gauges, weather radars and satellites. Rain gauges provide the direct measurement of surface precipitation. However, the uneven spatial distribution of gauges, especially over the Tibetan Plateau and vast ocean areas, limits their use. While weather radar is widely used in China for quantitative precipitation estimation (QPE) due to its unique advantages of high spatial (1 km) and temporal (5–6-min) resolution, radar precipitation products may contain large error due to the mixed calibration standard for different weather radar types, uncertainties in the Z-R relationships [3], as well as complicated types of precipitation in China. In addition, the coverage of the weather radar is spatially limited, rendering its application nearly useless over the complex terrain of Northwestern China, especially in the Tibetan Plateau, where satellite-based precipitation products are the only reliable way to increase precipitation coverage. Satellite-based precipitation products are generated by merging satellite infrared (IR) and passive microwave (PMW) measurements. Their spatial resolution can reach up to 10 km. For example, the National Oceanic and Atmospheric Administration (NOAA) Climate Precipitation Center (CPC) Morphing Technique (CMORPH) has been producing global precipitation analyses on an 8-km grid and 30-min interval since 1998 [4,5].
However, weather radar and satellite are indirect ways of measuring precipitation in nature and, therefore, result in regional and seasonal systematic bias and random error that must be corrected [6,7]. Currently, the most common way to reduce these errors is to merge weather radar and satellite products with the ground-based precipitation measurements, under the assumption that the gauge measurement is unbiased. Extensive research has been carried out to correct the bias contained in the radar QPE [8,9,10] and satellite-based precipitation estimate [11,12,13,14,15]. The mean-field bias correction and the local bias correction are the most practical approaches to correct the bias. It is generally assumed that the mean-field bias correction is sometimes limited owing to the high spatial and temporal variability and the nonlinear nature of errors for precipitation. The local bias correction is more effective, especially for large-scale stratiform precipitation in the cool season over the regions with dense rain gauges, despite the fact that its result is dependent on gauge network density [9]. Therefore, research has been increasingly focused on the local bias correction method, such as the Multi-Radar/Multi-Sensor (MRMS) system developed by NOAA’s National Severe Storms Laboratory (NSSL) [16]. In the MRMS system, the local gauge correction (LGC) method is adapted to adjust for error inherent in the radar QPE. Compared with the radar QPE, the LGC radar QPE increased the correlation coefficient from 0.88–0.95 and reduced the root-mean-square error (RMSE) from 0.75 inch/d–0.49 inch/d [17]. Once bias has been corrected, the random error inherent in the radar QPE and satellite precipitation product needs to be reduced further. Therefore, the two-step error correction method has been developed to merge gauge precipitation observations with satellite estimates. A leading example is a two-step conceptual model proposed to correct the bias of CMORPH [4] using the probability density function (PDF)-matching technique against the rain gauge analysis at the daily and 0.25° resolutions [18,19]. Then, it combines the bias-corrected CMORPH with the gauge analysis using the optimal interpolation (OI) method. The reasonable number of matching data pairs in PDF and error estimates for the measured and first-guess field (one of the input datasets of OI) in OI have been improved and applied to the development of the hourly gauge-satellite merged precipitation product at the 0.1° × 0.1° resolution [15], which is publicly accessible online (http://data.cma.cn/data/online.html?t=6).
The strong regional dependence of precipitation error characteristics and gauge network densities in China favors the local bias correction method for the radar QPE and satellite estimates [20]. Moreover, complex terrain limits gauge and radar spatial coverage in regions of Western China, northwestern Inner Mongolia and especially in the Tibetan Plateau. Therefore, the seamless satellite precipitation estimate is a good alternative to fill the gaps. Therefore, this paper aims to make full use of the multi-source precipitation measurements and to develop an integrated algorithm to merge the hourly gauge, radar and satellite precipitation estimates at the 0.01° × 0.01° resolution over China. The key step of this algorithm is to correct the bias of the weather radar QPE and satellite precipitation estimates and to then reduce the random error in the bias-corrected radar QPE using gauge analysis. Emphasis will be placed on tuning regional parameters in OI at the hourly and 0.01° resolutions. At a fine resolution like 1 km, the error parameters of the observed and first-guess precipitation fields are strongly dependent on the resolutions of the product and rainfall. The error relationship for the observed and first-guess precipitation fields is nonlinear with the precipitation at the 1-km resolution, which is dramatically different from those at the 0.1° resolution. Besides, the parameters under the different gauge density and complicated topography also need to be validated for the applicability of this algorithm.
This paper mainly describes the LGC-OI combined merging algorithm, which is organized as follows: Section 2 describes the data used in this research. Section 3 outlines the merging methodology and describes how to improve the regional merging parameters. Section 4 present the independent validation results at 6-h temporal resolutions and 0.03° × 0.03° spatial resolution. This is followed by conclusions and future research recommendations in Section 5.

2. Data

2.1. Merging Data

In this study, we used the hourly Automatic Weather Station (AWS) precipitation observations, weather radar- and satellite-based precipitation products in this study to obtain the three-source merged precipitation analysis at the 0.01° × 0.01° resolution.

2.1.1. AWS Hourly Precipitation Observations

The AWS network has been set up gradually since 2006 by the China Meteorological Administration (CMA), and stations numbered more than 40,000 in 2015. The AWS measures the hourly precipitation from May–September and ceases measurements from October to the following April over Northern and Western China due to low temperatures. However, the spatial distribution of the gauges is still highly inhomogeneous, as shown in Figure 1a. In Southeastern China, the gauge density is high with the mean distance between a gauge and its nearest gauge 9.6 km, compared to more than 500 km over Northwestern China, especially over the Tibetan Plateau. The quality-controlled procedure in the real-time basis has been developed and applied for hourly precipitation observations since 2010 [21,22]. In this process, climatologically extreme value check, regional limit value check and spatiotemporal consistent check are conducted sequentially. The quality-controlled result is classified as correct, dubious or wrong data. The number of quality-controlled AWS changes over time, and Figure 1c shows the gauge number in July 2015 (a total of 744 h). A maximum gauge number of 38,721 occurred at 09 UTC on 31 July 2015.

2.1.2. Radar-Based QPE

A radar QPE Group System (QPEGS) has been developed by the CMA and can provide a 10-min precipitation field at the 0.01° × 0.01° resolution [23]. The distribution of weather radar stations is spatially heterogeneous, as shown in Figure 1b, with each grey circle representing one radar’s coverage. There are S-band and C-band weather radar in China with the maximum range 460 km and 300 km, but the optimal ranges of 230 km and 150 km are used to estimate the precipitation. The typical scanning strategy is VCP 21 (Volume Coverage Pattern), which has nine elevation angles and completes 11 azimuthal scans in six minutes. In the QPEGS system, the radar base data are first collected and pre-processed to remove the noise and echoes arising from non-meteorological objects and false weather signals [23]. Up to 10 different predefined “a” and “b” coefficients of the Z = a R b relationship, in which Z is the radar reflectivity and R is the precipitation estimate, are used by local historical or real-time precipitation data [23], with the most common ones a = 200 and 300 and the corresponding b = 1.6 and 1.4. These coefficients area applied to estimate the regional and seasonal precipitation from the radar reflectivity precipitation type. The validation results indicate that the relative error of the hourly radar QPE during the year 2003 was about 40% with more than 90% coefficient values of “a” and “b” being 200–1.6 and 300–1.4 [23]. The hourly radar QPE from 00Z 1 January 1 to 23Z 31 December 2015 is used in this paper.

2.1.3. Satellite-Based Precipitation Product

The Global CMORPH precipitation estimate developed by NOAA’s CPC is used in this paper [4]. By morphing relatively accurate PMW retrieved precipitation with high-spatiotemporal cloud information from IR, CMORPH can cover the area between 60°S and 60°N in a 30-min temporal resolution and on an 8 km × 8 km grid. It has been reprocessed and bias-corrected from January 1998 [5]. The validation, based on the gauge-based precipitation analysis, shows that the CMORPH product can capture the precipitation pattern relatively well compared to six satellite-based precipitation products over China [6]. Among the individual scale conversion methods, inverse distance weight (IDW) is simple, but very efficient. In this research, CMORPH was accumulated from 30-min–1-h temporal intervals and then interpolated using the inverse distance weight (IDW) [24] method to a spatial resolution of 0.01° × 0.01°. In this process, the surrounding 3 × 3 8-km grid boxes at the target 0.01° × 0.01° grid box are selected to interpolate the precipitation at each 1-km grid box. The weight for the IDW is inversely proportional to the distance between the target grid box and the surrounding one [24]. The reprocessed CMORPH data are for the one-year period of 00 UTC 1 January to 23Z 31 December 2015.

2.2. Independent Ground Observations and Evaluation Criteria

Observed precipitation, collected from 208 hydrological stations, is shared between the MWR (Ministry of Water Resources of the People’s Republic of China) and CMA and serves as a valuable independent precipitation source, which is used to evaluate the precipitation estimates in this study. These stations can observe 6-h and daily accumulated precipitation. The times for the 6-h accumulated precipitation begin with 00Z, 06Z, 12Z and 18Z, respectively. The spatial distribution of the 208 hydrological stations, concentrated primarily in the middle and lower reaches of the Yangtze River and the middle reaches of the Yellow, Huaihe and Songhuajiang Rivers, is shown in Figure 2. Using the 32°N and 40°N latitude lines as boundaries, approximately corresponding to the annual 800-mm and 400-mm precipitation contours, China can be divided into three sub-regions: Region I, Region II and Region III, in which precipitation decreases gradually from south to north. The number of hydrological stations in Regions I, II and III is 15, 73 and 120, respectively. The data used in this research are from January–December 2015.
Within the CMA, more than 2400 national automatic stations are considered benchmark stations, owing to the high reporting rate and accuracy of precipitation observations [21]. The MWR observed daily precipitation is checked against that of the benchmark stations. Statistical metrics, defined in Section 2.2, were used to compare data from each hydrological station to its nearest benchmark station for the year 2015, as shown in Table 1. The MWR observed precipitation is highly consistent with the benchmark station observations. The correlation coefficient (CC) was 0.857 for the annual time scale and was slightly higher during the cold season (0.895) than during the warm season (0.839), the difference arising primarily from the individual scales of precipitation dominant during different seasons. Large-scale (localized) precipitation events tend to dominate in the cold (warm) season, leading to a relatively higher (lower) CC. The RMSE and bias also exhibited seasonal dependence. RMSE was higher during the warm season (7.803 mm/d) than during the cold season (3.412 mm/d). The MWR precipitation observations underestimated precipitation at both annual and seasonal time scales. For example, the mean bias at the annual time scale was −0.362 mm/d. Furthermore, CC, bias and RMSE were plotted with respect to the distance between each hydrological station and its nearest benchmark station, as shown in Figure 3. The CC (RMSE) gradually decreased (increased) as the distance increased. However, bias did not vary significantly with distance, and bias for 188 among the 208 hydrological stations was within ±1.0 mm/day. Generally speaking, the MWR of observed precipitation agrees well with that of the benchmark stations and can be considered sufficiently reliable to validate the gauge-observed precipitation analysis, radar QPE, satellite precipitation estimates and the gauge-radar-satellite merged precipitation product at a resolution of 0.01°.
Some commonly-used evaluation metrics, such as bias, RMSE and CC, were selected to evaluate the accuracy of the precipitation datasets against the hydrological observed precipitation. Bias ranges from negative infinity to infinity, with zero representing the best result. RMSE ranges from zero to infinity, with a value of zero representing the best result. CC ranges from −1–1, with one representing the best result. The formulas are as follows:
B i a s = 1 n i = 1 n ( p i g i )
R M S E = 1 n i = 1 n ( p i g i ) 2
C C = i = 1 n ( p i p ¯ ) ( g i g ¯ ) i = 1 n ( p i p ¯ ) 2 i = 1 n ( g i g ¯ ) 2
where p i is the precipitation value from the gauge, radar or the satellite precipitation estimates and p ¯ is the average value of the related estimates; g i is the hydrological observed precipitation; and g ¯ is the average for g i . N is the number of observed points or the number of time steps.
Additionally, some categorical verification statistics were used to reveal the skill of precipitation products, including the equitable threat score (ETS), probability of detection (POD) and False alarm rate (FAR) [11]. These statistics can be calculated using the following equations:
P O D = H H + M
F A R = F H + F
T S = H H + M + F
E T S = H h e H + M + F H e ,   where   H e = ( H + M ) ( H + F ) H + M + F + C
The terms of the equations are defined in a contingency table (Table 2). The POD measures the fraction of observed events that were correctly diagnosed. The FAR gives the fraction of diagnosed events that did not actually happen. All of these scores range from 0–1; zero is the worst score, and one is the best score for POD, TS and ETS, while zero is the best score and one is the worst score for FAR.

3. Method

A four-step flowchart displays the steps used to merge gauge, radar and satellite precipitation, as shown in Figure 4. The first step is to pre-process the gauge observations from points to the 0.01° × 0.01° horizontal resolution using the climatology-adjusted OI [25,26]. The second step is to correct the bias of the hourly radar and satellite precipitation estimates at 0.01° × 0.01° resolution using the LGC method developed by [17]. The radar precipitation estimate shows the region-dependent error distribution, which is defined as a function of the gauge-based precipitation analysis at the hourly and 0.01° resolutions.
Then, the performances of the radar QPE and CMORPH products at the hourly and 0.01° resolution are evaluated and compared to provide quantitative information for selecting the first-gauss field of the OI algorithm. The precipitation estimates at the nearest grid box both from the radar QPE and CMORPH products were matched with the point observed precipitation at the hydrological station. Using the independent six-hour precipitation data observed by hydrological stations from June–August 2015 as a reference, the correlation coefficient and RMSE for radar and satellite precipitation estimates were calculated and presented in Figure 5a,b. The correlation coefficient/RMSE between radar precipitation and the hydrological observed precipitation was consistently higher/lower than that between CMORPH and the hydrological observed precipitation, as shown in Figure 5a,b. Therefore, at the 0.01° × 0.01° grid box, the radar precipitation estimate is more reliable than the CMORPH estimate and can be considered a more accurate first-guess precipitation field. Therefore, the bias-corrected radar precipitation estimate and gauge analysis are taken as the first-guess and measured field, respectively, which are combined using the OI method and used to improve the parameters in Section 3.3.
Finally, the satellite-based precipitation product is used to fill the gaps that result from the limited coverage of gauge and radar observations, especially in Northwestern China and the Tibetan Plateau, to obtain the seamless precipitation analysis.

3.1. Gauge-Based Precipitation Analysis

Interpolating gauge-observed point precipitation to the grid-box precipitation analysis is an efficient way to reduce spatial sampling error. Our precipitation interpolation strategy, known as the three-step OI algorithm of [27], was first proposed by [28] and developed by [25,26]. This algorithm was developed at the daily time scale based on the daily climatological precipitation field (1981–2010), which was first converted to the hourly time scale by dividing by 24. Next, the ratio of hourly gauge precipitation observations and the corresponding hourly precipitation climatology were computed at each gauge location. This ratio was then interpolated to the 0.01° × 0.01° grid. Finally, the gridded ratio field was multiplied by the related precipitation climatology, resulting in the gauge-based hourly precipitation analysis on a 0.01° × 0.01° lat./lon. grid. The daily climatological precipitation field was introduced and corrected for the topography effect by the Precipitation-elevation Regressions on Independent Slopes Model (PRISM) [29], a particularly important step for areas, such as Northwestern China, that are dominated by complex terrain.
The searching radius and the number of gauges within the radius were considered together in the OI method to interpolate the point precipitation observations to the grid-box precipitation analysis. According to the regional gauge network density and different topography, China can be divided into three sub-regions by the 40°N latitude and 100°E longitude lines, as shown in Figure 1a. Region I includes most of the areas of Inner Mongolia and Northwestern China. Region II (III) is the area with the highest (lowest) network density. A cross-validation experiment was conducted to judge the reasonable searching radius and the number of influence gauges in the three regions of China. In this experiment, RMSE and the average searching distance were calculated, with the number of influenced gauges ranging from 1–15, as shown in Figure 6. The RMSE initially decreased with an increase in gauge number. However, when the gauges number is four or larger, the RMSE became relatively stable. Therefore, we concluded that when using the OI method for the hourly precipitation, the number of influence gauges at a specific grid box should be at least four, with a number between five and seven being the most highly preferred. In addition, the maximum searching radii for the three regions were set to approximately 25 km, 12 km and 50 km, respectively, which are smaller than the radii used by OI at the daily scale, because the hourly and 0.01° resolutions tend to represent more localized precipitation events.

3.2. Local Bias Correction

In China, due to the mixed S-band and C-band radar types and complex topography, the radar precipitation dataset contained notable bias and random errors [30]. The work of Zhang et al. [17] proposed the LGC method, which uses rain gauge observations to correct the bias of the radar QPE product. The approach can be summarized in the following steps:
(1) Calculate the radar QPE bias corresponding to gauge observed precipitation at each gauge point i according to Equation (8):
b i a s =   R i G i
where R i and G i are the precipitation measured by radar QPE and gauge, respectively.
(2) Interpolate the point bias to the radar QPE coverage with 0.01° × 0.01° resolution based on a modified IDW [24]. The key in this step is to calculate the interpolation weight coefficient. However, in regions with sparse rain gauge distribution, sometimes only one gauge is available for interpolation within a certain radius, resulting in a constant error within the searching radius. This is especially obvious in the Tibetan Plateau. In order to decrease error with increasing distance between the target pixel and gauges, a normally distributed error estimate is used to calculate the following value (alpha) for each radar pixel:
α   i = 1 n e d i 2 ( D / 2 ) 2
where D is the influence radius, n is the number of gauges within D and d i is the distance between the target pixel and the i-th gauge. If α > 1 , there are enough interpolated rainfall observations in the specified searching radius. If α < 1 , the weighting factor w i is multiplied by the formula below:
w i = { α × 1 d i b ;   d i D    0 ;     d i > D
In order to improve the operational efficiency, the values for D are regionally dependent and are the same as those used in Section 3, with values of 25 km, 12 km and 50 km for the three sub-regions of China, respectively, in this research. For comparison, Zhang et al. [17] used values of D ranging from 10 km–500 km at an interval of 10 km. The value for b is the same as that used in [17] and ranges from 0.5–3.0 at an interval of 0.5. The value for b is determined when the mean squared error (MSE) is lowest in the cross-validation (CV). The CV is performed by extracting 10% of the samples as the test dataset to validate the interpolated results using the other 90% samples. This process repeats 10 times, and each sample is only extracted once. CV is performed at each time step, meaning that the value of b varies.

3.3. Parameters in OI-Based Merging Method

After the LGC, the radar QPEs are merged with the gauge analysis using the OI algorithm. The OI framework can be demonstrated as the formula below:
A k = F k + i = 1 n W k i ( O i F i )
where F k is the first-guess field, which is the LGC-corrected hourly radar QPE from Section 3.2. O i . is the observed field at the grid box I where observations are available. The essence of OI method is to properly define the weight W k i , which is a function of the error variance, σ i f ( σ i o ), and error correlation, μ i j f ( μ i j o ), for the first-guess (observed) precipitation fields as below:
j = 1 n ( μ i j f + μ i j o λ i λ j ) W j = μ k i f   ( i = 1 ,   2 , , n )
where λ i = σ i o σ i f and λ j = σ j o σ j f , which is the ratio of the error variance between the observed and first-guess field.
However, the spatial resolution of the LGC-corrected hourly radar QPE used in this study (0.01°) is much higher than that used by [15] (0.1°). In order to obtain the analysis at the target grid box, an influence range is first set at a given grid box and the deviation between the observed and first-guess precipitation field then corrected according to weight. If there is no observation in the given range, the analysis value at the target grid retains the value from the first-guess field. When each grid box in the research domain has been analyzed once, the resulting analysis is a blend of the first-guess and the observed precipitation. The essence of OI method is to properly define the weight, which is determined from the error variance, σ i f ( σ i o ), and error correlation, μ i j f ( μ i j o ), for the first-guess (observed) precipitation fields. However, the OI skill has been shown to be sensitive to error and error covariance, which are dependent on the spatiotemporal scale of the product and the precipitation value considered [15,31]. Therefore, at the hourly and 0.01° resolutions, errors for the gauge precipitation analysis and the local-gauge-corrected radar QPE need to be tuned regionally because they tend to be more localized.

3.3.1. Error Variance Estimate for the Radar QPE: σ i f

In the development of the hourly gauge-satellite merged precipitation analysis at the 0.1° × 0.1° grid box, the error is defined by limited samples at a specific region [15]. However, at the 0.01° × 0.01° grid box, the characteristics of precipitation and precipitation error are more regionally dependent, so the spatial dependence of the error for radar QPE needs to be accounted for first. Considering the hourly gauge-based precipitation analysis at the grid box with gauges as the “truth”, the regional error variances for the radar QPE were fitted at six sub-regions according to the climate division research of [32], as shown in Figure 7. In all six sub-regions, the error curves increased non-linearly with increasing precipitation and tended to be a multiplicative model [7,33]. However, the coefficients of the error fitting curves were different due to the different precipitation values in the six sub-regions. The error values for North, South, Southwest China and Jianghuai area were larger than those of Northeast and Northwest China.

3.3.2. Error Correlation Estimate for the Radar QPE: μ i j f

The error correlation for the first-guess field is defined as the correlation coefficient of the difference between the bias-corrected radar QPE and the gauge-based precipitation analysis at the grid box with gauges as the true value. We conducted the error correlation estimates for each of the six sub-regions, selecting a 0.7° × 0.7° window at the center grid to explore the relationship between the error correlation coefficient and the department distance between any two grids. The window was enlarged at an interval of 0.2° × 0.2° in order to guarantee that a sufficient number (more than 20 pairs) of no-zero rainfall samples was obtained. Error correlation coefficients decreased exponentially with distance, as shown in Figure 8. The correlation coefficient dropped to 1/e (about 0.37), representing the e-folding distance. The hourly e-folding distance for the satellite precipitation estimate was about 20 km at a sample region of 107°E–117°E and 25°N–35°N at the 0.1° resolution. At the 0.01° resolution, the error correlation coefficient for the radar QPE decreased exponentially with regional distance, and the e-folding distance was less than 10 km. A smaller e-folding distance value is indicative of a more localized precipitation event.

3.3.3. Error Estimate for the Observed Field: σ i o

In the process of interpolating from uneven point precipitation observations to the gridded analysis, the bias is supposed to be zero. However, random error arises from the spatial differences between the point and the grid box, known as the sampling error. The error can be quantified by comparing the difference between the gauge precipitation analysis and the “true” value in a high-density gauge network. Assuming that the error of the gauge-based precipitation analysis was regionally independent, they simulated the error at this target grid box to represent the error in the entire study area. However, due to the individual precipitation characteristics and gauge network densities over China, the assumption of regional independence for error of the gauge-based precipitation analysis is often inaccurate. The construction of the high-density AWS network in China provides an unprecedented opportunity to have multiple precipitation observations within a specific grid box because their average can be treated as the “true” value according to the research of [15]. In the existing gauge network, there are 13 grid boxes with more than three and up to six gauges in each when the grid resolution is 0.05°. Up to 14 and 43 gauges can be found at grid resolutions of 0.10° and 0.25°, respectively. The region covered by 28.5°–31.5°N and 116.5°–119.5°E was selected where four among the 13 grid boxes are located. The error of the hourly gauge-based precipitation analysis was quantified as a function of precipitation amount and gauge network density in this research area.
The gauge network density,   N e g , is introduced to represent the target grid box with its surrounding ones and is defined the same as in the research of [14]:
N e g = N g 0 + N g 1 / 8 + N g 2 / 32
where   N g 0 ,   N g 1   and   N g 2 represent the number of gauges inside the target grid box, the number of gauges surrounding the target grid box and the number of gauges one layer away, respectively. The values of N g 1   and   N g 2 can be considered the contribution of the surrounding gauges to the target grid box in the gridding process.
There are a total of 986 gauges in the research area with an average distance between a gauge and its most proximate neighbor being 9.5 km. The minimum threshold values for the number of gauges are 5, 10 and 28 at resolutions of 0.05°, 0.10° and 0.25°, respectively, when the arithmetic mean of gauge observations is assumed to be the “truth” within the grid box. The Monte Carlo method was used to randomly sample the gauge observations by generating a number of normally-distributed, randomly-assigned numbers ranging from 1–986, corresponding to the 986 gauges. Reordering the random numbers changes the related gauges accordingly. The number of gauges was randomly selected for 100, 200, 300, 400, 500, 600, 700, 800 and 900, respectively, and spatial interpolation was conducted 100 times for each case. The data for the period of June-August 2009–2011 were selected with a total of 6624 h. The gauge precipitation observations for each time step were gridded 900 times to ensure that there were sufficient samples to define the error of the gauge precipitation analysis as a function of gauge network density and precipitation amount. The gridded method is the same as that outlined in Section 3.
At a specific time, the error variance of gauge-based precipitation analysis at a grid box is calculated as the deviation square between the analysis from the randomly-sampled observations and the corresponding “truth” from the arithmetic mean of gauge observations. The parameter for the number of equivalent gauges can be defined as 1 / ( N e g + 1 ) . According to the value of the equivalent gauge number and the “truth” precipitation, several intervals were divided separately. The average of the error variance was plotted against each interval of the “truth” precipitation (Figure 8a) and the number of equivalent gauges (Figure 8b), respectively. Figure 9 shows that at a specific resolution, the error variance for the hourly gauge-based precipitation analysis increased with precipitation. When precipitation was ≥10.0 mm/h, the error increased non-linearly. Comparing the three resolutions, Figure 9 shows that error variance decreased with increasing precipitation when the grid resolution was changed from 0.05° to 0.25°. When the grid resolution was varied from 0.10°–0.25°, the error was significantly decreased. Moreover, at any given resolution, the error variance increased with gauge network density, 1 / ( N e g + 1 ) , meaning that error decreases as the number of gauges increases. For example, when N e g   was increased from one to two, the error variance of the gauge precipitation analysis was reduced by about 50% from 1.6 (mm/h)2 to 0.8 (mm/h)2 at the 0.05° and 0.10° resolutions and from about 1.0 (mm/h)2 to 0.5 (mm/h)2 at the 0.25° resolution.
The results displayed in Figure 9 show that the error variance of the hourly gauge precipitation analysis varies non-linearly and is proportional (inversely proportional) to precipitation (the number of equivalent gauges ( N e g )). The assumed error variance of the gauge-based precipitation analysis, written as a multiplicative model, is as follows:
E 2 = a R b [ 1 / ( N e g + 1 ) ] c
where E 2 represents the error variance of the hourly gauge precipitation analysis, R is the precipitation and 1 / ( N e g + 1 ) indicates the gauge network density. The coefficients, a, b and c, are obtained using the least squares method (minimizing the sum of square of error between the simulated and observed data) by fitting the samples at the given grid resolution, as shown in Table 3.
Using the fitting coefficients in Table 3, three plots were created to simulate the effects of precipitation, grid resolution and gauge network density on error variance of the gauge-based precipitation analysis, as shown in Figure 10. Here, N e g is selected to be 0, 1, 2 and 5, respectively. Consistent with the expected results, the simulation results showed that error variance of the hourly gauge precipitation analysis increased with precipitation. At the same level of precipitation, a larger N e g   value corresponded to a smaller error variance.

3.3.4. Error Correlation for the Observed Field: μ i j o

Assuming there is no correlation between gauge data errors at two different grid boxes, the observation error correlation can be defined as:
μ i j o = { 1 ( i = j ) 0 ( i j )
Actually, the error of the gauge-based analysis at grid i is correlated with grid j in the interpolation of the gauge observations. However, due to the high density of the gauge network over Eastern China, resulting in a searching radius less than 25 km, the error correlation of gauge data approximately met this formula.

4. Result

4.1. The Result of LGC

The greatest rainfall in China occurs in July. Based on the hourly gauge-based precipitation analysis developed in Section 3.2 for the period of July 2015 (a total of 744 h), the LGC scheme is applied to cross-validate the hourly radar- and satellite-based precipitation estimates at the 0.01° × 0.01° horizontal resolution. Figure 11, Figure 12 and Figure 13 show the spatial distribution of bias, RMSE and the correlation coefficient for the radar and satellite estimates with and without the LGC method. As can be seen in Figure 11, the bias of the radar and satellite estimates was region dependent and underestimated the precipitation without the LGC. The application of the LGC corrected the bias in the radar and satellite estimates, making them closer to the gauge precipitation analysis. Additionally, the RMSE of radar and satellite products was significantly reduced after the correction. As shown in Figure 12, the RMSE of the radar estimates was predominantly red, indicative of values greater than 3.0 mm/h. With the correction, the RMSE was predominantly green and yellow, indicative of values between 1.0 and 2.5 mm/h. A decrease in RMSE with the correction was similarly observed for the CMORPH, as shown in Figure 12. Prior to the application of the LGC, the correlation coefficient between the radar estimate and the gauge precipitation analysis showed dramatic regional variation, with values ranging from 0.3–0.6. Following the correction, the correlation coefficient reached as high as 0.9 (0.6) for the radar (satellite), as shown in Figure 13.
Table 4 shows the CV results for the whole month of July 2015, totaling 744 h with and without the LGC for the radar and CMORPH estimates. Prior to the correction, the bias of the CMORPH was less than that of the radar estimate. The relative bias of the CMORPH satellite precipitation product was −5.4%, while that of the radar QPE was −18.3%. The bias of the radar precipitation estimate was reduced from −18.3% without the LGC to 5.1% with the LGC. In addition, RMSE decreased and the correlation coefficient increased for both radar and satellite precipitation estimates following the application of the LGC. Actually, we also calculated the CV results for 04Z 1 July 2015 owing to the heavy rainfall occurred; the relatively bias (correlation coefficient) is −49.8% (0.182) before LGC, although it is improved to −15.8% (0.799) after LGC. Therefore, we think that the algorithm of the CMORPH product needs to be urgently updated in order to meet the weather application need.

4.2. Evaluation of the CMPA_1km

4.2.1. Selection of Matching Data Pairs

Several factors (such as wind) may cause gauge-observed precipitation to shift spatially, especially for high-resolution precipitation products, up to 0.01°. Therefore, the strategy of matching data pairs should consider this spatial displacement in the statistical analysis. In order to verify this idea, we designed three spatial windows using the hydrological station’s position as the target grid box: (1) at this target grid box (single grid box, wd0), (2) in the 3 × 3 window at the center of the target box (9nine grid boxes, wd1) and (3) in the 5 × 5 window at the center of the target box (25 grid boxes, wd2), to match the gauge-based precipitation analysis and radar QPE with the hydrological observed daily precipitation. In the three windows, the values closest to the hydrological observations were selected from the gauge analysis and radar QPE to calculate statistical metrics, including CC, RMSE and bias, between gauge analysis, radar QPE and hydrological observations. Figure 14, Figure 15 and Figure 16 show the time series of CC, RMSE and bias in the three windows, respectively. It can be seen from Figure 14 that there are obvious differences in the CC between the 3 × 3 and 5 × 5 windows and the single grid box. The CC for the 3 × 3 and 5 × 5 windows was larger than that for the single grid box. A trend was similarly observed with RMSE for both the gauge analysis (Figure 15a) and radar QPE (Figure 15b), where RMSE for the 3 × 3 and 5 × 5 windows was consistently lower than that at the single grid box. For the time series of bias, the gauge analysis was more affected by the sampling window (Figure 16a) than radar QPE (Figure 16b). These results indicate that the statistical metrics of gauge precipitation analysis and radar QPE, especially CC and RMSE, at the 0.01° resolution are influenced by the sampling windows. The effect of the sampling window and localized precipitation on the accuracy of the product can be considered together in the statistical evaluation. Therefore, in this study, the 3 × 3 window was designed to match the gauge, radar and satellite precipitation estimates with the hydrological observations.

4.2.2. Evaluations in Heavy Rainfall Events

Using the LGC-OI methods and the newly-defined regional error parameters in Section 3, we first corrected the bias for the radar QPE and CMORPH products using the LGC method. Then, we merged the bias-corrected radar QPE with the gauge-based analysis to generate an hourly merged precipitation product with a horizontal resolution of 0.01° from January–December 2015. Finally, the bias-corrected CMOPRH product was used to fill gaps not covered by either gauge or radar QPE.
Influenced by a high-altitude trough and a low-level shear, a heavy rainstorm occurred in the region of north-central Guangxi province, south-central Hunan province, north-central Jiangxi province and most of Zhejiang province in China from 8–9 June 2015. Figure 17 exhibits the 0.01° spatial distribution of the precipitation event at 11Z on 8 June 2015 as depicted by the gauge-based precipitation analysis (Figure 17a), radar QPE (Figure 17b), CMORPH product (Figure 17c) and the gauge-radar-satellite merged precipitation product (Figure 17d). Each precipitation product effectively captured the rainfall belt in Southeast China very well. However, the CMORPH product underestimated precipitation. Radar QPE provided a better precipitation distribution compared to the gauge-based precipitation analysis, but still experienced incomplete spatial coverage, especially in the large majority of Western China (west of 100°E), north of Inner Mongolia and Heilongjiang province. The gauge-radar-satellite merged 0.01° precipitation product depicts a more detailed rain belt and full spatial coverage, reflecting the characteristics of the high-resolution precipitation product and achieving the goal of the multi-source measured precipitation combination.
Using the hydrological station precipitation observations as an independent data source, the evaluation metrics for individual precipitation products at the 1-km, 6-h resolution were calculated during the heavy rainfall event from 8–9 June 2015, as shown in Table 5. The CC of CMPA-1km was 0.8821, which was the highest among the gauge, radar and satellite precipitation products. The RMSE of CMPA-1km was 2.1580 mm/6 h, which was the lowest of all ground, radar and satellite precipitation measurements. CMORPH had the smallest mean bias (0.0583 mm/6 h) and relative bias (5.15%) compared to gauge, radar QPE and CMPA-1km products. The results indicate that the CMORPH precipitation product has a tendency to either overestimate or underestimate precipitation, depending on the region and season [6]. This over- and under-estimation offsets the bias, which then tends to have a value close to zero. The CC (RMSE) of the radar QPE was higher (lower) than that of the CMORPH product, indicating that radar QPE may be superior for monitoring heavy rainfall. Using the independent precipitation observations, Wu et al. [34] examined the performance of the MRMS product developed by NSSL at a 6-h and 1-km resolution over the CONUS (CONtinental United States). The CC was 0.855, and the RMSE was 2.1 mm/6 h, which indicates that the MRMS product has the same level of accuracy as the CMPA-1km product over China.

4.2.3. Evaluations in Summer and Winter Seasons

The statistical indexes of gauge analysis, radar QPE, CMORPH and CMPA-1km in the summer and winter seasons were calculated at a 6-h temporal resolution, as shown in Table 6. Generally, the result in the summer was better than that in the winter. For example, the CC of CMPA-1km was 0.80 (0.93), and the relative bias was 18.36% (−4.71%) in the winter (summer). ETS and TS for CMPA-1km were almost at the same level, but the POD and FAR were seasonally dependent. POD (FAR) for CMPA-1km was 0.8 was (0.15) in the winter and 0.83 (0.18) in the summer. In addition, comparison with individual precipitation measurements showed that the gauge-based precipitation analysis was the closest to the hydrological station observations. The RMSE and bias of the gauge-based precipitation analysis were the smallest among those of CMPA-1km, radar QPE and CMORPH products for both the summer and winter. For example, in the summer, the RMSE was 1.7984 mm/6h, and the bias was −0.0146 mm/6 h. The CC of the gauge-based precipitation analysis in the summer was 0.9418, which is higher than that of the CMPA-1km (0.9257), radar QPE (0.7416) and CMORPH products (0.5324). Therefore, in view of the RMSE, bias and CC values, the accuracy of the gauge precipitation analysis is higher than that of the CMPA-1km, radar QPE and CMORPH products. This can be partially explained by the fact that the MWR stations used in this study are mainly distributed in Southeast China (Figure 2), where the automatic weather stations have the highest density [15]. However, the gauge-based precipitation analysis is not able to accurately capture the precipitation structure over Northwest and Northeast China, especially in the Tibetan Plateau, because of the uneven and limited distribution of gauges. Although RMSE, bias and CC for CMPA-1km are less accurate than those for the gauge analysis, CMPA-1km has advantages in depicting precipitation structures owing to its relatively complete spatial coverage for the precipitation field. Therefore, it is essential to develop some parameters that can be used to characterize the high-resolution precipitation structure, which will enhance the assessment of precipitation structures. In addition, the radar QPE products showed an overestimation of 4.48% for the winter precipitation and an underestimation of up to −35.11% for summer precipitation. Further examination of the spatial distribution of the radar QPE showed that the overestimation in the winter is mainly related to local precipitation in South China. For example, the gauge-observed precipitation was 6 mm/h on 4 December 2015, while the precipitation from the radar QPE was up to 20–25 mm/h. It is also noted that although CC and RMSE for CMORPH are not as good as radar QPE, bias for the CMORPH product is only 0.1300 mm/6 h in the summer. The RMSE and bias for CMORPH are relatively large in the winter due to its limited capability to detect light and solid precipitation [35].
In terms of the indexes that can be used to express the accuracy of the precipitation location, the values of ETS, TS and POD for gauge analysis, radar QPE, CMORPH and CMPA-1km products are equal to 1.0, and FAR is equal to 0.0 when the precipitation threshold is selected to be 0.0 mm, indicating that these products are able to capture the precipitation area very well (results not shown). Table 6 only shows the results when the threshold value was 1.0 mm. The values of TS and POD for the individual precipitation product were relatively higher in summer than those in winter. For example, the TS value for CMORPH increased from 0.30 in winter to 0.41 in summer, and the POD value for CMPA-1km increased from 0.80 in winter to 0.83 in summer. However, the FAR value for all precipitation products was higher in summer than that in winter. For instance, FAR values for CMPA-1km were 0.15 in winter and 0.18 in summer, which were dramatically lower than the related values for radar QPE (0.28 in winter and 0.29 in summer) and CMORPH (0.20 in winter and 0.44 in summer) and similar to the values for gauge analysis (0.13 in winter and 0.15 in summer).

4.2.4. Evaluations over Different Regions

Evaluations for individual precipitation products were conducted over the three sub-regions, as defined in Figure 2, during summer and winter (Table 7). The performance of the four precipitation products indicated seasonal and regional dependence. Over Region I, the CC and relative bias for the four products were invalid in winter because observed precipitation at the hydrological stations and the CMORPH precipitation were both 0.0 mm, resulting in RMSE and bias values of zero. During the summer, the radar QPE performed better in Region II than in Regions I and III, where the CC was 0.7771 and relative bias was −12.0%. However, the CC (relative bias) for the CMORPH product was 0.4551 (26.13%) in Region II, which was lower than that in Region I (0.5746 (−11.77%)) and Region III (0.5540 (8.70%)). The performance of CMPA-1km in Region III had a higher CC (0.9388 in summer and 0.8771 in winter) and lower RMSE (2.1545 mm/6 h in summer and 1.3662 mm/6 h in winter) and bias (−0.0476 mm/6 h in summer and 0.1266 mm/6 h in winter) than radar QPE and CMORPH. The accuracy of CMPA-1km is almost the same as that of gauge analysis, but CMPA-1km has the advantage of seamless spatial coverage.

4.2.5. Evaluations of Precipitation Area

ETS, TS, POD and FAR with different precipitation threshold values (0.1, 5.0, 10.0, 20.0, 30.0, 40.0 and 50.0 mm/6 h) were calculated for the gauge analysis, radar QPE, CMORPH and CMPA-1km in 2015 at a 6-h temporal resolution, as shown in Figure 18. The results indicate that these indices for the four products are dependent on the precipitation threshold values. With an increase in threshold values, ETS, TS and POD tended to decrease, while FAR increased slightly. The values of the gauge analysis and CMPA-1km were much closer and significantly better than those of radar QPE and CMORPH. In addition, when the precipitation threshold value was selected to be 5.0 mm/6 h, the radar QPE had higher ETS and TS values than CMORPH. When the precipitation threshold value was 10.0 mm/6 h, the ETS and TS values of radar QPE and CMORPH were very close. When the precipitation threshold value was greater than 10.0 mm/6 h, CMORPH performed better than radar QPE. However, POD and FAR values of CMORPH were larger than those of radar QPE regardless of the precipitation threshold value, which indicates that CMORPH tends to have a greater precipitation spatial coverage.

5. Conclusions and Future Research Recommendations

The merging algorithm for the high-resolution, multi-source precipitation analysis is needed to correct the drawbacks and enhance the advantages of individual precipitation measurements. In this study, we propose an hourly merging strategy at the 0.01° × 0.01° horizontal resolution to combine the gauge-based precipitation analysis, radar QPE and downscaled CMORPH product.
A simplified optimal interpolation (OI) scheme was employed to interpolate the hourly gauge observations to a gauge-based precipitation analysis at the 0.01° lat./lon. grid. We improved the regional searching radius and the number of influence gauges at three sub-regions in China and concluded that there should be at least four gauges, preferably between five and seven, to obtain a gauge analysis at a given grid box and maximum search radii of about 25 km, 12 km and 50 km in the three sub-regions, respectively.
The merging step was then applied to correct the bias inherent in the radar QPE and satellite precipitation estimate using the local gauge correction (LGC) method developed by [17]. After the LGC processing, the bias of radar QPE and satellite CMORPH was significantly reduced. The bias-corrected radar QPE, as the first-guess field, was then combined with the gauge analysis, as the observed field, through the OI scheme [14,15]. An improved treatment of the parameters in OI was conducted regionally in three steps.
Supported by ground observations measured at 208 hydrological stations over mainland China, the experimental CMPA-1km dataset from 1 January–31 December 2015 was evaluated at 6-h temporal resolutions and 0.03° × 0.03° spatial resolution and compared with CMORPH, radar QPE and gauge analysis. The results indicate that: (1) the accuracy of this new dataset is obviously better than CMORPH and radar QPE; and (2) although the CMPA-1km did not show superior performance compared to gauge analysis, the former is more capable of estimating heavy precipitation and monitor precipitation over remote and mountainous regions with a sparse and unevenly-distributed rain gauge network.
The hourly, 0.01° merging technique proposed in the paper is still highly uncertain in regions with sparse data, mainly in Western China and the Tibetan Plateau. In terms of future high-resolution merging algorithm development, there are two competing strands. The first concentrates on improving the radar QPE through the development of quality-control for the radar base data over China in the real-time application and in retrospective processing from 2008 onwards for the climatic application. The Multi-Radar/Multi-Sensor (MRMS) system [16] has provided a good prototype from which to learn. The second aims to comprehensively use multiple-source measurements related to precipitation and the numerical weather or hydrological models to improve the analyzed or assimilated techniques in regions with sparse data [36]. The parameters of OI will be adjusted when new datasets are introduced to minimize the potential uncertainty brought by them. Besides, more attention will be paid to how to generate a more accurate first-gauss field of OI under the support of numerical weather or hydrological models.

Acknowledgments

We would like to thank P. Xie of the NOAA Climate Prediction Center for helping in our research and for providing programs of the OI merging method for the daily precipitation product, as well as Anyuan Xiong, Zijiang Zhou, Junxia Gu and Chunxiang Shi at the National Meteorological Information Center of the China Meteorological Administration for their encouragement and support of this work. Special thanks to Shiguang Xu at the Institute of Remote Sensing and Digital Earth Chinese Academy of Sciences for supporting the publishment of this paper. This work was funded by National Science Foundation of China Major Research Program (91437214), the National Innovation Project for Meteorological Science and Technology: “Quality Control, Fusion, and Reanalysis of Meteorological Observations”.

Author Contributions

Yan Shen, Yang Pan and Jingjing Yu conceived and designed the experiments; Yan Shen performed the experiments, analyzed the data and wrote the original version; Zhen Hong and Lane Maguire polished the document.

Conflicts of Interest

The authors declare no conflict of interest.

References

  1. Tang, G.; Zeng, Z.; Ma, M.; Liu, R.; Wen, Y.; Hong, Y. Can near-real-time satellite precipitation products capture rainstorms and guide flood warning for the 2016 summer in South China? IEEE Geosci. Remote Sens. Lett. 2017, 14, 1208–1212. [Google Scholar] [CrossRef]
  2. Kursinski, A.L.; Mullen, S.L. Spatiotemporal variability of hourly precipitation over the eastern contiguous United States from stage iv multisensor analyses. J. Hydrometeorol. 2008, 9, 3–21. [Google Scholar] [CrossRef]
  3. Battan, L.J. Radar observations of the atmosphere. Atmos. Phys. 1973, 99, 324. [Google Scholar] [CrossRef]
  4. Joyce, R.J.; Janowiak, J.E.; Arkin, P.A.; Xie, P. Cmorph 8 km: A method that produces global precipitation estimates from passive microwave and infrared data at high spatial and temporal resolution. J. Hydrometeorol. 2004, 5, 487–503. [Google Scholar] [CrossRef]
  5. Xie, P.; Joyce, R.; Wu, S.; Yoo, S.H.; Yarosh, Y.; Sun, F.; Lin, R. Reprocessed, bias-corrected cmorph global high-resolution precipitation estimates from 1998. J. Hydrometeorol. 2017, 18, 1617–1641. [Google Scholar] [CrossRef]
  6. Shen, Y.; Xiong, A.; Wang, Y.; Xie, P. Performance of high-resolution satellite precipitation products over China. J. Geophys. Res. Atmos. 2010, 115. [Google Scholar] [CrossRef]
  7. Tian, Y.; Huffman, G.J.; Adler, R.F.; Tang, L.; Sapiano, M.; Maggioni, V.; Wu, H. Modeling errors in daily precipitation measurements: Additive or multiplicative? Geophys. Res. Lett. 2013, 40, 2060–2065. [Google Scholar] [CrossRef]
  8. Smith, J.A.; Krajewski, W.F. Estimation of the mean field bias of radar rainfall estimates. J. Appl. Meteorol. 1991, 30, 397–412. [Google Scholar] [CrossRef]
  9. Seo, D.J.; Breidenbach, J.P. Real-time correction of spatially nonuniform bias in radar rainfall data using rain gauge measurements. J. Hydrometeorol. 2002, 3, 93–111. [Google Scholar] [CrossRef]
  10. Chumchean, S.; Seed, A.; Sharma, A. Correcting of real-time radar rainfall bias using a kalman filtering approach. J. Hydrol. 2006, 317, 123–137. [Google Scholar] [CrossRef]
  11. Ebert, E.E.; Janowiak, J.E.; Kidd, C. Comparison of near-real-time precipitation estimates from satellite observations. Bull. Am. Meteorol. Soc. 2007, 88, 47–64. [Google Scholar] [CrossRef]
  12. Huffman, G.A.; Adler, R.; Bolvin, D.T.; Gu, G.; Nelkin, E.; Bowman, K.; Hong, Y.; Stocker, T.; Wolff, D. The trmm multi-satellite precipitation analysis (tmpa): Quasi-global, multiyear, combined-sensor precipitation estimates at fine scale. J. Hydrometeorol. 2007, 8, 38–55. [Google Scholar] [CrossRef]
  13. Tian, Y.D.; Peterslidard, C.D.; Eylander, J.B. Real-time bias reduction for satellite-based precipitation estimates. J. Hydrometeorol. 2010, 11, 1275–1285. [Google Scholar] [CrossRef]
  14. Xie, P.; Xiong, A.Y. A conceptual model for constructing high-resolution gauge-satellite merged precipitation analyses. J. Geophys. Res. Atmos. 2011, 116. [Google Scholar] [CrossRef]
  15. Shen, Y.; Zhao, P.; Pan, Y.; Yu, J. A high spatiotemporal gauge-satellite merged precipitation analysis over China. J. Geophys. Res. Atmos. 2014, 119, 3063–3075. [Google Scholar] [CrossRef]
  16. Zhang, J.; Howard, K.; Langston, C.; Kaney, B.; Qi, Y.; Tang, L.; Grams, H.; Wang, Y.; Cocks, S.; Martinaitis, S. Multi-radar multi-sensor (mrms) quantitative precipitation estimation: Initial operating capabilities. Bull. Am. Meteorol. Soc. 2016, 97, 621–638. [Google Scholar] [CrossRef]
  17. Zhang, J.; Howard, K.; Langston, C.; Vasiloff, S.; Kaney, B.; Arthur, A.; Van Cooten, S.; Kelleher, K.; Kitzmiller, D.; Ding, F. National mosaic and multi-sensor qpe (nmq) system: Description, results, and future plans. Bull. Am. Meteorol. Soc. 2015, 92, 1321–1338. [Google Scholar] [CrossRef]
  18. Derin, Y.; Anagnostou, E.; Kalogiros, J.; Anagnostou, M. Passive microwave rainfall error analysis using high-resolution x-band dual-polarization radar observations in complex terrain. In Proceedings of the European Geosciences Union General Assembly Conference, Vienna, Austria, 12–17 April 2015. [Google Scholar]
  19. Anagnostou, M.N.; Kalogiros, J.; Nikolopoulos, E.; Derin, Y.; Anagnostou, E.N.; Borga, M. Satellite Rainfall Error Analysis with the Use of High-Resolution X-Band Dual-Polarization Radar Observations over the Italian Alps; Springer International Publishing: Cham, Switzerland, 2017. [Google Scholar]
  20. Xu, S.; Shen, Y.; Du, Z. Tracing the source of the errors in hourly imerg using a decomposition evaluation scheme. Atmosphere 2016, 7, 161. [Google Scholar] [CrossRef]
  21. Zhihua, R.; Ping, Z.; Qiang, Z.; Zhang, Z.; Cao, L.; Yang, Y.; Zou, F.; Zhao, Y.; Zhao, H.; Zhe, C.; et al. Quality control procedures for hourly precipitation data from automatic weather stations in China. Meteorol. Mon. 2010, 36, 123–132. [Google Scholar]
  22. Ren, Z.; Zhang, Z.; Sun, C.; Liu, Y.; Jun, L.I.; Xiaohui, J.U.; Zhao, Y.; Zhipeng, L.I.; Zhang, W.; Hongkang, L.I. Development of three-step quality control system of real-time observation data from aws in China. Meteorol. Mon. 2015, 41, 1268–1277. [Google Scholar]
  23. Liu, X.; Yang, H.; Li, J.; Li, B.; Zhao, K.; Zheng, Y. Cinrad radar quantitative precipitation estimation group system. Meteorol. Mon. 2010, 4, 90–95. [Google Scholar]
  24. Simanton, J.R.; Osborn, H.B. Reciprocal-distance estimate of point rainfall. J. Hydraul. Div. 1980, 106, 1242–1246. [Google Scholar]
  25. Xie, P.; Yatagai, A.; Chen, M.; Hayasaka, T.; Fukushima, Y.; Liu, C.; Yang, S. A gauge-based analysis of daily precipitation over East Asia. J. Hydrometeorol. 2007, 8, 607–626. [Google Scholar] [CrossRef]
  26. Shen, Y.; Xiong, A. Validation and comparison of a new gauge-based precipitation analysis over mainland China. Int. J. Climatol. 2016, 36, 252–265. [Google Scholar] [CrossRef]
  27. Gandin, L.S. Objective Analysis of Meteorological Fields; Gidromet: Almaty, Kazakhstan, 1963; 242p. [Google Scholar]
  28. Chen, M.; Shi, W.; Xie, P.; Silva, V.B.S.; Kousky, V.E.; Wayne Higgins, R.; Janowiak, J.E. Assessing objective techniques for gauge-based analyses of global daily precipitation. J. Geophys. Res. Atmos. 2008, 113. [Google Scholar] [CrossRef]
  29. Daly, C.; Neilson, R.P.; Phillips, D.L. A statistical-topographic model for mapping climatological precipitation over mountainous terrain. J. Appl. Meteorol. 1994, 33, 140–158. [Google Scholar] [CrossRef]
  30. Wang, S.; Pei, C.; Guo, Z. Evaluations on Chinese next generation radars coverage and terrain blockage based on srtm data. Clim. Environ. Res. 2011, 16, 459–468. [Google Scholar]
  31. Hong, Y.; Hsu, K.L.; Moradkhani, H.; Sorooshian, S. Uncertainty quantification of satellite precipitation estimation and monte carlo assessment of the error propagation into hydrologic response. Water Resour. Res. 2006, 42, 2643–2645. [Google Scholar] [CrossRef]
  32. Shi, X.H.; Xu, X.D. Regional characteristics of the interdecadal turning of winter/summer climate modes in Chinese mainland. Chin. Sci. Bull. 2007, 52, 101–112. [Google Scholar] [CrossRef]
  33. Ciach, G.J.; Krajewski, W.F.; Villarini, G. Product-error-driven uncertainty model for probabilistic quantitative precipitation estimation with nexrad data. J. Hydrometeorol. 2007, 8, 1325–1347. [Google Scholar] [CrossRef]
  34. Wu, W.; Kitzmiller, D.; Wu, S. Evaluation of radar precipitation estimates from the national mosaic and multisensor quantitative precipitation estimation system and the wsr-88d precipitation processing system over the conterminous United States. J. Jpn. Soc. Hydrol. Water Resour. 2012, 13, 1080–1093. [Google Scholar] [CrossRef]
  35. Huffman, G.J. The global precipitation measurement (gpm) mission: An overview. Bull. Am. Meteorol. Soc. 2008, 95, 701–722. [Google Scholar]
  36. Shen, Y.; Xiong, A.; Hong, Y.; Yu, J.; Pan, Y.; Chen, Z.; Saharia, M. Uncertainty analysis of five satellite-based precipitation products and evaluation of three optimally merged multi-algorithm products over the tibetan plateau. Int. J. Remote Sens. 2014, 35, 6843–6858. [Google Scholar] [CrossRef]
Figure 1. (a) Spatial distribution of about 40,000 Automatic Weather Station (AWS) (red point) and three sub-regions, (b) AWS observed hourly precipitation at 02 UTC 8 June 2015 and (c) time series of correct and dubious AWS numbers from 00 UTC 1 July to 23Z 31 July 2015.
Remotesensing 10 00264 g001aRemotesensing 10 00264 g001b
Figure 2. Spatial distribution of the 208 hydrological stations (red points). The two blue lines correspond to the annual 800-mm and 400-mm precipitation contours, which are used to divide China into three sub-regions: Reg. I, Reg. II and Reg. III.
Remotesensing 10 00264 g002
Figure 3. Scatter plots between the (a) correlation coefficient, (b) bias and (c) root mean square error (RMSE) and the distance from the hydrological station to its nearest benchmark station.
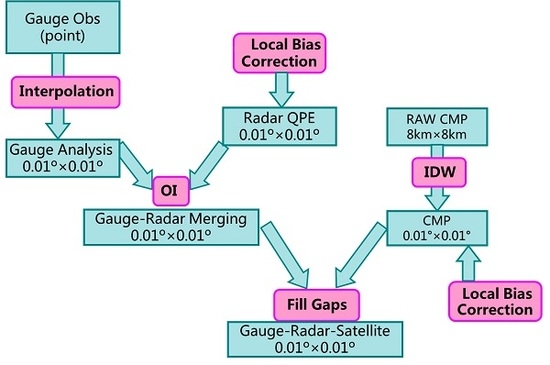
Remotesensing 10 00264 g003
Figure 4. Flowchart of the hourly gauge-radar-satellite precipitation merging algorithm at the 0.01 degree lat./lon. grid box. In this figure, the term Gauge Obs, ‘CMP’ and ‘QPE‘ mean the gauge precipitation observations, CMORPH satellite precipitation dataset and the quantitative precipitation estimation derived from weather radar.
Remotesensing 10 00264 g004
Figure 5. Time series of (a) correlation coefficient and (b) RMSE (mm/6 h) of radar (Rrain, red line) and satellite (Srain, black line) precipitation products at the 6-h temporal interval from June–August 2015.
Remotesensing 10 00264 g005
Figure 6. Curves for RMSE and the number of influence gauges with the increasing number of gauges over Reg. I (a), II (b) and III (c), respectively, in China.
Remotesensing 10 00264 g006
Figure 7. Error variance curves for the hourly radar QPE with precipitation at the 0.01° × 0.01° resolution in the six sub-regions in China. (a) Northeast (east of 110°E, north of 42.5°N), (b) north (east of 110°E, 35°N~42.5°N), (c) Jianghuai (east of 107.5°E, 27.5°N~35°N), (d) south (east of 107.5°E, south of 27.5°N), (e) southwest (97.5°E~107.5°E, south of 35°N) and (f) east of northwest (97.5°E~110°E, north of 35°N) (Shi and Xu, 2006).
Remotesensing 10 00264 g007aRemotesensing 10 00264 g007b
Figure 8. Same as Figure 7, but for the error correlation coefficient of the radar QPE with the distance between any two points.
Remotesensing 10 00264 g008
Figure 9. Error variances for the hourly gauge-based precipitation analysis under the different (a) gauge “truth” precipitation and (b) gauge network density at the 0.05° (blue line), 0.10° (red line) and 0.25° (green line) resolution. In this figure, Neg means the number of equivalent gauges.
Remotesensing 10 00264 g009
Figure 10. Simulated error variances changing with the precipitation and the gauge network density at the three grid resolutions of (a) 0.05°, (b) 0.10° and (c) 0.25°.
Remotesensing 10 00264 g010
Figure 11. Spatial distribution of bias with and without local bias correction for radar (a,b) and satellite (c,d) at 0.01 degree lat./lon. grid.
Remotesensing 10 00264 g011
Figure 12. The same as Figure 11, but for RMSE.
Remotesensing 10 00264 g012
Figure 13. The same as Figure 11, but for correlation coefficient.
Remotesensing 10 00264 g013
Figure 14. (a) Time series of correlation coefficients between the hydrological precipitation observations and gauge precipitation analysis (Grain); (b) time series of correlation coefficients between the hydrological precipitation observations and radar QPE (Rrain) and at the three sampling windows, wd0, wd1 and wd2, respectively, from June–August 2015.
Remotesensing 10 00264 g014
Figure 15. Same as Figure 14, but for RMSE.
Remotesensing 10 00264 g015
Figure 16. Same as Figure 14, but for bias.
Remotesensing 10 00264 g016
Figure 17. Spatial distribution of the precipitation event occurred at 11Z 8 June 2015 with the resolution of 0.01°depicted by (a) gauge-based precipitation analysis (gauge analysis), (b) radar QPE, (c) Original CMORPH product (Orig_CMPH) and (d) the gauge-radar-satellite merged precipitation product (merged) (unit: mm/h).
Remotesensing 10 00264 g017
Figure 18. Values of ETS, TS, POD and FAR for gauge analysis, radar QPE, CMORPH and CMPA-1km products at a 6-h temporal resolution in 2015 with different precipitation threshold values.
Remotesensing 10 00264 g018
Table 1. Statistical metrics for daily precipitation between the hydrological station (MWR Precip.) and its nearest benchmark station (Benchmark Precip.) at three time scales.
MWR Precip. (mm/d)Benchmark Precip. (mm/d)CCRMSE (mm/d)Bias (mm/d)Sample Number
Annual mean3.3653.7280.8575.686−0.36274,390
Warm Season
(May–September)
5.0925.4690.8397.803−0.37631,249
Cold Season (October–April)2.1142.4670.8953.412−0.35243,141
Table 2. Contingency table for comparing individual precipitation products ( p ) with the hydrological precipitation observations (g). The rainfall thresholds in this paper are 0.1, 1.0, 5.0, 10.0, 20.0, 30.0, 40.0 and 50.0 mm/6 h.
p   ≥ Threshold p   < Threshold
g ≥ ThresholdHits (H)Misses (M)
g < ThresholdFalse alarms (F)Correct negatives (C)
Table 3. Fitting coefficients, a, b and c, at grid resolutions of 0.05°, 0.10° and 0.25°, respectively.
abc
0.05°2.731.130.28
0.10°2.431.080.17
0.25°1.741.190.31
Table 4. Cross-validation results for the radar and satellite estimates with and without the LGC.
Radar QPECMORPH
Without LGCWith LGCWithout LGCWith LGC
Bias (mm/h)−0.3400.095−0.1080.208
Relative Bias (%)−18.35.100−5.40010.400
RMSE (mm/h)4.4472.2194.9312.798
CC0.4240.8790.3240.828
Table 5. Evaluation metrics of individual precipitation observations during the heavy rainfall event that occurred on 8–9 June 2015. NSSL, National Severe Storms Laboratory; MRMS, Multi-Radar/Multi-Sensor.
CCRMSE (mm/6 h)Bias (mm/6 h)Relative Bias (%)
Gauge Analysis0.8432.6430.50644.61
Radar QPE0.5123.687−0.374−32.95
CMORPH0.4743.9040.0585.15
CMPA-1km0.8822.1580.26323.19
NSSL MRMS (1 km)0.8552.1------
Table 6. Evaluation metrics of individual precipitation observations in summer and winter seasons at a 6-h temporal resolution. The threshold value is 1.0 mm. ETS, equitable threat score; POD, probability of detection.
Winter (December–February)Summer (June–August)
CCRMSE (mm/6 h)Bias (mm/6 h)Relative Bias (%)CCRMSE (mm/6 h)Bias (mm/6 h)Relative Bias (%)
Gauge Analysis0.87051.11890.066012.040.94181.7984−0.0146−1.37
Radar QPE0.67891.79500.02464.480.74163.8509−0.3727−35.11
CMORPH0.44731.9252−0.3461−63.150.53245.13220.130012.24
CMPA-1km0.79981.44680.100618.360.92572.0446−0.0500−4.71
Winter (December–February)Summer (June–August)
ETSTSPODFARETSTSPODFAR
Gauge Analysis0.720.740.830.130.700.740.840.15
Radar QPE0.460.510.630.280.490.550.700.29
CMORPH0.270.300.330.200.350.410.610.44
CMPA-1km0.670.700.800.150.670.710.830.18
Table 7. Evaluation metrics of individual precipitation observations in summer and winter seasons over three sub-regions at a 6-h temporal resolution.
Region IWinter (December–February)Summer (June–August)
CCRMSEBiasRelative Bias (%)CCRMSEBiasRelative Bias (%)
(mm/6 h)(mm/6 h)(mm/6 h)(mm/6 h)
Gauge analysis--0.1630.015--0.9261.268−0.052−7.37
Radar QPE--1.0760.093--0.7152.311−0.147−20.86
CMORPH--0.0000.000--0.5752.736−0.083−11.77
CMPA-1km--1.0770.098--0.8981.4490.0081.19
Region IIWinter (December–February)Summer (June–August)
CCRMSEBiasRelative Bias (%)CCRMSEBiasRelative Bias (%)
(mm/6 h)(mm/6 h)(mm/6 h)(mm/6 h)
Gauge analysis0.7250.1650.01358.940.8961.741−0.060−7.98
Radar QPE0.6120.2130.025111.800.7772.544−0.091−12.00
CMORPH0.0330.318−0.002−7.640.4554.3680.19826.13
CMPA-1km0.7040.1780.01775.530.8721.934−0.061−8.07
Region IIIWinter (December–February)Summer (June–August)
CCRMSEBiasRelative Bias (%)CCRMSEBiasRelative Bias (%)
(mm/6 h)(mm/6 h)(mm/6 h)(mm/6 h)
Gauge analysis0.9161.0900.09311.010.9531.8720.0171.32
Radar QPE0.7461.9040.0030.360.7434.550−0.560−43.89
CMORPH0.4742.313−0.529−62.410.5545.6980.1118.70
CMPA-1km0.8771.3660.12714.930.9392.155−0.048−3.73

