Next Issue
Volume 10, March
Previous Issue
Volume 10, January
 
 
remotesensing-logo

Journal Browser

Journal Browser

Remote Sens., Volume 10, Issue 2 (February 2018) – 201 articles

Cover Story (view full-size image): 
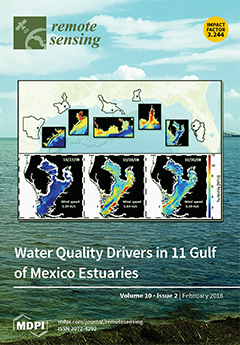
Estuarine water quality is not static, but rather fluctuates on daily to interannual time scales depending on the forces driving it. Identifying the drivers of water quality across estuaries has been an elusive goal of researchers and managers. Doing so requires a time series of frequent and synoptic sampling to capture short- and long-term variability over a large area. All 11 National Estuary Program (black outlines) estuaries of the US Gulf of Mexico were mapped for a water quality proxy (Rrs645), representing turbidity, from 2000–2014 using near-daily MODIS satellite imagery. These whole-estuary time series of water quality were then compared with observations of eight environmental drivers on weekly to annual time scales. Statistical relationships identified wind speed (bottom panel example) as the most consistent driver of water quality variability across estuaries and time scales. View this paper
  • Issues are regarded as officially published after their release is announced to the table of contents alert mailing list.
  • You may sign up for e-mail alerts to receive table of contents of newly released issues.
  • PDF is the official format for papers published in both, html and pdf forms. To view the papers in pdf format, click on the "PDF Full-text" link, and use the free Adobe Reader to open them.
Order results
Result details
Section
Select all
Export citation of selected articles as:
23 pages, 20794 KiB  
Article
Matching of Remote Sensing Images with Complex Background Variations via Siamese Convolutional Neural Network
by Haiqing He, Min Chen, Ting Chen and Dajun Li
Remote Sens. 2018, 10(2), 355; https://doi.org/10.3390/rs10020355 - 24 Feb 2018
Cited by 70 | Viewed by 7380
Abstract
Feature-based matching methods have been widely used in remote sensing image matching given their capability to achieve excellent performance despite image geometric and radiometric distortions. However, most of the feature-based methods are unreliable for complex background variations, because the gradient or other image [...] Read more.
Feature-based matching methods have been widely used in remote sensing image matching given their capability to achieve excellent performance despite image geometric and radiometric distortions. However, most of the feature-based methods are unreliable for complex background variations, because the gradient or other image grayscale information used to construct the feature descriptor is sensitive to image background variations. Recently, deep learning-based methods have been proven suitable for high-level feature representation and comparison in image matching. Inspired by the progresses made in deep learning, a new technical framework for remote sensing image matching based on the Siamese convolutional neural network is presented in this paper. First, a Siamese-type network architecture is designed to simultaneously learn the features and the corresponding similarity metric from labeled training examples of matching and non-matching true-color patch pairs. In the proposed network, two streams of convolutional and pooling layers sharing identical weights are arranged without the manually designed features. The number of convolutional layers is determined based on the factors that affect image matching. The sigmoid function is employed to compute the matching and non-matching probabilities in the output layer. Second, a gridding sub-pixel Harris algorithm is used to obtain the accurate localization of candidate matches. Third, a Gaussian pyramid coupling quadtree is adopted to gradually narrow down the searching space of the candidate matches, and multiscale patches are compared synchronously. Subsequently, a similarity measure based on the output of the sigmoid is adopted to find the initial matches. Finally, the random sample consensus algorithm and the whole-to-local quadratic polynomial constraints are used to remove false matches. In the experiments, different types of satellite datasets, such as ZY3, GF1, IKONOS, and Google Earth images, with complex background variations are used to evaluate the performance of the proposed method. The experimental results demonstrate that the proposed method, which can significantly improve the matching performance of multi-temporal remote sensing images with complex background variations, is better than the state-of-the-art matching methods. In our experiments, the proposed method obtained a large number of evenly distributed matches (at least 10 times more than other methods) and achieved a high accuracy (less than 1 pixel in terms of root mean square error). Full article
(This article belongs to the Special Issue Multisensor Data Fusion in Remote Sensing)
Show Figures

Graphical abstract

26 pages, 5527 KiB  
Article
Snow Density and Ground Permittivity Retrieved from L-Band Radiometry: Melting Effects
by Mike Schwank and Reza Naderpour
Remote Sens. 2018, 10(2), 354; https://doi.org/10.3390/rs10020354 - 24 Feb 2018
Cited by 22 | Viewed by 4702
Abstract
Ground permittivity and snow density retrievals for the “snow-free period”, “cold winter period”, and “early spring period” are performed using the experimental L-band radiometry data from the winter 2016/2017 campaign at the Davos-Laret Remote Sensing Field Laboratory. The performance of the single-angle and [...] Read more.
Ground permittivity and snow density retrievals for the “snow-free period”, “cold winter period”, and “early spring period” are performed using the experimental L-band radiometry data from the winter 2016/2017 campaign at the Davos-Laret Remote Sensing Field Laboratory. The performance of the single-angle and multi-angle two-parameter retrieval algorithms employed during each of the aforementioned three periods is assessed using in-situ measured ground permittivity and snow density. Additionally, a synthetic sensitivity analysis is conducted that studies melting effects on the retrievals in the form of two types of “geophysical noise” (snow liquid water and footprint-dependent ground permittivity). Experimental and synthetic analyses show that both types of investigated “geophysical noise” noticeably disturb the retrievals and result in an increased correlation between them. The strength of this correlation is successfully used as a quality-indicator flag for the purpose of filtering out highly correlated ground permittivity and snow density retrievals. It is demonstrated that this filtering significantly improves the accuracy of both ground permittivity and snow density retrievals compared to corresponding reference in-situ data. Experimental and synthetic retrievals are performed in retrieval modes RM = “H”, “V”, and “HV”, where brightness temperatures from polarizations p = H, p = V, or both p = H and V are used, respectively, in the retrieval procedure. Our analysis shows that retrievals for RM = “V” are predominantly least prone to the investigated “geophysical noise”. The presented experimental results indicate that retrievals match in-situ observations best for the “snow-free period” and the “cold winter period” when “geophysical noise” is at minimum. Full article
(This article belongs to the Special Issue Snow Remote Sensing)
Show Figures

Graphical abstract

18 pages, 6089 KiB  
Article
Triple-Frequency Code-Phase Combination Determination: A Comparison with the Hatch-Melbourne-Wübbena Combination Using BDS Signals
by Chenlong Deng, Weiming Tang, Jianhui Cui, Mingxing Shen, Zongnan Li, Xuan Zou and Yongfeng Zhang
Remote Sens. 2018, 10(2), 353; https://doi.org/10.3390/rs10020353 - 24 Feb 2018
Cited by 10 | Viewed by 4978
Abstract
Considering the influence of the ionosphere, troposphere, and other systematic errors on double-differenced ambiguity resolution (AR), we present an optimal triple-frequency code-phase combination determination method driven by both the model and the real data. The new method makes full use of triple-frequency code [...] Read more.
Considering the influence of the ionosphere, troposphere, and other systematic errors on double-differenced ambiguity resolution (AR), we present an optimal triple-frequency code-phase combination determination method driven by both the model and the real data. The new method makes full use of triple-frequency code measurements (especially the low-noise of the code on the B3 signal) to minimize the total noise level and achieve the largest AR success rate (model-driven) under different ionosphere residual situations (data-driven), thus speeding up the AR by directly rounding. With the triple-frequency Beidou Navigation Satellite System (BDS) data collected at five stations from a continuously-operating reference station network in Guangdong Province of China, different testing scenarios are defined (a medium baseline, whose distance is between 20 km and 50 km; a medium-long baseline, whose distance is between 50 km and 100 km; and a long baseline, whose distance is larger than 100 km). The efficiency of the optimal code-phase combination on the AR success rate was compared with that of the geometry-free and ionosphere-free (GIF) combination and the Hatch-Melbourne-Wübbena (HMW) combination. Results show that the optimal combinations can always achieve better results than the HMW combination with B2 and B3 signals, especially when the satellite elevation angle is larger than 45°. For the wide-lane AR which aims to obtain decimeter-level kinematic positioning service, the standard deviation (STD) of ambiguity residuals for the suboptimal combination are only about 0.2 cycles, and the AR success rate by directly rounding can be up to 99%. Compared with the HMW combinations using B1 and B2 signals and using B1 and B3 signals, the suboptimal combination achieves the best results in all baselines, with an overall improvement of about 40% and 20%, respectively. Additionally, the STD difference between the optimal and the GIF code-phase combinations decreases as the baseline length increases. This indicates that the GIF combination is more suitable for long baselines. The proposed optimal code-phase combination determination method can be applied to other multi-frequency global navigation satellite systems, such as new-generation BDS, Galileo, and modernized GPS. Full article
Show Figures

Graphical abstract

18 pages, 4578 KiB  
Article
Atmospheric Correction Inter-Comparison Exercise
by Georgia Doxani, Eric Vermote, Jean-Claude Roger, Ferran Gascon, Stefan Adriaensen, David Frantz, Olivier Hagolle, André Hollstein, Grit Kirches, Fuqin Li, Jérôme Louis, Antoine Mangin, Nima Pahlevan, Bringfried Pflug and Quinten Vanhellemont
Remote Sens. 2018, 10(2), 352; https://doi.org/10.3390/rs10020352 - 24 Feb 2018
Cited by 168 | Viewed by 15341
Abstract
The Atmospheric Correction Inter-comparison eXercise (ACIX) is an international initiative with the aim to analyse the Surface Reflectance (SR) products of various state-of-the-art atmospheric correction (AC) processors. The Aerosol Optical Thickness (AOT) and Water Vapour (WV) are also examined in ACIX as additional [...] Read more.
The Atmospheric Correction Inter-comparison eXercise (ACIX) is an international initiative with the aim to analyse the Surface Reflectance (SR) products of various state-of-the-art atmospheric correction (AC) processors. The Aerosol Optical Thickness (AOT) and Water Vapour (WV) are also examined in ACIX as additional outputs of AC processing. In this paper, the general ACIX framework is discussed; special mention is made of the motivation to initiate the experiment, the inter-comparison protocol, and the principal results. ACIX is free and open and every developer was welcome to participate. Eventually, 12 participants applied their approaches to various Landsat-8 and Sentinel-2 image datasets acquired over sites around the world. The current results diverge depending on the sensors, products, and sites, indicating their strengths and weaknesses. Indeed, this first implementation of processor inter-comparison was proven to be a good lesson for the developers to learn the advantages and limitations of their approaches. Various algorithm improvements are expected, if not already implemented, and the enhanced performances are yet to be assessed in future ACIX experiments. Full article
(This article belongs to the Special Issue Atmospheric Correction of Remote Sensing Data)
Show Figures

Graphical abstract

19 pages, 7990 KiB  
Article
Siamese-GAN: Learning Invariant Representations for Aerial Vehicle Image Categorization
by Laila Bashmal, Yakoub Bazi, Haikel AlHichri, Mohamad M. AlRahhal, Nassim Ammour and Naif Alajlan
Remote Sens. 2018, 10(2), 351; https://doi.org/10.3390/rs10020351 - 24 Feb 2018
Cited by 51 | Viewed by 10885
Abstract
In this paper, we present a new algorithm for cross-domain classification in aerial vehicle images based on generative adversarial networks (GANs). The proposed method, called Siamese-GAN, learns invariant feature representations for both labeled and unlabeled images coming from two different domains. To this [...] Read more.
In this paper, we present a new algorithm for cross-domain classification in aerial vehicle images based on generative adversarial networks (GANs). The proposed method, called Siamese-GAN, learns invariant feature representations for both labeled and unlabeled images coming from two different domains. To this end, we train in an adversarial manner a Siamese encoder–decoder architecture coupled with a discriminator network. The encoder–decoder network has the task of matching the distributions of both domains in a shared space regularized by the reconstruction ability, while the discriminator seeks to distinguish between them. After this phase, we feed the resulting encoded labeled and unlabeled features to another network composed of two fully-connected layers for training and classification, respectively. Experiments on several cross-domain datasets composed of extremely high resolution (EHR) images acquired by manned/unmanned aerial vehicles (MAV/UAV) over the cities of Vaihingen, Toronto, Potsdam, and Trento are reported and discussed. Full article
(This article belongs to the Special Issue Deep Learning for Remote Sensing)
Show Figures

Graphical abstract

18 pages, 13447 KiB  
Article
Monitoring Water Levels and Discharges Using Radar Altimetry in an Ungauged River Basin: The Case of the Ogooué
by Sakaros Bogning, Frédéric Frappart, Fabien Blarel, Fernando Niño, Gil Mahé, Jean-Pierre Bricquet, Frédérique Seyler, Raphaël Onguéné, Jacques Etamé, Marie-Claire Paiz and Jean-Jacques Braun
Remote Sens. 2018, 10(2), 350; https://doi.org/10.3390/rs10020350 - 24 Feb 2018
Cited by 65 | Viewed by 9906
Abstract
Radar altimetry is now commonly used for the monitoring of water levels in large river basins. In this study, an altimetry-based network of virtual stations was defined in the quasi ungauged Ogooué river basin, located in Gabon, Central Africa, using data from seven [...] Read more.
Radar altimetry is now commonly used for the monitoring of water levels in large river basins. In this study, an altimetry-based network of virtual stations was defined in the quasi ungauged Ogooué river basin, located in Gabon, Central Africa, using data from seven altimetry missions (Jason-2 and 3, ERS-2, ENVISAT, Cryosat-2, SARAL, Sentinel-3A) from 1995 to 2017. The performance of the five latter altimetry missions to retrieve water stages and discharges was assessed through comparisons against gauge station records. All missions exhibited a good agreement with gauge records, but the most recent missions showed an increase of data availability (only 6 virtual stations (VS) with ERS-2 compared to 16 VS for ENVISAT and SARAL) and accuracy (RMSE lower than 1.05, 0.48 and 0.33 and R² higher than 0.55, 0.83 and 0.91 for ERS-2, ENVISAT and SARAL respectively). The concept of VS is extended to the case of drifting orbits using the data from Cryosat-2 in several close locations. Good agreement was also found with the gauge station in Lambaréné (RMSE = 0.25 m and R2 = 0.96). Very good results were obtained using only one year and a half of Sentinel-3 data (RMSE < 0.41 m and R2 > 0.89). The combination of data from all the radar altimetry missions near Lamabréné resulted in a long-term (May 1995 to August 2017) and significantly improved water-level time series (R² = 0.96 and RMSE = 0.38 m). The increase in data sampling in the river basin leads to a better water level peak to peak characterization and hence to a more accurate annual discharge over the common observation period with only a 1.4 m3·s−1 difference (i.e., 0.03%) between the altimetry-based and the in situ mean annual discharge. Full article
(This article belongs to the Special Issue Satellite Altimetry for Earth Sciences)
Show Figures

Figure 1

21 pages, 6496 KiB  
Article
Phenotyping Conservation Agriculture Management Effects on Ground and Aerial Remote Sensing Assessments of Maize Hybrids Performance in Zimbabwe
by Adrian Gracia-Romero, Omar Vergara-Díaz, Christian Thierfelder, Jill E. Cairns, Shawn C. Kefauver and José L. Araus
Remote Sens. 2018, 10(2), 349; https://doi.org/10.3390/rs10020349 - 24 Feb 2018
Cited by 41 | Viewed by 8464
Abstract
In the coming decades, Sub-Saharan Africa (SSA) faces challenges to sustainably increase food production while keeping pace with continued population growth. Conservation agriculture (CA) has been proposed to enhance soil health and productivity to respond to this situation. Maize is the main staple [...] Read more.
In the coming decades, Sub-Saharan Africa (SSA) faces challenges to sustainably increase food production while keeping pace with continued population growth. Conservation agriculture (CA) has been proposed to enhance soil health and productivity to respond to this situation. Maize is the main staple food in SSA. To increase maize yields, the selection of suitable genotypes and management practices for CA conditions has been explored using remote sensing tools. They may play a fundamental role towards overcoming the traditional limitations of data collection and processing in large scale phenotyping studies. We present the result of a study in which Red-Green-Blue (RGB) and multispectral indexes were evaluated for assessing maize performance under conventional ploughing (CP) and CA practices. Eight hybrids under different planting densities and tillage practices were tested. The measurements were conducted on seedlings at ground level (0.8 m) and from an unmanned aerial vehicle (UAV) platform (30 m), causing a platform proximity effect on the images resolution that did not have any negative impact on the performance of the indexes. Most of the calculated indexes (Green Area (GA) and Normalized Difference Vegetation Index (NDVI)) were significantly affected by tillage conditions increasing their values from CP to CA. Indexes derived from the RGB-images related to canopy greenness performed better at assessing yield differences, potentially due to the greater resolution of the RGB compared with the multispectral data, although this performance was more precise for CP than CA. The correlations of the multispectral indexes with yield were improved by applying a soil-mask derived from a NDVI threshold with the aim of corresponding pixels with vegetation. The results of this study highlight the applicability of remote sensing approaches based on RGB images to the assessment of crop performance and hybrid choice. Full article
Show Figures

Graphical abstract

22 pages, 11391 KiB  
Article
Upper Ocean Response to Typhoon Kalmaegi and Sarika in the South China Sea from Multiple-Satellite Observations and Numerical Simulations
by Xinxin Yue, Biao Zhang, Guoqiang Liu, Xiaofeng Li, Han Zhang and Yijun He
Remote Sens. 2018, 10(2), 348; https://doi.org/10.3390/rs10020348 - 24 Feb 2018
Cited by 48 | Viewed by 7857
Abstract
We investigated ocean surface and subsurface physical responses to Typhoons Kalmaegi and Sarika in the South China Sea, utilizing synergistic multiple-satellite observations, in situ measurements, and numerical simulations. We found significant typhoon-induced sea surface cooling using satellite sea surface temperature (SST) observations and [...] Read more.
We investigated ocean surface and subsurface physical responses to Typhoons Kalmaegi and Sarika in the South China Sea, utilizing synergistic multiple-satellite observations, in situ measurements, and numerical simulations. We found significant typhoon-induced sea surface cooling using satellite sea surface temperature (SST) observations and numerical model simulations. This cooling was mainly caused by vertical mixing and upwelling. The maximum amplitudes were 6 °C and 4.2 °C for Typhoons Kalmaegi and Sarika, respectively. For Typhoon Sarika, Argo temperature profile measurements showed that temperature response beneath the surface showed a three-layer vertical structure (decreasing-increasing-decreasing). Satellite salinity observations showed that the maximum increase of sea surface salinity (SSS) was 2.2 psu on the right side of Typhoon Sarika’s track, and the maximum decrease of SSS was 1.4 psu on the left. This SSS seesaw response phenomenon is related to the asymmetrical rainfall on both sides of the typhoon track. Acoustic Doppler Current Profilers measurements and numerical simulations both showed that subsurface current velocities rapidly increased as the typhoon passed, with peak increases of up to 1.19 m/s and 1.49 m/s. Typhoon-generated SST cooling and current velocity increases both exhibited a rightward bias associated with a coupling between typhoon wind-stress and mixed layer velocity. Full article
(This article belongs to the Section Ocean Remote Sensing)
Show Figures

Graphical abstract

21 pages, 11686 KiB  
Article
Combining Multi-Date Airborne Laser Scanning and Digital Aerial Photogrammetric Data for Forest Growth and Yield Modelling
by Piotr Tompalski, Nicholas C. Coops, Peter L. Marshall, Joanne C. White, Michael A. Wulder and Todd Bailey
Remote Sens. 2018, 10(2), 347; https://doi.org/10.3390/rs10020347 - 24 Feb 2018
Cited by 47 | Viewed by 7712
Abstract
The increasing availability of highly detailed three-dimensional remotely-sensed data depicting forests, including airborne laser scanning (ALS) and digital aerial photogrammetric (DAP) approaches, provides a means for improving stand dynamics information. The availability of data from ALS and DAP has stimulated attempts to link [...] Read more.
The increasing availability of highly detailed three-dimensional remotely-sensed data depicting forests, including airborne laser scanning (ALS) and digital aerial photogrammetric (DAP) approaches, provides a means for improving stand dynamics information. The availability of data from ALS and DAP has stimulated attempts to link these datasets with conventional forestry growth and yield models. In this study, we demonstrated an approach whereby two three-dimensional point cloud datasets (one from ALS and one from DAP), acquired over the same forest stands, at two points in time (circa 2008 and 2015), were used to derive forest inventory information. The area-based approach (ABA) was used to predict top height (H), basal area (BA), total volume (V), and stem density (N) for Time 1 and Time 2 (T1, T2). We assigned individual yield curves to 20 × 20 m grid cells for two scenarios. The first scenario used T1 estimates only (approach 1, single date), while the second scenario combined T1 and T2 estimates (approach 2, multi-date). Yield curves were matched by comparing the predicted cell-level attributes with a yield curve template database generated using an existing growth simulator. Results indicated that the yield curves using the multi-date data of approach 2 were matched with slightly higher accuracy; however, projections derived using approach 1 and 2 were not significantly different. The accuracy of curve matching was dependent on the ABA prediction error. The relative root mean squared error of curve matching in approach 2 for H, BA, V, and N, was 18.4, 11.5, 25.6, and 27.53% for observed (plot) data, and 13.2, 44.6, 50.4 and 112.3% for predicted data, respectively. The approach presented in this study provides additional detail on sub-stand level growth projections that enhances the information available to inform long-term, sustainable forest planning and management. Full article
(This article belongs to the Special Issue Multitemporal Remote Sensing for Forestry)
Show Figures

Graphical abstract

17 pages, 2501 KiB  
Article
Impact of Vertical Canopy Position on Leaf Spectral Properties and Traits across Multiple Species
by Tawanda W. Gara, Roshanak Darvishzadeh, Andrew K. Skidmore and Tiejun Wang
Remote Sens. 2018, 10(2), 346; https://doi.org/10.3390/rs10020346 - 23 Feb 2018
Cited by 37 | Viewed by 6476
Abstract
Understanding the vertical pattern of leaf traits across plant canopies provide critical information on plant physiology, ecosystem functioning and structure and vegetation response to climate change. However, the impact of vertical canopy position on leaf spectral properties and subsequently leaf traits across the [...] Read more.
Understanding the vertical pattern of leaf traits across plant canopies provide critical information on plant physiology, ecosystem functioning and structure and vegetation response to climate change. However, the impact of vertical canopy position on leaf spectral properties and subsequently leaf traits across the entire spectrum for multiple species is poorly understood. In this study, we examined the ability of leaf optical properties to track variability in leaf traits across the vertical canopy profile using Partial Least Square Discriminatory Analysis (PLS-DA). Leaf spectral measurements together with leaf traits (nitrogen, carbon, chlorophyll, equivalent water thickness and specific leaf area) were studied at three vertical canopy positions along the plant stem: lower, middle and upper. We observed that foliar nitrogen (N), chlorophyll (Cab), carbon (C), and equivalent water thickness (EWT) were higher in the upper canopy leaves compared with lower shaded leaves, while specific leaf area (SLA) increased from upper to lower canopy leaves. We found that leaf spectral reflectance significantly (P ≤ 0.05) shifted to longer wavelengths in the ‘red edge’ spectrum (685–701 nm) in the order of lower > middle > upper for the pooled dataset. We report that spectral bands that are influential in the discrimination of leaf samples into the three groups of canopy position, based on the PLS-DA variable importance projection (VIP) score, match with wavelength regions of foliar traits observed to vary across the canopy vertical profile. This observation demonstrated that both leaf traits and leaf reflectance co-vary across the vertical canopy profile in multiple species. We conclude that canopy vertical position has a significant impact on leaf spectral properties of an individual plant’s traits, and this finding holds for multiple species. These findings have important implications on field sampling protocols, upscaling leaf traits to canopy level, canopy reflectance modelling, and subsequent leaf trait retrieval, especially for studies that aimed to integrate hyperspectral measurements and LiDAR data. Full article
Show Figures

Graphical abstract

20 pages, 5477 KiB  
Article
Impacts of Insufficient Observations on the Monitoring of Short- and Long-Term Suspended Solids Variations in Highly Dynamic Waters, and Implications for an Optimal Observation Strategy
by Qu Zhou, Liqiao Tian, Onyx W. H. Wai, Jian Li, Zhaohua Sun and Wenkai Li
Remote Sens. 2018, 10(2), 345; https://doi.org/10.3390/rs10020345 - 23 Feb 2018
Cited by 11 | Viewed by 4479
Abstract
Coastal water regions represent some of the most fragile ecosystems, exposed to both climate change and human activities. While remote sensing provides unprecedented amounts of data for water quality monitoring on regional to global scales, the performance of satellite observations is frequently impeded [...] Read more.
Coastal water regions represent some of the most fragile ecosystems, exposed to both climate change and human activities. While remote sensing provides unprecedented amounts of data for water quality monitoring on regional to global scales, the performance of satellite observations is frequently impeded by revisiting intervals and unfavorable conditions, such as cloud coverage and sun glint. Therefore, it is crucial to evaluate the impacts of varied sampling strategies (time and frequency) and insufficient observations on the monitoring of short-term and long-term tendencies of water quality parameters, such as suspended solids (SS), in highly dynamic coastal waters. Taking advantage of the first high-frequency in situ SS dataset (at 30 min sampling intervals from 2007 to 2008), collected in Deep Bay, China, this paper presents a quantitative analysis of the influences of sampling strategies on the monitoring of SS, in terms of sampling frequency and time of day. Dramatic variations of SS were observed, with standard deviation coefficients of 48.9% and 54.1%, at two fixed stations; in addition, significant uncertainties were revealed, with the average absolute percent difference of approximately 13%, related to sampling frequency and time, using nonlinear optimization and random simulation methods. For a sampling frequency of less than two observations per day, the relative error of SS was higher than 50%, and stabilized at approximately 10%, when at least four or five samplings were conducted per day. The optimal recommended sampling times for SS were at around 9:00, 12:00, 14:00, and 16:00 in Deep Bay. The “pseudo” MODIS SS dataset was obtained from high-frequency in situ SS measurements at 10:30 and 14:00, masked by the temporal gap distribution of MODIS coverage to avoid uncertainties propagated from atmospheric correction and SS models. Noteworthy uncertainties of daily observations from the Terra/Aqua MODIS were found, with mean relative errors of 19.2% and 17.8%, respectively, whereas at the monthly level, the mean relative error of Terra/Aqua MODIS observations was approximately 10.7% (standard deviation of 8.4%). Sensitivity analysis between MODIS coverage and SS relative errors indicated that temporal coverage (the percentage of valid MODIS observations for a month) of more than 70% is required to obtain high-precision SS measurements at a 5% error level. Furthermore, approximately 20% of relative errors were found with the coverage of 30%, which was the average coverage of satellite observations over global coastal waters. These results highlight the need for high-frequency measurements of geostationary satellites like GOCI and multi-source ocean color sensors to capture the dynamic process of coastal waters in both the short and long term. Full article
Show Figures

Graphical abstract

22 pages, 23300 KiB  
Article
Estimation of Forest Canopy Height and Aboveground Biomass from Spaceborne LiDAR and Landsat Imageries in Maryland
by Mengjia Wang, Rui Sun and Zhiqiang Xiao
Remote Sens. 2018, 10(2), 344; https://doi.org/10.3390/rs10020344 - 23 Feb 2018
Cited by 43 | Viewed by 6189
Abstract
Mapping the regional distribution of forest canopy height and aboveground biomass is worthwhile and necessary for estimating the carbon stocks on Earth and assessing the terrestrial carbon flux. In this study, we produced maps of forest canopy height and the aboveground biomass at [...] Read more.
Mapping the regional distribution of forest canopy height and aboveground biomass is worthwhile and necessary for estimating the carbon stocks on Earth and assessing the terrestrial carbon flux. In this study, we produced maps of forest canopy height and the aboveground biomass at a 30 m spatial resolution in Maryland by combining Geoscience Laser Altimeter System (GLAS) data and Landsat spectral imageries. The processes for calculating the forest biomass included the following: (i) processing the GLAS waveform and calculating spatially discrete forest canopy heights; (ii) developing canopy height models from Landsat imagery and extrapolating them to spatially contiguous canopy heights in Maryland; and, (iii) estimating forest aboveground biomass according to the relationship between canopy height and biomass. In our study, we explore the ability to use the GLAS waveform to calculate canopy height without ground-measured forest metrics (R2 = 0.669, RMSE = 4.82 m, MRE = 15.4%). The machine learning models performed better than the principal component model when mapping the regional forest canopy height and aboveground biomass. The total forest aboveground biomass in Maryland reached approximately 160 Tg. When compared with the existing Biomass_CMS map, our biomass estimates presented a similar distribution where higher values were in the Western Shore Uplands region and Folded Application Mountain section, while lower values were located in the Delmarva Peninsula and Allegheny Mountain regions. Full article
Show Figures

Graphical abstract

14 pages, 3178 KiB  
Article
Early-Season Stand Count Determination in Corn via Integration of Imagery from Unmanned Aerial Systems (UAS) and Supervised Learning Techniques
by Sebastian Varela, Pruthvidhar Reddy Dhodda, William H. Hsu, P. V. Vara Prasad, Yared Assefa, Nahuel R. Peralta, Terry Griffin, Ajay Sharda, Allison Ferguson and Ignacio A. Ciampitti
Remote Sens. 2018, 10(2), 343; https://doi.org/10.3390/rs10020343 - 23 Feb 2018
Cited by 52 | Viewed by 10297
Abstract
Corn (Zea mays L.) is one of the most sensitive crops to planting pattern and early-season uniformity. The most common method to determine number of plants is by visual inspection on the ground but this field activity becomes time-consuming, labor-intensive, biased, and [...] Read more.
Corn (Zea mays L.) is one of the most sensitive crops to planting pattern and early-season uniformity. The most common method to determine number of plants is by visual inspection on the ground but this field activity becomes time-consuming, labor-intensive, biased, and may lead to less profitable decisions by farmers. The objective of this study was to develop a reliable, timely, and unbiased method for counting corn plants based on ultra-high-resolution imagery acquired from unmanned aerial systems (UAS) to automatically scout fields and applied to real field conditions. A ground sampling distance of 2.4 mm was targeted to extract information at a plant-level basis. First, an excess greenness (ExG) index was used to individualized green pixels from the background, then rows and inter-row contours were identified and extracted. A scalable training procedure was implemented using geometric descriptors as inputs of the classifier. Second, a decision tree was implemented and tested using two training modes in each site to expose the workflow to different ground conditions at the time of the aerial data acquisition. Differences in performance were due to training modes and spatial resolutions in the two sites. For an object classification task, an overall accuracy of 0.96, based on the proportion of corrected assessment of corn and non-corn objects, was obtained for local (per-site) classification, and an accuracy of 0.93 was obtained for the combined training modes. For successful model implementation, plants should have between two to three leaves when images are collected (avoiding overlapping between plants). Best workflow performance was reached at 2.4 mm resolution corresponding to 10 m of altitude (lower altitude); higher altitudes were gradually penalized. The latter was coincident with the larger number of detected green objects in the images and the effectiveness of geometry as descriptor for corn plant detection. Full article
(This article belongs to the Special Issue Remote Sensing from Unmanned Aerial Vehicles (UAVs))
Show Figures

Graphical abstract

24 pages, 13762 KiB  
Article
A Hierarchical Fully Convolutional Network Integrated with Sparse and Low-Rank Subspace Representations for PolSAR Imagery Classification
by Yan Wang, Chu He, Xinlong Liu and Mingsheng Liao
Remote Sens. 2018, 10(2), 342; https://doi.org/10.3390/rs10020342 - 23 Feb 2018
Cited by 35 | Viewed by 5907
Abstract
Inspired by enormous success of fully convolutional network (FCN) in semantic segmentation, as well as the similarity between semantic segmentation and pixel-by-pixel polarimetric synthetic aperture radar (PolSAR) image classification, exploring how to effectively combine the unique polarimetric properties with FCN is a promising [...] Read more.
Inspired by enormous success of fully convolutional network (FCN) in semantic segmentation, as well as the similarity between semantic segmentation and pixel-by-pixel polarimetric synthetic aperture radar (PolSAR) image classification, exploring how to effectively combine the unique polarimetric properties with FCN is a promising attempt at PolSAR image classification. Moreover, recent research shows that sparse and low-rank representations can convey valuable information for classification purposes. Therefore, this paper presents an effective PolSAR image classification scheme, which integrates deep spatial patterns learned automatically by FCN with sparse and low-rank subspace features: (1) a shallow subspace learning based on sparse and low-rank graph embedding is firstly introduced to capture the local and global structures of high-dimensional polarimetric data; (2) a pre-trained deep FCN-8s model is transferred to extract the nonlinear deep multi-scale spatial information of PolSAR image; and (3) the shallow sparse and low-rank subspace features are integrated to boost the discrimination of deep spatial features. Then, the integrated hierarchical subspace features are used for subsequent classification combined with a discriminative model. Extensive experiments on three pieces of real PolSAR data indicate that the proposed method can achieve competitive performance, particularly in the case where the available training samples are limited. Full article
(This article belongs to the Special Issue Deep Learning for Remote Sensing)
Show Figures

Graphical abstract

15 pages, 19642 KiB  
Article
A Fully Automatic Burnt Area Mapping Processor Based on AVHRR Imagery—A TIMELINE Thematic Processor
by Simon Plank and Sandro Martinis
Remote Sens. 2018, 10(2), 341; https://doi.org/10.3390/rs10020341 - 23 Feb 2018
Cited by 8 | Viewed by 3642
Abstract
The German Aerospace Center’s (DLR) TIMELINE project (“Time Series Processing of Medium Resolution Earth Observation Data Assessing Long-Term Dynamics in our Natural Environment”) aims to develop an operational processing and data management environment to process 30 years of National Oceanic and Atmospheric Administration [...] Read more.
The German Aerospace Center’s (DLR) TIMELINE project (“Time Series Processing of Medium Resolution Earth Observation Data Assessing Long-Term Dynamics in our Natural Environment”) aims to develop an operational processing and data management environment to process 30 years of National Oceanic and Atmospheric Administration (NOAA)—Advanced Very High-Resolution Radiometer (AVHRR) raw data into Level (L) 1b, L2, and L3 products. This article presents the current status of the fully automated L3 burnt area mapping processor, which is based on multi-temporal datasets. The advantages of the proposed approach are (I) the combined use of different indices to improve the classification result, (II) the provision of a fully automated processor, (III) the generation and usage of an up-to-date cloud-free pre-fire dataset, (IV) classification with adaptive thresholding, and (V) the assignment of five different probability levels to the burnt areas detected. The results of the AVHRR data-based burn scar mapping processor were validated with the Moderate Resolution Imaging Spectroradiometer (MODIS) burnt area product MCD64 at four different European study sites. In addition, the accuracy of the AVHRR-based classification and that of the MCD64 itself were assessed by means of Landsat imagery. Full article
Show Figures

Graphical abstract

17 pages, 2935 KiB  
Article
Monitoring Rice Phenology Based on Backscattering Characteristics of Multi-Temporal RADARSAT-2 Datasets
by Ze He, Shihua Li, Yong Wang, Leiyu Dai and Sen Lin
Remote Sens. 2018, 10(2), 340; https://doi.org/10.3390/rs10020340 - 23 Feb 2018
Cited by 52 | Viewed by 6165
Abstract
Accurate estimation and monitoring of rice phenology is necessary for the management and yield prediction of rice. The radar backscattering coefficient, one of the most direct and accessible parameters has been proved to be capable of retrieving rice growth parameters. This paper aims [...] Read more.
Accurate estimation and monitoring of rice phenology is necessary for the management and yield prediction of rice. The radar backscattering coefficient, one of the most direct and accessible parameters has been proved to be capable of retrieving rice growth parameters. This paper aims to investigate the possibility of monitoring the rice phenology (i.e., transplanting, vegetative, reproductive, and maturity) using the backscattering coefficients or their simple combinations of multi-temporal RADARSAT-2 datasets only. Four RADARSAT-2 datasets were analyzed at 30 sample plots in Meishan City, Sichuan Province, China. By exploiting the relationships of the backscattering coefficients and their combinations versus the phenology of rice, HH/VV, VV/VH, and HH/VH ratios were found to have the greatest potential for phenology monitoring. A decision tree classifier was applied to distinguish the four phenological phases, and the classifier was effective. The validation of the classifier indicated an overall accuracy level of 86.2%. Most of the errors occurred in the vegetative and reproductive phases. The corresponding errors were 21.4% and 16.7%, respectively. Full article
Show Figures

Graphical abstract

21 pages, 3954 KiB  
Article
Hyperspectral Unmixing via Low-Rank Representation with Space Consistency Constraint and Spectral Library Pruning
by Xiangrong Zhang, Chen Li, Jingyan Zhang, Qimeng Chen, Jie Feng, Licheng Jiao and Huiyu Zhou
Remote Sens. 2018, 10(2), 339; https://doi.org/10.3390/rs10020339 - 23 Feb 2018
Cited by 43 | Viewed by 5225
Abstract
Spectral unmixing is a popular technique for hyperspectral data interpretation. It focuses on estimating the abundance of pure spectral signature (called as endmembers) in each observed image signature. However, the identification of the endmembers in the original hyperspectral data becomes a challenge due [...] Read more.
Spectral unmixing is a popular technique for hyperspectral data interpretation. It focuses on estimating the abundance of pure spectral signature (called as endmembers) in each observed image signature. However, the identification of the endmembers in the original hyperspectral data becomes a challenge due to the lack of pure pixels in the scenes and the difficulty in estimating the number of endmembers in a given scene. To deal with these problems, the sparsity-based unmixing algorithms, which regard a large standard spectral library as endmembers, have recently been proposed. However, the high mutual coherence of spectral libraries always affects the performance of sparse unmixing. In addition, the hyperspectral image has the special characteristics of space. In this paper, a new unmixing algorithm via low-rank representation (LRR) based on space consistency constraint and spectral library pruning is proposed. The algorithm includes the spatial information on the LRR model by means of the spatial consistency regularizer which is based on the assumption that: it is very likely that two neighbouring pixels have similar fractional abundances for the same endmembers. The pruning strategy is based on the assumption that, if the abundance map of one material does not contain any large values, it is not a real endmember and will be removed from the spectral library. The algorithm not only can better capture the spatial structure of data but also can identify a subset of the spectral library. Thus, the algorithm can achieve a better unmixing result and improve the spectral unmixing accuracy significantly. Experimental results on both simulated and real hyperspectral datasets demonstrate the effectiveness of the proposed algorithm. Full article
(This article belongs to the Section Remote Sensing Image Processing)
Show Figures

Graphical abstract

22 pages, 2910 KiB  
Article
Assessing Biodiversity in Boreal Forests with UAV-Based Photogrammetric Point Clouds and Hyperspectral Imaging
by Ninni Saarinen, Mikko Vastaranta, Roope Näsi, Tomi Rosnell, Teemu Hakala, Eija Honkavaara, Michael A. Wulder, Ville Luoma, Antonio M. G. Tommaselli, Nilton N. Imai, Eduardo A. W. Ribeiro, Raul B. Guimarães, Markus Holopainen and Juha Hyyppä
Remote Sens. 2018, 10(2), 338; https://doi.org/10.3390/rs10020338 - 23 Feb 2018
Cited by 60 | Viewed by 10151
Abstract
Forests are the most diverse terrestrial ecosystems and their biological diversity includes trees, but also other plants, animals, and micro-organisms. One-third of the forested land is in boreal zone; therefore, changes in biological diversity in boreal forests can shape biodiversity, even at global [...] Read more.
Forests are the most diverse terrestrial ecosystems and their biological diversity includes trees, but also other plants, animals, and micro-organisms. One-third of the forested land is in boreal zone; therefore, changes in biological diversity in boreal forests can shape biodiversity, even at global scale. Several forest attributes, including size variability, amount of dead wood, and tree species richness, can be applied in assessing biodiversity of a forest ecosystem. Remote sensing offers complimentary tool for traditional field measurements in mapping and monitoring forest biodiversity. Recent development of small unmanned aerial vehicles (UAVs) enable the detailed characterization of forest ecosystems through providing data with high spatial but also temporal resolution at reasonable costs. The objective here is to deepen the knowledge about assessment of plot-level biodiversity indicators in boreal forests with hyperspectral imagery and photogrammetric point clouds from a UAV. We applied individual tree crown approach (ITC) and semi-individual tree crown approach (semi-ITC) in estimating plot-level biodiversity indicators. Structural metrics from the photogrammetric point clouds were used together with either spectral features or vegetation indices derived from hyperspectral imagery. Biodiversity indicators like the amount of dead wood and species richness were mainly underestimated with UAV-based hyperspectral imagery and photogrammetric point clouds. Indicators of structural variability (i.e., standard deviation in diameter-at-breast height and tree height) were the most accurately estimated biodiversity indicators with relative RMSE between 24.4% and 29.3% with semi-ITC. The largest relative errors occurred for predicting deciduous trees (especially aspen and alder), partly due to their small amount within the study area. Thus, especially the structural diversity was reliably predicted by integrating the three-dimensional and spectral datasets of UAV-based point clouds and hyperspectral imaging, and can therefore be further utilized in ecological studies, such as biodiversity monitoring. Full article
Show Figures

Graphical abstract

19 pages, 5009 KiB  
Article
Validation and Assessment of Multi-GNSS Real-Time Precise Point Positioning in Simulated Kinematic Mode Using IGS Real-Time Service
by Liang Wang, Zishen Li, Maorong Ge, Frank Neitzel, Zhiyu Wang and Hong Yuan
Remote Sens. 2018, 10(2), 337; https://doi.org/10.3390/rs10020337 - 23 Feb 2018
Cited by 64 | Viewed by 6725
Abstract
Precise Point Positioning (PPP) is a popular technology for precise applications based on the Global Navigation Satellite System (GNSS). Multi-GNSS combined PPP has become a hot topic in recent years with the development of multiple GNSSs. Meanwhile, with the operation of the real-time [...] Read more.
Precise Point Positioning (PPP) is a popular technology for precise applications based on the Global Navigation Satellite System (GNSS). Multi-GNSS combined PPP has become a hot topic in recent years with the development of multiple GNSSs. Meanwhile, with the operation of the real-time service (RTS) of the International GNSS Service (IGS) agency that provides satellite orbit and clock corrections to broadcast ephemeris, it is possible to obtain the real-time precise products of satellite orbits and clocks and to conduct real-time PPP. In this contribution, the real-time multi-GNSS orbit and clock corrections of the CLK93 product are applied for real-time multi-GNSS PPP processing, and its orbit and clock qualities are investigated, first with a seven-day experiment by comparing them with the final multi-GNSS precise product ‘GBM’ from GFZ. Then, an experiment involving real-time PPP processing for three stations in the Multi-GNSS Experiment (MGEX) network with a testing period of two weeks is conducted in order to evaluate the convergence performance of real-time PPP in a simulated kinematic mode. The experimental result shows that real-time PPP can achieve a convergence performance of less than 15 min for an accuracy level of 20 cm. Finally, the real-time data streams from 12 globally distributed IGS/MGEX stations for one month are used to assess and validate the positioning accuracy of real-time multi-GNSS PPP. The results show that the simulated kinematic positioning accuracy achieved by real-time PPP on different stations is about 3.0 to 4.0 cm for the horizontal direction and 5.0 to 7.0 cm for the three-dimensional (3D) direction. Full article
Show Figures

Graphical abstract

12 pages, 3663 KiB  
Article
Using Satellite Error Modeling to Improve GPM-Level 3 Rainfall Estimates over the Central Amazon Region
by Rômulo Oliveira, Viviana Maggioni, Daniel Vila and Leonardo Porcacchia
Remote Sens. 2018, 10(2), 336; https://doi.org/10.3390/rs10020336 - 23 Feb 2018
Cited by 21 | Viewed by 4401
Abstract
This study aims to assess the characteristics and uncertainty of Integrated Multisatellite Retrievals for Global Precipitation Measurement (GPM) (IMERG) Level 3 rainfall estimates and to improve those estimates using an error model over the central Amazon region. The S-band Amazon Protection National System [...] Read more.
This study aims to assess the characteristics and uncertainty of Integrated Multisatellite Retrievals for Global Precipitation Measurement (GPM) (IMERG) Level 3 rainfall estimates and to improve those estimates using an error model over the central Amazon region. The S-band Amazon Protection National System (SIPAM) radar is used as reference and the Precipitation Uncertainties for Satellite Hydrology (PUSH) framework is adopted to characterize uncertainties associated with the satellite precipitation product. PUSH is calibrated and validated for the study region and takes into account factors like seasonality and surface type (i.e., land and river). Results demonstrated that the PUSH model is suitable for characterizing errors in the IMERG algorithm when compared with S-band SIPAM radar estimates. PUSH could efficiently predict the satellite rainfall error distribution in terms of spatial and intensity distribution. However, an underestimation (overestimation) of light satellite rain rates was observed during the dry (wet) period, mainly over rivers. Although the estimated error showed a lower standard deviation than the observed error, the correlation between satellite and radar rainfall was high and the systematic error was well captured along the Negro, Solimões, and Amazon rivers, especially during the wet season. Full article
Show Figures

Graphical abstract

16 pages, 10813 KiB  
Article
Estimating Uncertainty of Point-Cloud Based Single-Tree Segmentation with Ensemble Based Filtering
by Matthew Parkan and Devis Tuia
Remote Sens. 2018, 10(2), 335; https://doi.org/10.3390/rs10020335 - 23 Feb 2018
Cited by 9 | Viewed by 5382
Abstract
Individual tree crown segmentation from Airborne Laser Scanning data is a nodal problem in forest remote sensing. Focusing on single layered spruce and fir dominated coniferous forests, this article addresses the problem of directly estimating 3D segment shape uncertainty (i.e., without field/reference surveys), [...] Read more.
Individual tree crown segmentation from Airborne Laser Scanning data is a nodal problem in forest remote sensing. Focusing on single layered spruce and fir dominated coniferous forests, this article addresses the problem of directly estimating 3D segment shape uncertainty (i.e., without field/reference surveys), using a probabilistic approach. First, a coarse segmentation (marker controlled watershed) is applied. Then, the 3D alpha hull and several descriptors are computed for each segment. Based on these descriptors, the alpha hulls are grouped to form ensembles (i.e., groups of similar tree shapes). By examining how frequently regions of a shape occur within an ensemble, it is possible to assign a shape probability to each point within a segment. The shape probability can subsequently be thresholded to obtain improved (filtered) tree segments. Results indicate this approach can be used to produce segmentation reliability maps. A comparison to manually segmented tree crowns also indicates that the approach is able to produce more reliable tree shapes than the initial (unfiltered) segmentation. Full article
(This article belongs to the Special Issue Lidar for Forest Science and Management)
Show Figures

Graphical abstract

16 pages, 8028 KiB  
Article
A Novel Adaptive Joint Time Frequency Algorithm by the Neural Network for the ISAR Rotational Compensation
by Zisheng Wang, Wei Yang, Zhuming Chen, Zhiqin Zhao, Haoquan Hu and Conghui Qi
Remote Sens. 2018, 10(2), 334; https://doi.org/10.3390/rs10020334 - 23 Feb 2018
Cited by 7 | Viewed by 3445
Abstract
We propose a novel adaptive joint time frequency algorithm combined with the neural network (AJTF-NN) to focus the distorted inverse synthetic aperture radar (ISAR) image. In this paper, a coefficient estimator based on the artificial neural network (ANN) is firstly developed to solve [...] Read more.
We propose a novel adaptive joint time frequency algorithm combined with the neural network (AJTF-NN) to focus the distorted inverse synthetic aperture radar (ISAR) image. In this paper, a coefficient estimator based on the artificial neural network (ANN) is firstly developed to solve the time-consuming rotational motion compensation (RMC) polynomial phase coefficient estimation problem. The training method, the cost function and the structure of ANN are comprehensively discussed. In addition, we originally propose a method to generate training dataset sourcing from the ISAR signal models with randomly chosen motion characteristics. Then, prediction results of the ANN estimator is used to directly compensate the ISAR image, or to provide a more accurate initial searching range to the AJTF for possible low-performance scenarios. Finally, some simulation models including the ideal point scatterers and a realistic Airbus A380 are employed to comprehensively investigate properties of the AJTF-NN, such as the stability and the efficiency under different signal-to-noise ratios (SNRs). Results show that the proposed method is much faster than other prevalent improved searching methods, the acceleration ratio are even up to 424 times without the deterioration of compensated image quality. Therefore, the proposed method is potential to the real-time application in the RMC problem of the ISAR imaging. Full article
(This article belongs to the Section Remote Sensing Image Processing)
Show Figures

Graphical abstract

17 pages, 3947 KiB  
Article
Deriving Total Suspended Matter Concentration from the Near-Infrared-Based Inherent Optical Properties over Turbid Waters: A Case Study in Lake Taihu
by Wei Shi, Yunlin Zhang and Menghua Wang
Remote Sens. 2018, 10(2), 333; https://doi.org/10.3390/rs10020333 - 23 Feb 2018
Cited by 37 | Viewed by 5626
Abstract
Normalized water-leaving radiance spectra nLw(λ), particle backscattering coefficients bbp(λ) in the near-infrared (NIR) wavelengths, and total suspended matter (TSM) concentrations over turbid waters are analytically correlated. To demonstrate the use of bbp(λ [...] Read more.
Normalized water-leaving radiance spectra nLw(λ), particle backscattering coefficients bbp(λ) in the near-infrared (NIR) wavelengths, and total suspended matter (TSM) concentrations over turbid waters are analytically correlated. To demonstrate the use of bbp(λ) in the NIR wavelengths in coastal and inland waters, we used in situ optics and TSM data to develop two TSM algorithms from measurements of the Visible Infrared Imaging Radiometer Suite (VIIRS) onboard the Suomi National Polar-orbiting Partnership (SNPP) using backscattering coefficients at the two NIR bands bbp(745) and bbp(862) for Lake Taihu. The correlation coefficients between the modeled TSM concentrations from bbp(745) and bbp(862) and the in situ TSM are 0.93 and 0.92, respectively. A different in situ dataset acquired between 2012 and 2016 for Lake Taihu was used to validate the performance of the NIR TSM algorithms for VIIRS-SNPP observations. TSM concentrations derived from VIIRS-SNPP observations with these two NIR bbp(λ)-based TSM algorithms matched well with in situ TSM concentrations in Lake Taihu between 2012 and 2016. The normalized root mean square errors (NRMSEs) for the two NIR algorithms are 0.234 and 0.226, respectively. The two NIR-based TSM algorithms are used to compute the satellite-derived TSM concentrations to study the seasonal and interannual variability of the TSM concentration in Lake Taihu between 2012 and 2016. In fact, the NIR-based TSM algorithms are analytically based with minimal in situ data to tune the coefficients. They are not sensitive to the possible nLw(λ) saturation in the visible bands for highly turbid waters, and have the potential to be used for estimation of TSM concentrations in turbid waters with similar NIR nLw(λ) spectra as those in Lake Taihu. Full article
(This article belongs to the Special Issue Remote Sensing of Ocean Colour)
Show Figures

Graphical abstract

17 pages, 11375 KiB  
Article
Spatiotemporal Analysis of Actual Evapotranspiration and Its Causes in the Hai Basin
by Nana Yan, Fuyou Tian, Bingfang Wu, Weiwei Zhu and Mingzhao Yu
Remote Sens. 2018, 10(2), 332; https://doi.org/10.3390/rs10020332 - 23 Feb 2018
Cited by 17 | Viewed by 3828
Abstract
Evapotranspiration (ET) is an important component of the eco-hydrological process. Comprehensive analyses of ET change at different spatial and temporal scales can enhance the understanding of hydrological processes and improve water resource management. In this study, monthly ET data and meteorological data from [...] Read more.
Evapotranspiration (ET) is an important component of the eco-hydrological process. Comprehensive analyses of ET change at different spatial and temporal scales can enhance the understanding of hydrological processes and improve water resource management. In this study, monthly ET data and meteorological data from 57 meteorological stations between 2000 and 2014 were used to study the spatiotemporal changes in actual ET and the associated causes in the Hai Basin. A spatial analysis was performed in GIS to explore the spatial pattern of ET in the basin, while parametric t-test and nonparametric Mann-Kendall test methods were used to analyze the temporal characteristics of interannual and annual ET. The primary causes of the spatiotemporal variations were partly explained by detrended fluctuation analysis. The results were as follows: (i) generally, ET increased from northwest to southeast across the basin, with significant differences in ET due to the heterogeneous landscape. Notably, the ET of water bodies was highest, followed by those of paddy fields, forests, cropland, brush, grassland and settlement; (ii) from 2000 to 2014, annual ET exhibited an increasing trend of 3.7 mm per year across the basin, implying that the excessive utilization of water resources had not been alleviated and the water resource crisis worsened; (iii) changes in vegetation coverage, wind speed and air pressure were the major factors that influenced interannual ET trends. Temperature and NDVI largely explained the increases in ET in 2014 and can be used as indicators to evaluate annual ET and provide early warning for associated issues. Full article
(This article belongs to the Section Remote Sensing in Geology, Geomorphology and Hydrology)
Show Figures

Graphical abstract

9 pages, 5511 KiB  
Article
Confirmation of ENSO-Southern Ocean Teleconnections Using Satellite-Derived SST
by Brady S. Ferster, Bulusu Subrahmanyam and Alison M. Macdonald
Remote Sens. 2018, 10(2), 331; https://doi.org/10.3390/rs10020331 - 23 Feb 2018
Cited by 18 | Viewed by 6003
Abstract
The Southern Ocean is the focus of many physical, chemical, and biological analyses due to its global importance and highly variable climate. This analysis of sea surface temperatures (SST) and global teleconnections shows that SSTs are significantly spatially correlated with both the Antarctic [...] Read more.
The Southern Ocean is the focus of many physical, chemical, and biological analyses due to its global importance and highly variable climate. This analysis of sea surface temperatures (SST) and global teleconnections shows that SSTs are significantly spatially correlated with both the Antarctic Oscillation and the Southern Oscillation, with spatial correlations between the indices and standardized SST anomalies approaching 1.0. Here, we report that the recent positive patterns in the Antarctic and Southern Oscillations are driving negative (cooling) trends in SST in the high latitude Southern Ocean and positive (warming) trends within the Southern Hemisphere sub-tropics and mid-latitudes. The coefficient of regression over the 35-year period analyzed implies that standardized temperatures have warmed at a rate of 0.0142 per year between 1982 and 2016 with a monthly standard error in the regression of 0.0008. Further regression calculations between the indices and SST indicate strong seasonality in response to changes in atmospheric circulation, with the strongest feedback occurring throughout the austral summer and autumn. Full article
(This article belongs to the Special Issue Sea Surface Temperature Retrievals from Remote Sensing)
Show Figures

Graphical abstract

13 pages, 5074 KiB  
Article
High-Throughput Phenotyping of Canopy Cover and Senescence in Maize Field Trials Using Aerial Digital Canopy Imaging
by Richard Makanza, Mainassara Zaman-Allah, Jill E. Cairns, Cosmos Magorokosho, Amsal Tarekegne, Mike Olsen and Boddupalli M. Prasanna
Remote Sens. 2018, 10(2), 330; https://doi.org/10.3390/rs10020330 - 23 Feb 2018
Cited by 88 | Viewed by 10518
Abstract
In the crop breeding process, the use of data collection methods that allow reliable assessment of crop adaptation traits, faster and cheaper than those currently in use, can significantly improve resource use efficiency by reducing selection cost and can contribute to increased genetic [...] Read more.
In the crop breeding process, the use of data collection methods that allow reliable assessment of crop adaptation traits, faster and cheaper than those currently in use, can significantly improve resource use efficiency by reducing selection cost and can contribute to increased genetic gain through improved selection efficiency. Current methods to estimate crop growth (ground canopy cover) and leaf senescence are essentially manual and/or by visual scoring, and are therefore often subjective, time consuming, and expensive. Aerial sensing technologies offer radically new perspectives for assessing these traits at low cost, faster, and in a more objective manner. We report the use of an unmanned aerial vehicle (UAV) equipped with an RGB camera for crop cover and canopy senescence assessment in maize field trials. Aerial-imaging-derived data showed a moderately high heritability for both traits with a significant genetic correlation with grain yield. In addition, in some cases, the correlation between the visual assessment (prone to subjectivity) of crop senescence and the senescence index, calculated from aerial imaging data, was significant. We concluded that the UAV-based aerial sensing platforms have great potential for monitoring the dynamics of crop canopy characteristics like crop vigor through ground canopy cover and canopy senescence in breeding trial plots. This is anticipated to assist in improving selection efficiency through higher accuracy and precision, as well as reduced time and cost of data collection. Full article
Show Figures

Graphical abstract

18 pages, 8319 KiB  
Article
Spatio-Temporal Characterization of a Reclamation Settlement in the Shanghai Coastal Area with Time Series Analyses of X-, C-, and L-Band SAR Datasets
by Mengshi Yang, Tianliang Yang, Lu Zhang, Jinxin Lin, Xiaoqiong Qin and Mingsheng Liao
Remote Sens. 2018, 10(2), 329; https://doi.org/10.3390/rs10020329 - 22 Feb 2018
Cited by 57 | Viewed by 5349
Abstract
Large-scale reclamation projects during the past decades have been recognized as one of the driving factors behind land subsidence in coastal areas. However, the pattern of temporal evolution in reclamation settlements has rarely been analyzed. In this work, we study the spatio-temporal evolution [...] Read more.
Large-scale reclamation projects during the past decades have been recognized as one of the driving factors behind land subsidence in coastal areas. However, the pattern of temporal evolution in reclamation settlements has rarely been analyzed. In this work, we study the spatio-temporal evolution pattern of Linggang New City (LNC) in Shanghai, China, using space-borne synthetic aperture radar interferometry (InSAR) methods. Three data stacks including 11 X-band TerraSAR-X, 20 L-band ALOS PALSAR, and 35 C-band ENVISAT ASAR images were used to retrieve time series deformation from 2007 to 2010 in the LNC. An InSAR analysis from the three data stacks displays strong agreement in mean deformation rates, with coefficients of determination of about 0.9 and standard deviations for inter-stack differences of less than 4 mm/y. Meanwhile, validations with leveling data indicate that all the three data stacks achieved millimeter-level accuracies. The spatial distribution and temporal evolution of deformation in the LNC as indicated by these InSAR analysis results relates to historical reclamation activities, geological features, and soil mechanisms. This research shows that ground deformation in the LNC after reclamation projects experienced three distinct phases: primary consolidation, a slight rebound, and plateau periods. Full article
Show Figures

Figure 1

28 pages, 15259 KiB  
Article
Calibrate Multiple Consumer RGB-D Cameras for Low-Cost and Efficient 3D Indoor Mapping
by Chi Chen, Bisheng Yang, Shuang Song, Mao Tian, Jianping Li, Wenxia Dai and Lina Fang
Remote Sens. 2018, 10(2), 328; https://doi.org/10.3390/rs10020328 - 22 Feb 2018
Cited by 50 | Viewed by 7381
Abstract
Traditional indoor laser scanning trolley/backpacks with multi-laser scanner, panorama cameras, and an inertial measurement unit (IMU) installed are a popular solution to the 3D indoor mapping problem. However, the cost of those mapping suits is quite expensive, and can hardly be replicated by [...] Read more.
Traditional indoor laser scanning trolley/backpacks with multi-laser scanner, panorama cameras, and an inertial measurement unit (IMU) installed are a popular solution to the 3D indoor mapping problem. However, the cost of those mapping suits is quite expensive, and can hardly be replicated by consumer electronic components. The consumer RGB-Depth (RGB-D) camera (e.g., Kinect V2) is a low-cost option for gathering 3D point clouds. However, because of the narrow field of view (FOV), its collection efficiency and data coverages are lower than that of laser scanners. Additionally, the limited FOV leads to an increase of the scanning workload, data processing burden, and risk of visual odometry (VO)/simultaneous localization and mapping (SLAM) failure. To find an efficient and low-cost way to collect 3D point clouds data with auxiliary information (i.e., color) for indoor mapping, in this paper we present a prototype indoor mapping solution that is built upon the calibration of multiple RGB-D sensors to construct an array with large FOV. Three time-of-flight (ToF)-based Kinect V2 RGB-D cameras are mounted on a rig with different view directions in order to form a large field of view. The three RGB-D data streams are synchronized and gathered by the OpenKinect driver. The intrinsic calibration that involves the geometry and depth calibration of single RGB-D cameras are solved by homography-based method and ray correction followed by range biases correction based on pixel-wise spline line functions, respectively. The extrinsic calibration is achieved through a coarse-to-fine scheme that solves the initial exterior orientation parameters (EoPs) from sparse control markers and further refines the initial value by an iterative closest point (ICP) variant minimizing the distance between the RGB-D point clouds and the referenced laser point clouds. The effectiveness and accuracy of the proposed prototype and calibration method are evaluated by comparing the point clouds derived from the prototype with ground truth data collected by a terrestrial laser scanner (TLS). The overall analysis of the results shows that the proposed method achieves the seamless integration of multiple point clouds from three Kinect V2 cameras collected at 30 frames per second, resulting in low-cost, efficient, and high-coverage 3D color point cloud collection for indoor mapping applications. Full article
Show Figures

Graphical abstract

20 pages, 40917 KiB  
Article
Estimation of Global Vegetation Productivity from Global LAnd Surface Satellite Data
by Tao Yu, Rui Sun, Zhiqiang Xiao, Qiang Zhang, Gang Liu, Tianxiang Cui and Juanmin Wang
Remote Sens. 2018, 10(2), 327; https://doi.org/10.3390/rs10020327 - 22 Feb 2018
Cited by 68 | Viewed by 9205
Abstract
Accurately estimating vegetation productivity is important in research on terrestrial ecosystems, carbon cycles and climate change. Eight-day gross primary production (GPP) and annual net primary production (NPP) are contained in MODerate Resolution Imaging Spectroradiometer (MODIS) products (MOD17), which are considered the first operational [...] Read more.
Accurately estimating vegetation productivity is important in research on terrestrial ecosystems, carbon cycles and climate change. Eight-day gross primary production (GPP) and annual net primary production (NPP) are contained in MODerate Resolution Imaging Spectroradiometer (MODIS) products (MOD17), which are considered the first operational datasets for monitoring global vegetation productivity. However, the cloud-contaminated MODIS leaf area index (LAI) and Fraction of Photosynthetically Active Radiation (FPAR) retrievals may introduce some considerable errors to MODIS GPP and NPP products. In this paper, global eight-day GPP and eight-day NPP were first estimated based on Global LAnd Surface Satellite (GLASS) LAI and FPAR products. Then, GPP and NPP estimates were validated by FLUXNET GPP data and BigFoot NPP data and were compared with MODIS GPP and NPP products. Compared with MODIS GPP, a time series showed that estimated GLASS GPP in our study was more temporally continuous and spatially complete with smoother trajectories. Validated with FLUXNET GPP and BigFoot NPP, we demonstrated that estimated GLASS GPP and NPP achieved higher precision for most vegetation types. Full article
Show Figures

Graphical abstract

20 pages, 9841 KiB  
Article
Assessing the Accuracy of Automatically Extracted Shorelines on Microtidal Beaches from Landsat 7, Landsat 8 and Sentinel-2 Imagery
by Josep E. Pardo-Pascual, Elena Sánchez-García, Jaime Almonacid-Caballer, Jesús M. Palomar-Vázquez, Enrique Priego de los Santos, Alfonso Fernández-Sarría and Ángel Balaguer-Beser
Remote Sens. 2018, 10(2), 326; https://doi.org/10.3390/rs10020326 - 22 Feb 2018
Cited by 98 | Viewed by 9484
Abstract
This paper evaluates the accuracy of shoreline positions obtained from the infrared (IR) bands of Landsat 7, Landsat 8, and Sentinel-2 imagery on natural beaches. A workflow for sub-pixel shoreline extraction, already tested on seawalls, is used. The present work analyzes the behavior [...] Read more.
This paper evaluates the accuracy of shoreline positions obtained from the infrared (IR) bands of Landsat 7, Landsat 8, and Sentinel-2 imagery on natural beaches. A workflow for sub-pixel shoreline extraction, already tested on seawalls, is used. The present work analyzes the behavior of that workflow and resultant shorelines on a micro-tidal (<20 cm) sandy beach and makes a comparison with other more accurate sets of shorelines. These other sets were obtained using differential GNSS surveys and terrestrial photogrammetry techniques through the C-Pro monitoring system. 21 sub-pixel shorelines and their respective high-precision lines served for the evaluation. The results prove that NIR bands can easily confuse the shoreline with whitewater, whereas SWIR bands are more reliable in this respect. Moreover, it verifies that shorelines obtained from bands 11 and 12 of Sentinel-2 are very similar to those obtained with bands 6 and 7 of Landsat 8 (−0.75 ± 2.5 m; negative sign indicates landward bias). The variability of the brightness in the terrestrial zone influences shoreline detection: brighter zones cause a small landward bias. A relation between the swell and shoreline accuracy is found, mainly identified in images obtained from Landsat 8 and Sentinel-2. On natural beaches, the mean shoreline error varies with the type of image used. After analyzing the whole set of shorelines detected from Landsat 7, we conclude that the mean horizontal error is 4.63 m (±6.55 m) and 5.50 m (±4.86 m), respectively, for high and low gain images. For the Landsat 8 and Sentinel-2 shorelines, the mean error reaches 3.06 m (±5.79 m). Full article
(This article belongs to the Section Remote Sensing in Geology, Geomorphology and Hydrology)
Show Figures

Graphical abstract

Previous Issue
Next Issue
Back to TopTop