Article

The Contribution of Multi-Sensor Infrared Satellite Observations to Monitor Mt. Etna (Italy) Activity during May to August 2016

1
Consiglio Nazionale delle Ricerche, Istituto di Metodologie per l’Analisi Ambientale, C. da S. Loja, 85050 Tito Scalo, Italy
2
Istituto Nazionale di Geofisica e Vulcanologia, Sezione di Catania, Osservatorio Etneo, Piazza Roma 2, 95125 Catania, Italy
3
Università della Basilicata, Scuola di Ingegneria, Via dell’Ateneo Lucano, 10, 85100 Potenza, Italy
*
Author to whom correspondence should be addressed.
Remote Sens. 2018, 10(12), 1948; https://doi.org/10.3390/rs10121948
Submission received: 8 October 2018 / Revised: 18 November 2018 / Accepted: 30 November 2018 / Published: 4 December 2018
(This article belongs to the Special Issue Remote Sensing of Volcanic Processes and Risk)

Abstract

:
In May 2016, three powerful paroxysmal events, mild Strombolian activity, and lava emissions took place at the summit crater area of Mt. Etna (Sicily, Italy). During, and immediately after the eruption, part of the North-East crater (NEC) collapsed, while extensive subsidence affected the Voragine crater (VOR). Since the end of the May eruptions, a diffuse fumarolic activity occurred from a fracture system that cuts the entire summit area. Starting from 7 August, a small vent (of ~20–30 m in diameter) opened up within the VOR crater, emitting high-temperature gases and producing volcanic glow which was visible at night. We investigated those volcanic phenomena from space, exploiting the information provided by the satellite-based system developed at the Institute of Methodologies for Environmental Analysis (IMAA), which monitors Italian volcanoes in near-real time by means of the RSTVOLC (Robust Satellite Techniques–volcanoes) algorithm. Results, achieved integrating Advanced Very High Resolution Radiometer (AVHRR) and Moderate Resolution Imaging Spectroradiometer (MODIS) observations, showed that, despite some issues (e.g., in some cases, clouds masking the underlying hot surfaces), RSTVOLC provided additional information regarding Mt. Etna activity. In particular, results indicated that the Strombolian eruption of 21 May lasted longer than reported by field observations or that a short-lived event occurred in the late afternoon of the same day. Moreover, the outcomes of this study showed that the intensity of fumarolic emissions changed before 7 August, as a possible preparatory phase of the hot degassing activity occurring at VOR. In particular, the radiant flux retrieved from MODIS data decreased from 30 MW on 4 July to an average value of about 7.5 MW in the following weeks, increasing up to 18 MW a few days before the opening of a new degassing vent. These outcomes, in accordance with information provided by Sentinel-2 MSI (Multispectral Instrument) and Landsat 8-OLI (Operational Land Imager) data, confirm that satellite observations may also contribute greatly to the monitoring of active volcanoes in areas where efficient traditional surveillance systems exist.

Graphical Abstract

1. Introduction

Several papers have shown that satellite remote sensing may play an important role for studying and monitoring thermal volcanic activity, due to global coverage, continuity, and high frequency of observation, particularly in remote areas where ground-based surveillance systems are often lacking (e.g., [1,2,3,4,5]).
Sensors such as TM (Thematic Mapper) and ASTER (Advanced Spaceborne Thermal Emission and Reflection Radiometer), that have a repeat cycle of 16 days and offer channels in the SWIR (shortwave infrared) and TIR (thermal infrared) bands with a spatial resolution of 30–90 m, were widely used to investigate volcanic thermal anomalies (e.g., lava bodies, fumarole fields) [1,6,7,8]. HYPHERION, which is a hyperspectral imaging spectrometer providing VNIR (visible, near-infrared)/SWIR data at 220 wavelengths, was profitably used even for characterizing hot magmatic surfaces (e.g., [7,8]). AVHRR (Advanced Very High Resolution Radiometer) and MODIS (Moderate Resolution Imaging Spectroradiometer), acquiring data in the MIR (medium infrared) band and offering a good compromise between spatial and temporal resolution (1.1 km at the nadir; up to 6 h for AVHRR), represented key instruments for monitoring active volcanoes from space (e.g., [9,10,11,12,13,14]). SEVIRI (Spinning Enhanced Visible and Infrared Imager), like other geostationary satellite sensors, enabled the prompt identification of short-lived eruptive events (e.g., [15,16,17,18,19]), thanks to the high frequency of observation (15 min) and despite the low spatial resolution (3 km at the sub-satellite point).
Data from the above-mentioned sensors were exploited to retrieve the volcanogenic radiant flux, the time variations of which can be used as a proxy of the intensity changes of volcanic eruptions (e.g., [20,21,22,23,24]). This parameter enables the estimation of lava effusion rate, which is a critical parameter for numerical models that aim to predict lava flow paths (e.g., [25]).
In this paper, we present the results of satellite monitoring of Mt. Etna (Sicily, Italy) thermal activity between May and August 2016, integrated with ground-based structural and volcanological data. In particular, we investigate the eruptive events occurring in May and the fumarolic emissions recorded before the opening of a small degassing vent within the Voragine crater (VOR). The latter is one of Mt. Etna summit craters which has opened at the top of the central conduit, see Figure 1 [26,27].
These events were investigated by means of a satellite-based system developed at IMAA (Institute of Methodologies for Environmental Analysis) implementing the RSTVOLC algorithm [28]. This monitoring system integrates AVHRR and MODIS observations for monitoring Italian volcanoes in near-real time, generating hotspot products (i.e., JPG, Kml, and ASCII files) a few minutes after the sensing time [29]. The work aims at assessing the contribution that multi-platform satellite observations may provide for better monitoring Mt. Etna, complementing the information provided by traditional surveillance systems.

2. The 2016 Mt. Etna Eruptive Activity

Five months after the early-December 2015 eruptions [30,31], ash emissions resumed at the North-East crater (NEC) during the night of 15–16 May 2016, while a Strombolian activity started the day after [32]. On the morning of 18 May, a 20–30 m long, short-lived (a few minutes) eruptive fissure activated on the northern flank of the NEC displaying weak spattering, immediately followed by violent Strombolian activity which occurred at the VOR crater. At that time, an eruptive fissure also opened feeding a lava flow, which expanded on the high Western flank of Mt. Etna. Within a couple of hours, the Strombolian activity at VOR totally filled this crater and the adjacent Bocca Nuova crater (BN), finally overflowing the BN western rim. The eruptive activity ceased the following night but resumed on early 19 May for ~1 h. On 20 May, a strong explosive activity started again at VOR and a new fracture field opened between VOR and the New South-East crater (NSEC), feeding a lava flow that expanded toward the east in the high Valle del Bove depression. At the same time, a new lava overflow occurred from the western rim of the BN. After a break of about a day, mild Strombolian activity resumed during the night between the 22 and 23 May at NEC, while lava fountaining occurred on the 24–25 May at VOR which eventually caused the total filling and obstruction of NEC, VOR, and BN.
At the end of the 15–25 May eruptions, a ~N-S fractured area characterized the volcano’s summit. This fracture field was ~400 m wide and ~2000 m long, extending from the northern flank of the NEC to the eastern flank of the NSEC cone, crossing the eastern rim of the VOR, see Figure 1. This fracture field is bounded towards the east by a graben several tens of meters wide that also caused the collapse of the southern portion of the pyroclastic cone of the NEC, radically changing its morphology. As stated before, in the central crater, which contains VOR and BN, see Figure 1, the eruptive activity emerged at VOR only. After the end of the Strombolian activity that occurred on the 23–25 May, the VOR showed conspicuous subsidence phenomena, evidenced by the formation of numerous sub-circular and concentric fractures (lunar cracks) placed around a weakly degassing vent positioned at the bottom of this crater. Moreover, the BN was totally obstructed by products that erupted in May 2016; however, soon after the end of the eruption a weak subsidence also began to affect this crater.
Late in the evening of 7 August 2016, the top of Etna showed almost continuous flashes. Since that moment, a new 20−30 m wide vent, placed on the inner eastern rim of VOR, emits a pulsating emission of incandescent gases up to over 600 °C, see Figure 2; video footage of this activity can be found as a supplementary material. The new degassing vent fits perfectly into the structural framework inherited from the eruption of May 2016, see Figure 3. It is located in the area where the graben, described before, intercepts the edge of the VOR; i.e., an area subject to open for the “pull” induced by the movement of the eastern flank of the volcano [33,34,35,36,37] and for the subsidence that affects the bottom of the VOR.

3. Methods: RSTVOLC Algorithm

The RSTVOLC algorithm [28] identifies volcanic hotspots by means of two local variation indices defined as:
M I R ( x , y , t ) = B T M I R ( x , y , t ) μ M I R ( x , y ) σ M I R ( x , y )
M I R T I R ( x , y , t ) = Δ T ( x , y , t ) μ Δ T ( x , y ) σ M I R ( x , y )
In Equation (1), B T M I R ( x , y , t ) is the MIR (medium infrared) brightness temperature measured at the time t for each pixel ( x , y ) , whereas μ M I R ( x , y ) and σ M I R ( x , y )   are the relative temporal mean and standard deviation. In Equation (2), Δ T ( x , y , t ) = B T M I R ( x , y , t )     B T T I R ( x , y , t ) , where B T T I R ( x , y , t ) is the brightness temperature measured in the TIR (thermal infrared) band at around 11 µm wavelength; μ Δ T ( x , y ) and σ Δ T ( x , y ) stand for the relative temporal mean and standard deviation. These terms are calculated after processing cloud-free satellite records selected according to specific homogeneity criteria (i.e., same spectral channel/s, calendar month, satellite overpass time). In particular, the OCA (One Channel Cloud-Detection Approach) RST-based method [38] is generally used to filter out cloudy pixels from the scenes. The iterative k σ clipping filter, which is also implemented within the RSTVOLC process, enables the removal of signal outliers (e.g., extremely hot pixels) [29].
The M I R ( x , y , t ) index identifies anomalous signal variations in the MIR band of sensors like AVHRR (channel 3: 3.55–3.93 µm) and MODIS (channels 21/22: 3.929–3.989 µm), where hot magmatic surfaces reach the peak of thermal emissions [39,40]. The M I R T I R ( x , y , t ) index is used jointly with the previous one for minimizing spurious effects associated with non-volcanological signal fluctuations [28]. RSTVOLC, combining those indices, is capable of guaranteeing an efficient identification of volcanic thermal anomalies (a cloud-masking procedure is used in the daytime before running the algorithm) under different observational conditions (e.g., [12,18,41,42,43]).

4. Results

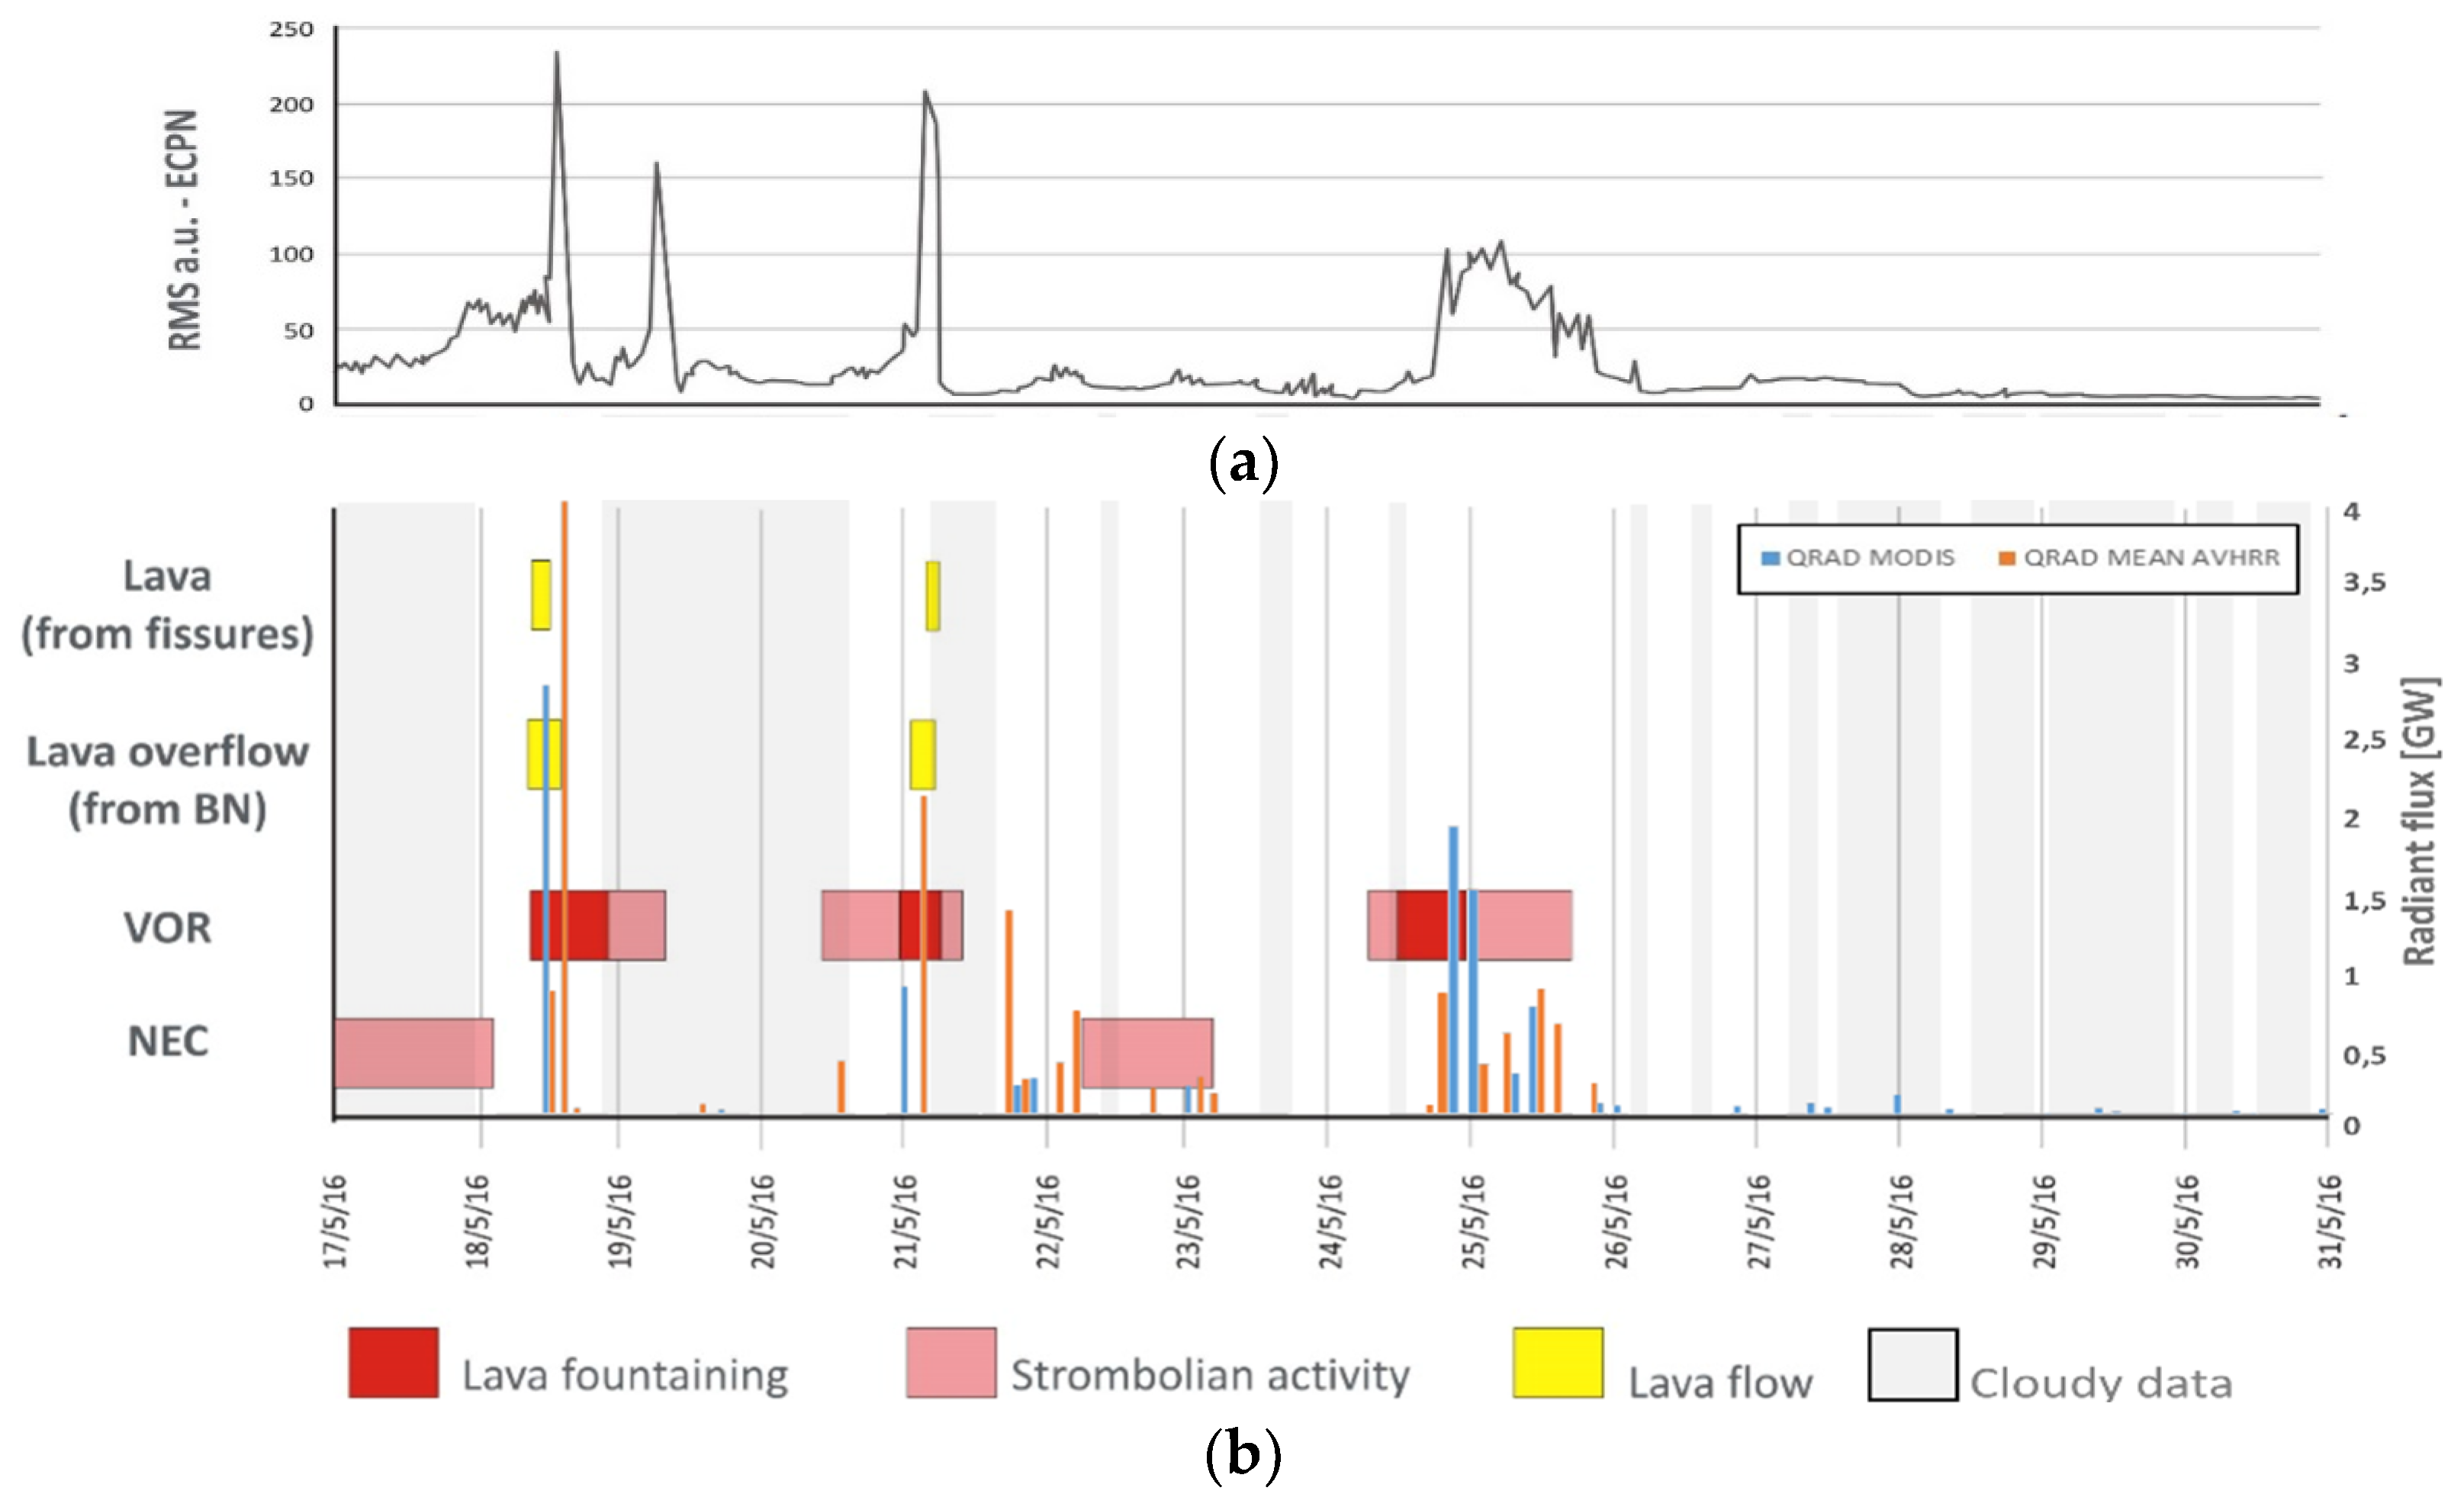
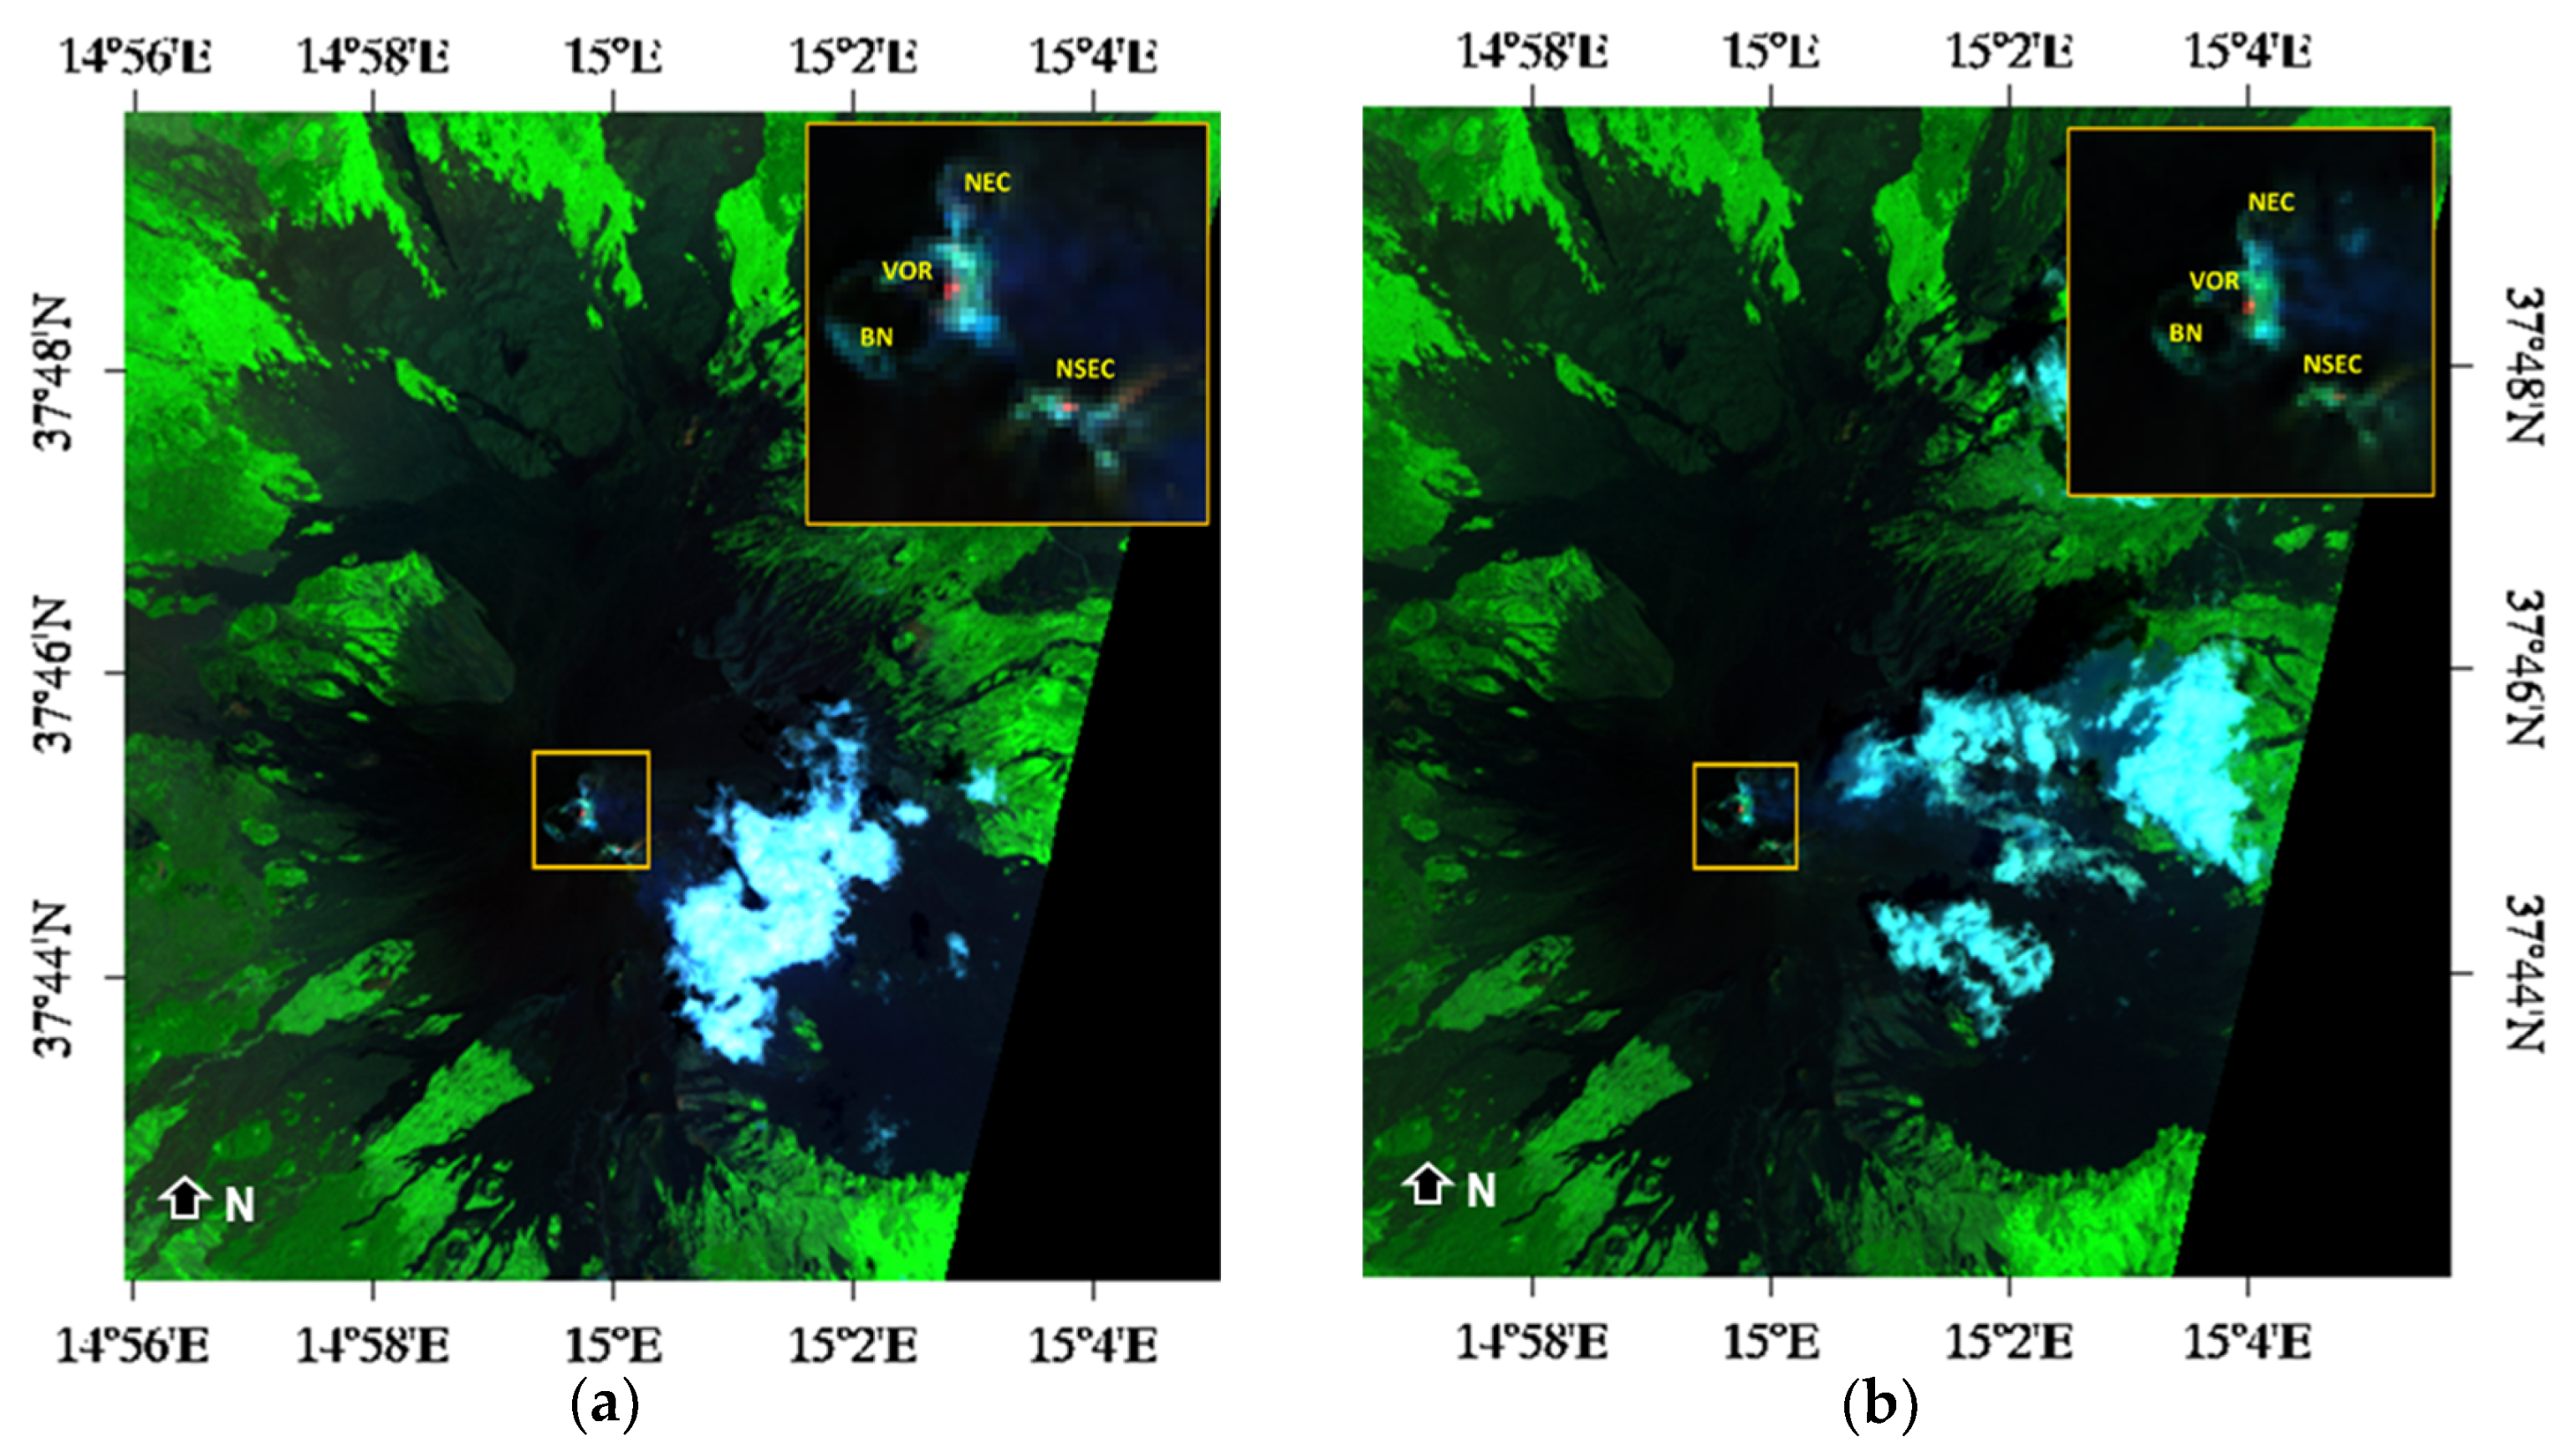
4.1. Monitoring the Paroxysmal Events of May 2016

To investigate the Mt. Etna eruptive events of May 2016, we show, in Figure 4, the curve of the volcanic tremor (top panel) and the time series of the radiant flux ( Q r a d ) retrieved from AVHRR and MODIS data uncorrected for atmospheric effects (bottom panel). In more detail, in Figure 4b, we also show eruption chronology and overcast periods, for better assessing the impact of clouds on the achieved results. We estimated the radiant flux from infrared AVHRR data by outputs of a dual band-three components method [44]; the mean Q r a d value calculated from two end-members was considered. The formulation proposed by [45] and amended by [46] was used to retrieve the same parameter from MODIS data.
Figure 4b shows that the radiant flux estimated by satellite ranged, during the period of interest, from a few MW up to a few GW. In particular, the paroxysmal event of May 18 was the most intense, leading to Q r a d values, retrieved from daytime MODIS and AVHRR data acquired under comparable values of satellite zenith angle (SZA), in the range 2.5–4.0 GW. This paroxysm, occurring with lava fountaining from VOR and a lava overflow from BN, generated the major peak in the volcanic tremor, see Figure 4a. The following Strombolian activity lead to another sudden increase of this parameter but it was undetected by RSTVOLC because of clouds, see Figure 4b.
During 20–21 May, another significant increase of Q r a d , up to about 2.0 GW, was recorded. This increase of radiant flux was determined by an eruptive activity similar to that of 18 May (see eruption chronology), leading to the third abrupt increment in the volcanic tremor. The latter increased, although in a less significant way than before, on 24 May when another lava fountaining activity occurred. Based on the retrieved Q r a d values, this eruptive episode was slightly less intense than the previous one. Figure 4b shows that RSTVOLC also identified the Strombolian event of 22–23 May. Moreover, it detected a thermal anomaly in between the Strombolian activities of 21 May and 22 May, as indicated by values of the radiant flux retrieved in that period which were mostly lower than 1 GW. In addition, an abrupt increase of Q r a d was recorded in short-time intervals (e.g., in between AVHRR and MODIS observations of 24 May at 20:23 UTC and 21:12 UTC), revealing some abrupt variations in the intensity of the volcanic thermal emissions. However, due to cloud coverage and satellite overpass times, some thermal activities (e.g., see 24 May) were undetected from space. On the other hand, even the discontinuous identification of a low-level thermal anomaly after 25 May, possibly associated to a weak degassing from VOR (leading to a minimum Q r a d value of about 7.5 MW), is ascribable to clouds.

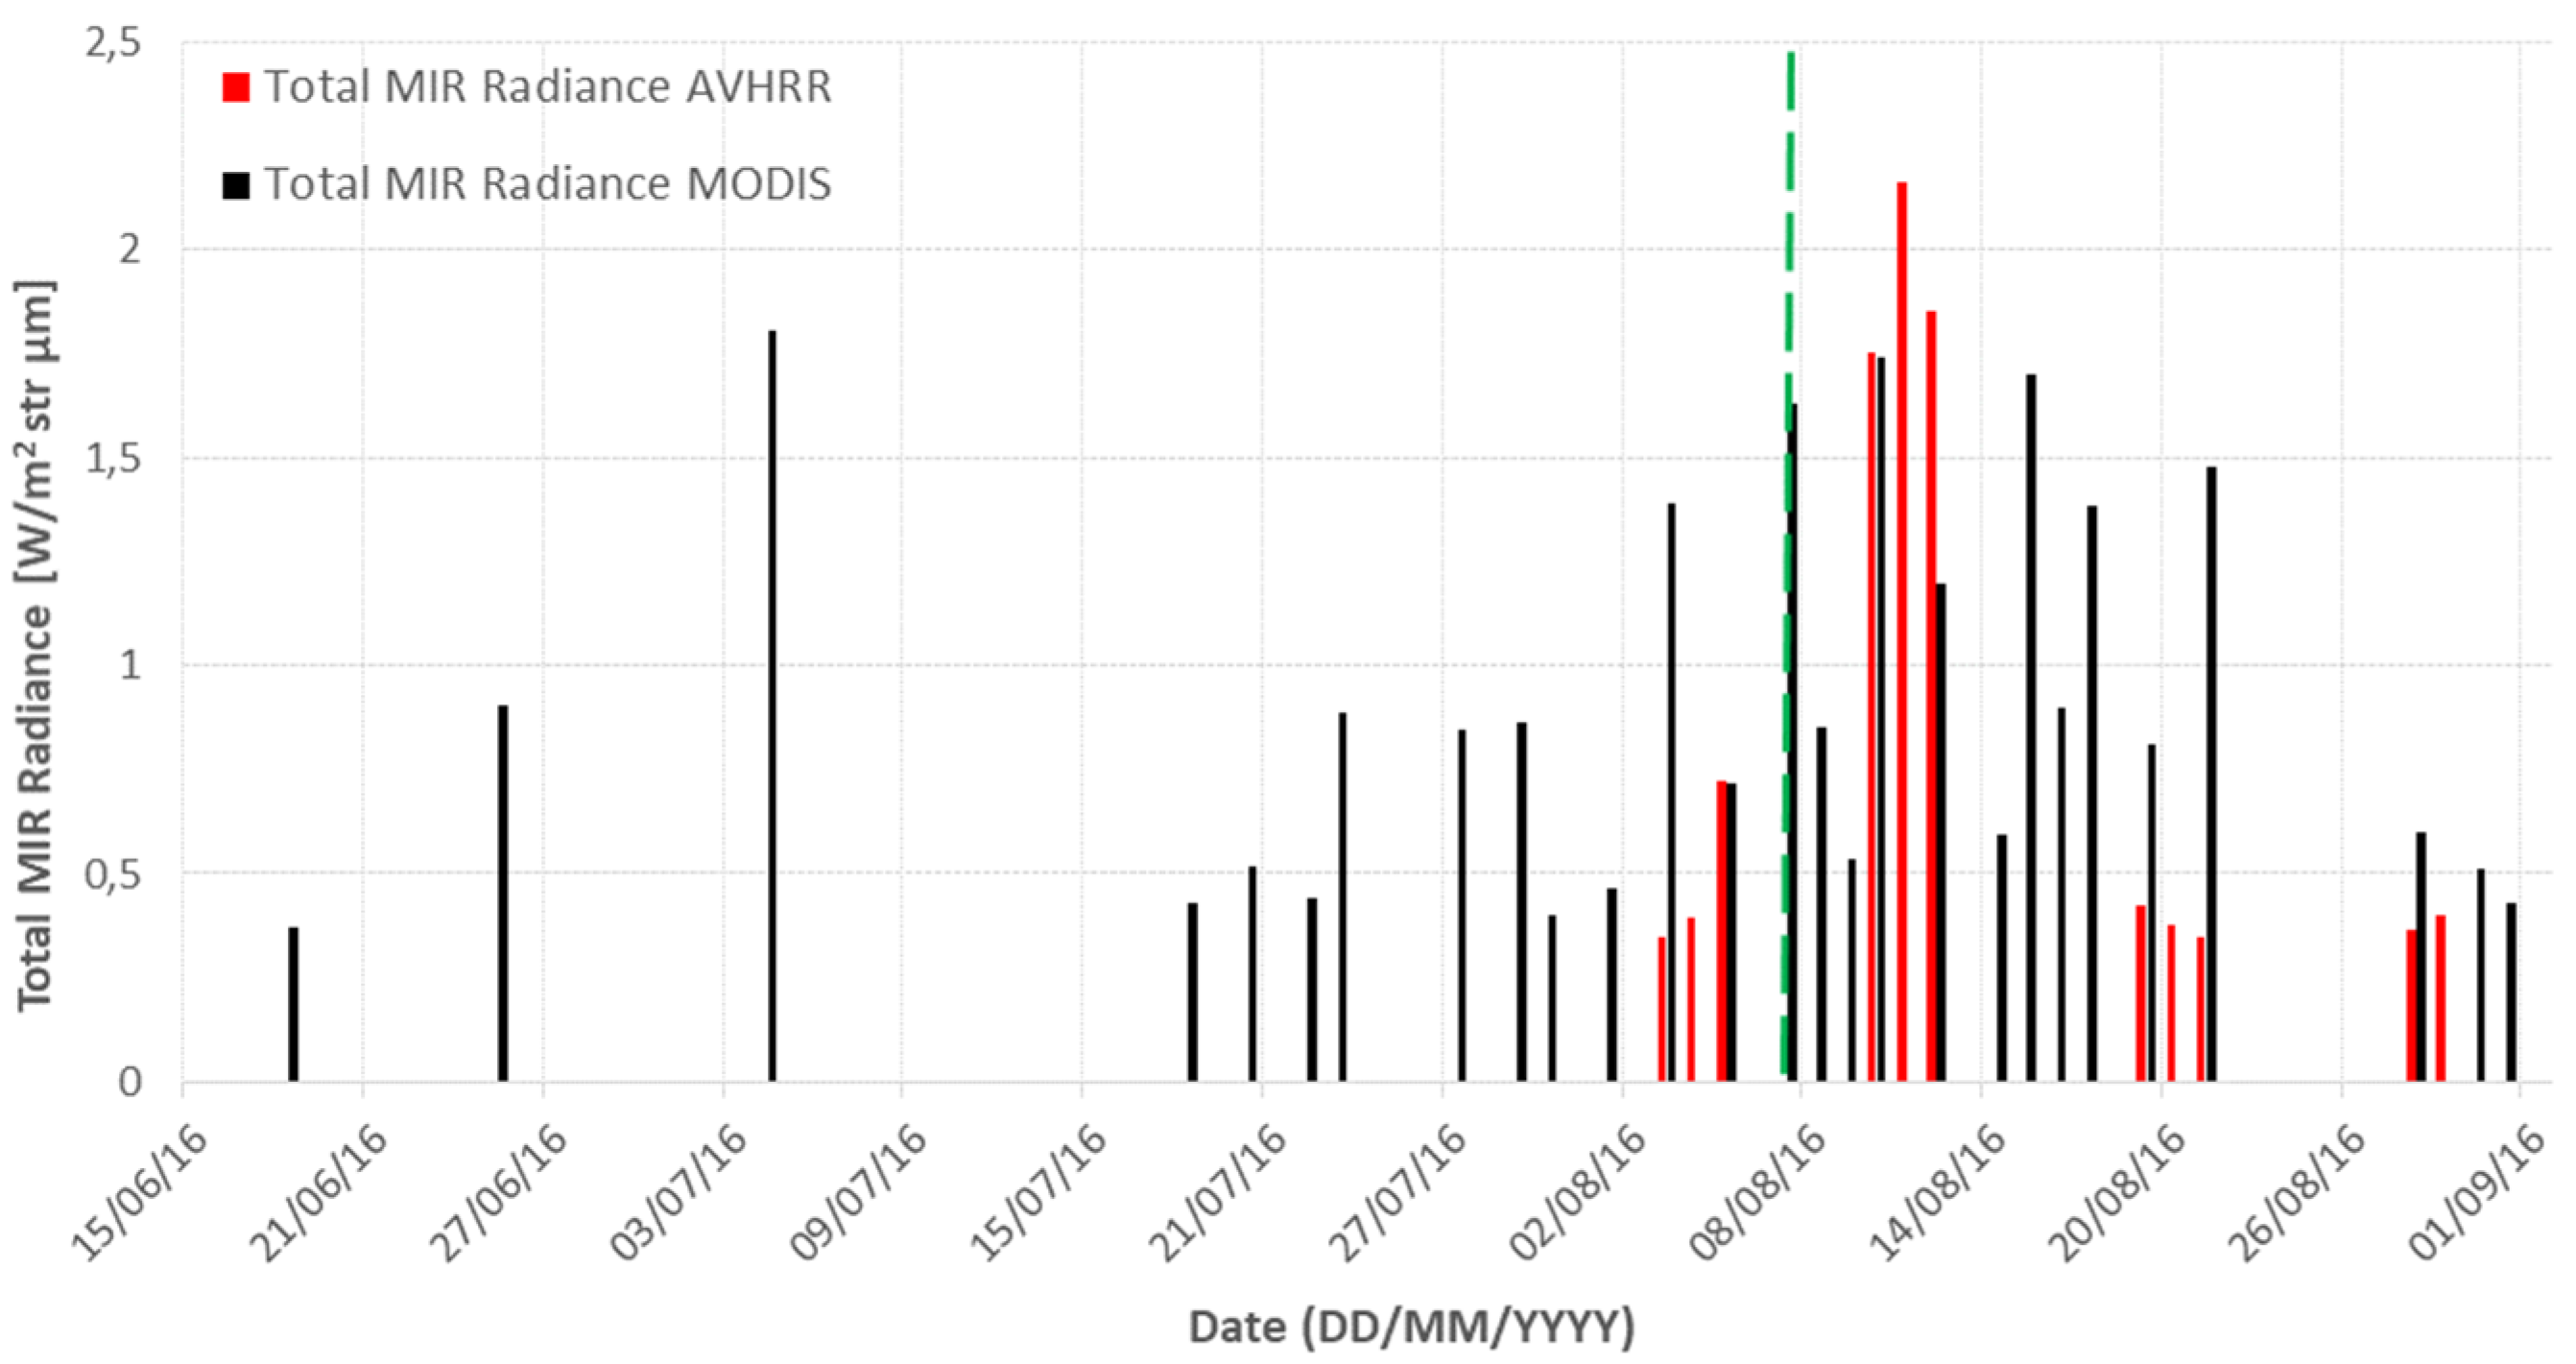
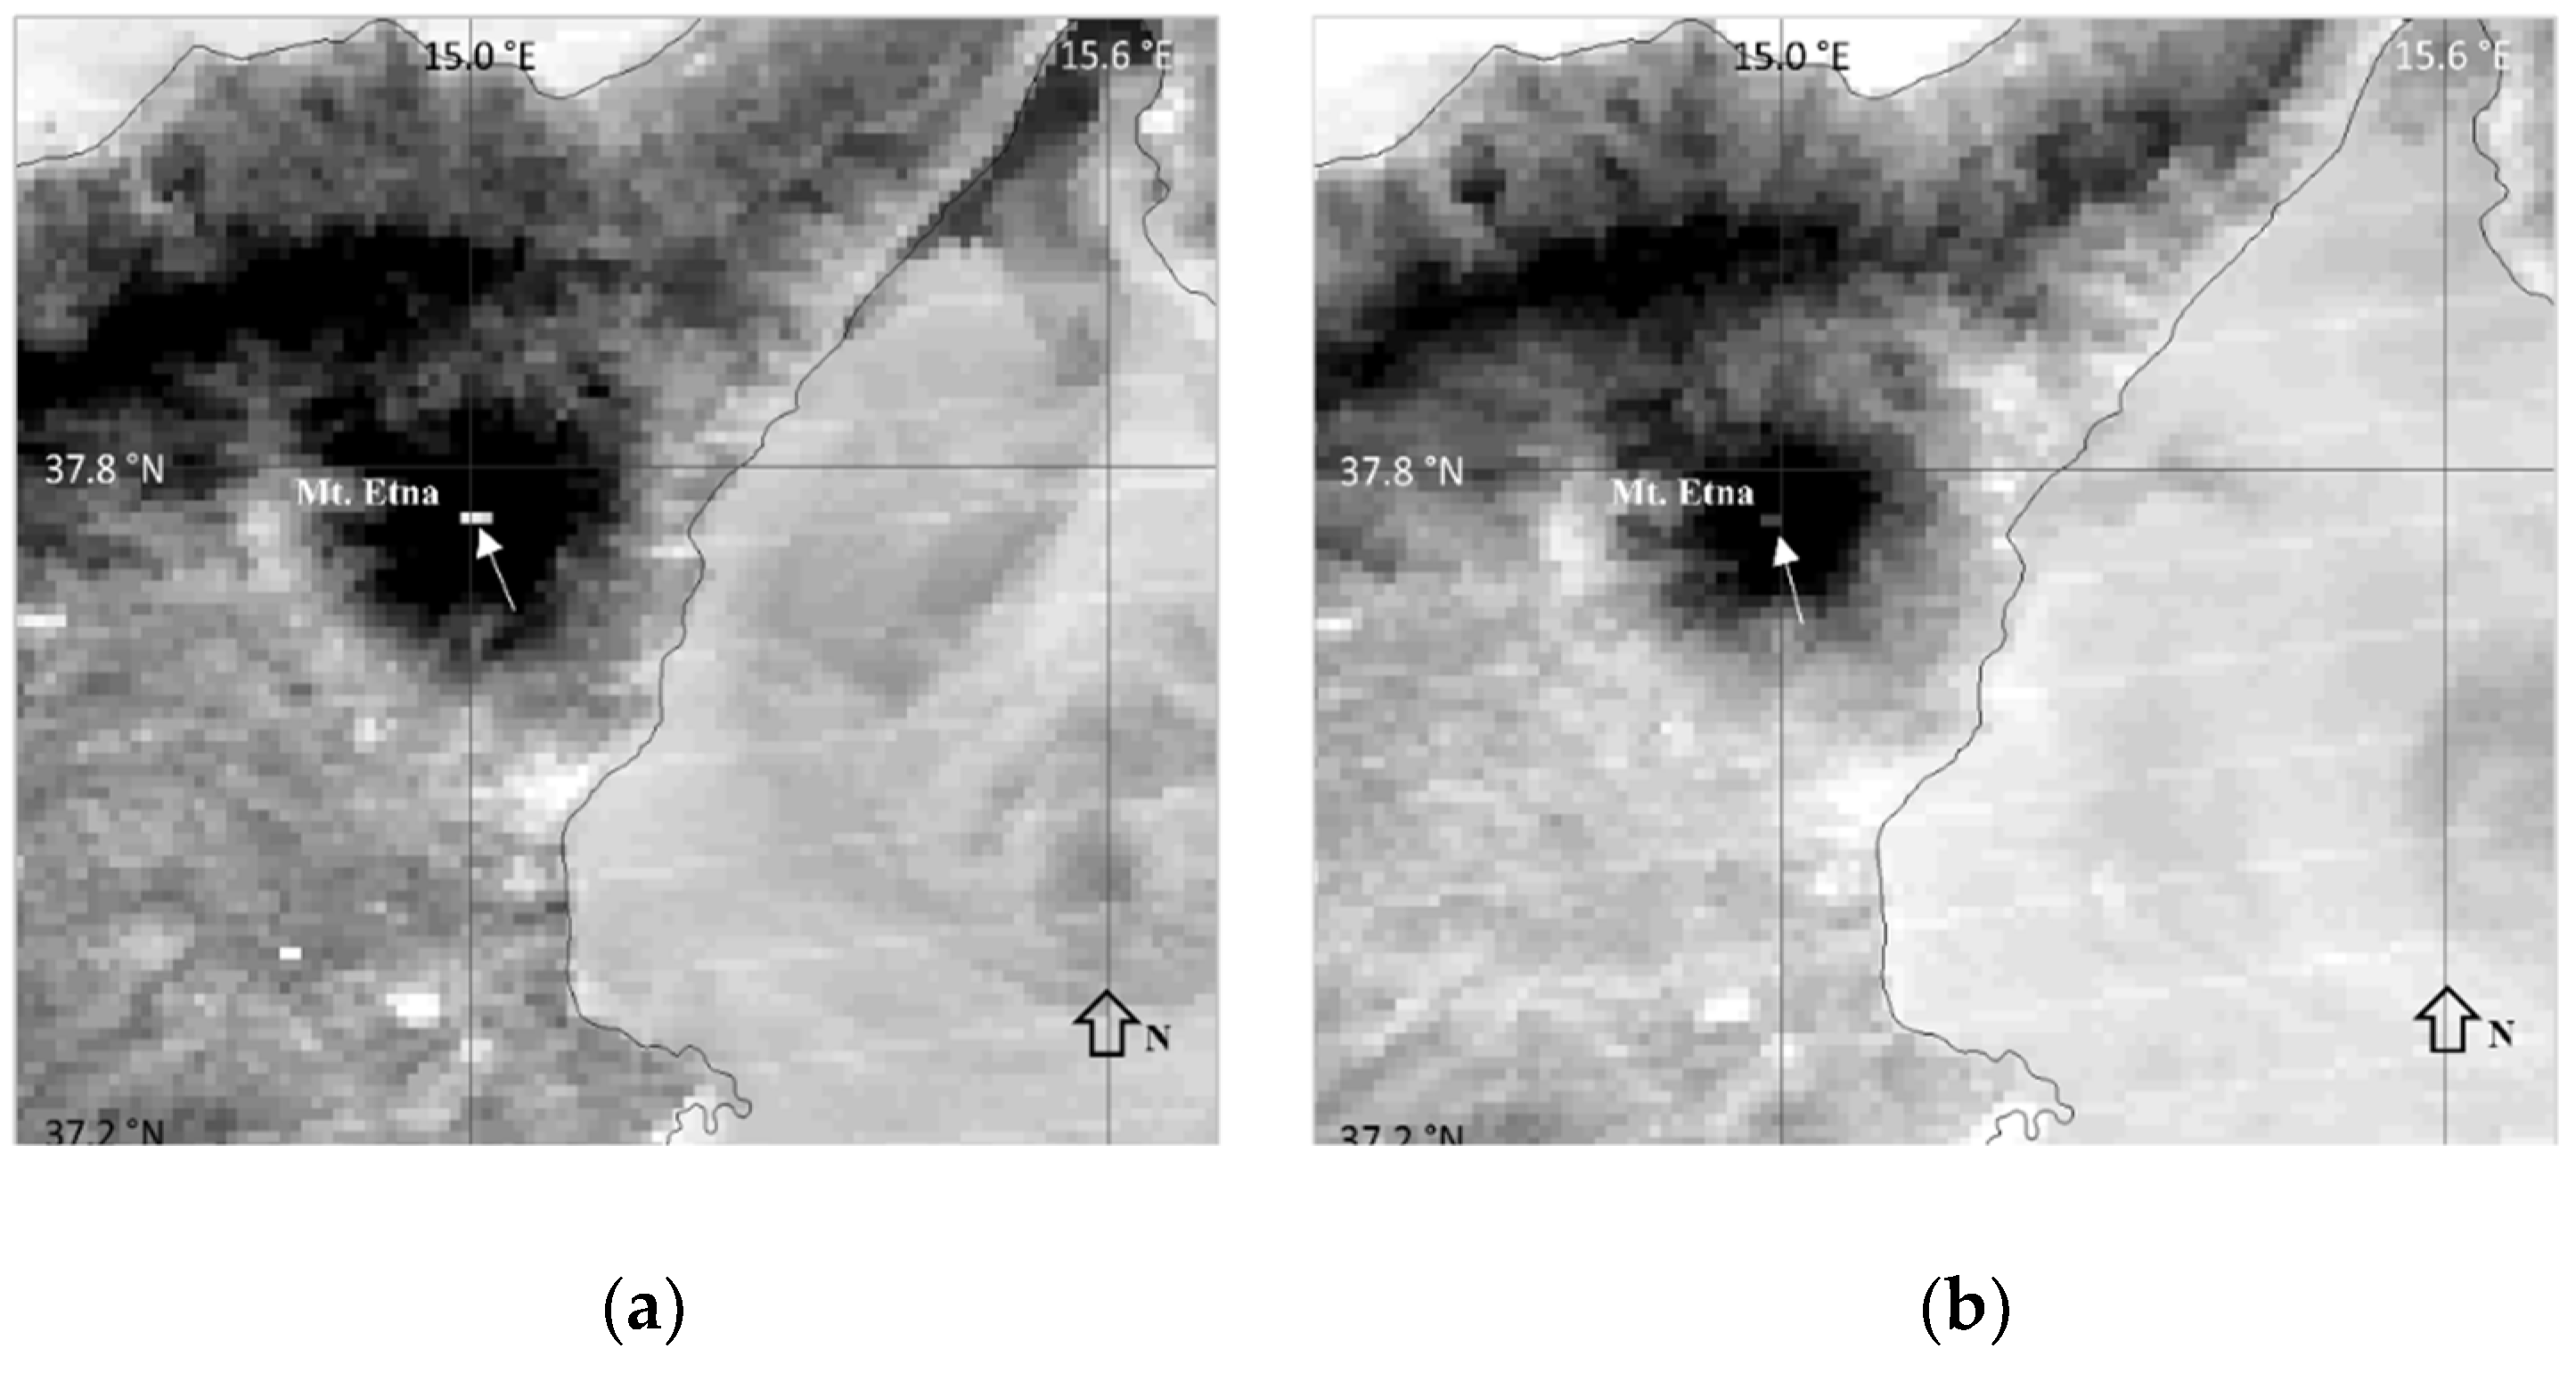
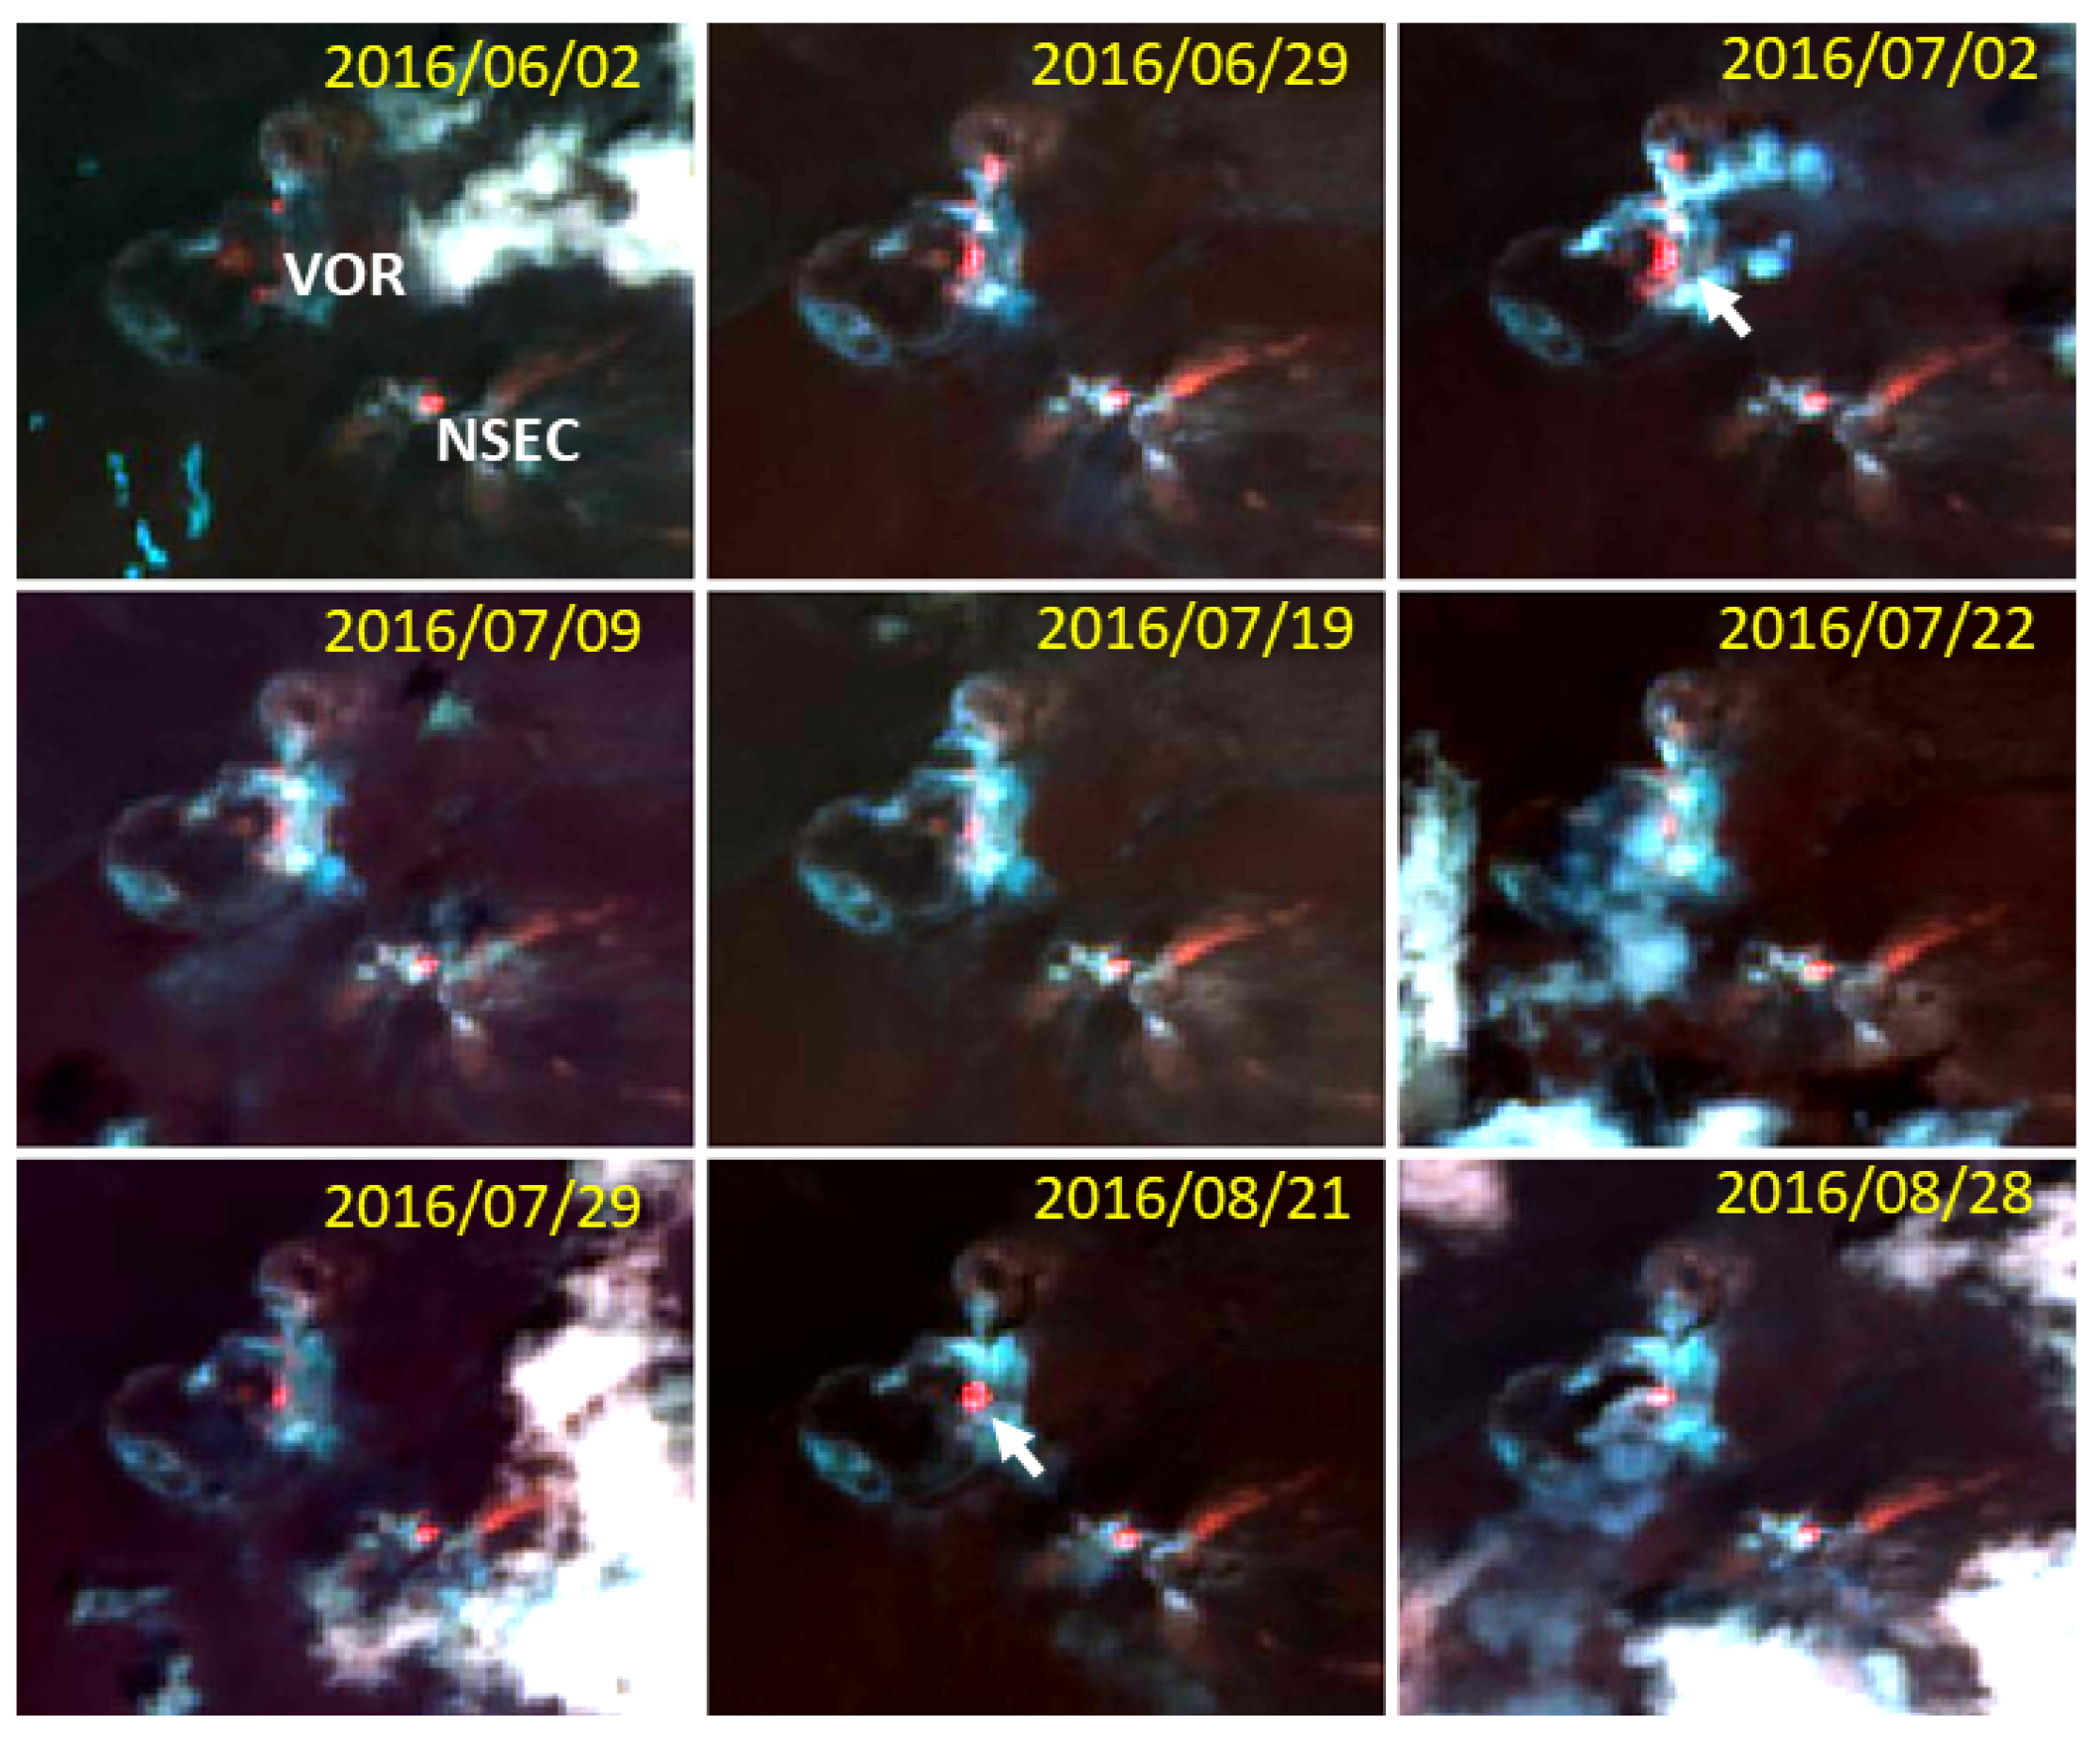
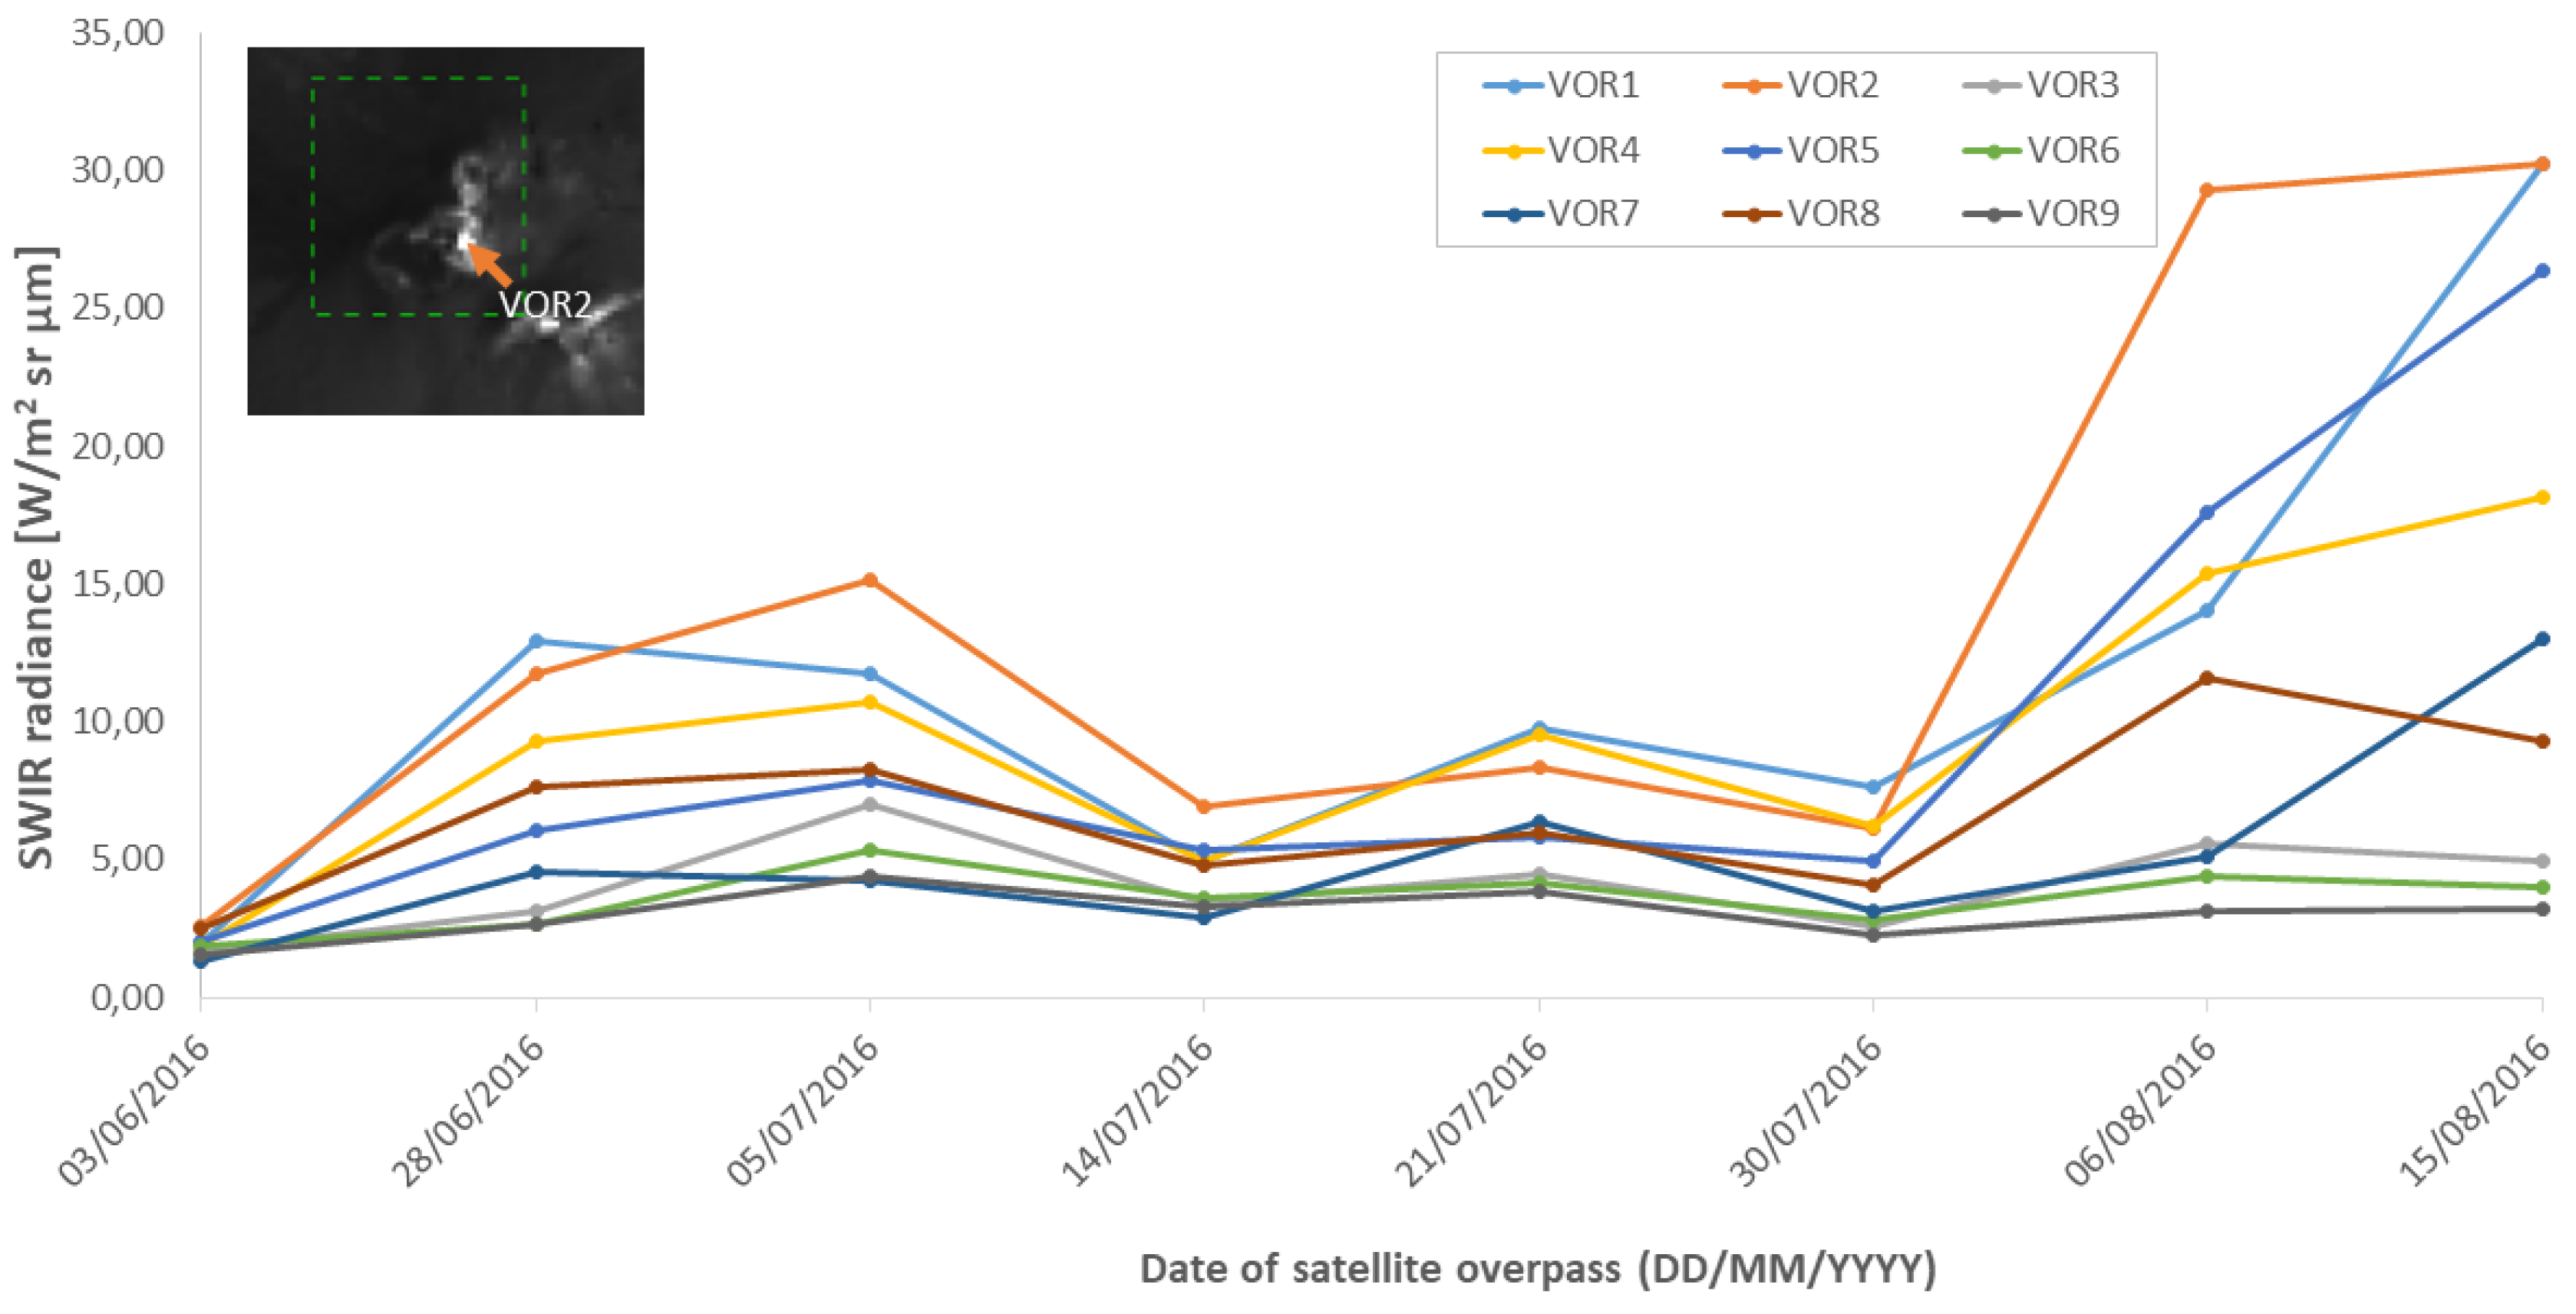
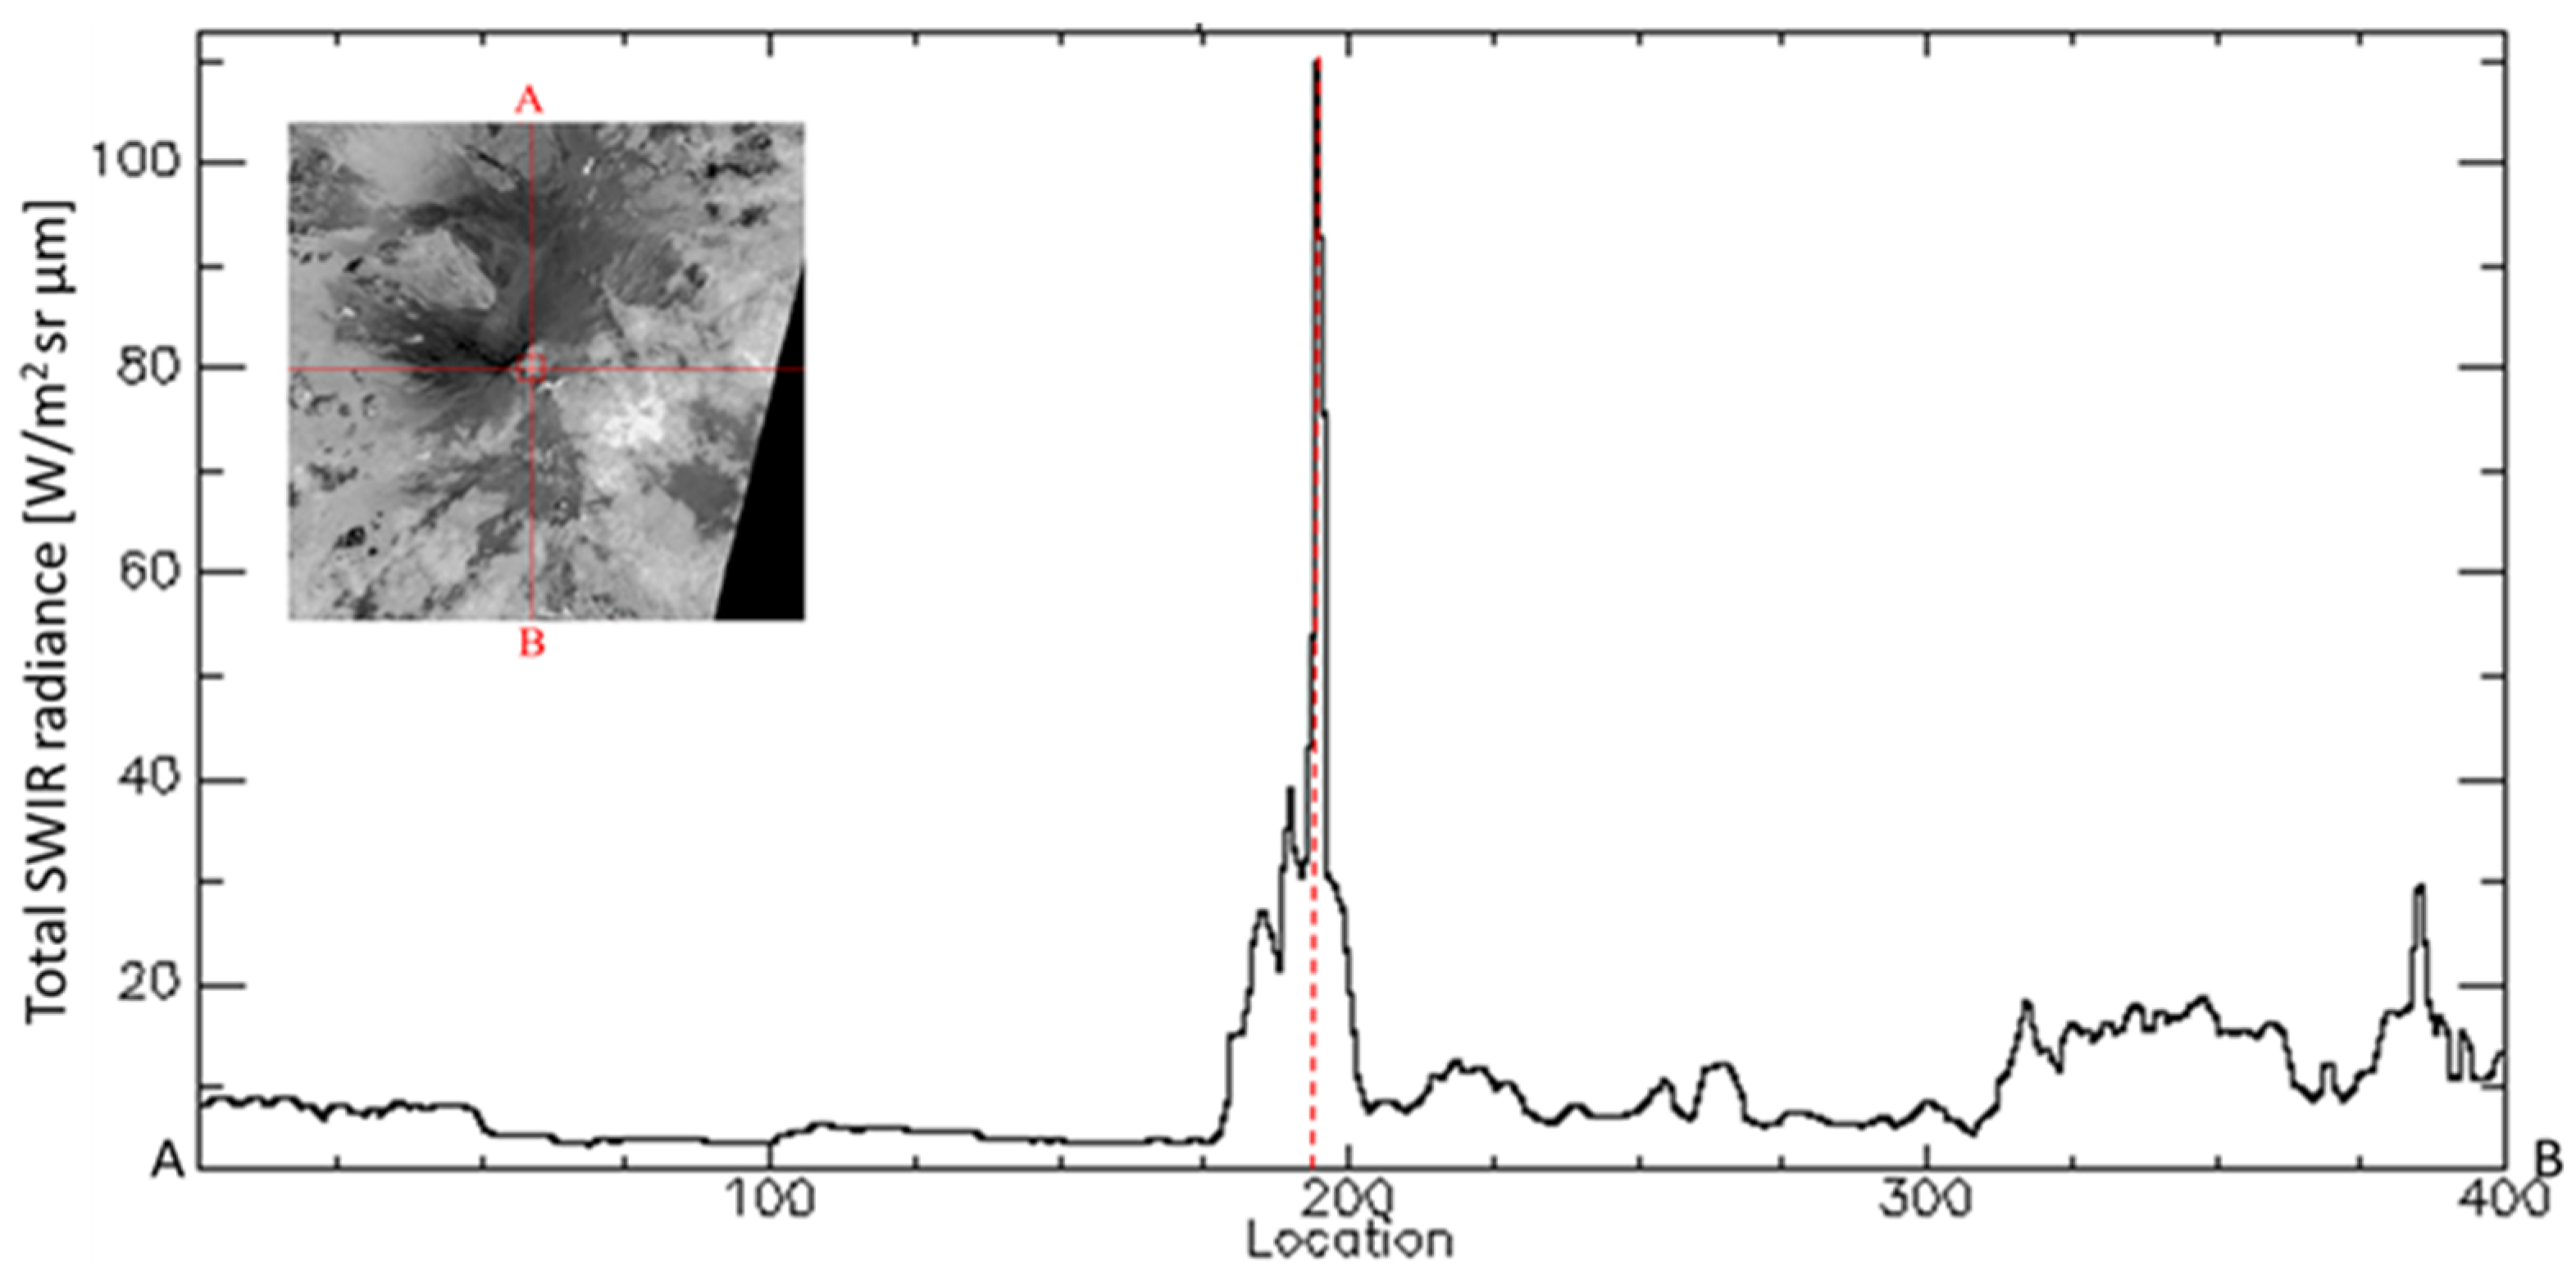
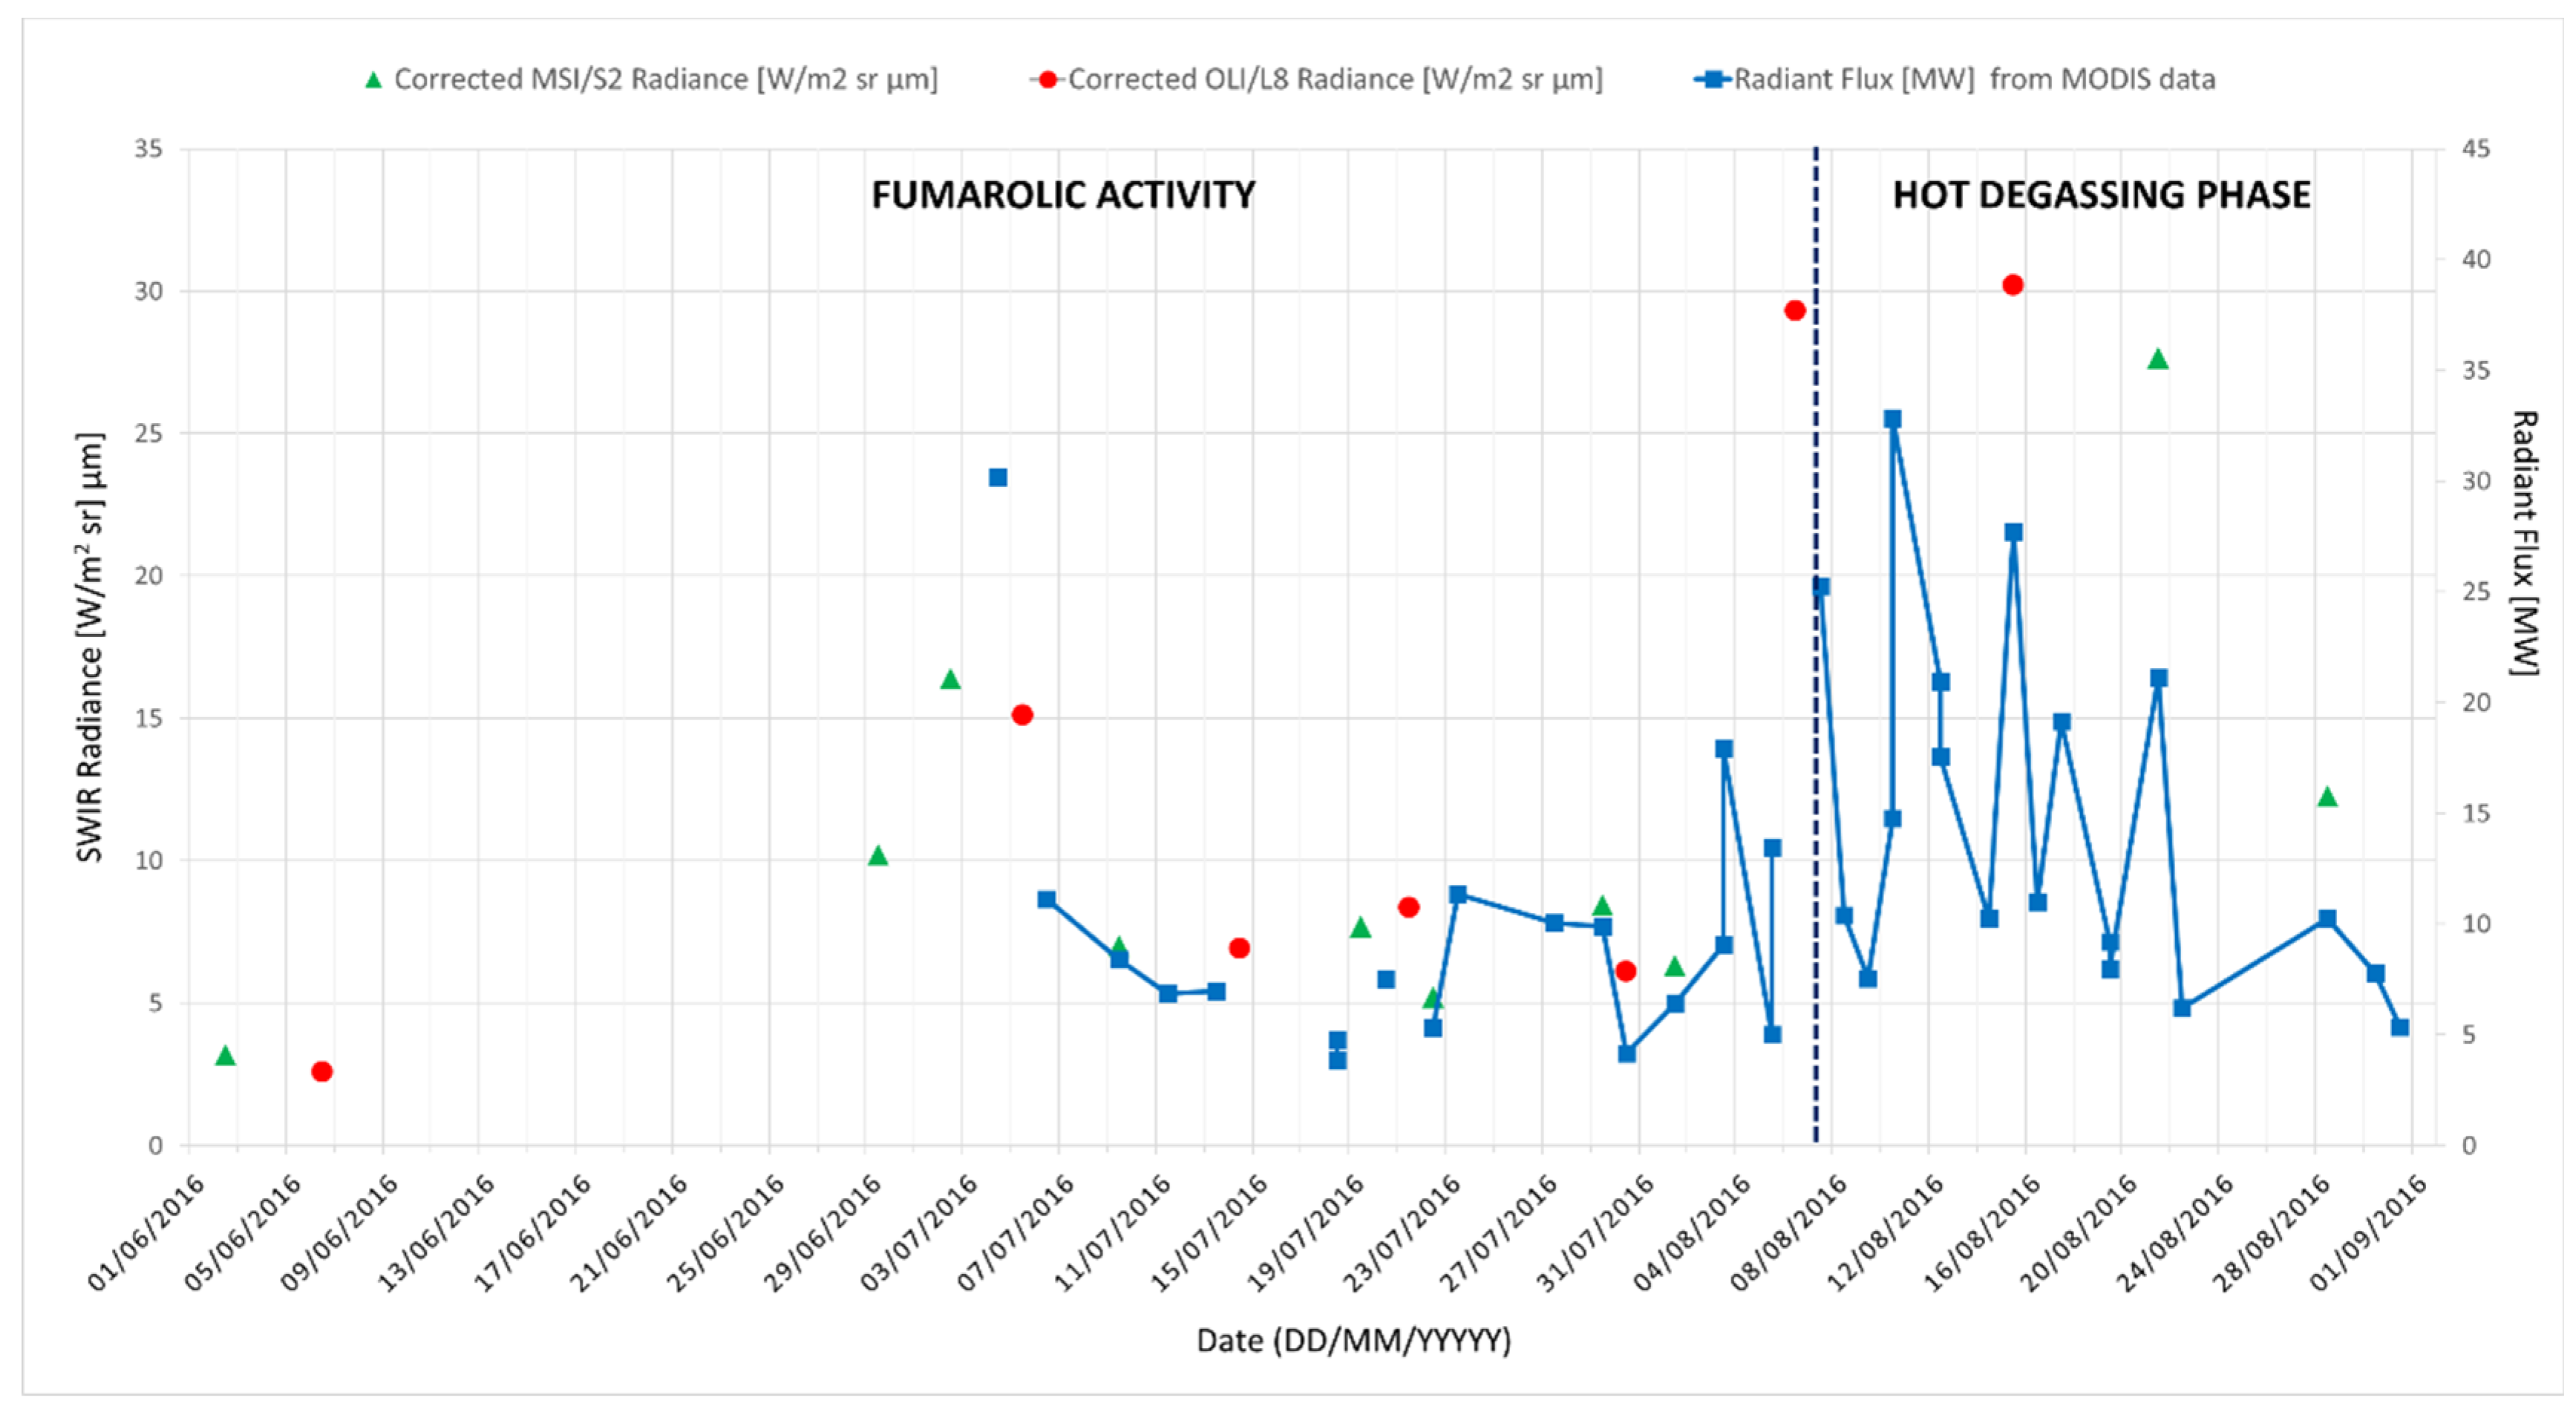
4.2. Investigating the Thermal Activity of June–August 2016

In Figure 5, we show the temporal trend of the total MIR radiance retrieved from nighttime AVHRR and MODIS records of June–August 2016. We investigated only data with relatively low values of satellite zenith angle (i.e., SZA < 40°), unlike the eruptive events of May 2016, for minimizing the impact of the satellite viewing geometry on the thermal anomaly detected from space.
During the first week of June, no MODIS data were acquired at IMAA because of some antenna problems. In July, AVHRR records were unprocessed due to some geolocation issues (the system was back to being fully operational in early August). Despite these limitations, reducing the number of available satellite scenes, RSTVOLC provided information about changes in Mt. Etna thermal activity.
Indeed, after the identification of a sporadic thermal anomaly in June RSTVOLC revealed, since early July, the occurrence of more continuous thermal emissions at the crater area. In more detail, Figure 5 shows that after 4 July, the total MIR radiances decreased, because of a less significant thermal anomaly (see Figure 6), showing small fluctuations until 3 August when an evident increase of this parameter was recorded. During 10–12 August, detected thermal anomaly was more extended in terms of hot spot pixels, as shown by RSTVOLC maps which are not reported here, leading to peak of total MIR radiance.
To assess RSTVOLC detections, as well as changes of thermal activity revealed by Figure 5, we analysed the cloud-free Sentinel 2A-MSI (Multispectral Instrument) data of June–August 2016 made freely available online by the Sentinel Hub.
The MSI has 13 spectral channels centered in the VNIR and SWIR bands having a different spatial resolution [47]. In Figure 7, we show a number of false color composite images, nine in total from 2 June to 28 August, magnified over the Mt. Etna crater area. These RGB (red-green-blue) products, at a 20-m spatial resolution, were generated by using bands 12 (2.19 µm), 8A (0.865 µm) and 4 (0.665 µm). The figure shows that some crater pixels assumed the red color owing to the dominance of the SWIR component.
Since high-temperature magmatic surfaces are highly radiant even in the SWIR region (e.g., [48]), and considering that other features (e.g., clouds) are clearly recognizable in Figure 7, the presence of a thermal anomaly at the Mt. Etna crater area, before and after the start of hot degassing activity at VOR, was confirmed. Besides, it can be noted that some VOR pixels were brighter, especially, on satellite scenes of 2 July (i.e., two days before the evident increase of total MIR radiance revealed by Figure 5) and 21 August (see Figure 7).
The false color composite imagery, at a 30-m spatial resolution, of Figure 8 generated from Landsat 8-OLI (Landsat 8-Operational Land Imager) data of 5 July and 6 August provided by UGSG (United States Geological Survey), further corroborate information provided by RSTVOLC. The figure confirms that a thermal anomaly affected the Mt. Etna crater area before the opening of the new degassing vent; see pixels, in red, highly radiant in OLI band 7 (2.1–2.3 µm).
To localize, in a more accurate way, the source of the thermal anomaly identified by the satellite, we analyzed the temporal trend of the SWIR radiance. In more detail, we used the dark object subtraction (DOS) method [49] to correct SWIR radiance for effects of atmospheric scattering by subtracting the radiance value of the darkest object from each pixel of the image (e.g., [50]). We focused our analyses on the VOR area since the thermal anomaly detected by RSTVOLC generally did not include the NSEC; see AVHRR pixel polygon in green overlapped with the OLI sub-scene in the inset of Figure 9. The latter shows the similar behavior of SWIR curves at nine VOR pixels, apart from 5 July when the SWIR signal decreased only at VOR5 and VOR7.
In addition, the plot shows that the strongest increase in the SWIR signal was recorded at VOR2 on 6 August, see the orange curve. By the temporal trend of the total SWIR radiance retrieved, pixel by pixel, along the A-B transect region of Figure 10, we found that VOR2, whose geographic coordinates of the center are reported in Figure 9, was the most radiant pixel in OLI band 7 (see value of the analyzed parameter retrieved in correspondence to the dotted red line). Hence, it is reasonable to suppose that the volcanic thermal emissions from the VOR2 area affected, in a more significant way, the thermal anomaly detected by RSTVOLC after eruptions of May and before the start of high-temperature degassing activity on 7 August.

5. Discussion

In this paper, we have investigated the Mt. Etna activity of May–August 2016, exploiting the information provided by the satellite-based monitoring system operating at IMAA (whose products are currently used only for research purposes) implementing the RSTVOLC algorithm. The latter runs on both AVHRR and MODIS data, which currently guarantee more than 10 observations per day over Italy, increasing the probability of processing cloud-free satellite scenes [51].
The results of this study confirm that RSTVOLC performed in a similar way when detecting thermal anomalies regardless of the satellite data used; i.e., despite the different features of AVHRR and MODIS instruments. Indeed, by combining values of the radiant flux, it was possible to investigate eruptions occurring in May in a more continuous way than using data from a single satellite sensor; although, a different retrieval method was used. Indeed, despite the possible inaccuracy in estimating the radiant flux due to the analysis of satellite records which were uncorrected for atmospheric effects, we observed a good agreement between temporal changes of Q r a d and information provided by field observations. High values of radiant flux characterized periods of lava effusion/fountaining, whereas low values of the same parameter were retrieved in the presence of Strombolian eruptions, as shown in Figure 4.
Regarding the few discrepancies with ground-based observations, they were mostly related to clouds. Although recent literature studies performed by means of ground-based hyperspectral imagers have suggested that these features could be accounted for under certain circumstances [45], clouds generally represent a common issue for satellite-based methods developed for monitoring thermal volcanic activity. In this work, clouds had a not negligible impact on the results of the thermal anomaly detection because, on some days, they partially or completely obscured the underlying hot surfaces. Consequently, some Strombolian activities were identified by satellite some hours after the eruption onset; RSTVOLC detected, for instance, the first thermal anomaly over the Mt. Etna area on 18 May, on AVHRR overpass of 01:17 UTC (universal time coordinated); although, a Strombolian activity was already in progress the day before, see eruption chronology in Figure 4. Moreover, a few daytime MODIS scenes strongly affected by clouds, which were not completely removed by the OCA method, showed artifacts. These features were recognized and filtered out from the analyzed time series.
Despite the impact of clouds and satellite viewing geometry on the thermal anomaly identification (e.g., as for AVHRR data acquired at 17:05 UTC), this study provides additional information concerning eruptive events occurring in May. Specifically, Figure 2 showed that, in spite of possible lava cooling effects, the eruptive activity of 21 May probably lasted longer than was indicated by field observations. Although, the occurrence of a short-lived eruptive event in the late afternoon of the same day cannot be excluded. The unfavorable meteorological conditions possibly affected the direct/visual observation of these phenomena. Concerning the short-term variations of Q r a d also revealed in Figure 2, they require further investigation to be assessed, analyzing, for instance, infrared SEVIRI data.
RSTVOLC detections performed after the eruptive events of May revealed that the intensity of fumarolic emissions from the fracture fields cutting the entire summit area changed before 7 August, possibly due to a preparatory phase of hot degassing activity occurring at VOR. This is even more evident from looking at the curve of the radiant flux (in blue), retrieved from nighttime MODIS data, in Figure 11. The plot shows that Q r a d was around 30 MW on 4 July, then decreased in the following weeks, when its average value was ~7.5 MW, and increased up to 18 MW on 3 August (see right axis); i.e., four days before the opening of the new degassing vent marked by the dotted black line. After a slight reduction, the radiant flux once again increased on 7 August owing to the high-temperature degassing activity in progress at VOR, reaching its peak of around 33 MW three days later, see Figure 11.
Those variations of radiant flux were consistent with information independently provided by OLI and MSI data at the VOR2 location, corresponding to the area where the new degassing vent would later open, see the previous section. Figure 11 shows that SWIR radiance measured at the VOR2 crater area was higher in early July compared to mid-end July, and significantly increased on 6 August (see left axis), strengthening the hypothesis formulated above.
The information retrieved by satellite is perfectly compatible with the actual evolution of the system of degassing fractures, which progressively opened in the summit area of Mt. Etna. It should be pointed out that, at the end of May 2016, eruptions from all summit craters had conduits almost totally obstructed by the erupted volcanic products, and, therefore, they were no longer capable of degassing efficiently. Under these conditions, it is very likely that the pressure of the volcanic gases that rise inside the obstructed conduits have exerted a considerable pressure, also causing the heating and the thermal alteration of the rocks in the immediate vicinity of the conduits themselves, looking for alternative outputs. Therefore, the fracture system opening in the summit area could have been an alternative way to allow the volcanic gas to reach the surface. At first, this gradual fracturing process triggered the thermal anomalies observed from space during the first days of July. Finally, the opening of the degassing vent on August 7 close to the VOR’s rim could be the culmination of this fracturing process, which eventually drained most of the gas from the obstructed NEC conduit.
This evolution has already been observed several times during the last twenty years at Etna. Starting from January 1998, a system of N-S fractures opened, and then progressively propagated, affecting exactly the same portion of the summit area, generating dry fractures, fumarolic activities, and eruptive fissures [33], similar to what happened in May–August 2016. Thus, the opening of the vent on 7 August was possibly triggered by the intersection of this developing fracture system with the North-East crater (NEC) plumbing system, leading to the draining of gas that had remained blocked inside its conduits after the May eruption. Finally, it should be emphasized that the opening of this fracture system seems to be triggered by an acceleration of the deformations affecting the eastern flank of the volcano [26,27,35,36,37]); therefore, it is possible that the opening of new degassing or erupting vents will continue to take place in this portion of the summit crater area.

6. Conclusions

This study demonstrates that multi-platform observing systems may also provide a relevant contribution for monitoring active volcanoes in areas where efficient ground-based surveillance systems exist, enabling the identification of low-temperature fumarole fields whose intensity variations may precede new and more significant phases of thermal unrest.
In this context, the performance of the RSTVOLC system may be further increased using VIIRS (Visible Infrared Imaging Radiometer Suite), flying onboard Suomi NPP (Suomi National Polar-orbiting Partnership) and JPPS-1 (Joint Polar Satellite System) satellites. VIIRS collects data in 22 different spectral bands, ranging from 0.412 µm (VIS) to 12.01 µm (TIR) and including 17 spectral channels at a 750-m spatial resolution, i.e., the moderate resolution bands (M-bands) and the Day/Night panchromatic band (DNB), and five imaging resolution bands (I-bands), having a spatial resolution of 375 m at the nadir. Among the channels, the I4 band (3.55–3.93 µm) should guarantee further improvements in the identification of weak thermal anomalies (i.e., those of low temperature and/or spatial extent), as indicated by some investigations currently in progress, making RSTVOLC even more effective in detecting subtle changes of thermal volcanic activity at Mt. Etna.

Author Contributions

F.M., M.N. and N.P. conceived the work and wrote the paper. All the other authors contributed in analyzing and interpreting results.

Funding

This research received no external funding.

Acknowledgments

Landsat 8-OLI imagery used in this work were provided by the USGS (United States Geological Survey) through the Earth Explorer portal (https://earthexplorer.usgs.gov/). Sentinel-2 data are made free available online by the SENTINEL Hub (http://www.sentinel-hub.com/).

Conflicts of Interest

The authors declare no conflict of interest.

References

  1. Dehn, J.; Dean, K.; Engle, K. Thermal monitoring of North Pacific volcanoes from space. Geology 2000, 28, 755–758. [Google Scholar]
  2. Dean, K.; Servilla, M.; Roach, A.; Foster, B.; Engle, K. Satellite monitoring of remote volcanoes improves study efforts in Alaska. Eos Trans. Am. Geophys. Union 1998, 79, 413–423. [Google Scholar] [CrossRef]
  3. Coppola, D.; Cigolini, C. Thermal regimes and effusive trends at Nyamuragira volcano (DRC) from MODIS infrared data. Bull. Volcanol. 2013, 75, 744. [Google Scholar] [CrossRef]
  4. Rothery, D.A.; Francis, P.W.; Wood, C.A. Volcano monitoring using short wavelength infrared data from satellites. J. Geophys. Res. Solid Earth 1998, 93, 7993–8008. [Google Scholar] [CrossRef]
  5. Oppenheimer, C. Lava flow cooling estimated from Landsat Thematic Mapper infrared data: The Lonquimay eruption (Chile, 1989). J. Geophys. Res. Solid Earth 1991, 96, 21865–21878. [Google Scholar] [CrossRef]
  6. Pieri, D.; Abrams, M. ASTER observations of thermal anomalies preceding the April 2003 eruption of Chikurachki volcano, Kurile Islands, Russia. Remote Sens. Environ. 2005, 99, 84–94. [Google Scholar] [CrossRef]
  7. Davies, A.G.; Chien, S.; Baker, V.; Doggett, T.; Dohm, J.; Greeley, R.; Ip, F.; Castan, R.; Cichy, B.; Rabideau, G.; et al. Monitoring active volcanism with the autonomous sciencecraft experiment on EO-1. Remote Sens. Environ. 2006, 101, 427–446. [Google Scholar] [CrossRef]
  8. Abrams, M.; Pieri, D.; Realmuto, V.; Wright, R. Using EO-1 Hyperion data as HyspIRI preparatory data sets for volcanology applied to Mt Etna, Italy. IEEE J. Sel. Top. Appl. Earth Obs. Remote Sens. 2013, 6, 375–385. [Google Scholar] [CrossRef]
  9. Higgins, J.; Harris, A. VAST: A program to locate and analyze volcanic thermal anomalies automatically from remotely sensed data. Comput. Geosci. 1997, 23, 627–645. [Google Scholar] [CrossRef]
  10. Dehn, J.; Dean, K.G.; Engle, K.; Izbekov, P. Thermal precursors in satellite images of the 1999 eruption of Shishaldin Volcano. Bull. Volcanol. 2002, 64, 525–534. [Google Scholar] [CrossRef]
  11. Wright, R.; Flynn, L.P. On the retrieval of lava-flow surface temperatures from infrared satellite data. Geology 2003, 31, 893–896. [Google Scholar] [CrossRef]
  12. Marchese, F.; Lacava, T.; Pergola, N.; Hattori, K.; Miraglia, E.; Tramutoli, V. Inferring phases of thermal unrest at Mt. Asama (Japan) from infrared satellite observations. J. Volcanol. Geotherm. Res. 2012, 237, 10–18. [Google Scholar] [CrossRef]
  13. Lombardo, V. AVHotRR: Near-real time routine for volcano monitoring using IR satellite data. Geol. Soc. Lond. Spec. Publ. 2015, 426, 73–92. [Google Scholar] [CrossRef]
  14. Miller, P.I.; Harris, A.J. Near-real-time service provision during effusive crises at Etna and Stromboli: Basis and implementation of satellite-based IR operations. Geol. Soc. Lond. Spec. Publ. 2016, 426, SP426-26. [Google Scholar] [CrossRef]
  15. Harris, A.J.L.; Pilger, E.; Flynn, L.P.; Garbeil, H.; Mouginis-Mark, P.J.; Kauahikaua, J.; Thornber, C. Automated, high temporal resolution, thermal analysis of Kilauea volcano, Hawai’i, using GOES satellite data. Int. J. Remote Sens. 2001, 22, 945–967. [Google Scholar] [CrossRef]
  16. Marchese, F.; Ciampa, M.; Filizzola, C.; Mazzeo, G.; Lacava, T.; Pergola, N.; Tramutoli, V. On the exportability of Robust Satellite Techniques (RST) for active volcanoes monitoring. Remote Sens. 2010, 2, 1575–1588. [Google Scholar] [CrossRef]
  17. Ganci, G.; Harris, A.J.L.; Del Negro, C.; Guehenneux, Y.; Cappello, A.; Labazuy, P.; Calvari, S.; Gouhier, M. A year of lava fountaining at Etna: Volumes from SEVIRI. Geophys. Res. Lett. 2012, 39, L06305. [Google Scholar] [CrossRef]
  18. Marchese, F.; Falconieri, A.; Pergola, N.; Tramutoli, V. A retrospective analysis of the Shinmoedake (Japan) eruption of 26–27 January 2011 by means of Japanese geostationary satellite data. J. Volcanol. Geotherm. Res. 2014, 269, 1–13. [Google Scholar] [CrossRef]
  19. Kaneko, T.; Takasaki, K.; Maeno, F.; Wooster, M.J.; Yasuda, A. Himawari-8 infrared observations of the June–August 2015 Mt Raung eruption, Indonesia. Earth Planets Space 2018, 70, 89. [Google Scholar] [CrossRef] [Green Version]
  20. Harris, A.J.; Butterworth, A.L.; Carlton, R.W.; Downey, I.; Miller, P.; Navarro, P.; Rothery, D.A. Low-cost volcano surveillance from space: Case studies from Etna, Krafla, Cerro Negro, Fogo, Lascar and Erebus. Bull. Volcanol. 1997, 59, 49–64. [Google Scholar] [CrossRef]
  21. Coppola, D.; Piscopo, D.; Staudacher, T.; Cigolini, C. Lava discharge rate and effusive pattern at Piton de la Fournaise from MODIS data. J. Volcanol. Geotherm. Res. 2009, 184, 174–192. [Google Scholar] [CrossRef]
  22. Wright, R.; Blackett, M.; Hill-Butler, C. Some observations regarding the thermal flux from Earth’s erupting volcanoes for the period of 2000 to 2014. Geophys. Res. Lett. 2015, 42, 282–289. [Google Scholar] [CrossRef]
  23. Wright, R.; Pilger, E. Radiant flux from Earth’s subaerially erupting volcanoes. Int. J. Remote Sens. 2008, 29, 6443–6466. [Google Scholar] [CrossRef]
  24. Bonny, E.; Wright, R. Predicting the end of lava-flow-forming eruptions from space. Bull. Volcanol. 2017, 79, 52. [Google Scholar] [CrossRef]
  25. Vicari, A.; Ganci, G.; Behncke, B.; Cappello, A.; Neri, M.; Del Negro, C. Near-real-time forecasting of lava flow hazards during the 12–13 January 2011 Etna eruption. Geophys. Res. Lett. 2011, 38, 13. [Google Scholar] [CrossRef]
  26. Neri, M.; Acocella, V.; Behncke, B.; Giammanco, S.; Mazzarini, F.; Rust, D. Structural analysis of the eruptive fissures at Mount Etna (Italy). Ann. Geophys. 2011, 54, 464–479. [Google Scholar] [CrossRef]
  27. Cappello, A.; Bilotta, G.; Neri, M.; Del Negro, C. Probabilistic modeling of future volcanic eruptions at Mount Etna. J. Geophys. Res. Solid Earth 2013, 118, 1925–1935. [Google Scholar] [CrossRef] [Green Version]
  28. Marchese, F.; Filizzola, C.; Genzano, N.; Mazzeo, G.; Pergola, N.; Tramutoli, V. Assessment and improvement of a Robust Satellite Technique (RST) for thermal monitoring of volcanoes. Remote Sens. Environ. 2011, 115–116, 1556–1563. [Google Scholar] [CrossRef]
  29. Pergola, N.; Coviello, I.; Filizzola, C.; Lacava, T.; Marchese, F.; Paciello, R.; Tramutoli, V. A review of RSTVOLC, an original algorithm for automatic detection and near-real-time monitoring of volcanic hotspots from space. Geol. Soc. Lond. Spec. Publ. 2015, 426, 55–72. [Google Scholar] [CrossRef]
  30. Corsaro, R.A.; Andronico, D.; Behncke, B.; Branca, S.; Caltabiano, T.; Ciancitto, F.; Cristaldi, A.; De Beni, E.; La Spina, A.; Lodato, L.; et al. Monitoring the December 2015 summit eruptions of Mt. Etna (Italy): Implications on eruptive dynamics. J. Volcanol. Geotherm. Res. 2017, 341, 53–69. [Google Scholar] [CrossRef]
  31. Neri, M.; De Maio, M.; Crepaldi, S.; Suozzi, E.; Lavy, M.; Marchionatti, F.; Calvari, S.; Buongiorno, F. Topographic Maps of Mount Etna’s Summit Craters, updated to December 2015. J. Maps 2017, 13, 674–683. [Google Scholar] [CrossRef] [Green Version]
  32. Cannata, A.; Di Grazia, G.; Giuffrida, M.; Gresta, S.; Palano, M.; Sciotto, M.; Viccaro, M.; Zuccarello, F. Space-time evolution of magma storage and transfer at Mt. Etna volcano (Italy): The 2015–2016 reawakening of Voragine crater. Geochem. Geophys. Geosyst. 2018, 19, 471–495. [Google Scholar] [CrossRef]
  33. Neri, M.; Acocella, V. The 2004-05 Etna eruption: Implications for flank deformation and structural behaviour of the volcano. J. Volcanol. Geotherm. Res. 2006, 158, 195–206. [Google Scholar] [CrossRef]
  34. Neri, M.; Casu, F.; Acocella, V.; Solaro, G.; Pepe, S.; Berardino, P.; Sansosti, E.; Caltabiano, T.; Lundgren, P.; Lanari, R. Deformation and eruptions at Mt. Etna (Italy): A lesson from 15 years of observations. Geophys. Res. Lett. 2009, 36, L02309. [Google Scholar] [CrossRef]
  35. Siniscalchi, A.; Tripaldi, S.; Neri, M.; Balasco, M.; Romano, G.; Ruch, J.; Schiavone, D. Flank instability structure of Mt Etna inferred by a magnetotelluric survey. J. Geophys. Res. 2012, 117, B03216. [Google Scholar] [CrossRef]
  36. Acocella, V.; Neri, N.; Behncke, B.; Bonforte, A.; Del Negro, C.; Ganci, G. Why does a mature volcano need new vents? The case of the New Southeast Crater at Etna. Front. Earth Sci. 2016, 4, 67. [Google Scholar] [CrossRef]
  37. Giammanco, S.; Melián, G.; Neri, M.; Hernández, P.A.; Sortino, F.; Barrancos, J.; López, M.; Pecoraino, G.; Perez, N.M. Active tectonic features and structural dynamics of the summit area of Mt. Etna (Italy) revealed by soil CO2 and soil temperature surveying. J. Volcanol. Geotherm. Res. 2016, 311, 79–98. [Google Scholar] [CrossRef]
  38. Cuomo, V.; Filizzola, C.; Pergola, N.; Pietrapertosa, C.; Tramutoli, V. A self-sufficient approach for GERB cloudy radiance detection. Atmos. Res. 2004, 72, 39–56. [Google Scholar] [CrossRef]
  39. Pergola, N.; Marchese, F.; Tramutoli, V. Automated detection of thermal features of active volcanoes by means of infrared AVHRR records. Remote Sens. Environ. 2004, 93, 311–327. [Google Scholar] [CrossRef]
  40. Zakšek, K.; Hort, M.; Lorenz, E. Satellite and ground based thermal observation of the 2014 effusive eruption at Stromboli volcano. Remote Sens. 2015, 7, 17190–17211. [Google Scholar] [CrossRef]
  41. Marchese, F.; Filizzola, C.; Mazzeo, G.; Paciello, R.; Pergola, N.; Tramutoli, V. Robust Satellite Techniques for thermal volcanic activity monitoring, early warning and possible prediction of new eruptive events. In Proceedings of the 2009 IEEE International Geoscience and Remote Sensing Symposium, Cape Town, South Africa, 12–17 July 2009; Volume 2, p. II-953. [Google Scholar]
  42. Lacava, T.; Marchese, F.; Arcomano, G.; Coviello, I.; Falconieri, A.; Faruolo, M.; Pergola, N.; Tramutoli, V. Thermal monitoring of Eyjafjöll volcano eruptions by means of infrared MODIS data. IEEE J. Sel. Top. Appl. Earth Obs. Remote Sens. 2014, 7, 3393–3401. [Google Scholar] [CrossRef]
  43. Lacava, T.; Kervyn, M.; Liuzzi, M.; Marchese, F.; Pergola, N.; Tramutoli, V. Assessing performance of the RSTVOLC multi-temporal algorithm in detecting subtle hot spots at Oldoinyo Lengai (Tanzania, Africa) for comparison with MODLEN. Remote Sens. 2018, 10, 1177. [Google Scholar] [CrossRef]
  44. Harris, A.J.; Blake, S.; Rothery, D.A.; Stevens, N.F. A chronology of the 1991 to 1993 Mount Etna eruption using advanced very high resolution radiometer data: Implications for real-time thermal volcano monitoring. J. Geophys. Res. Solid Earth 1997, 102, 7985–8003. [Google Scholar] [CrossRef] [Green Version]
  45. Kaufman, Y.J.; Justice, C.O.; Flynn, L.P.; Kendall, J.D.; Prins, E.M.; Giglio, L.; Ward, D.E.; Menzel, W.P.; Setzer, A.W. Potential global fire monitoring from EOS-MODIS. J. Geophys. Res. 1998, 103, 32215–32238. [Google Scholar] [CrossRef] [Green Version]
  46. Giglio, L. MODIS Collection 5 Active Fire Product User’s Guide 2003, Version 2.5; Department of Geographical, University of Maryland: College Park, MD, USA, 2003; 61p. [Google Scholar]
  47. European Space Agency, Sentinel Online. Available online: https://sentinel.esa.int/web/sentinel/user-guides/sentinel-2-msi/resolutions/spatial (accessed on 1 December 2018).
  48. Blackett, M.; Wooster, M.J. Evaluation of SWIR-based methods for quantifying active volcano radiant emissions using NASA EOS-ASTER data. Geomatics Nat. Hazards Risk 2001, 2, 51–78. [Google Scholar] [CrossRef]
  49. Chavez, P.S., Jr. An improved dark-object subtraction technique for atmospheric scattering correction of multispectral data. Remote Sens. Environ. 1988, 24, 459–479. [Google Scholar] [CrossRef]
  50. Singh, A.; Raju, A.; Pati, P.; Kumar, N. Mapping of coal fire in Jharia coalfield, India: A remote sensing based approach. J. Indian Soc. Remote Sens. 2017, 45, 369–376. [Google Scholar] [CrossRef]
  51. Marchese, F.; Mazzeo, G.; Filizzola, C.; Coviello, I.; Falconieri, A.; Lacava, T.; Paciello, R.; Pergola, N.; Tramutoli, V. Issues and Possible Improvements in Winter Fires Detection by Satellite Radiances Analysis: Lesson Learned in Two Regions of Northern Italy. IEEE J. Sel. Top. Appl. Earth Obs. Remote Sens. 2017, 10, 3297–3313. [Google Scholar] [CrossRef]
Figure 1. Structural map of the summit area of the Mount Etna volcano, updated in August 2016.
Remotesensing 10 01948 g001
Figure 2. Mt. Etna activity of 10 August 2016 from the degassing vent opening within the Voragine crater (VOR) crater; (a) morning picture; (b) afternoon picture with evidence of the volcanic glow (credits: Marco Neri).
Remotesensing 10 01948 g002
Figure 3. New degassing vent opened on 7 August 2016 and located along the fracture system formed during the May 2016 eruption (see Figure 1 for map view) (credits: Marco Neri).
Remotesensing 10 01948 g003
Figure 4. (a) Root-mean-square (RMS) tremor amplitude at Etna Cratere del Piano (ECPN) seismic station, a.u. = arbitrary unit; (b) radiant flux retrieved from Advanced Very High Resolution Radiometer (AVHRR) (orange bars) and Moderate Resolution Imaging Spectroradiometer (MODIS) (blue bars) data from the 17 to 31 May. Eruption chronology and information about overcast periods (in light grey), provided by the One channel Cloud-Detection Approach (OCA) method, is also reported.
Remotesensing 10 01948 g004
Figure 5. Total medium infrared (MIR) radiance retrieved from hotspot pixels identified by Robust Satellite Techniques–volcanoes (RSTVOLC) on nighttime AVHRR (blue bars) and MODIS (red bars) data of June–August 2016. Dotted green line indicates the start of hot degassing activity at VOR. Note that no MODIS data were acquired at Institute of Methodologies for Environmental Analysis (IMAA) during 1−3 July because of antenna problems; AVHRR data acquired in July were unprocessed due to geo-location issues.
Remotesensing 10 01948 g005
Figure 6. (a) MODIS channel 22 (MIR) images with an indication (see white arrow) of the volcanic thermal anomaly identified by RSTVOLC (brighter tones indicate higher brightness temperature values); 4 July 2016 at 21:06 UTC (BT22MAX = 297.65 K); (b) 6 July 2016 at 20:53 UTC (BT22MAX = 290.29 K).
Remotesensing 10 01948 g006
Figure 7. RGB (Red= Band 12, 2.19 µm; Green = Band 8A, 0.865 µm; Blue = Band 4, 0.665 µm) Sentinel-2 products, at 20 m spatial resolution, of June–August 2016 generated from Level 1C data excluding images completely overcast over target area. The white arrow indicates pixels more radiant in the shortwave infrared (SWIR) band at VOR.
Remotesensing 10 01948 g007
Figure 8. RGB (Red = Band 7, 2.1–2.3 µm; Green = Band 5, 0.845–0.885 µm; Blue = Band 2, 0.450–0.515 µm) Landsat 8-Operational Land Imager (OLI) images, at a 30-m spatial resolution, showing hotspot pixels (in red), magnified at the top-right side of each panel, affecting the Mt. Etna area. (a) 5 July 2016; (b) 6 August 2016.
Remotesensing 10 01948 g008
Figure 9. Temporal plot of the OLI-SWIR radiance retrieved, after applying the dark object subtraction (DOS) method, over nine different VOR pixels. In the inset, the OLI sub-image of 6 August, with indication of most radiant pixel (VOR2), and the AVHRR pixel polygon (in dotted green) associated to thermal anomaly flagged by RSTVOLC before the opening of the new degassing vent.
Remotesensing 10 01948 g009
Figure 10. Spatial profile of the total SWIR radiance retrieved along the A–B transect region intersecting the VOR area (see OLI data sub-scene in the inset of the figure). The most radiant pixel, whose location is indicated by the dotted red line, having geographic coordinates of the center 37°45′6.08″N, 14°59′45.08″E, corresponds to VOR2 in Figure 9.
Remotesensing 10 01948 g010
Figure 11. SWIR radiance (left axis), from OLI band 7 (red points) and MSI band 12 (green triangles) data of June–August 2016, measured over VOR2 area and corrected using the DOS method (see Section 4.2). In blue, the temporal trend of radiant flux (right axis) retrieved after filtering MODIS data for values of SZA < 40°. The dotted black line indicates the start of hot degassing activity at VOR.
Remotesensing 10 01948 g011

