Remote Sensing Is Changing Our View of the Coast: Insights from 40 Years of Monitoring at Narrabeen-Collaroy, Australia


Abstract
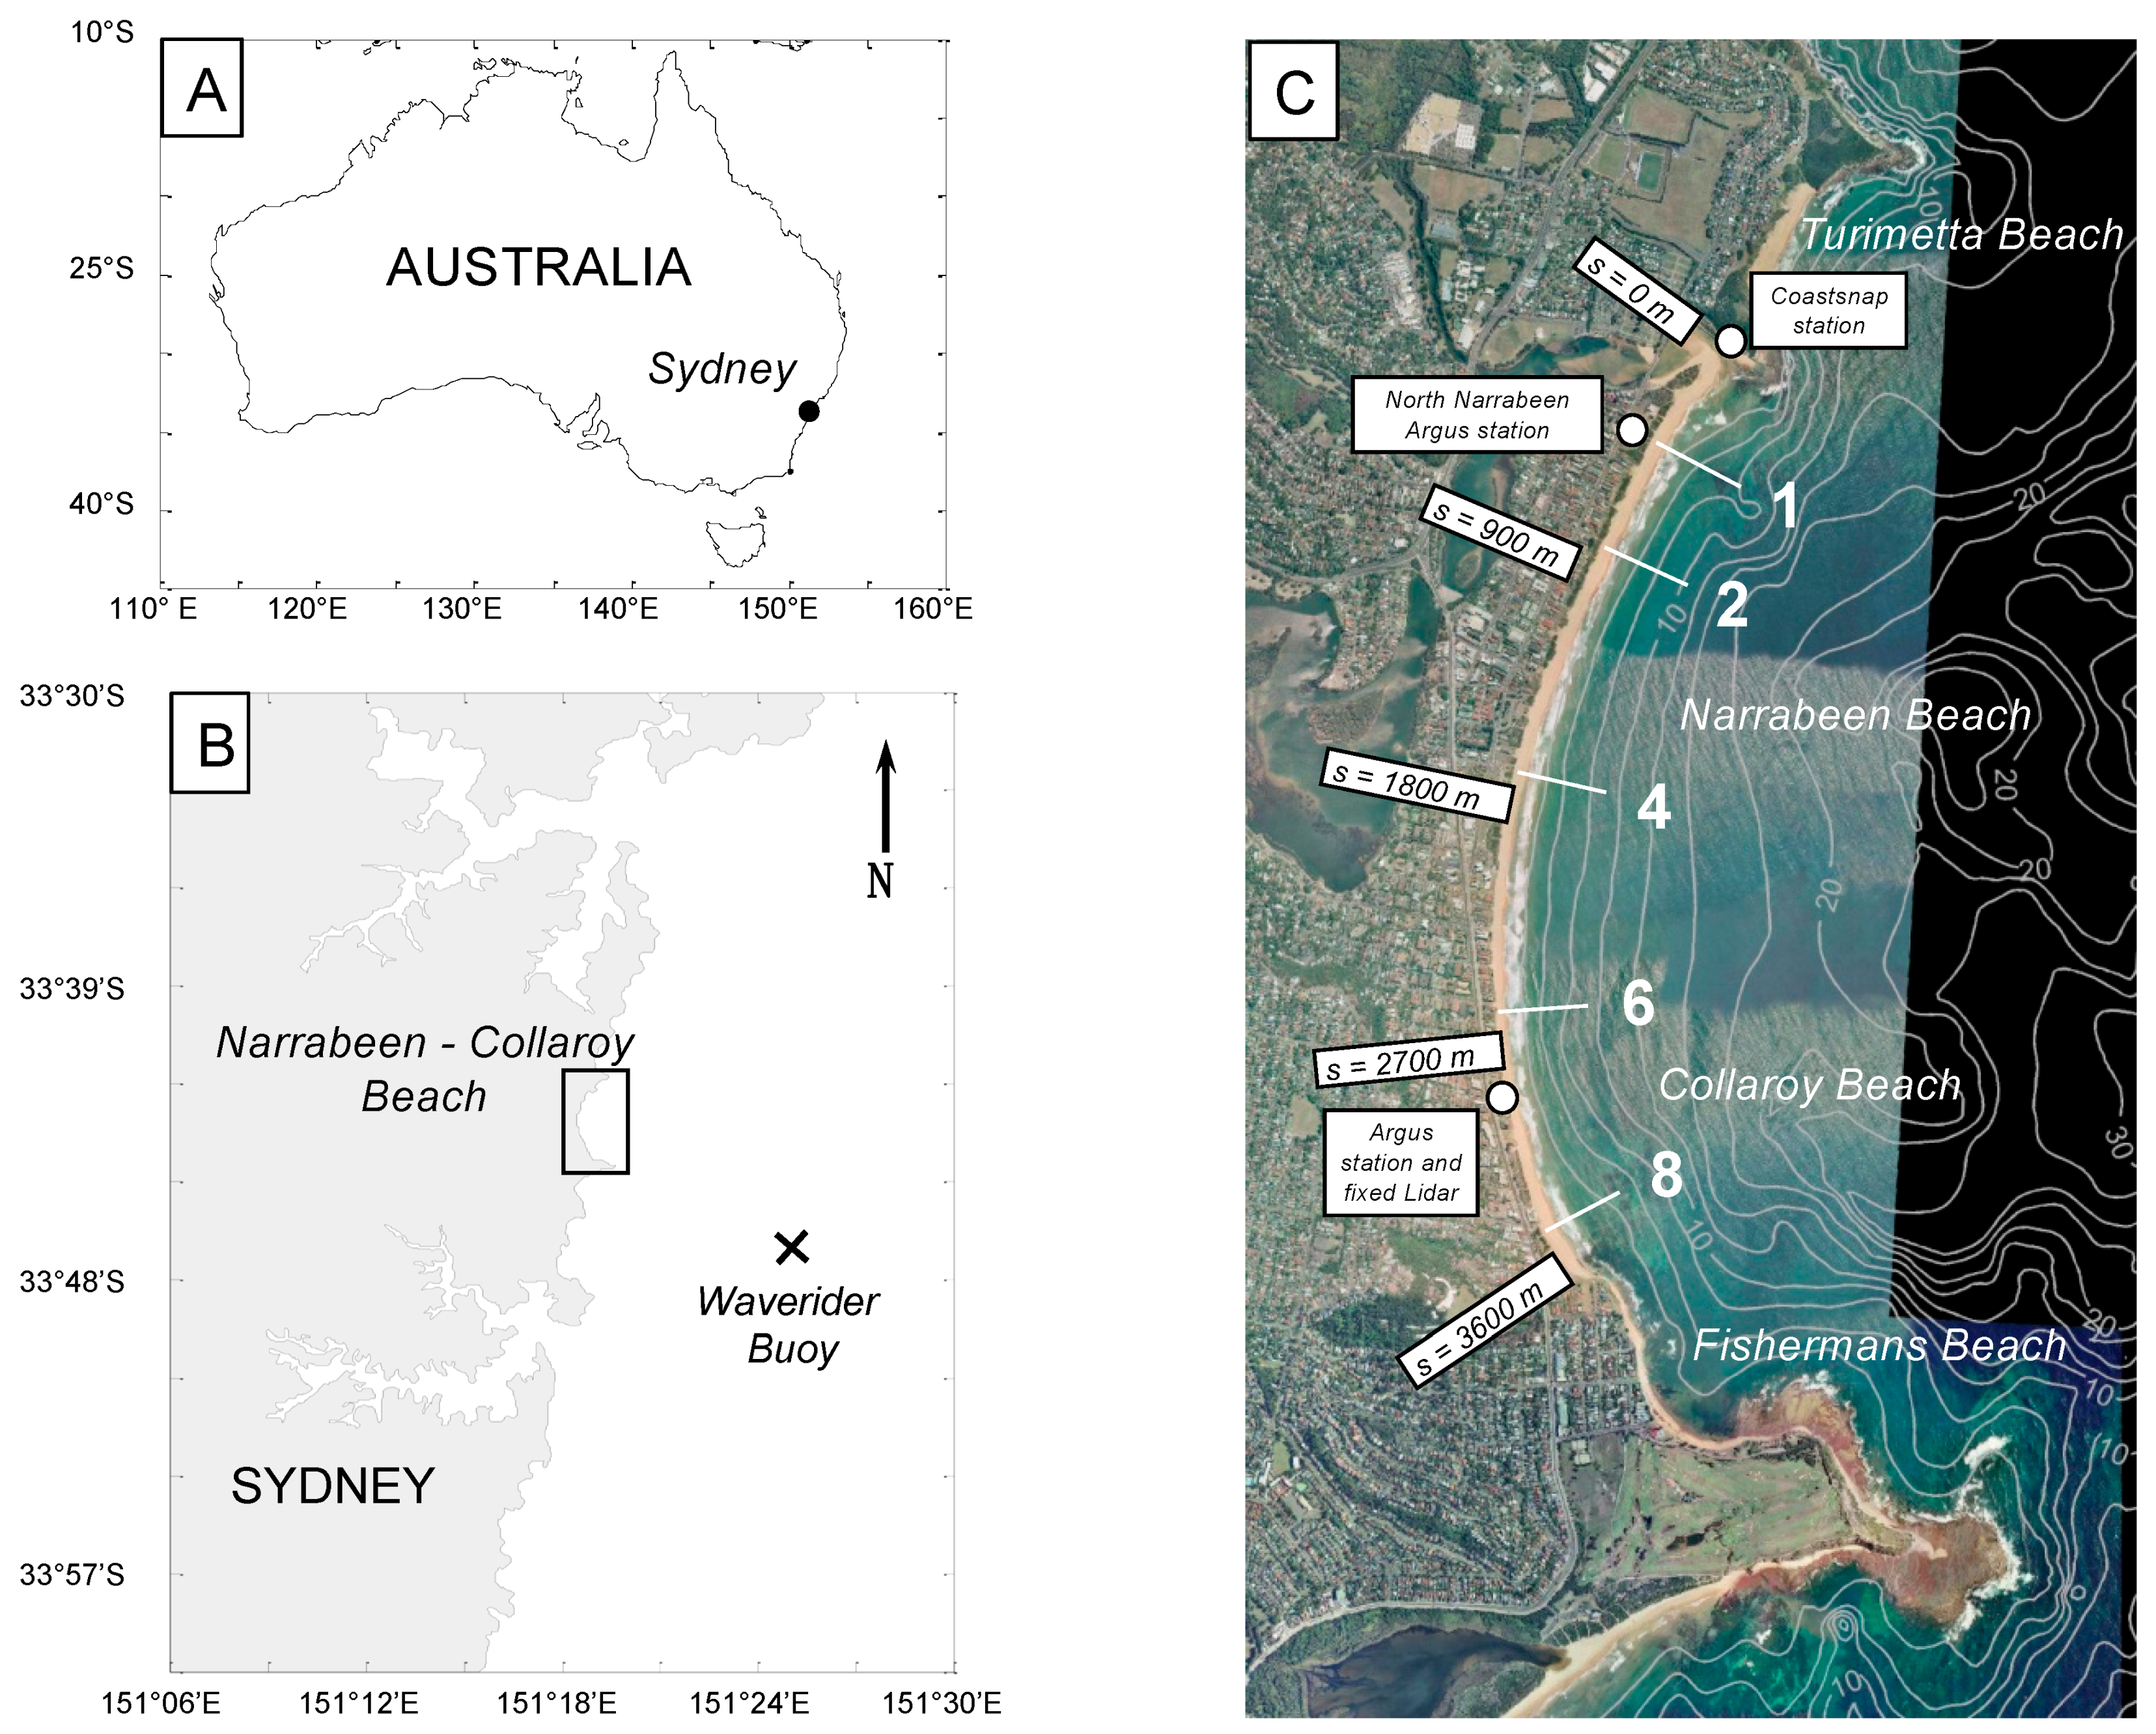
:1. Introduction
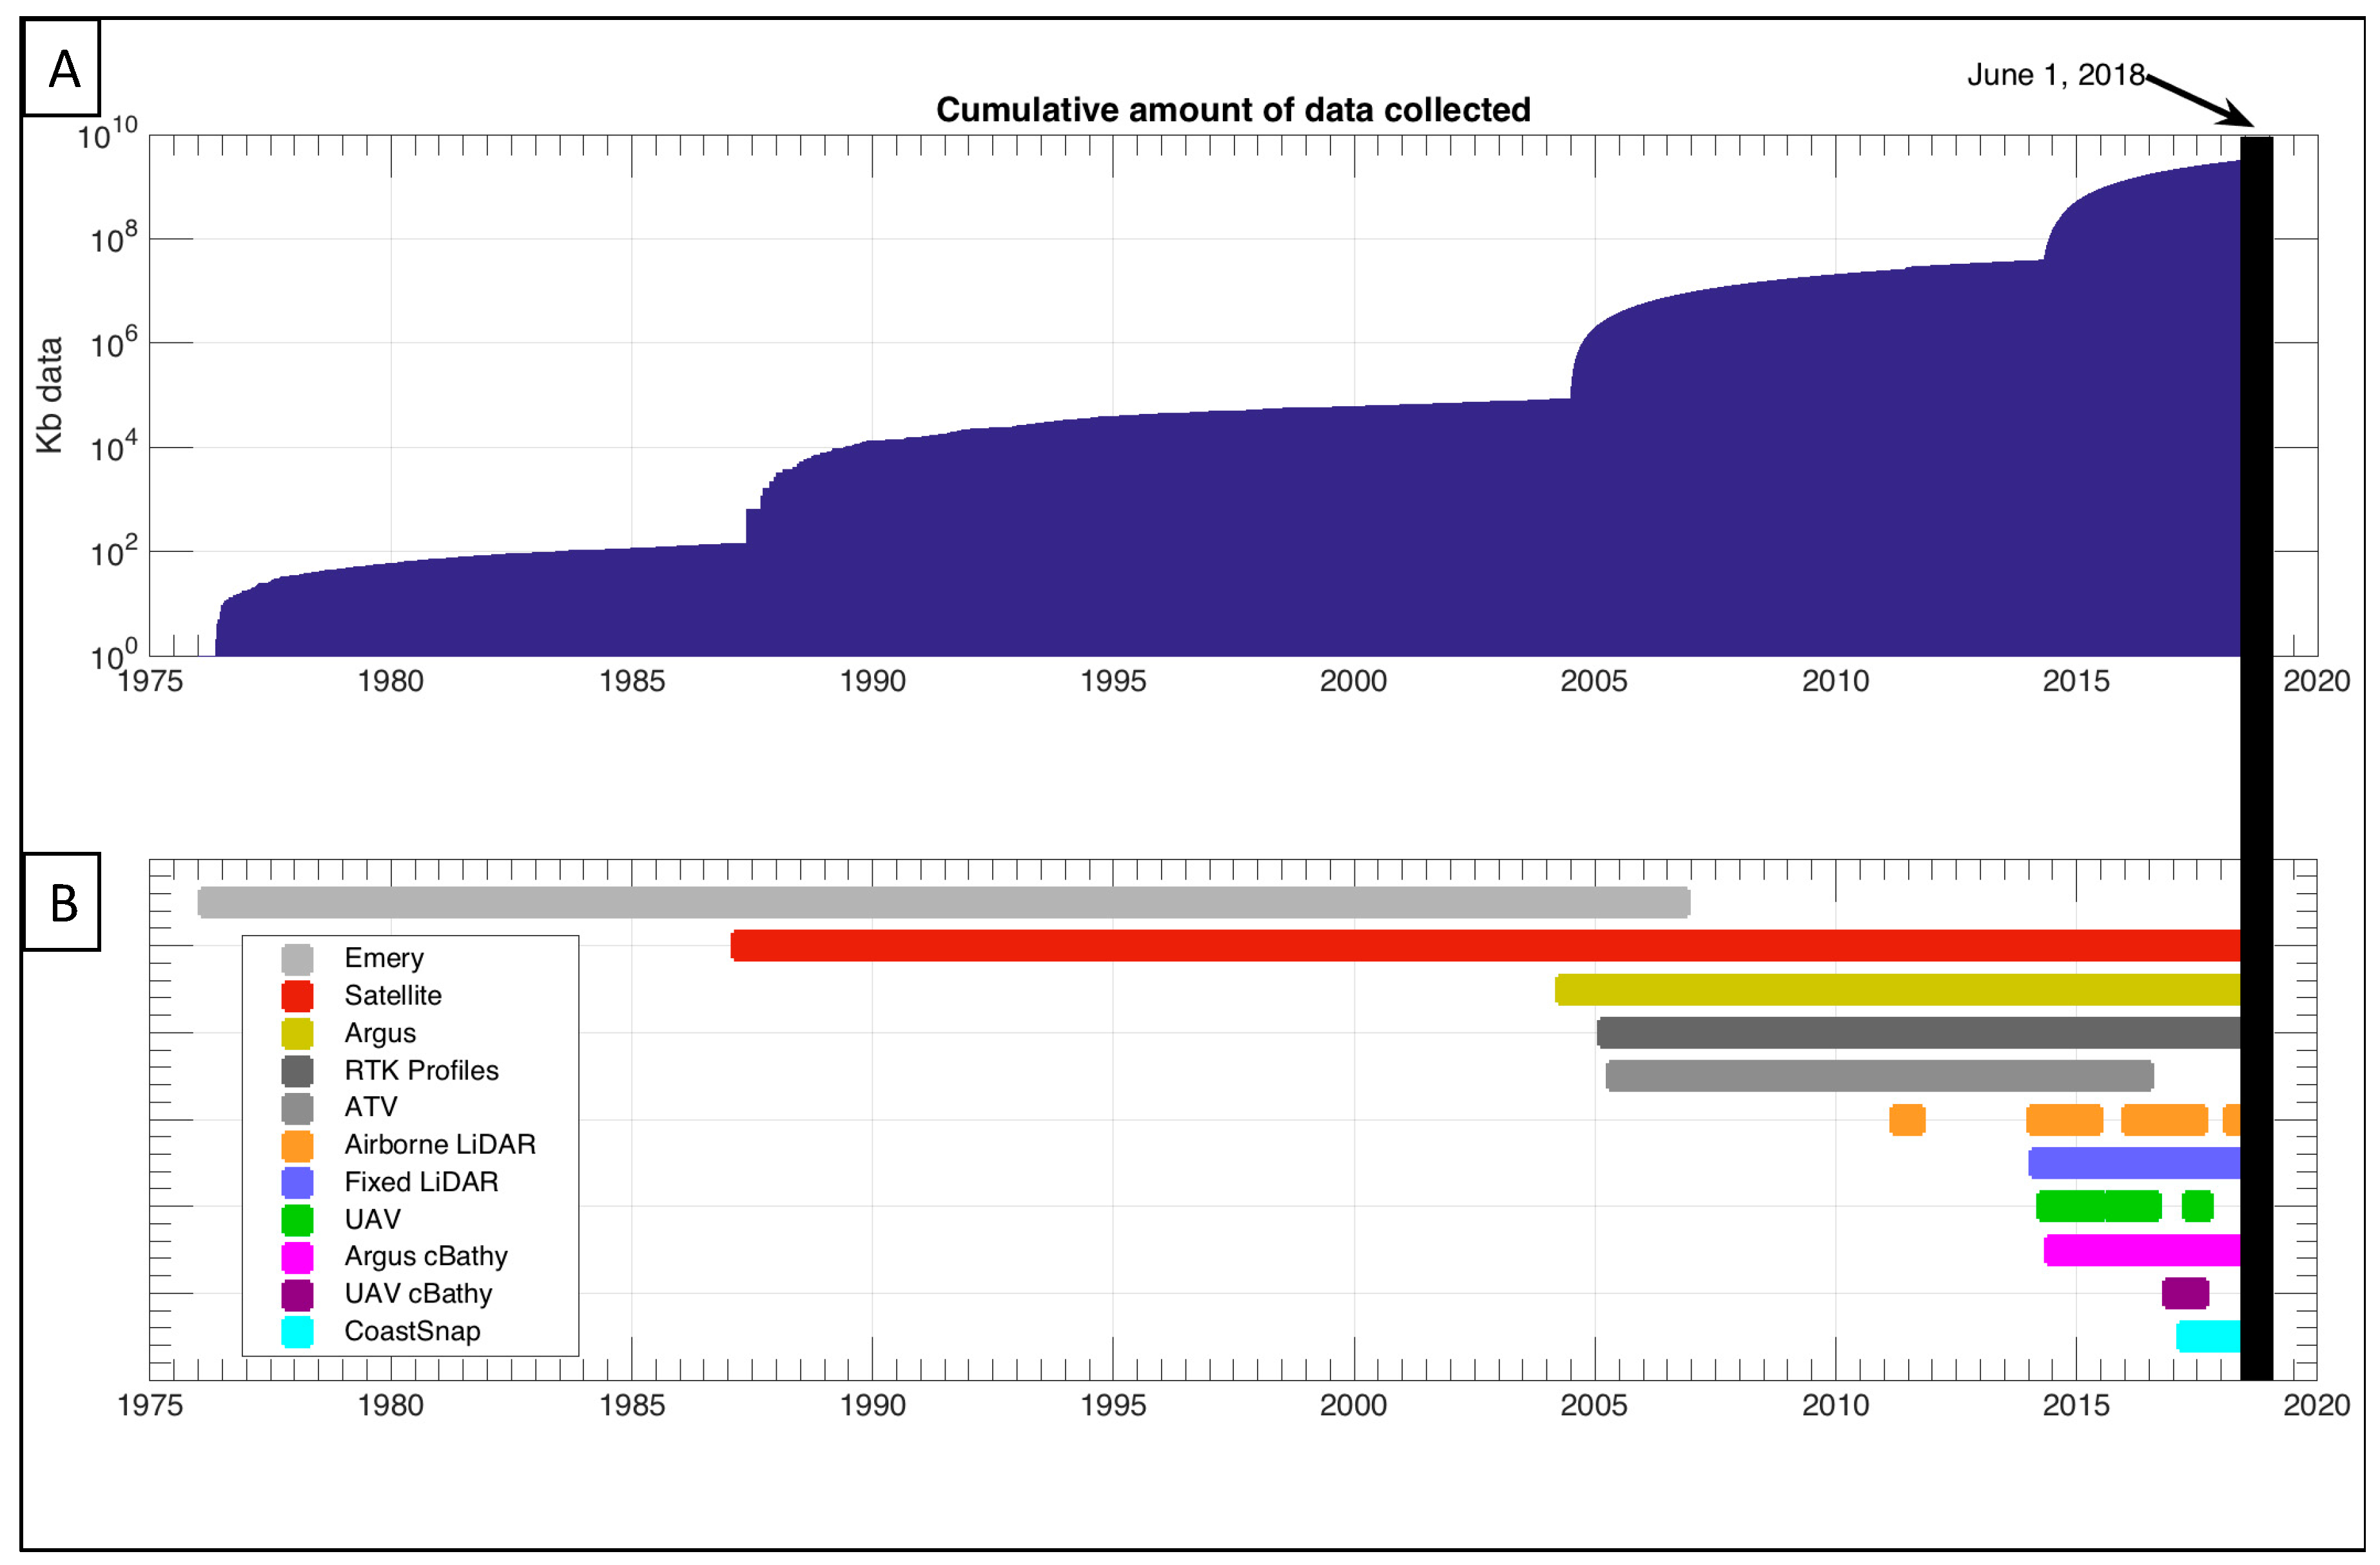
2. Pre-Remote Sensing Era at Narrabeen (1976–2004)
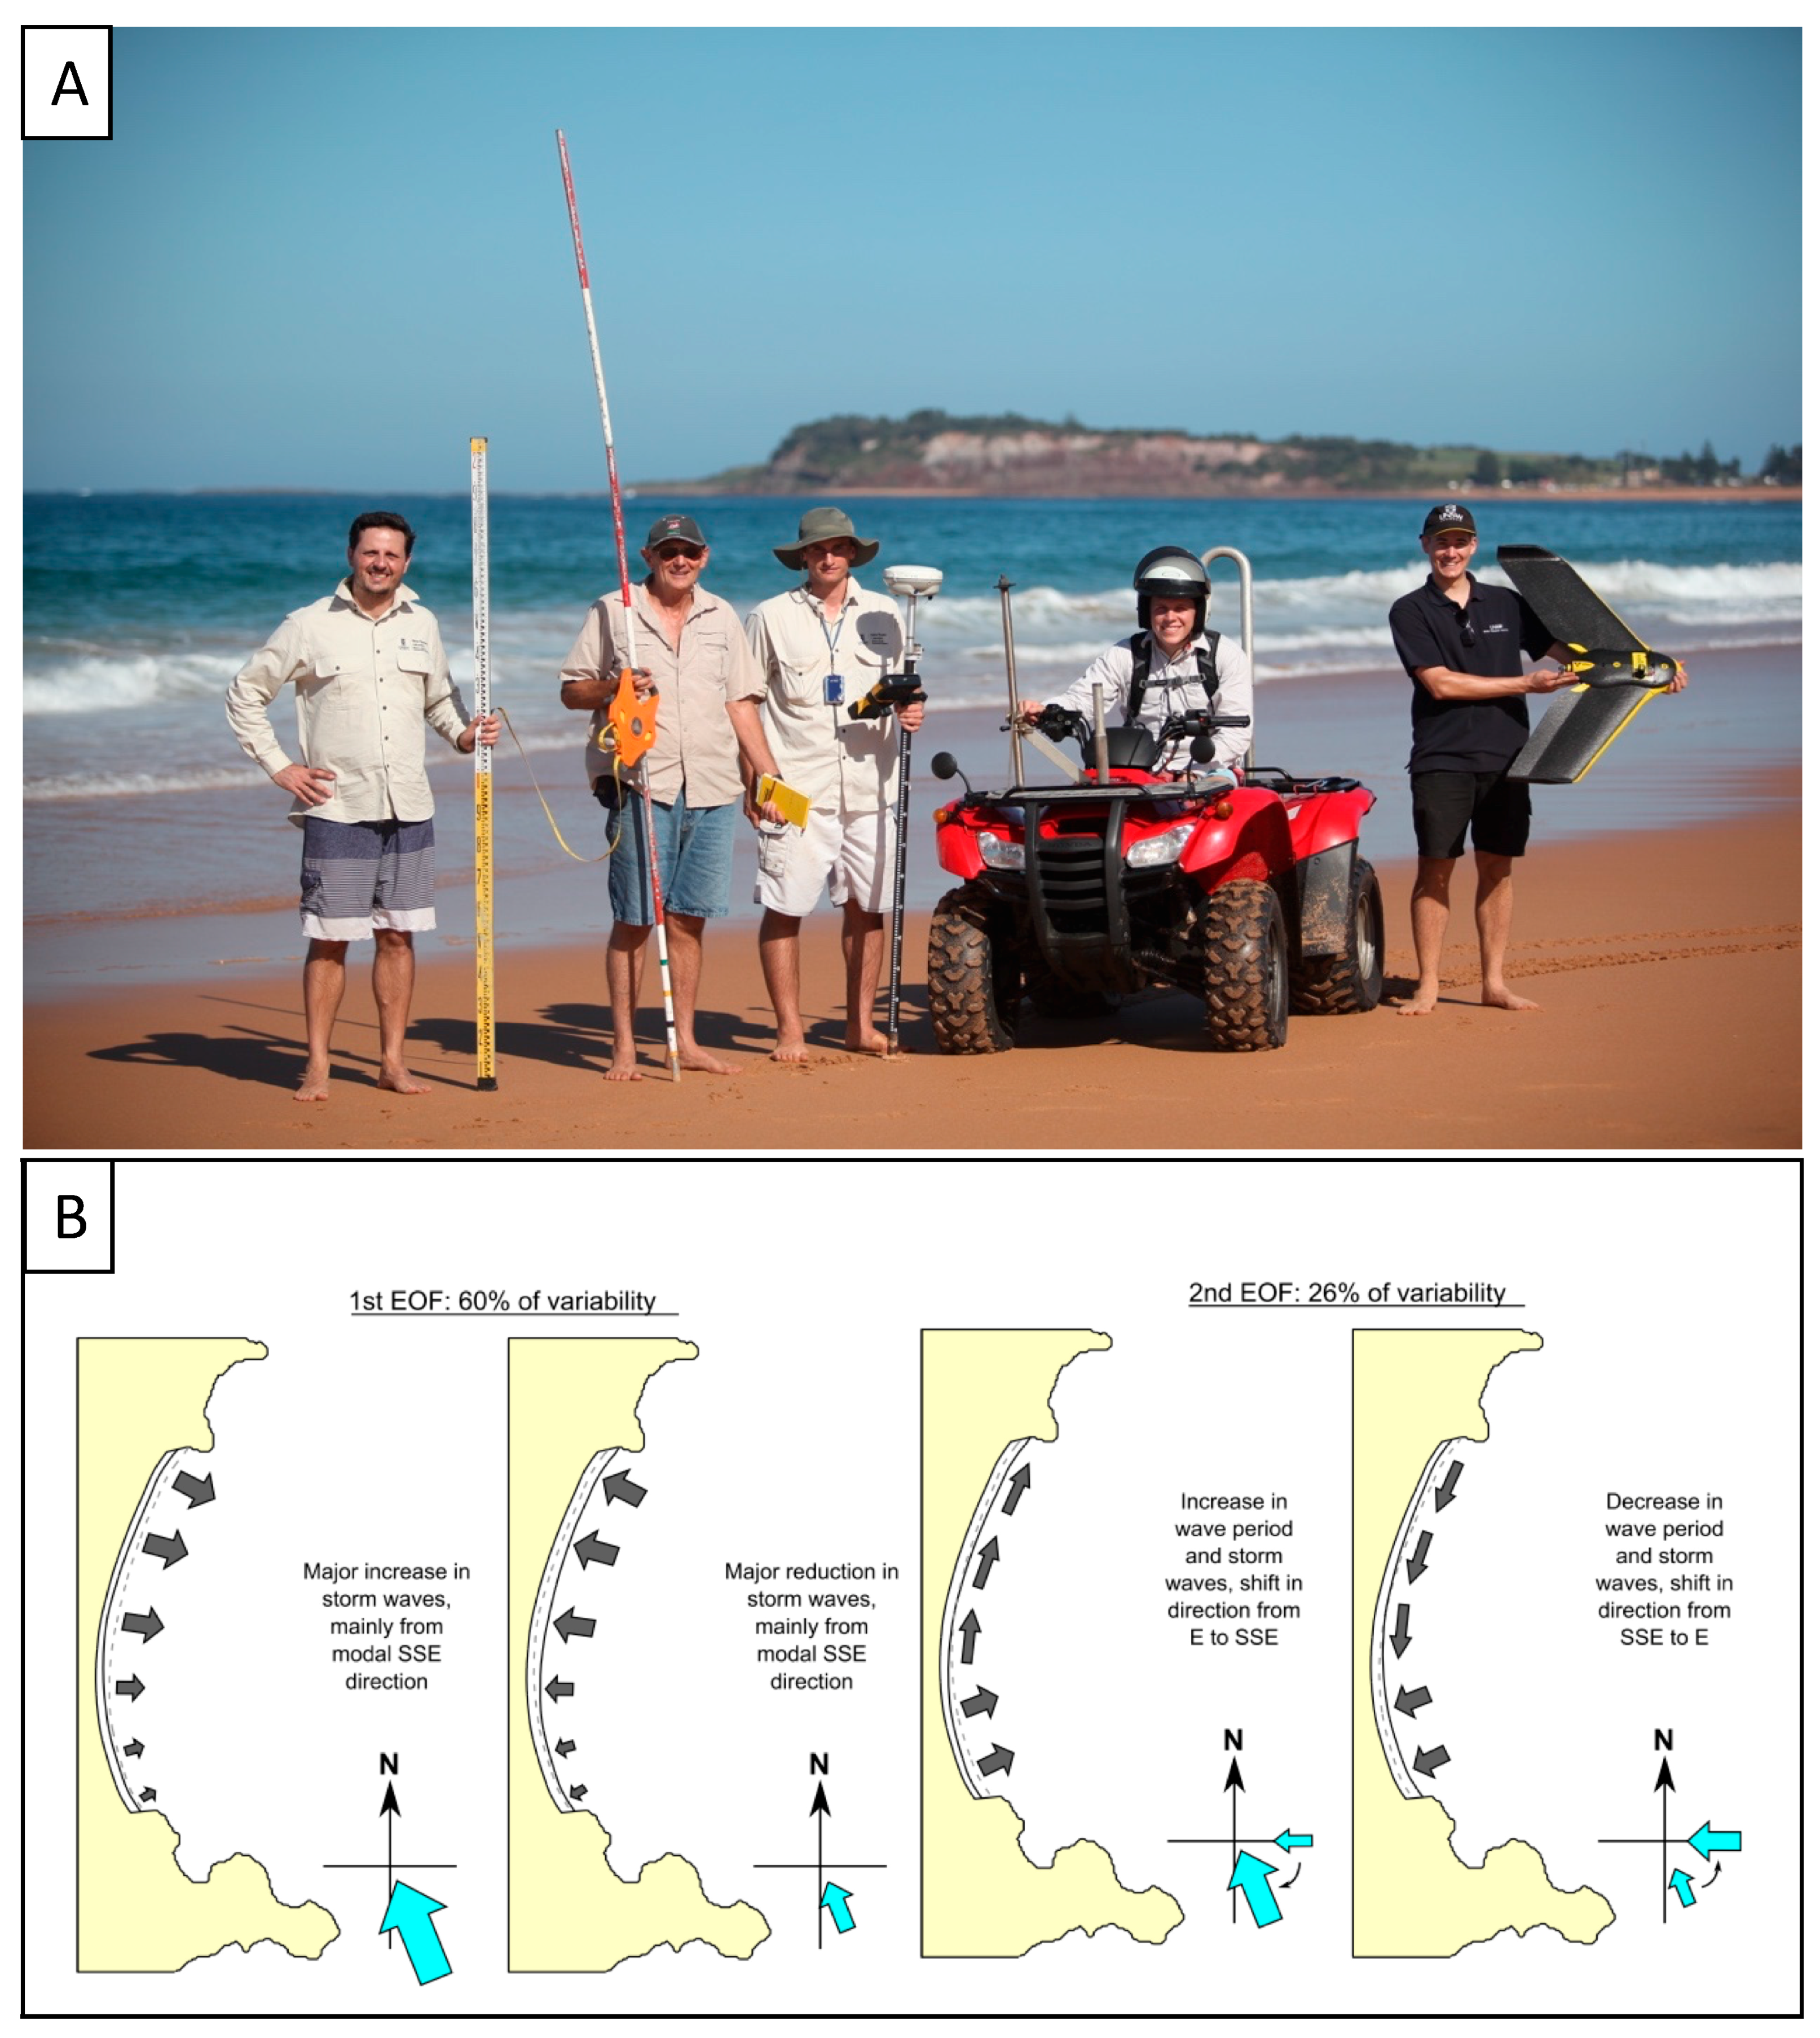
2.1. In-Situ Surveys (Emery Method)
2.2. In-Situ Surveys (RTK-GPS and ATV)
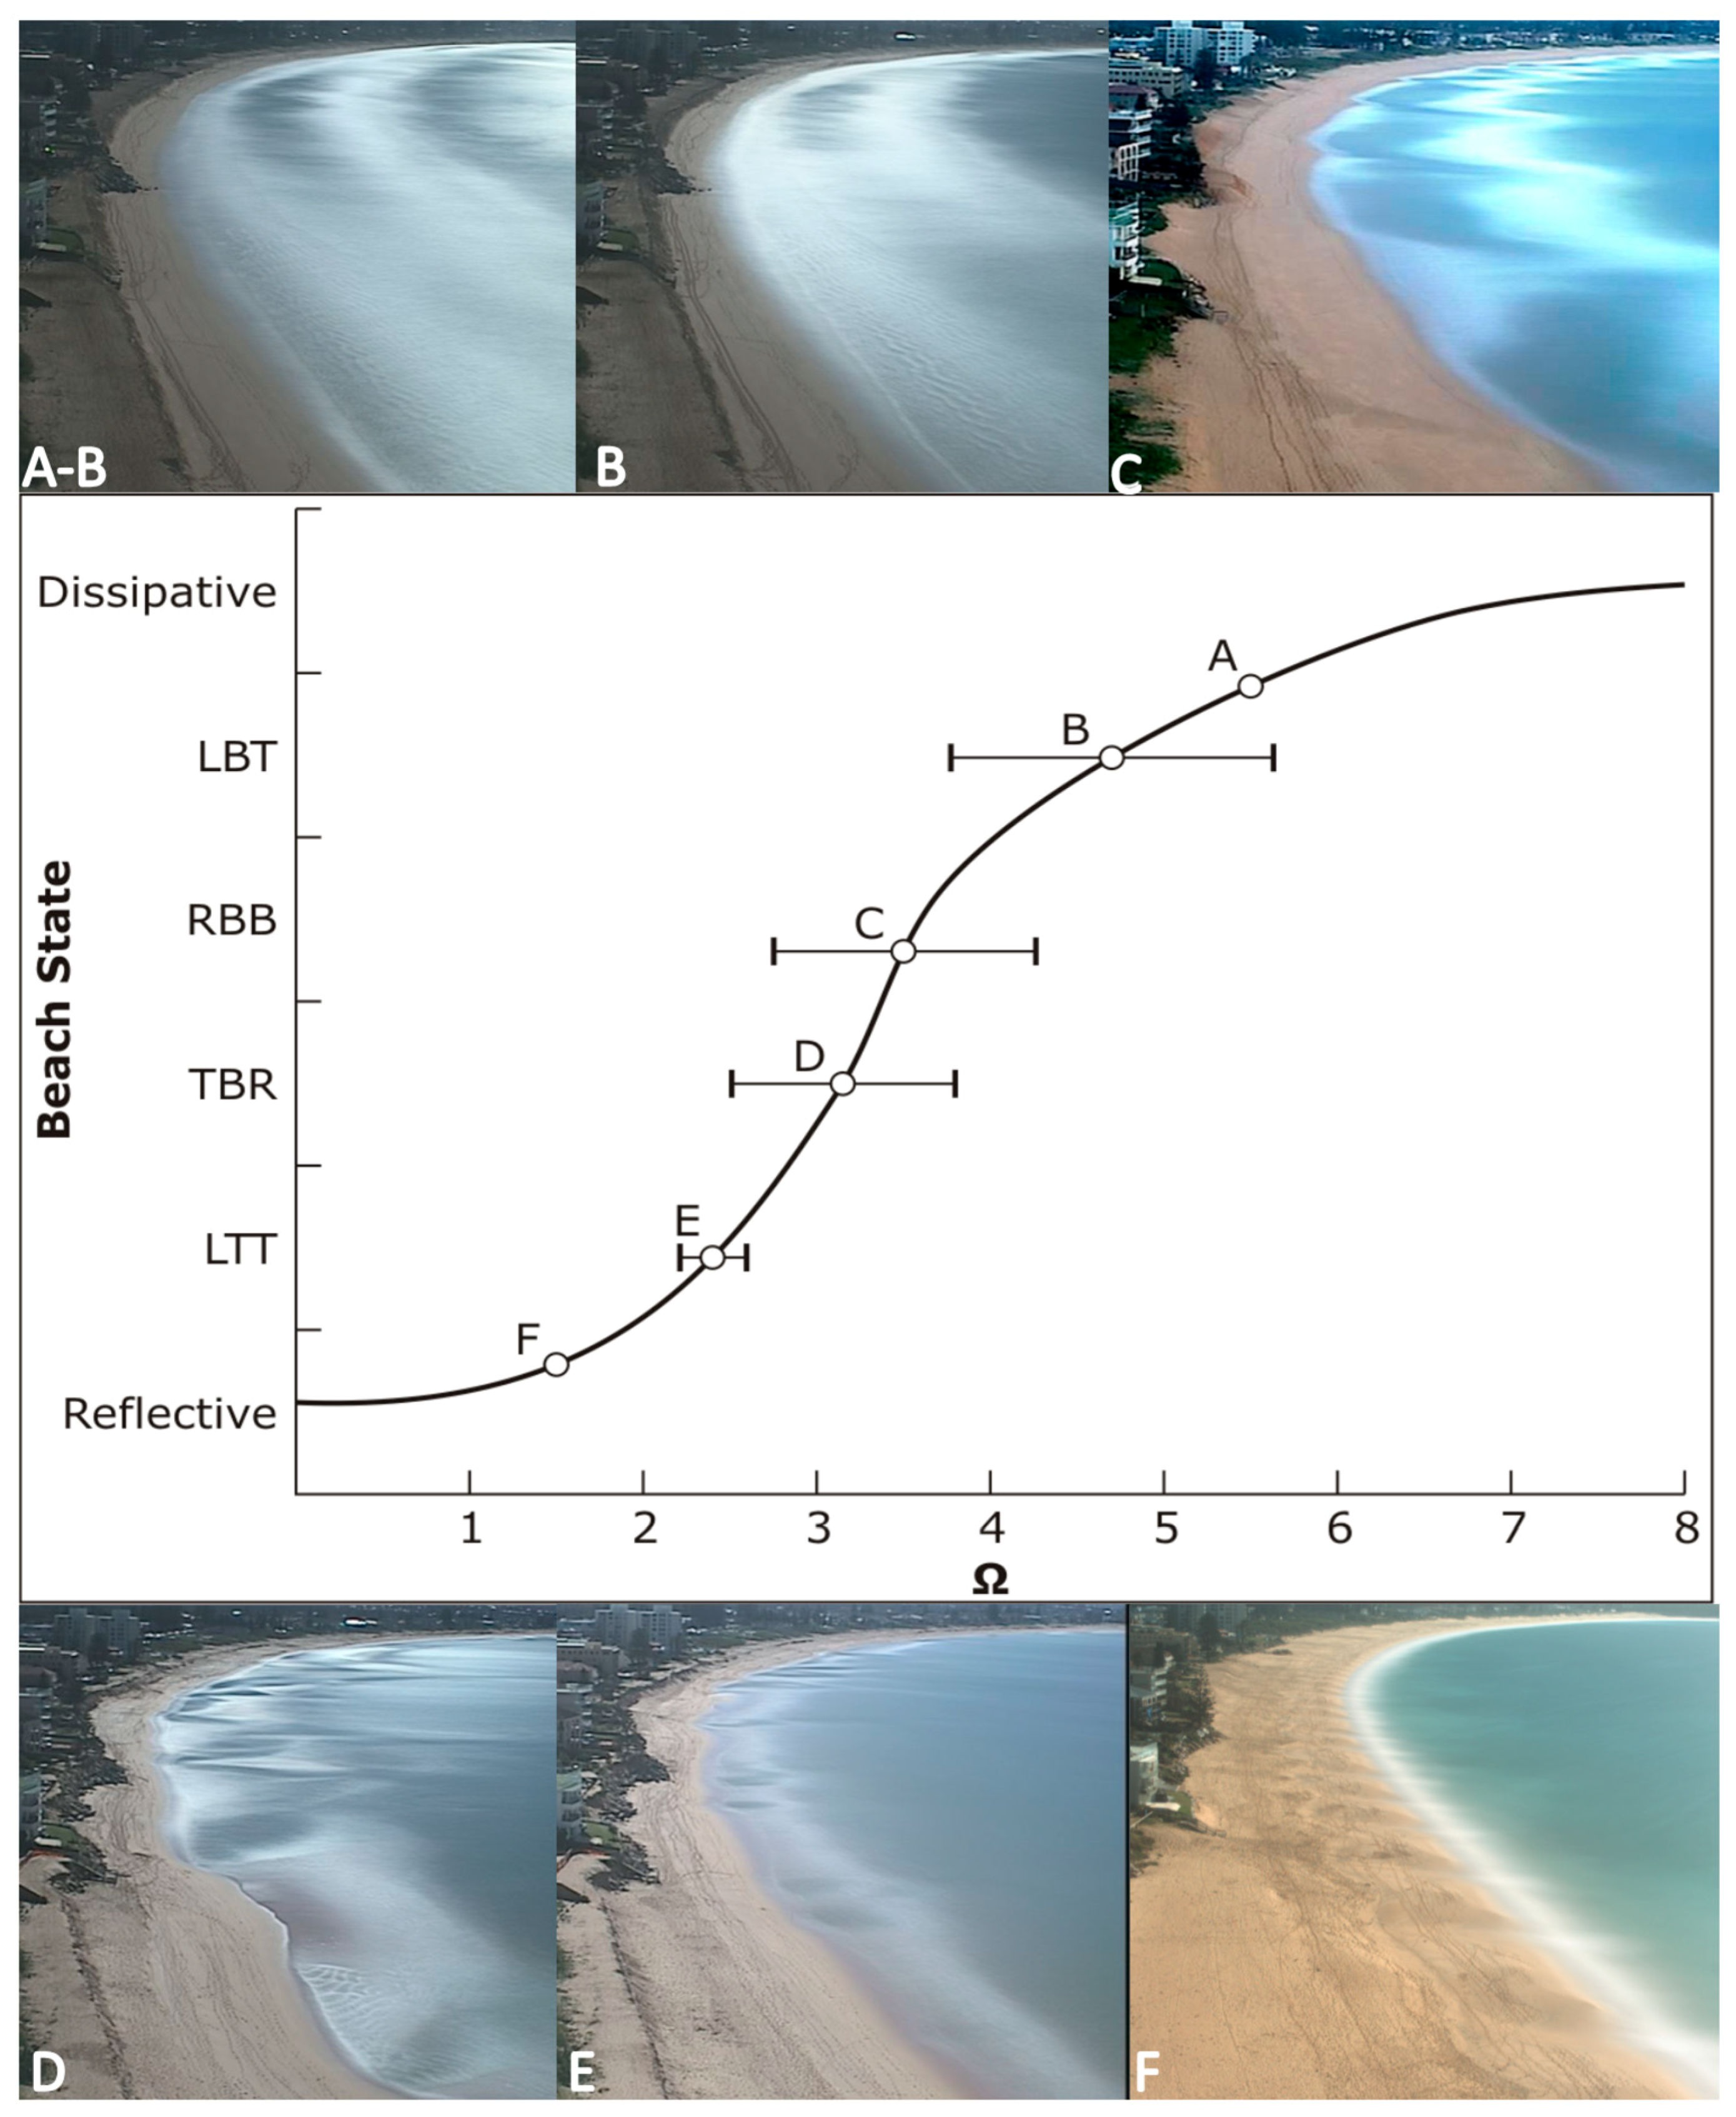
2.3. The First ‘Remote Sensors’ at Narrabeen-Collaroy: Visual Classification of the Surf Zone
2.4. Developments in Video-Based Remote Sensing in the USA and Europe
3. Automated Remote Sensing to Expand Routine Monitoring at Narrabeen-Collaroy (2004–Present)
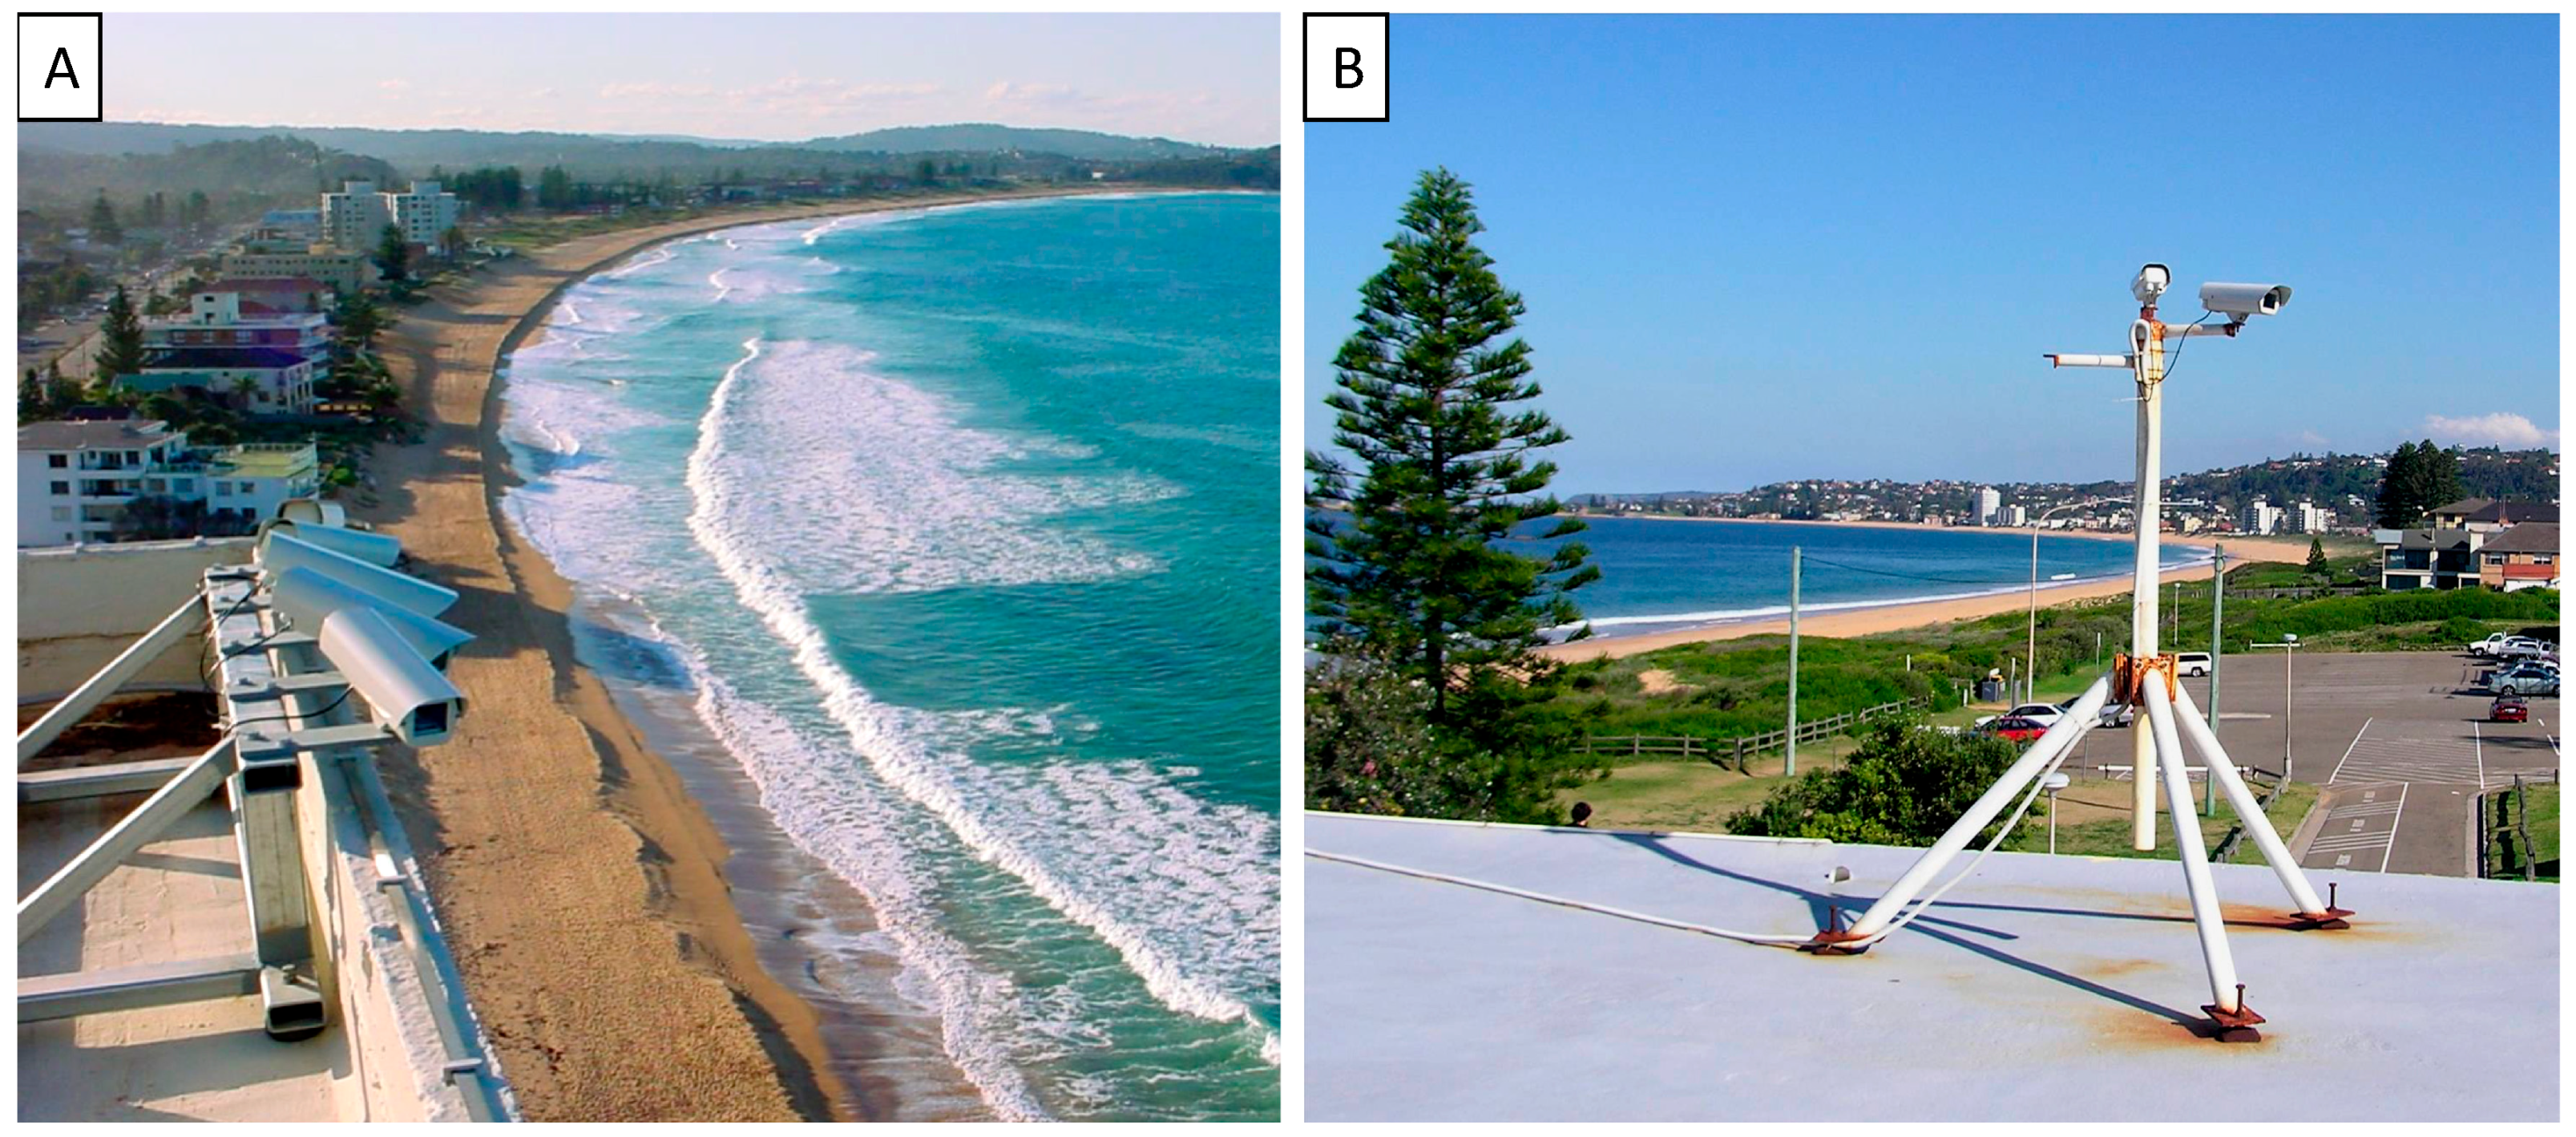
3.1. Video-Based Remote Sensing at Narrabeen
3.1.1. Coastal Lagoon Entrance Sediment Dynamics
3.1.2. Shoreline Response to Storms
3.1.3. Shoreline Modeling
3.1.4. Shoreline Dynamics and the Role of Sandbars
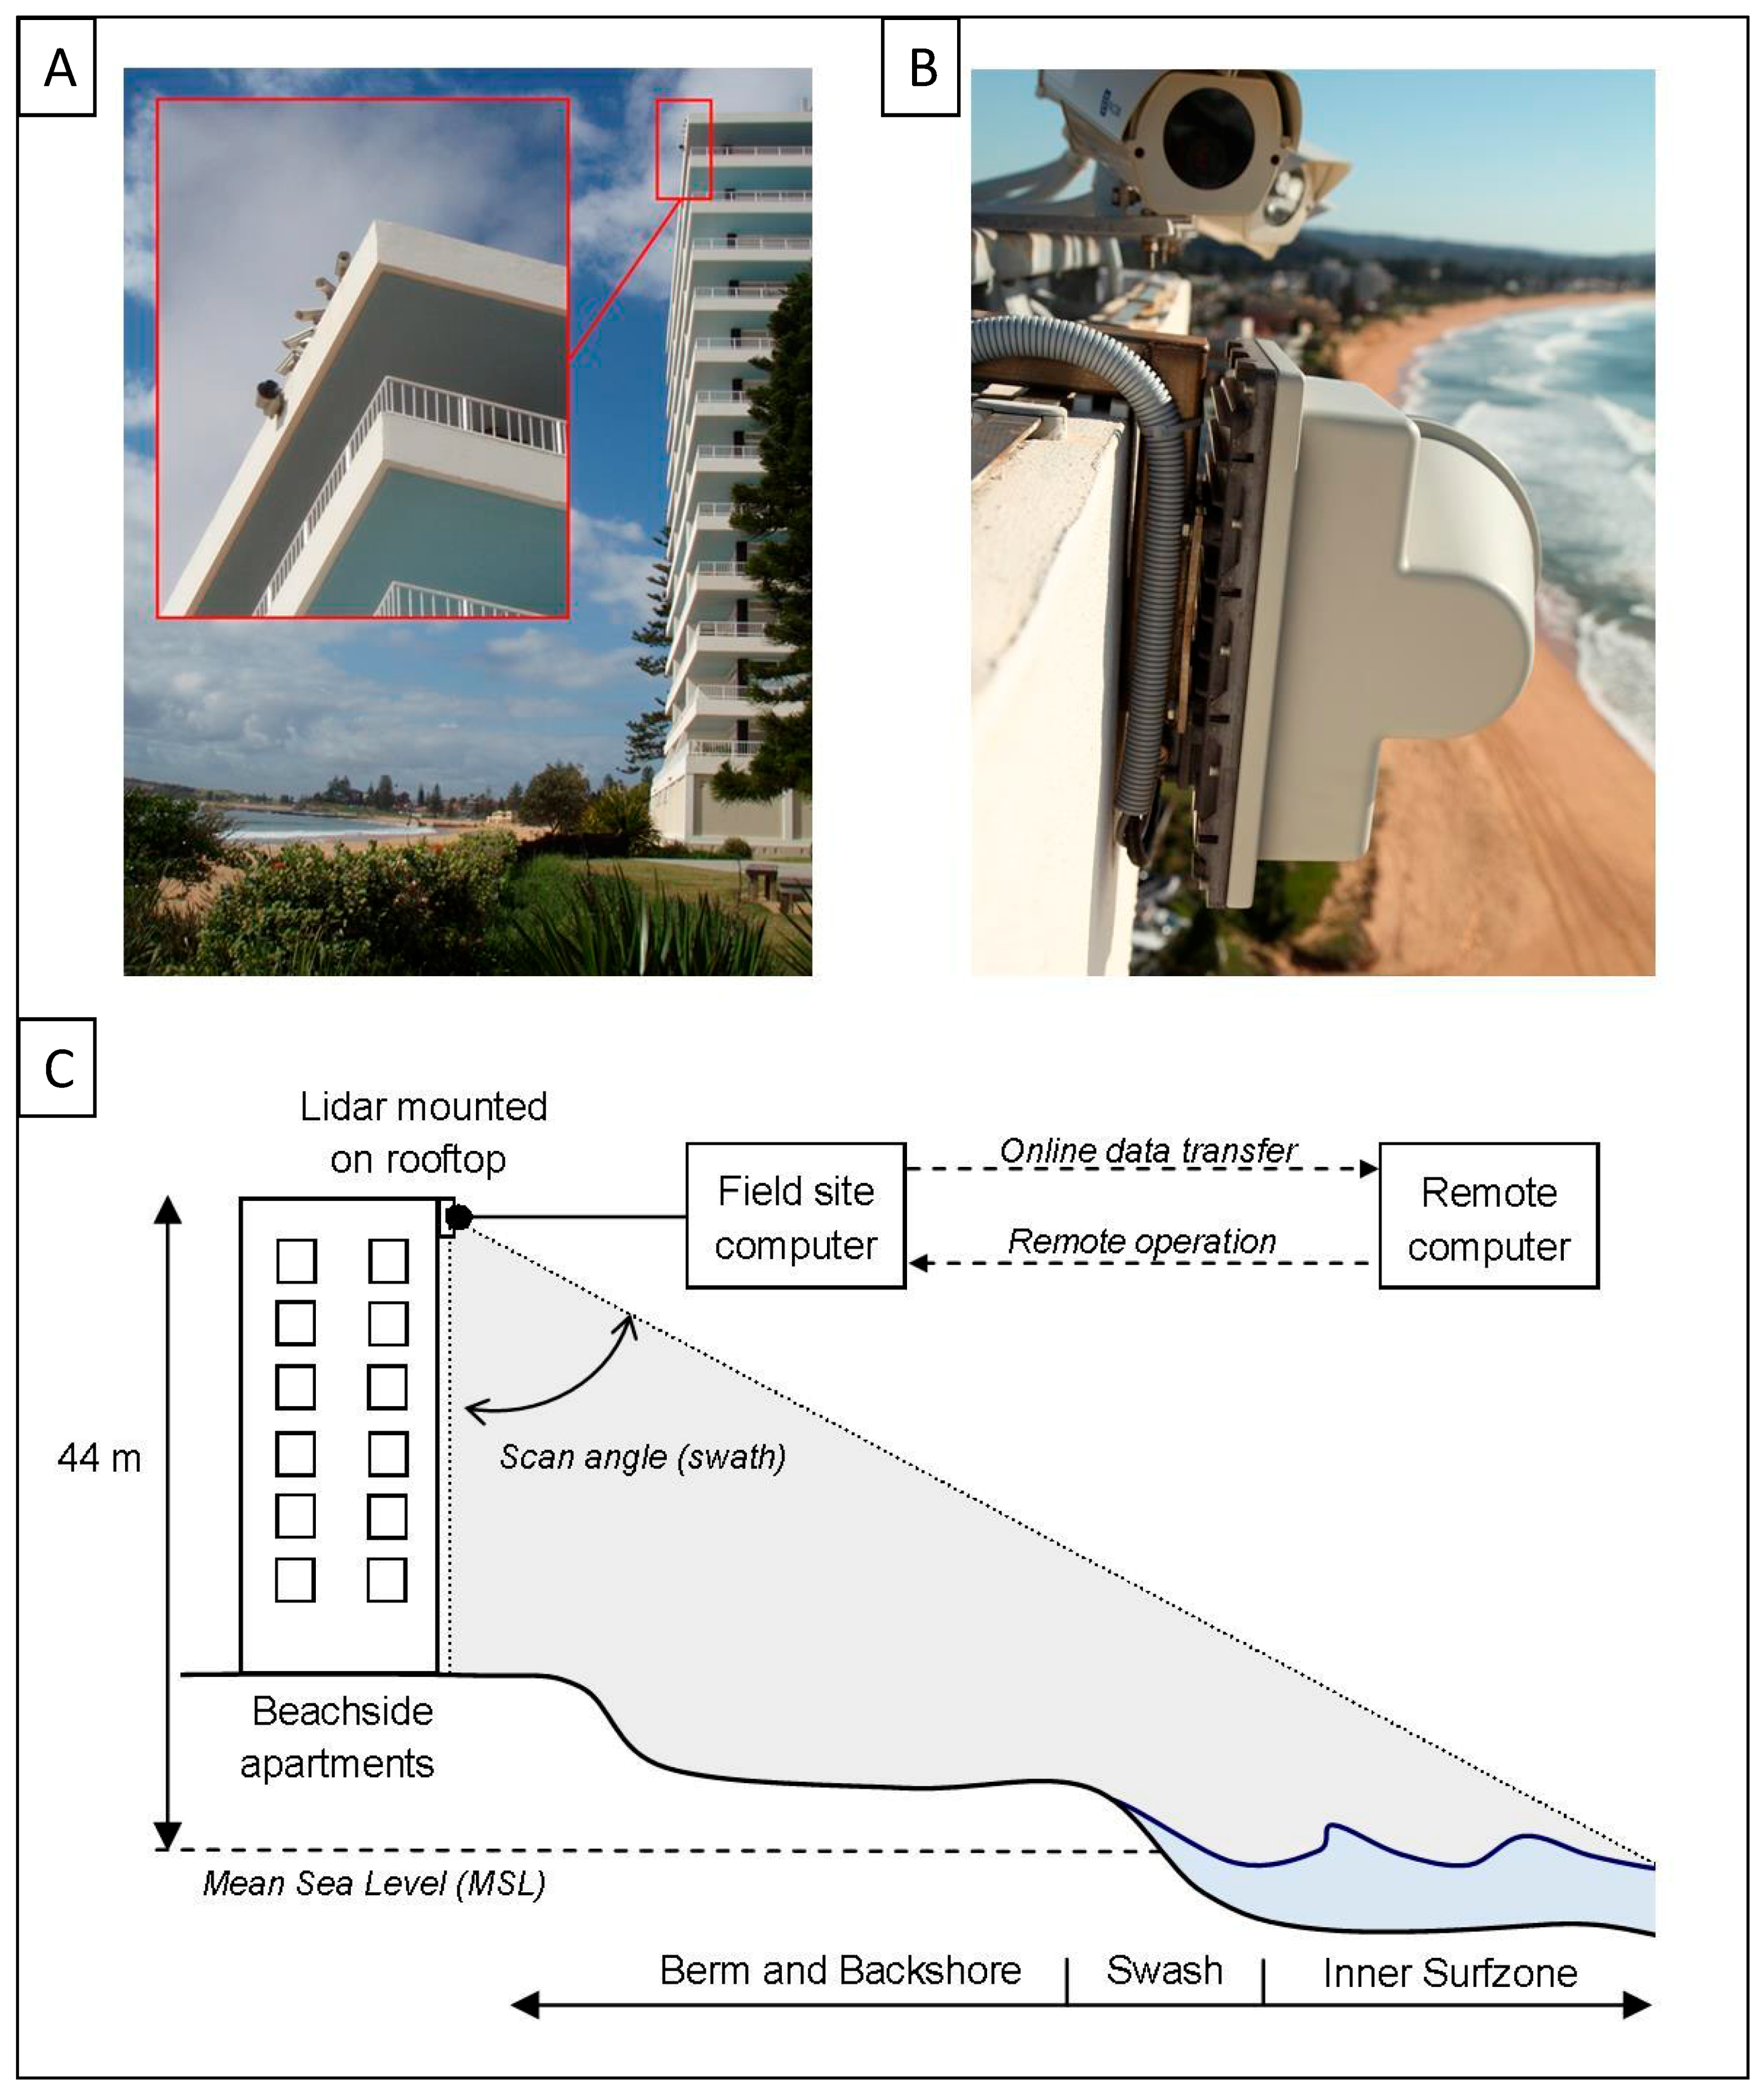
3.2. Fixed Scanning Lidar
3.3. Surfcams
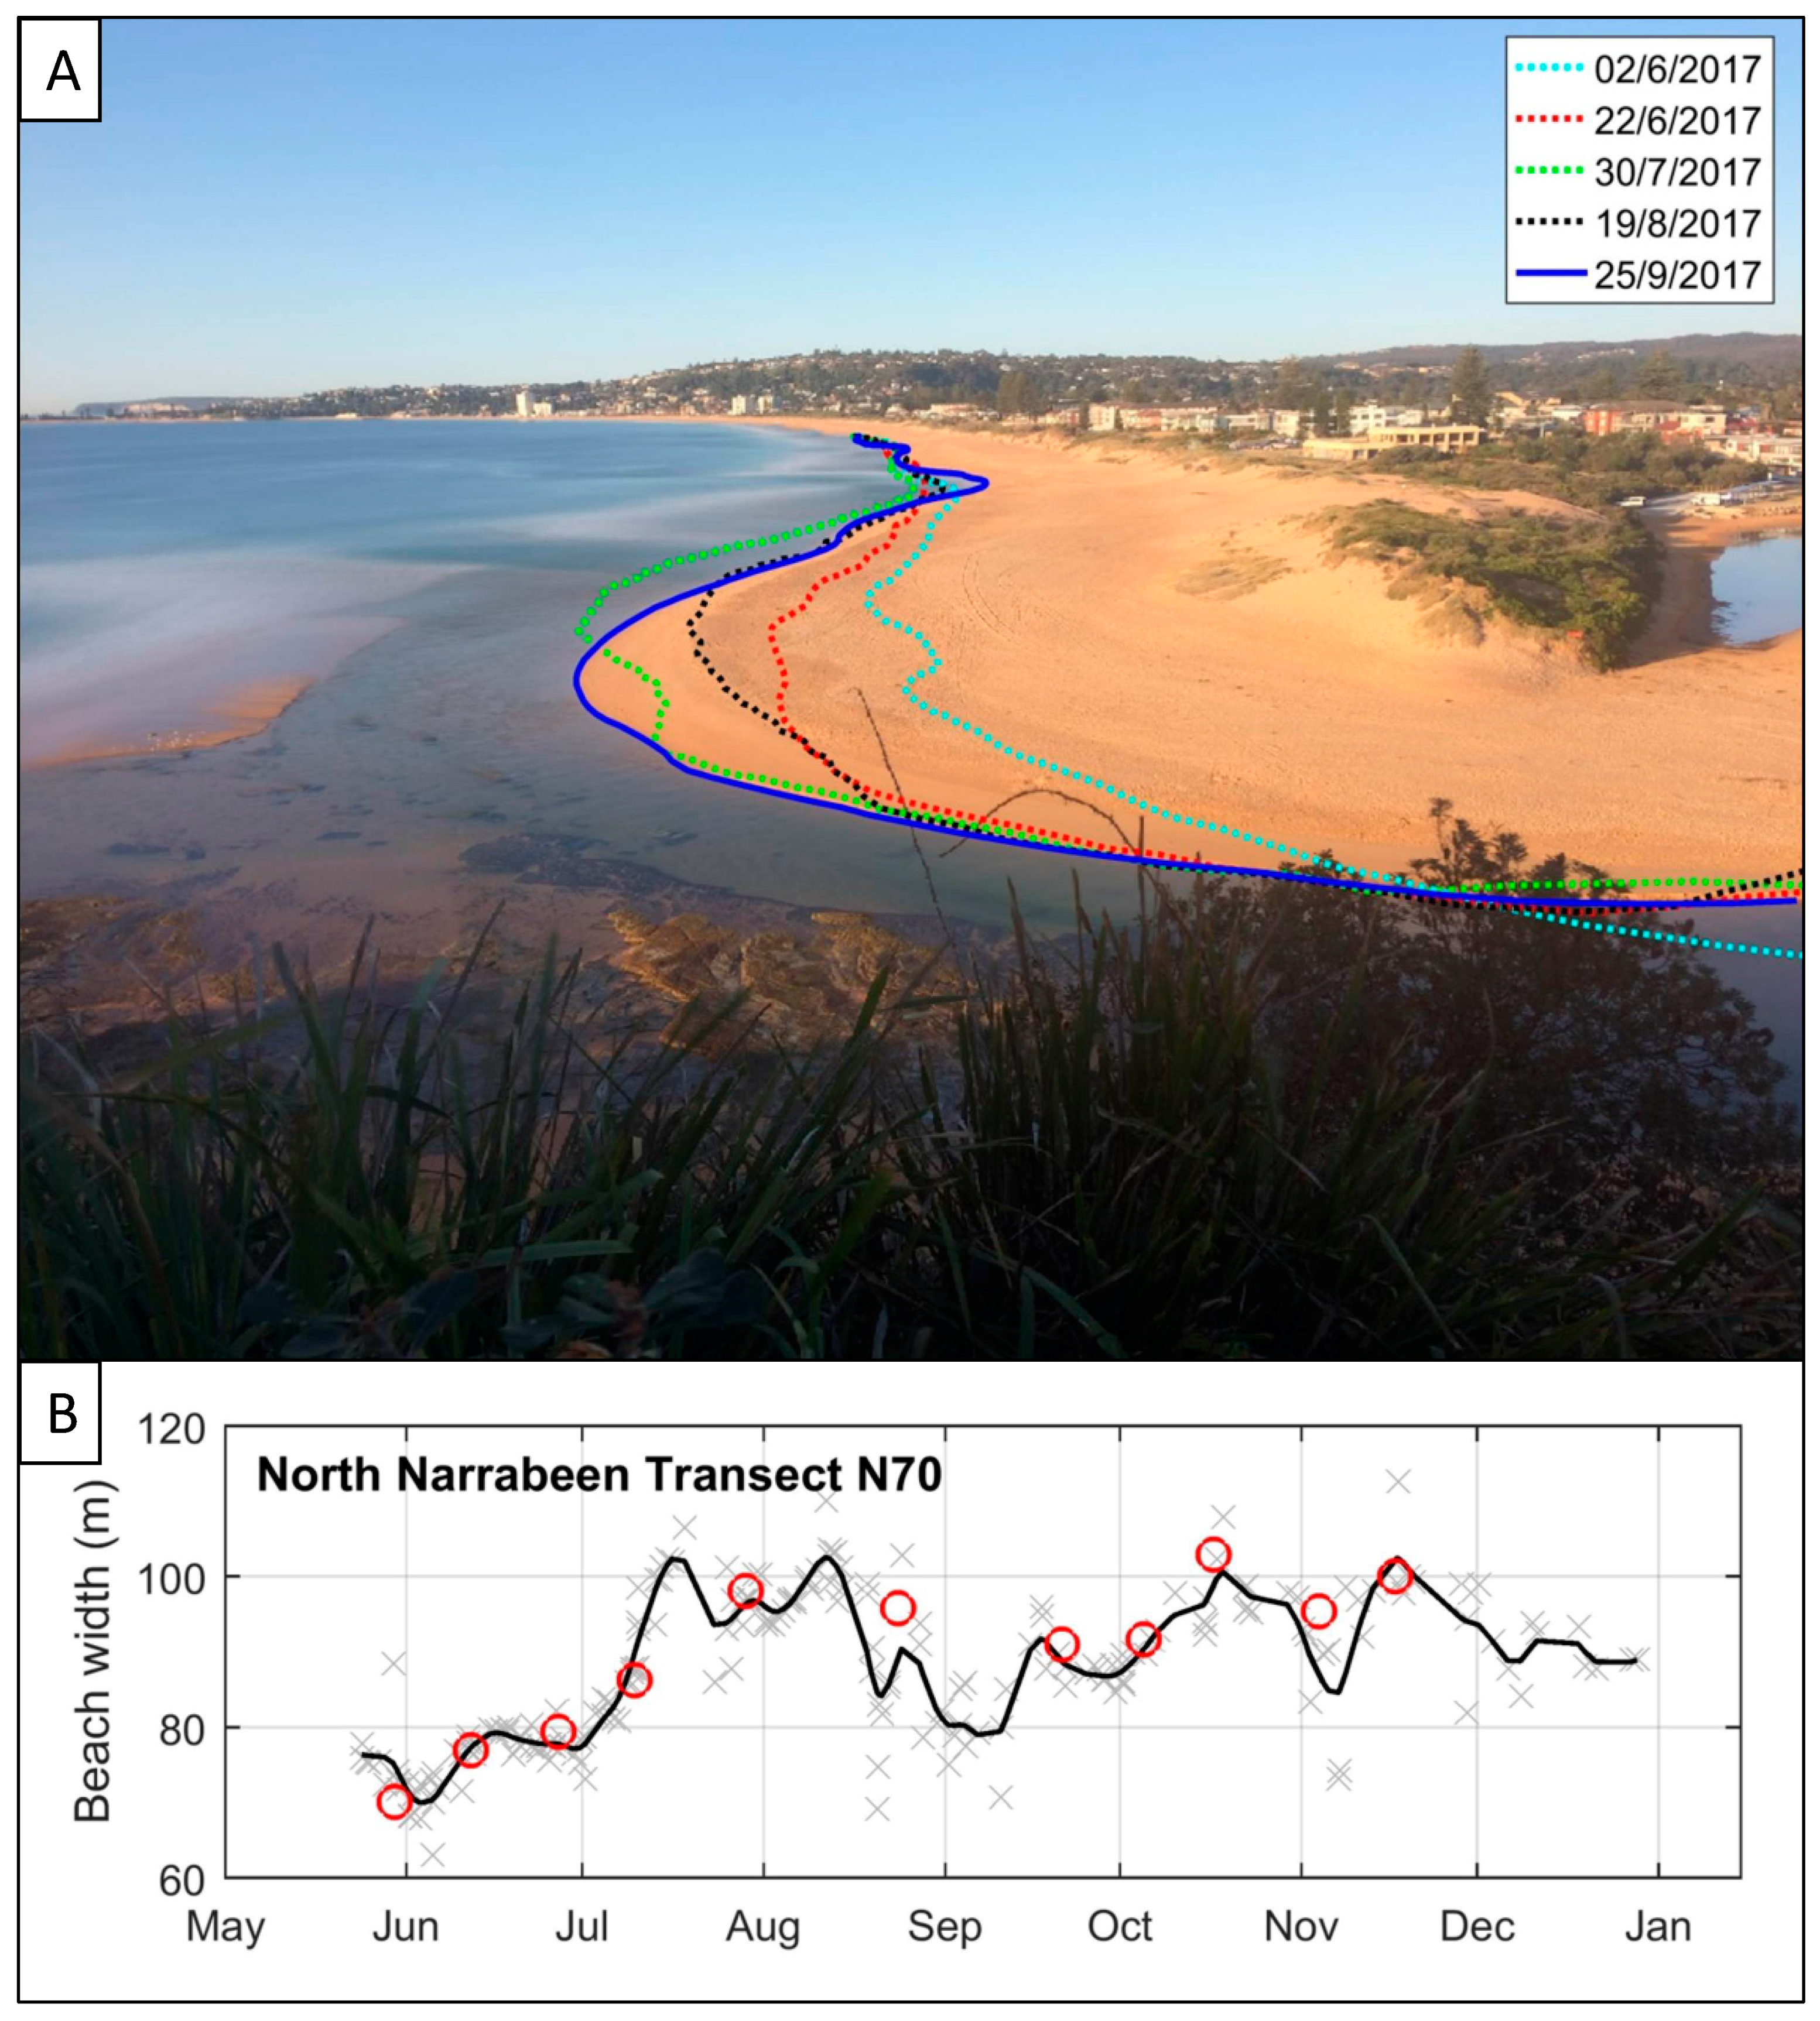
3.4. CoastSnap
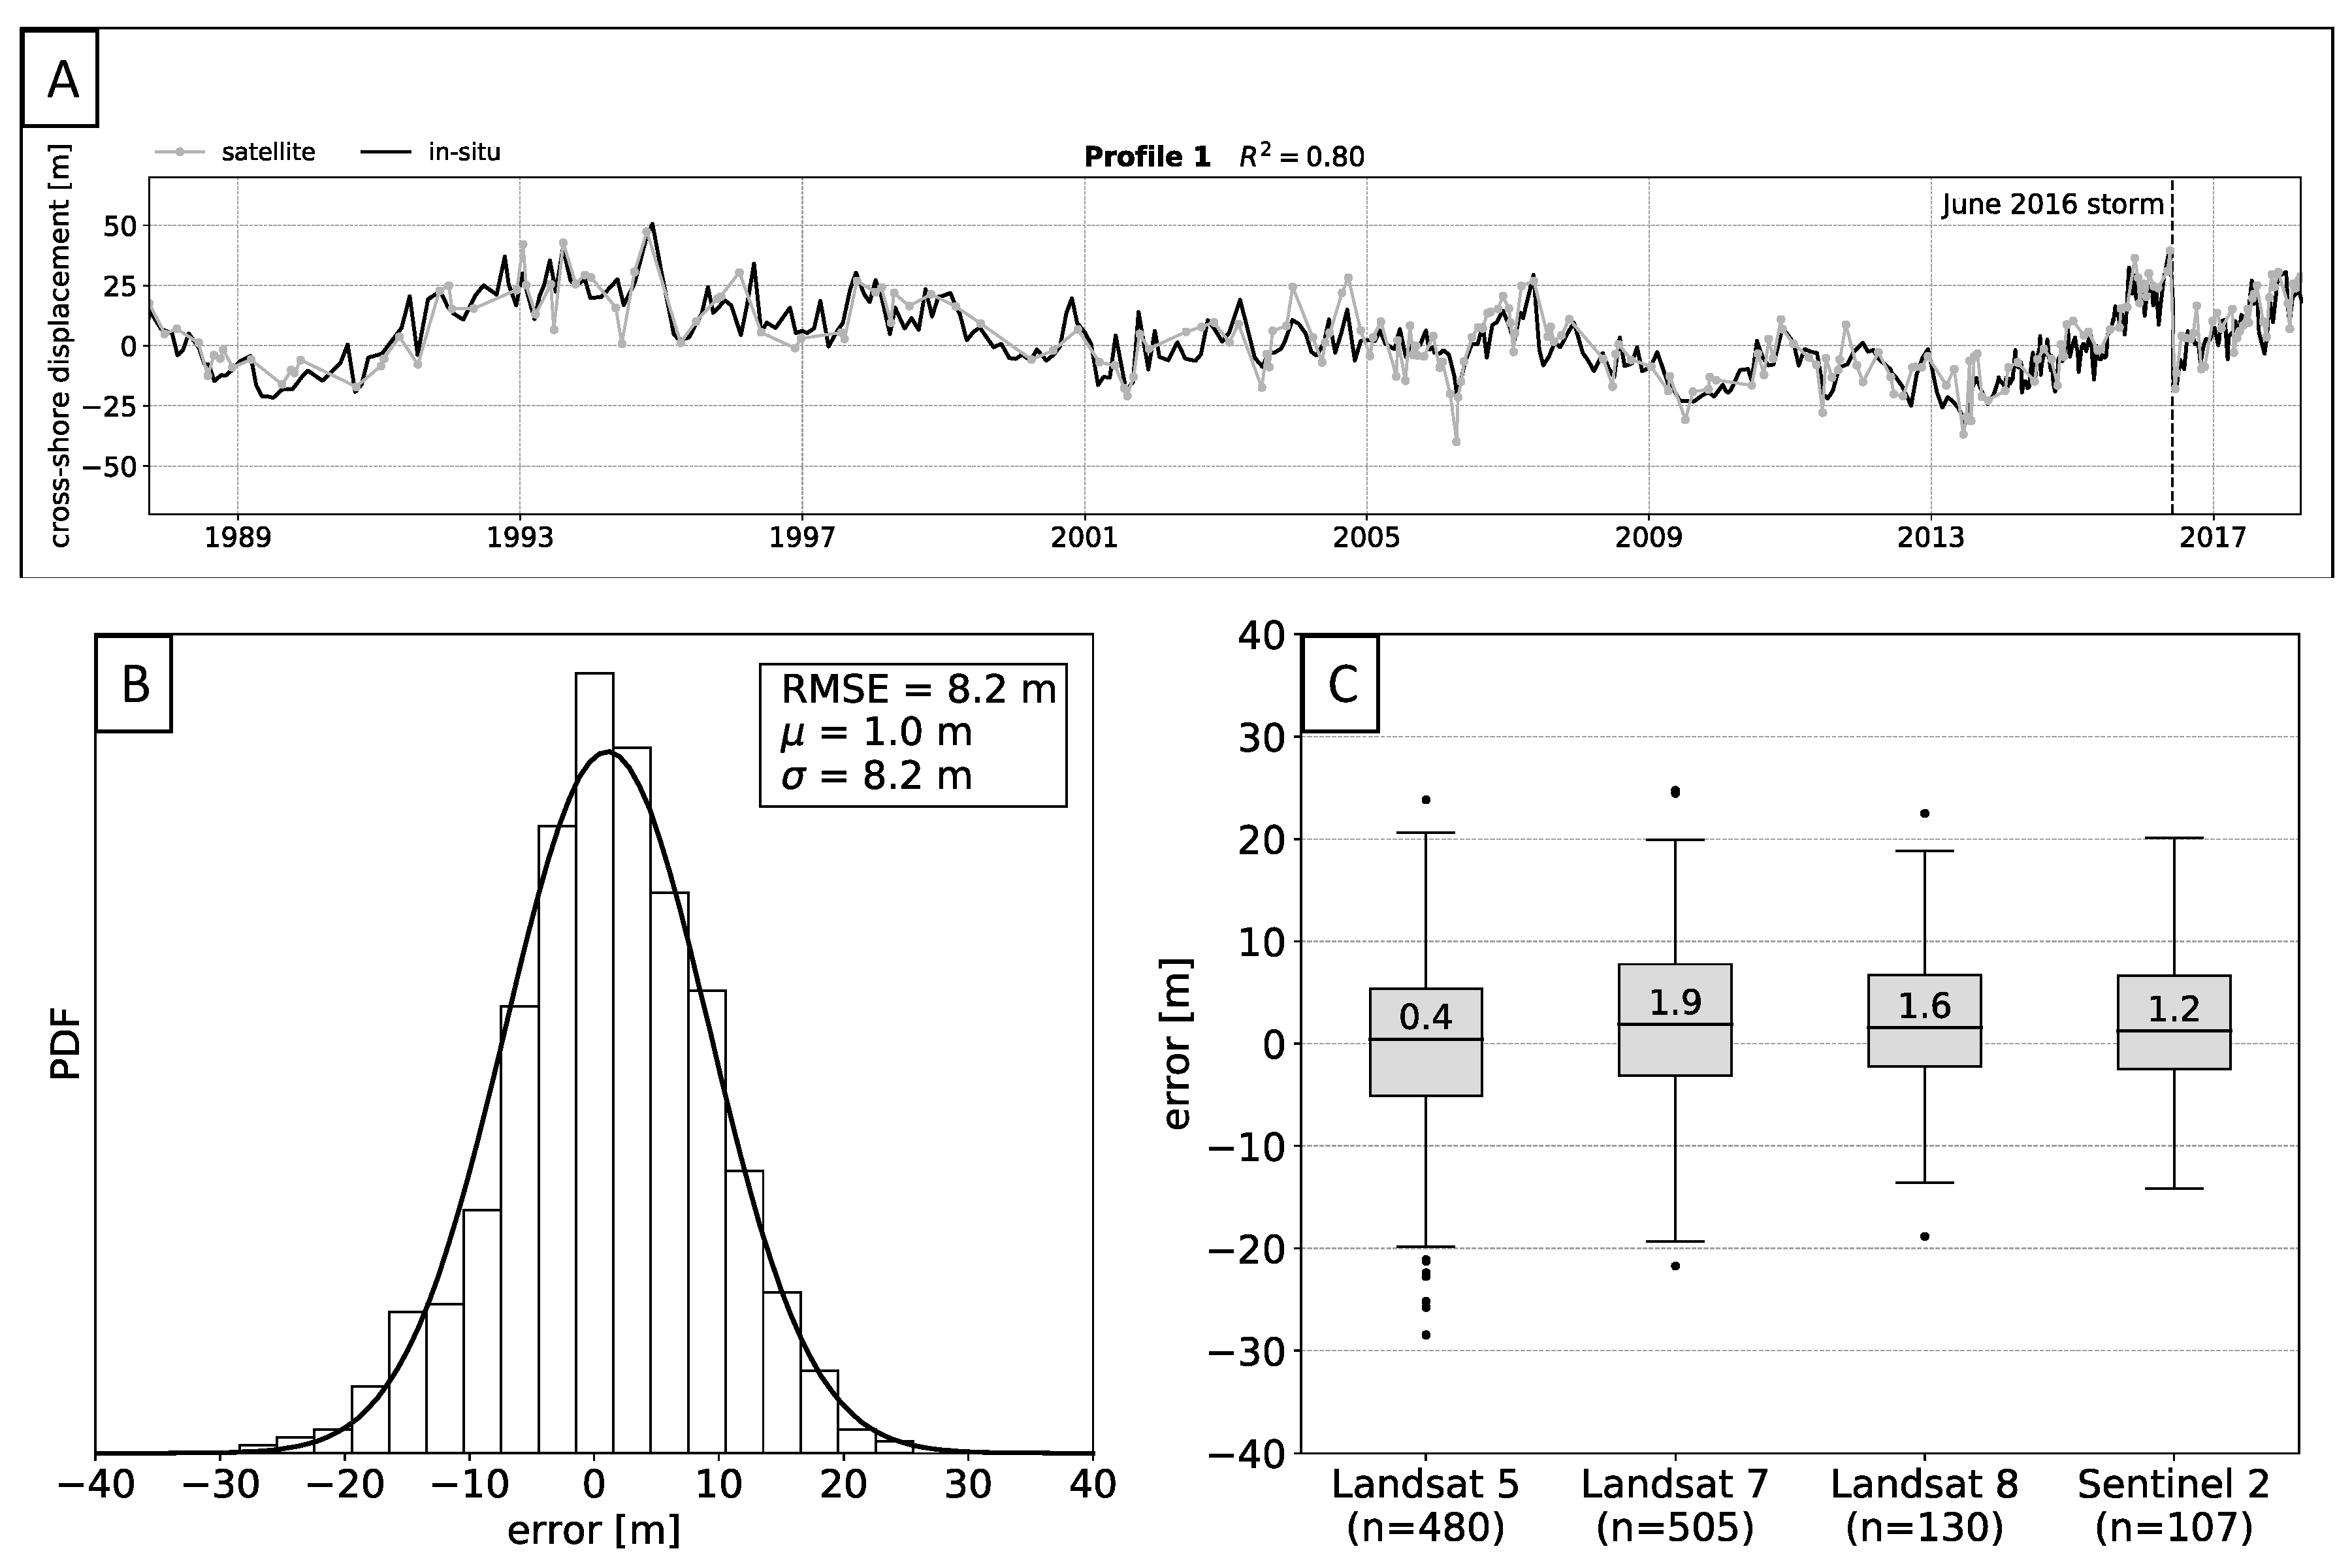
3.5. Satellite-Derived Data
4. Recent Developments: Enhanced Event-Based Monitoring (2011–Present)
4.1. Airborne Lidar
4.2. Unmanned Aerial Vehicles
5. Conclusions and Future Directions
Author Contributions
Funding
Acknowledgments
Conflicts of Interest
References
- Turner, I.L.; Harley, M.D.; Short, A.D.; Simmons, J.A.; Bracs, M.A.; Phillips, M.S.; Splinter, K.D. A multi-decade dataset of monthly beach profile surveys and inshore wave forcing at Narrabeen, Australia. Sci. Data 2016, 3, 160024. [Google Scholar] [CrossRef] [PubMed] [Green Version]
- Barnard, P.L.; Hubbard, D.M.; Dugan, J.E. Beach response dynamics of a littoral cell using a 17-year single-point time series of sand thickness. Geomorphology 2012, 139–140, 588–598. [Google Scholar] [CrossRef]
- Pianca, C.; Holman, R.; Siegle, E. Shoreline variability from days to decades: Results of long-term video imaging. J. Geophys. Res. C Ocean. 2015, 120, 2159–2178. [Google Scholar] [CrossRef] [Green Version]
- Kuriyama, Y.; Banno, M.; Suzuki, T. Linkages among interannual variations of shoreline, wave and climate at Hasaki, Japan. Geophys. Res. Lett. 2012, 39, 2–5. [Google Scholar] [CrossRef]
- Emery, K.O. A simple method of measuring beach profiles. Limnol. Oceanogr. 1961, 6, 90–93. [Google Scholar] [CrossRef] [Green Version]
- Short, A.D.; Trembanis, A.C.; Turner, I.L. Beach oscillations, rotation and the Southern Oscillation, Narrabeen Beach, Australia. In Proceedings of the 27th International Conference on Coastal Engineering (ICCE), Sydney, Australia, 16–21 July 2000; pp. 2439–2452. [Google Scholar]
- Short, A.D.; Trembanis, A.C. Decadal scale patterns in beach oscillation and rotation Narrabeen Beach, Australia—Time series, PCA, and wavelet analysis. J. Coast. Res. 2004, 20, 523–532. [Google Scholar] [CrossRef]
- Ranasinghe, R.; McLoughlin, R.; Short, A.; Symonds, G. The Southern Oscillation Index, wave climate, and beach rotation. Mar. Geol. 2004, 204, 273–287. [Google Scholar] [CrossRef]
- Harley, M.D.; Turner, I.L.; Short, A.D.; Ranasinghe, R. Rotation and oscillation of an embayed beach. Coast. Eng. 2008, 5, 865–875. [Google Scholar]
- Thomas, T.; Phillips, M.R.; Williams, A.T. Mesoscale evolution of a headland bay: Beach rotation processes. Geomorphology 2010, 123, 129–141. [Google Scholar] [CrossRef]
- Barnard, P.L.; Short, A.D.; Harley, M.D.; Splinter, K.D.; Vitousek, S.; Turner, I.L.I.L.; Allan, J.; Banno, M.; Bryan, K.R.; Doria, A.; et al. Coastal vulnerability across the Pacific dominated by El Niño/Southern Oscillation. Nat. Geosci. 2015, 8, 1–8. [Google Scholar] [CrossRef]
- Anderson, D.; Ruggiero, P.; Antolinez, J.A.A.; Mendez, F.J.; Allen, J. A climate index optimized for longshore sediment transport reveals interannual and multi-decadal littoral cell rotations. J. Geophys. Res. Earth Surf. 2018, 1–24. [Google Scholar] [CrossRef]
- Harley, M.D.; Turner, I.L.; Short, A.D.; Ranasinghe, R. A re-evaluation of coastal embayment rotation: The dominance of cross-shore versus alongshore sediment transport processes, Collaroy-Narrabeen Beach, SE Australia. J. Geophys. Res. 2011, 116, F04033. [Google Scholar] [CrossRef]
- Harley, M.D.; Turner, I.L.; Short, A.D.; Ranasinghe, R. Assessment and integration of conventional, RTK-GPS and image-derived beach survey methods for daily to decadal coastal monitoring. Coast. Eng. 2011, 58, 194–205. [Google Scholar] [CrossRef]
- Harley, M.D.; Turner, I.L.; Short, A.D. New insights into embayed beach rotation: The importance of wave exposure and cross-shore processes. J. Geophys. Res. F Earth Surf. 2015, 120, 1470–1484. [Google Scholar] [CrossRef] [Green Version]
- Bracs, M.A.; Turner, I.L.; Splinter, K.D.; Short, A.D.; Mortlock, T.R. Synchronised patterns of erosion and deposition observed at two beaches. Mar. Geol. 2015, 380, 196–204. [Google Scholar] [CrossRef]
- Wright, L.D.; Short, A.D. Morphodynamic variability of surf zones and beaches: A synthesis. Mar. Geol. 1984, 56, 93–118. [Google Scholar] [CrossRef]
- Wright, L.D.; Short, A.D.; Green, M.O. Short-term changes in the morphodynamic states of beaches and surf zones: An empirical predictive model. Mar. Geol. 1985, 62, 339–364. [Google Scholar] [CrossRef]
- Lippmann, T.C.; Holman, R.A. Quantification of sand bar morphology: A video technique based on wave dissipation. J. Geophys. Res. 1989, 94, 995–1011. [Google Scholar] [CrossRef]
- Lippmann, T.C.; Holman, R.A. The spatial and temporal variability of sand bar morphology. J. Geophys. Res. 1990, 95, 11575. [Google Scholar] [CrossRef] [Green Version]
- Masselink, G.; Short, A.D. The Effect of Tide Range on Beach Morphodynamics and Morphology: A Conceptual Beach Model. J. Coast. Res. 1993, 9, 785–800. [Google Scholar]
- Aagaard, T.; Holm, J. Digitization of wave run-up using video records. J. Coast. Res. 1989, 5, 547–551. [Google Scholar]
- Holman, R.A.; Stanley, J.; Özkan-Haller, H.T. Applying Video Sensor Networks to Nearshore Environmental Monitoring. IEEE Pervasive Comput. 2003, 2, 14–21. [Google Scholar] [CrossRef]
- Holman, R.A.; Stanley, J. The history and technical capabilities of Argus. Coast. Eng. 2007, 54, 477–491. [Google Scholar] [CrossRef]
- Holland, K.T.; Holman, R.A.; Lippmann, T.C.; Stanley, J.; Plant, N. Practical use of video imagery in nearshore oceanographic field studies. IEEE J. Ocean Eng. 1997, 22, 81–92. [Google Scholar] [CrossRef]
- Turner, I.L.; Aarninkhof, S.G.J.; Holman, R.A. Coastal Imaging Applications and Research in Australia. J. Coast. Res. 2006, 221, 37–48. [Google Scholar] [CrossRef]
- Holman, R.; Plant, N.; Holland, T. CBathy: A robust algorithm for estimating nearshore bathymetry. J. Geophys. Res. Ocean 2013, 118, 2595–2609. [Google Scholar] [CrossRef]
- Alexander, P.S.; Holman, R.A. Quantification of nearshore morphology based on video imaging. Mar. Geol. 2004, 208, 101–111. [Google Scholar] [CrossRef]
- Turner, I.L. Discriminating modes of shoreline response to offshore-detached structures. J. Waterw. Port Coast. Ocean Eng. 2006, 132, 180–191. [Google Scholar] [CrossRef]
- Davidson, M.A.; Turner, I.L. A behavioral template beach profile model for predicting seasonal to interannual shoreline evolution. J. Geophys. Res. 2009, 114, F01020. [Google Scholar] [CrossRef]
- Davidson, M.A.; Splinter, K.D.; Turner, I.L. A simple equilibrium model for predicting shoreline change. Coast. Eng. 2013, 73, 191–202. [Google Scholar] [CrossRef]
- Splinter, K.D.; Turner, I.L.; Davidson, M.A.; Barnard, P.; Castelle, B.; Oltman-Shay, J. A generalized equilibrium model for predicting daily to interannual shoreline response. J. Geophys. Res. Earth Surf. 2014, 119, 1936–1958. [Google Scholar] [CrossRef] [Green Version]
- Splinter, K.D.; Turner, I.L.; Reinhardt, M.; Ruessink, G. Rapid adjustment of shoreline behavior to changing seasonality of storms: Observations and modelling at an open-coast beach. Earth Surf. Process. Landf. 2016. [Google Scholar] [CrossRef]
- Splinter, K.D.; Strauss, D.R.; Tomlinson, R.B. Assessment of post-storm recovery of beaches using video imaging techniques: A case study at Gold Coast, Australia. IEEE Trans. Geosci. Remote Sens. 2011, 49, 4704–4716. [Google Scholar] [CrossRef]
- Plant, N.G.; Holman, R.A.; Freilich, M.H. A simple model for interannual sand bar behavior. J. Geophys. Res. 1999, 104, 15755–15776. [Google Scholar] [CrossRef]
- van Enckevort, I.M.J.; Ruessink, B.G. Video observations of nearshore bar behavior. Part 2: Alongshore non-uniform variability. Cont. Shelf Res. 2003, 23, 513–532. [Google Scholar] [CrossRef]
- van Enckevort, I.M.J.; Ruessink, B.G.; Coco, G.; Suzuki, K.; Turner, I.L.; Plant, N.G.; Holman, R.A. Observations of nearshore crescentic sandbars. J. Geophys. Res. 2004, 109, 1–17. [Google Scholar] [CrossRef]
- Ruessink, B.G.; Pape, L.; Turner, I.L. Daily to interannual cross-shore sandbar migration: Observations from a multiple sandbar system. Cont. Shelf Res. 2009, 29, 1663–1677. [Google Scholar] [CrossRef]
- Castelle, B.; Ruessink, B.G.; Bonneton, P.; Marieu, V.; Bruneau, N.; Price, T.D. Coupling mechanisms in double sandbar systems. Part 1: Patterns and physical explanation. Earth Surf. Process. Landf. 2010, 35, 476–486. [Google Scholar] [CrossRef]
- Pape, L.; Plant, N.G.; Ruessink, B.G. On cross-shore migration and equilibrium states of nearshore sandbars. J. Geophys. Res. Earth Surf. 2010, 115, 1–16. [Google Scholar] [CrossRef]
- Splinter, K.D.; Holman, R.; Plant, N. A behavior-oriented dynamic model for sand bar migration and 2DH evolution. J. Geophys. Res. 2011, 116, C01020. [Google Scholar] [CrossRef]
- Splinter, K.D.; Gonzalez, M.V.G.; Oltman-Shay, J.; Rutten, J.; Holman, R. Observations and modelling of shoreline and multiple sandbar behaviour on a high-energy meso-tidal beach. Cont. Shelf Res. 2018, 159, 33–45. [Google Scholar] [CrossRef]
- Price, T.D.; Ruessink, B.G. State dynamics of a double sandbar system. Cont. Shelf Res. 2011, 31, 659–674. [Google Scholar] [CrossRef]
- Price, T.D.; Ruessink, B.G. Observations and conceptual modelling of morphological coupling in a double sandbar system. Earth Surf. Process. Landf. 2013, 38, 477–489. [Google Scholar] [CrossRef]
- Stockdon, H.F.; Holman, R.A. Estimation of wave phase speed and nearshore bathymetry from video imagery. J. Geophys. Res. 2000, 105, 22015. [Google Scholar] [CrossRef]
- Aarninkhof, S.G.J. Nearshore Bathymetry Derived from Video Imagery. Ph.D. Thesis, Delft University, Delft, The Netherlands, 2003. [Google Scholar]
- Holland, K.T.; Holman, R.A. Video estimation of foreshore topography using trinocular stereo. J. Coast. Res. 1997, 13, 81–87. [Google Scholar]
- Plant, N.G.; Holman, R.A. Intertidal beach profile estimation using video images. Mar. Geol. 1997, 140, 1–24. [Google Scholar] [CrossRef]
- Aarninkhof, S.G.J.; Roelvink, J.A. Argus-based monitoring of intertidal beach morphodynamics. Proc. Coast. Sediments 1999, 99, 2429–2444. [Google Scholar]
- Aarninkhof, S.G.J.; Turner, I.L.; Dronkers, T.D.T.; Caljouw, M.; Nipius, L. A video technique for mapping intertidal beach bathymetry. Coast. Eng. 2003, 49, 275–289. [Google Scholar] [CrossRef]
- Uunk, L.; Wijnberg, K.M.; Morelissen, R. Automated mapping of the intertidal beach bathymetry from video images. Coast. Eng. 2010, 57, 461–469. [Google Scholar] [CrossRef]
- Didier, D.; Bernatchez, P.; Augereau, E.; Caulet, C.; Dumont, D.; Bismuth, E.; Cormier, L.; Floc’h, F.; Delacourt, C. LiDAR Validation of a Video-Derived Beachface Topography on a Tidal Flat. Remote Sens. 2017, 9, 1–22. [Google Scholar] [CrossRef]
- Pianca, C.; Holman, R.; Siegle, E. Mobility of meso-scale morphology on a microtidal ebb delta measured using remote sensing. Mar. Geol. 2014, 357, 334–343. [Google Scholar] [CrossRef] [Green Version]
- Harrison, S.R.; Bryan, K.R.; Mullarney, J.C. Observations of morphological change at an ebb-tidal delta. Mar. Geol. 2017, 385, 131–145. [Google Scholar] [CrossRef]
- Holman, R.A.; Symonds, G.; Thornton, E.B.; Ranasinghe, R. Rip spacing and persistence on an embayed beach. J. Geophys. Res. Ocean 2006, 111. [Google Scholar] [CrossRef] [Green Version]
- Turner, I.L.; Whyte, D.; Ruessink, B.G.; Ranasinghe, R. Observations of rip spacing, persistence and mobility at a long, straight coastline. Mar. Geol. 2007, 236, 209–221. [Google Scholar] [CrossRef]
- Quartel, S. Temporal and spatial behaviour of rip channels in a multiple-barred coastal system. Earth Surf. Process. Landf. 2009, 34, 163–176. [Google Scholar] [CrossRef]
- Holland, K.T.; Holman, R.A. Wavenumber-frequency structure of infragravity swash motions. J. Geophys. Res. 1999, 104, 13479–13488. [Google Scholar] [CrossRef] [Green Version]
- Plant, N.; Holland, K.T.; Haller, M. Ocean Wavenumber Estimation from Wave-Resolving Time Series Imagery. IEEE Trans. Geosci. Remote Sens. 2008, 46, 2644–2658. [Google Scholar] [CrossRef]
- Holman, R.A.; Chickadel, C.C. Optical remote sensing estimates of the incident wave angle field during NCEX. Coast. Eng. 2005, 4, 1072–1081. [Google Scholar]
- Aarninkhof, S.G.J.; Ruessink, B.G. Video Observations and Model Predictions of Depth-Induced Wave Dissipation. IEEE Trans. Geosci. Remote Sens. 2004, 42, 2612–2622. [Google Scholar] [CrossRef]
- Chickadel, C.C.; Holman, R.A.; Freilich, M.F. An optical technique for the measurement of longshore currents. J. Geophys. Res. 2003, 108, 3364. [Google Scholar] [CrossRef]
- de Vries, S.; Hill, D.F.; de Schipper, M.A.; Stive, M.J.F. Remote sensing of surf zone waves using stereo imaging. Coast. Eng. 2011, 58, 239–250. [Google Scholar] [CrossRef]
- Shand, T.D.; Bailey, D.G.; Shand, R.D. Automated Detection of Breaking Wave Height Using an Optical Technique. J. Coast. Res. 2012, 28, 671–682. [Google Scholar] [CrossRef]
- Stockdon, H.F.; Holman, R.A. Accuracy of depth estimation techniques based on video observations of wave celerity. Trans. Am. Geophys. Union 1996, 77, 399. [Google Scholar]
- Power, H.E.; Holman, R.A.; Baldock, T.E. Swash zone boundary conditions derived from optical remote sensing of swash zone flow patterns. J. Geophys. Res. Ocean 2011, 116. [Google Scholar] [CrossRef] [Green Version]
- Senechal, N.; Coco, G.; Bryan, K.R.; Holman, R.A. Wave runup during extreme storm conditions. J. Geophys. Res. Ocean 2011, 116. [Google Scholar] [CrossRef] [Green Version]
- Palmsten, M.L.; Splinter, K.D. Observations and simulations of wave runup during a laboratory dune erosion experiment. Coast. Eng. 2016, 115, 58–66. [Google Scholar] [CrossRef] [Green Version]
- Palmsten, M.L.; Holman, R.A. Laboratory investigation of dune erosion using stereo video. Coast. Eng. 2012, 60, 123–135. [Google Scholar] [CrossRef]
- Morris, B.D.; Coco, G.; Bryan, K.R.; Turner, I.L.; Street, K.; Vale, M. Video-derived mapping of estuarine evolution. J. Coast. Res. 2007, 2007, 410–414. [Google Scholar]
- Harley, M.D.; Turner, I.L.; Short, A.D.; Ranasinghe, R. An empirical model of beach response to storms—SE Australia. In Proceedings of the 19th Australasian Coastal and Ocean Engineering Conference, Wellington, New Zealand, 16–18 September 2009; pp. 600–606. [Google Scholar]
- Beuzen, T.; Splinter, K.D.; Marshall, L.A.; Turner, I.L.; Harley, M.D.; Palmsten, M.L. Bayesian Networks in coastal engineering: Distinguishing descriptive and predictive applications. Coast. Eng. 2018, 135, 16–30. [Google Scholar] [CrossRef]
- Splinter, K.D.; Turner, I.L.; Davidson, M.A. How much data is enough? The importance of morphological sampling interval and duration for calibration of empirical shoreline models. Coast. Eng. 2013, 77, 14–27. [Google Scholar] [CrossRef]
- Phillips, M.S.; Harley, M.D.; Turner, I.L.; Splinter, K.D.; Cox, R.J. Shoreline recovery on wave-dominated sandy coastlines: The role of sandbar morphodynamics and nearshore wave parameters. Mar. Geol. 2017, 385, 146–159. [Google Scholar] [CrossRef]
- Gallop, S.L.; Harley, M.D.; Brander, R.W.; Simmons, J.A.; Splinter, K.D.; Turner, I.L. Assessing Cross-Shore and Alongshore Variation in Beach Morphology Due to Wave Climate: Storms to Decades. Oceanography 2017, 30. [Google Scholar] [CrossRef] [Green Version]
- Kearney, E.T.; Harley, M.D.; Turner, I.L.; Wyeth, B.; Goodwin, I.D. An energy based model of storm induced shoreline erosion—Gold Coast, Australia. In Coasts and Ports 2011: Diverse and Developing, Proceedings of the 20th Australasian Coastal and Ocean Engineering Conference and the 13th Australasian Port and Harbour Conference, Perth, Australia, 28–30 September 2011; Engineers Australia: Sydney, Australia, 2011; pp. 191–196. [Google Scholar]
- Splinter, K.D.; Carley, J.T.; Golshani, A.; Tomlinson, R. A relationship to describe the cumulative impact of storm clusters on beach erosion. Coast. Eng. 2014, 83, 49–55. [Google Scholar] [CrossRef]
- Yates, M.L.; Guza, R.T.; O’Reilly, W.C. Equilibrium shoreline response: Observations and modeling. J. Geophys. Res. 2009, 114, C09014. [Google Scholar] [CrossRef]
- Gourlay, M.R. Beach and Dune Erosion Due to Storms; Rep. No. M935/M936; Delft Hydraulics Laboratory: Delft, The Netherlands, 1968. [Google Scholar]
- Blossier, B.; Bryan, K.R.; Daly, C.J.; Winter, C. Shore and bar cross-shore migration, rotation, and breathing processes at an embayed beach. J. Geophys. Res. Earth Surf. 2017, 122, 1745–1770. [Google Scholar] [CrossRef]
- Brodie, K.L.; Slocum, R.K.; McNinch, J.E. New insights into the physical drivers of wave runup from a continuously operating terrestrial laser scanner. Ocean 2012. [Google Scholar] [CrossRef]
- Vousdoukas, M.I.; Kirupakaramoorthy, T.; Oumeraci, H.; de Torre, M.; Wübbold, F.; Wagner, B.; Schimmels, S. The role of combined laser scanning and video techniques in monitoring wave-by-wave swash zone processes. Coast. Eng. 2014, 83, 150–165. [Google Scholar] [CrossRef]
- Martins, K.; Blenkinsopp, C.E.; Power, H.E.; Bruder, B.; Puleo, J.A.; Bergsma, E.W.J. High-resolution monitoring of wave transformation in the surf zone using a LiDAR scanner array. Coast. Eng. 2017, 128, 37–43. [Google Scholar] [CrossRef]
- Phillips, M.S.; Blenkinsopp, C.E.; Splinter, K.D.; Harley, M.D.; Turner, I.L.; Cox, R.J. Beachface and berm morphodynamics of post-storm recovery: Observations using continuous scanning Lidar. J. Geophys. Res. Earth Surf. 2018. in review. [Google Scholar]
- Brodie, K.L.; Raubenheimer, B.; Elgar, S.; Slocum, R.K.; McNinch, J.E. Lidar and pressure measurements of inner-surfzone waves and setup. J. Atmos. Ocean. Technol. 2015, 32, 1945–1959. [Google Scholar] [CrossRef]
- Almeida, L.P.; Masselink, G.; Russell, P.E.; Davidson, M.A. Observations of gravel beach dynamics during high energy wave conditions using a laser scanner. Geomorphology 2015, 228, 15–27. [Google Scholar] [CrossRef] [Green Version]
- Martins, K.; Blenkinsopp, C.E.; Zang, J. Monitoring individual wave characteristics in the inner surf with a 2-dimensional laser scanner (LiDAR). J. Sens. 2016. [Google Scholar] [CrossRef]
- Hofland, B.; Diamantidou, E.; van Steeg, P.; Meys, P. Wave runup and wave overtopping measurements using a laser scanner. Coast. Eng. 2015, 106, 20–29. [Google Scholar] [CrossRef]
- Blenkinsopp, C.E.; Mole, M.A.; Turner, I.L.; Peirson, W.L. Measurements of the time-varying free-surface profile across the swash zone obtained using an industrial LIDAR. Coast. Eng. 2010, 57, 1059–1065. [Google Scholar] [CrossRef]
- Almeida, L.P.; Masselink, G.; Russell, P.; Davidson, M.; Poate, T.; McCall, R.; Blenkinsopp, C.; Turner, I. Observations of the swash zone on a gravel beach during a storm using a laser-scanner (Lidar). J. Coast. Res. 2013, 636–641. [Google Scholar] [CrossRef]
- Bracs, M.A.; Turner, I.L.; Splinter, K.D.; Short, A.D.; Lane, C.; Davidson, M.A.; Goodwin, I.D.; Pritchard, T.; Cameron, D. Evaluation of Opportunistic Shoreline Monitoring Capability Utilizing Existing “Surfcam” Infrastructure. J. Coast. Res. 2016, 319, 542–554. [Google Scholar] [CrossRef]
- Sánchez-García, E.; Balaguer-Beser, A.; Pardo-Pascual, J.E. C-Pro: A coastal projector monitoring system using terrestrial photogrammetry with a geometric horizon constraint. ISPRS J. Photogramm. Remote Sens. 2017, 128, 255–273. [Google Scholar] [CrossRef]
- Harley, M.D.; Kinsela, M.; Sanchez-Garcia, E.; Vos, K. Shoreline change mapping using crowd-sourced smartphone images. Coast. Eng. 2018. in review. [Google Scholar]
- Luijendijk, A.; Hagenaars, G.; Ranasinghe, R.; Baart, F.; Donchyts, G.; Aarninkhof, S. The State of the World’s Beaches. Sci. Rep. 2018, 8, 1–11. [Google Scholar] [CrossRef] [PubMed]
- Mentaschi, L.; Vousdoukas, M.I.; Pekel, J.-F.; Voukouvalas, E.; Feyen, L. Global long-term observations of coastal erosion and accretion. Sci. Rep. 2018, 8, 12876. [Google Scholar] [CrossRef] [PubMed]
- Liu, Q.; Trinder, J.; Turner, I.L. Automatic super-resolution shoreline change monitoring using Landsat archival data: A case study at Narrabeen–Collaroy Beach, Australia. J. Appl. Remote Sens. 2017, 11, 016036. [Google Scholar] [CrossRef]
- Cipolletti, M.P.; Delrieux, C.A.; Perillo, G.M.E.; Piccolo, M.C. Superresolution border segmentation and measurement in remote sensing images. Comput. Geosci. 2012, 40, 87–96. [Google Scholar] [CrossRef]
- Vos, K.; Splinter, K.D.; Harley, M.D.; Simmons, J.A.; Turner, I.L. Sub-annual to multi-decadal shoreline variability from publicly available satellite imagery. Coast. Eng. 2018. in review. [Google Scholar]
- Otsu, N. OTSU paper. IEEE Trans. Syst. Man Cybern. 1979, 20, 62–66. [Google Scholar] [CrossRef]
- Sallenger, A.J.; Krabill, W.B.; Swift, R.N.; Brock, J.; List, J.H.; Hansen, M.; Holman, R.A.; Manizade, S.; Sontag, J.; Meredith, A.; et al. Evaluation of airborne topographic lidar for quantifying beach changes. J. Coast. Res. 2003, 19, 125–133. [Google Scholar]
- Middleton, J.H.; Cooke, C.G.; Kearney, E.T.; Mumford, P.J.; Mole, M.A.; Nippard, G.J.; Rizos, C.; Splinter, K.D.; Turner, I.L. Resolution and accuracy of an airborne scanning laser system for beach surveys. J. Atmos. Ocean. Technol. 2013, 30, 2452–2464. [Google Scholar] [CrossRef]
- Splinter, K.D.; Kearney, E.T.; Turner, I.L. Drivers of alongshore variable dune erosion during a storm event: Observations and modelling. Coast. Eng. 2018, 131, 31–41. [Google Scholar] [CrossRef]
- Harley, M.D.; Turner, I.L.; Kinsela, M.A.; Middleton, J.H.; Mumford, P.J.; Splinter, K.D.; Phillips, M.S.; Simmons, J.A.; Hanslow, D.J.; Short, A.D. Extreme coastal erosion enhanced by anomalous extratropical storm wave direction. Sci. Rep. 2017, 7, 6033. [Google Scholar] [CrossRef] [PubMed]
- Harley, M.D.; Turner, I.L.; Middleton, J.H.; Kinsela, M.A.; Hanslow, D.; Splinter, K.D.; Mumford, P. Observations of beach recovery in SE Australia following the June 2016 east coast low. In Proceedings of the Australasian Coasts & Ports 2017: Working with Nature, Cairns, Australia, 21–23 June 2017; p. 559. [Google Scholar]
- Turner, I.L.; Harley, M.D.; Drummond, C.D. UAVs for coastal surveying. Coast. Eng. 2016, 114, 19–24. [Google Scholar] [CrossRef]
- Westoby, M.J.; Brasington, J.; Glasser, N.F.; Hambrey, M.J.; Reynolds, J.M. “Structure-from-Motion” photogrammetry: A low-cost, effective tool for geoscience applications. Geomorphology 2012, 179, 300–314. [Google Scholar] [CrossRef] [Green Version]
- Holman, R.A.; Brodie, K.L.; Spore, N.J. Surf Zone Characterization Using a Small Quadcopter: Technical Issues and Procedures. IEEE Trans. Geosci. Remote Sens. 2017, 55, 2017–2027. [Google Scholar] [CrossRef]


| Process | Example Publications |
|---|---|
| Shoreline behavior | Alexander and Holman [28]; Turner et al. [29]; Davidson and Turner [30]; Davidson et al. [31]; Splinter et al. [32,33,34]; Pianca et al. [3] |
| Sandbar behavior | Plant et al. [35]; Van Enckevort and Ruessink [36,37]; Ruessink et al. [38]; Castelle et al. [39]; Pape et al. [40]; Splinter et al. [41]; Splinter et al. [42] |
| Nearshore morphology | Lippmann and Holman [19,20]; Price and Ruessink [43,44] |
| Nearshore bathymetry | Stockdon and Holman [45] Aarninkhof [46]; Holman et al. [27] |
| Inter-tidal topography | Holland and Holman [47]; Plant and Holman [48]; Aarninkhof et al. [49,50]; Uunk et al. [51]; Didier et al. [52] |
| Tidal inlet dynamics | Pianca et al. [53]; Harrison et al. [54] |
| Rip current location and persistence | Holman et al. [55]; Turner et al. [56]; Quartel [57] |
| Nearshore wave celerity | Holland and Holman [58]; Stockdon and Holman [45]; Plant et al. [59] |
| Nearshore wave angle | Holman and Chickadel [60] |
| Nearshore wave dissipation | Aarninkhof and Ruessink [61] |
| Nearshore longshore currents | Chickadel et al. [62] |
| Wave height from stereo pairs | de Vries et al. [63]; Shand et al. [64] |
| Swash characteristics | Stockdon et al. [65]; Power et al. [66]; Senechel et al. [67]; Palmsten and Splinter [68] |
| Dune erosion | Palmsten and Holman [69] |
© 2018 by the authors. Licensee MDPI, Basel, Switzerland. This article is an open access article distributed under the terms and conditions of the Creative Commons Attribution (CC BY) license (http://creativecommons.org/licenses/by/4.0/).
Share and Cite
Splinter, K.D.; Harley, M.D.; Turner, I.L. Remote Sensing Is Changing Our View of the Coast: Insights from 40 Years of Monitoring at Narrabeen-Collaroy, Australia. Remote Sens. 2018, 10, 1744. https://doi.org/10.3390/rs10111744
Splinter KD, Harley MD, Turner IL. Remote Sensing Is Changing Our View of the Coast: Insights from 40 Years of Monitoring at Narrabeen-Collaroy, Australia. Remote Sensing. 2018; 10(11):1744. https://doi.org/10.3390/rs10111744
Chicago/Turabian StyleSplinter, Kristen D., Mitchell D. Harley, and Ian L. Turner. 2018. "Remote Sensing Is Changing Our View of the Coast: Insights from 40 Years of Monitoring at Narrabeen-Collaroy, Australia" Remote Sensing 10, no. 11: 1744. https://doi.org/10.3390/rs10111744