Article

Influence of Aeration Rate on Uncoupled Fed Mixed Microbial Cultures for Polyhydroxybutyrate Production

by
Alessio Castagnoli
1,
Serena Falcioni
2,
Eleftherios Touloupakis
3,
Francesco Pasciucco
1,
Erika Pasciucco
1,
Alessandro Michelotti
1,
Renato Iannelli
1 and
Isabella Pecorini
1,*
1
Department of Energy, Systems, Territory and Construction Engineering (DESTEC), University of Pisa, 56122 Pisa, Italy
2
Department of Civil and Environmental Engineering, University of Florence, Via di S. Marta 3, 50139 Florence, Italy
3
Research Institute on Terrestrial Ecosystems, National Research Council, Via Madonna del Piano 10, Sesto Fiorentino, 50019 Florence, Italy
*
Author to whom correspondence should be addressed.
Sustainability 2024, 16(7), 2961; https://doi.org/10.3390/su16072961
Submission received: 11 March 2024 / Revised: 29 March 2024 / Accepted: 1 April 2024 / Published: 2 April 2024
(This article belongs to the Special Issue Solid Waste Treatment and Resource Recycle)

Abstract

:
The use of residual streams as feedstock for the production of polyhydroxyalkanoates (PHAs) is growing steadily, as it allows the valorization of waste and nutrients otherwise disposed of and the potential production of a biodegradable bioplastic. To date, the environmental and economic costs associated with this process limit its scale-up, which is why it is important to identify possible solutions and optimize the costliest steps. With this in mind, a laboratory-scale sequenced batch reactor (SBR, 5 L) was constructed to allow the selection of a mixed microbial culture able to convert volatile fatty acids (VFAs) into PHA. The reactor is fed with synthetic water containing VFAs, ammonium, phosphate, and micronutrients, typical compounds of fermented streams of certain wastes, such as cheese whey, food waste, or wastewater sludge. The biomass selected and produced by this first reactor is sent to an accumulation reactor, which is fed with a solution rich in VFAs, allowing the accumulation of PHAs. The role of aeration and its impacts on the main process parameters were analyzed. Three scenarios corresponding to different aeration rates were analyzed: 0.08, 0.16, and 0.32 vvm. The SBR was operated at an organic load rate of 600 mgCOD L−1d−1, under a dynamic feeding regime (feast–famine) and a short hydraulic retention time (HRT; 1 day). The results obtained showed that a value of 0.32 enabled better selection and better settling of the sludge. Furthermore, a potential correlation between aeration rate and VFA and NH4+ consumption rates was identified. The resulting biomass was able to accumulate up to 0.15 ± 0.02 g PHAgVSS−1.

1. Introduction

Poor resource recovery, rising waste production, and other incorrect waste management practices are putting strain on the environment and human health [1,2,3]. Plastics are one of the most serious issues, owing to their dispersion in the environment and the resulting contamination, the difficulty of the recycling process, and their derivation from fossil sources [4,5].
To identify a sustainable alternative to plastics of fossil origin, researchers have focused on the development of biodegradable plastics obtained from organic waste products, defining the concept of a circular bioeconomy [6,7]. Polyhydroxyalkanoates represent a potential substitute for standard petrochemically derived polymers [8]. In some specific formulations, they exhibit thermal and elastomeric characteristics similar to some of the most common polymers, such as polypropylene [9]. Polyhydroxyalkanoates (PHA) are a class of polyesters with the potential to be replacements. PHA is made up of 3-, 4-, 5-, and 6-hydroxycarboxylic acids and is stored as an internal carbon and energy reserve in the cytoplasm of many bacteria, including microorganisms found in activated sludge systems [10,11].
As a result, using activated sludge for PHA production is being researched as a cost-effective alternative to industrial pure culture-based fermentation techniques, which require tightly controlled and sterile conditions [12].
To obtain a mixed microbial culture (MMC) capable of producing polyhydroxyalkanoates, it is necessary to subject an active sludge to selective pressure through dynamic feast and famine conditions to maximize the amount of PHA-accumulating bacteria [13]. These conditions can be easily achieved in a sequencing batch reactor (SBR), whose operating parameters ultimately affect the length of the feast phase. For better biomass selection and improved productivity, the feast-to-famine ratio (F/F) must be lower than 0.33 [14]. To increase the amount of accumulating PHA bacteria and reduce the amount of conventional heterotrophs, the selective strategy of uncoupled feeding was defined. The dosage of volatile fatty acids (VFAs) in the feast phase and nutrients in the famine phase allows the separation of the accumulation phase from the replication phase, applying greater selective pressure to have a greater conversion efficiency from VFA to PHA [15].
Both the SBR and the accumulation reactor can be supplied with a low-cost renewable feedstock, such as fermented food waste. This allows the process to be coupled to anaerobic digestion from a biorefinery perspective [16]. Organic waste can be subjected to a two-step anaerobic digestion process [17]. VFA and hydrogen can initially be obtained through dark fermentation [18], while biogas and fertilizer destined for agriculture can be obtained through the methanogenic step [19].
In this setting, environmental and economic considerations limit the scale-up of this type of process. A major contributor in both environmental and economic terms is the energy cost, which is largely derived from the insufflation of air to maintain aerobic conditions [20,21].
For this purpose, the SBR was inoculated with activated sludge and fed an uncoupled feeding strategy with a VFA-rich solution [15]. Once a pseudo-stationary process had been defined, different airflows and their impact on the selection process taking place in the SBR process were studied, which represents the novelty of this article. Finally, for the best-case scenario, accumulation tests were performed to calculate the storage yield, referred to as the accumulation phase, and the overall total process.

2. Materials and Methods

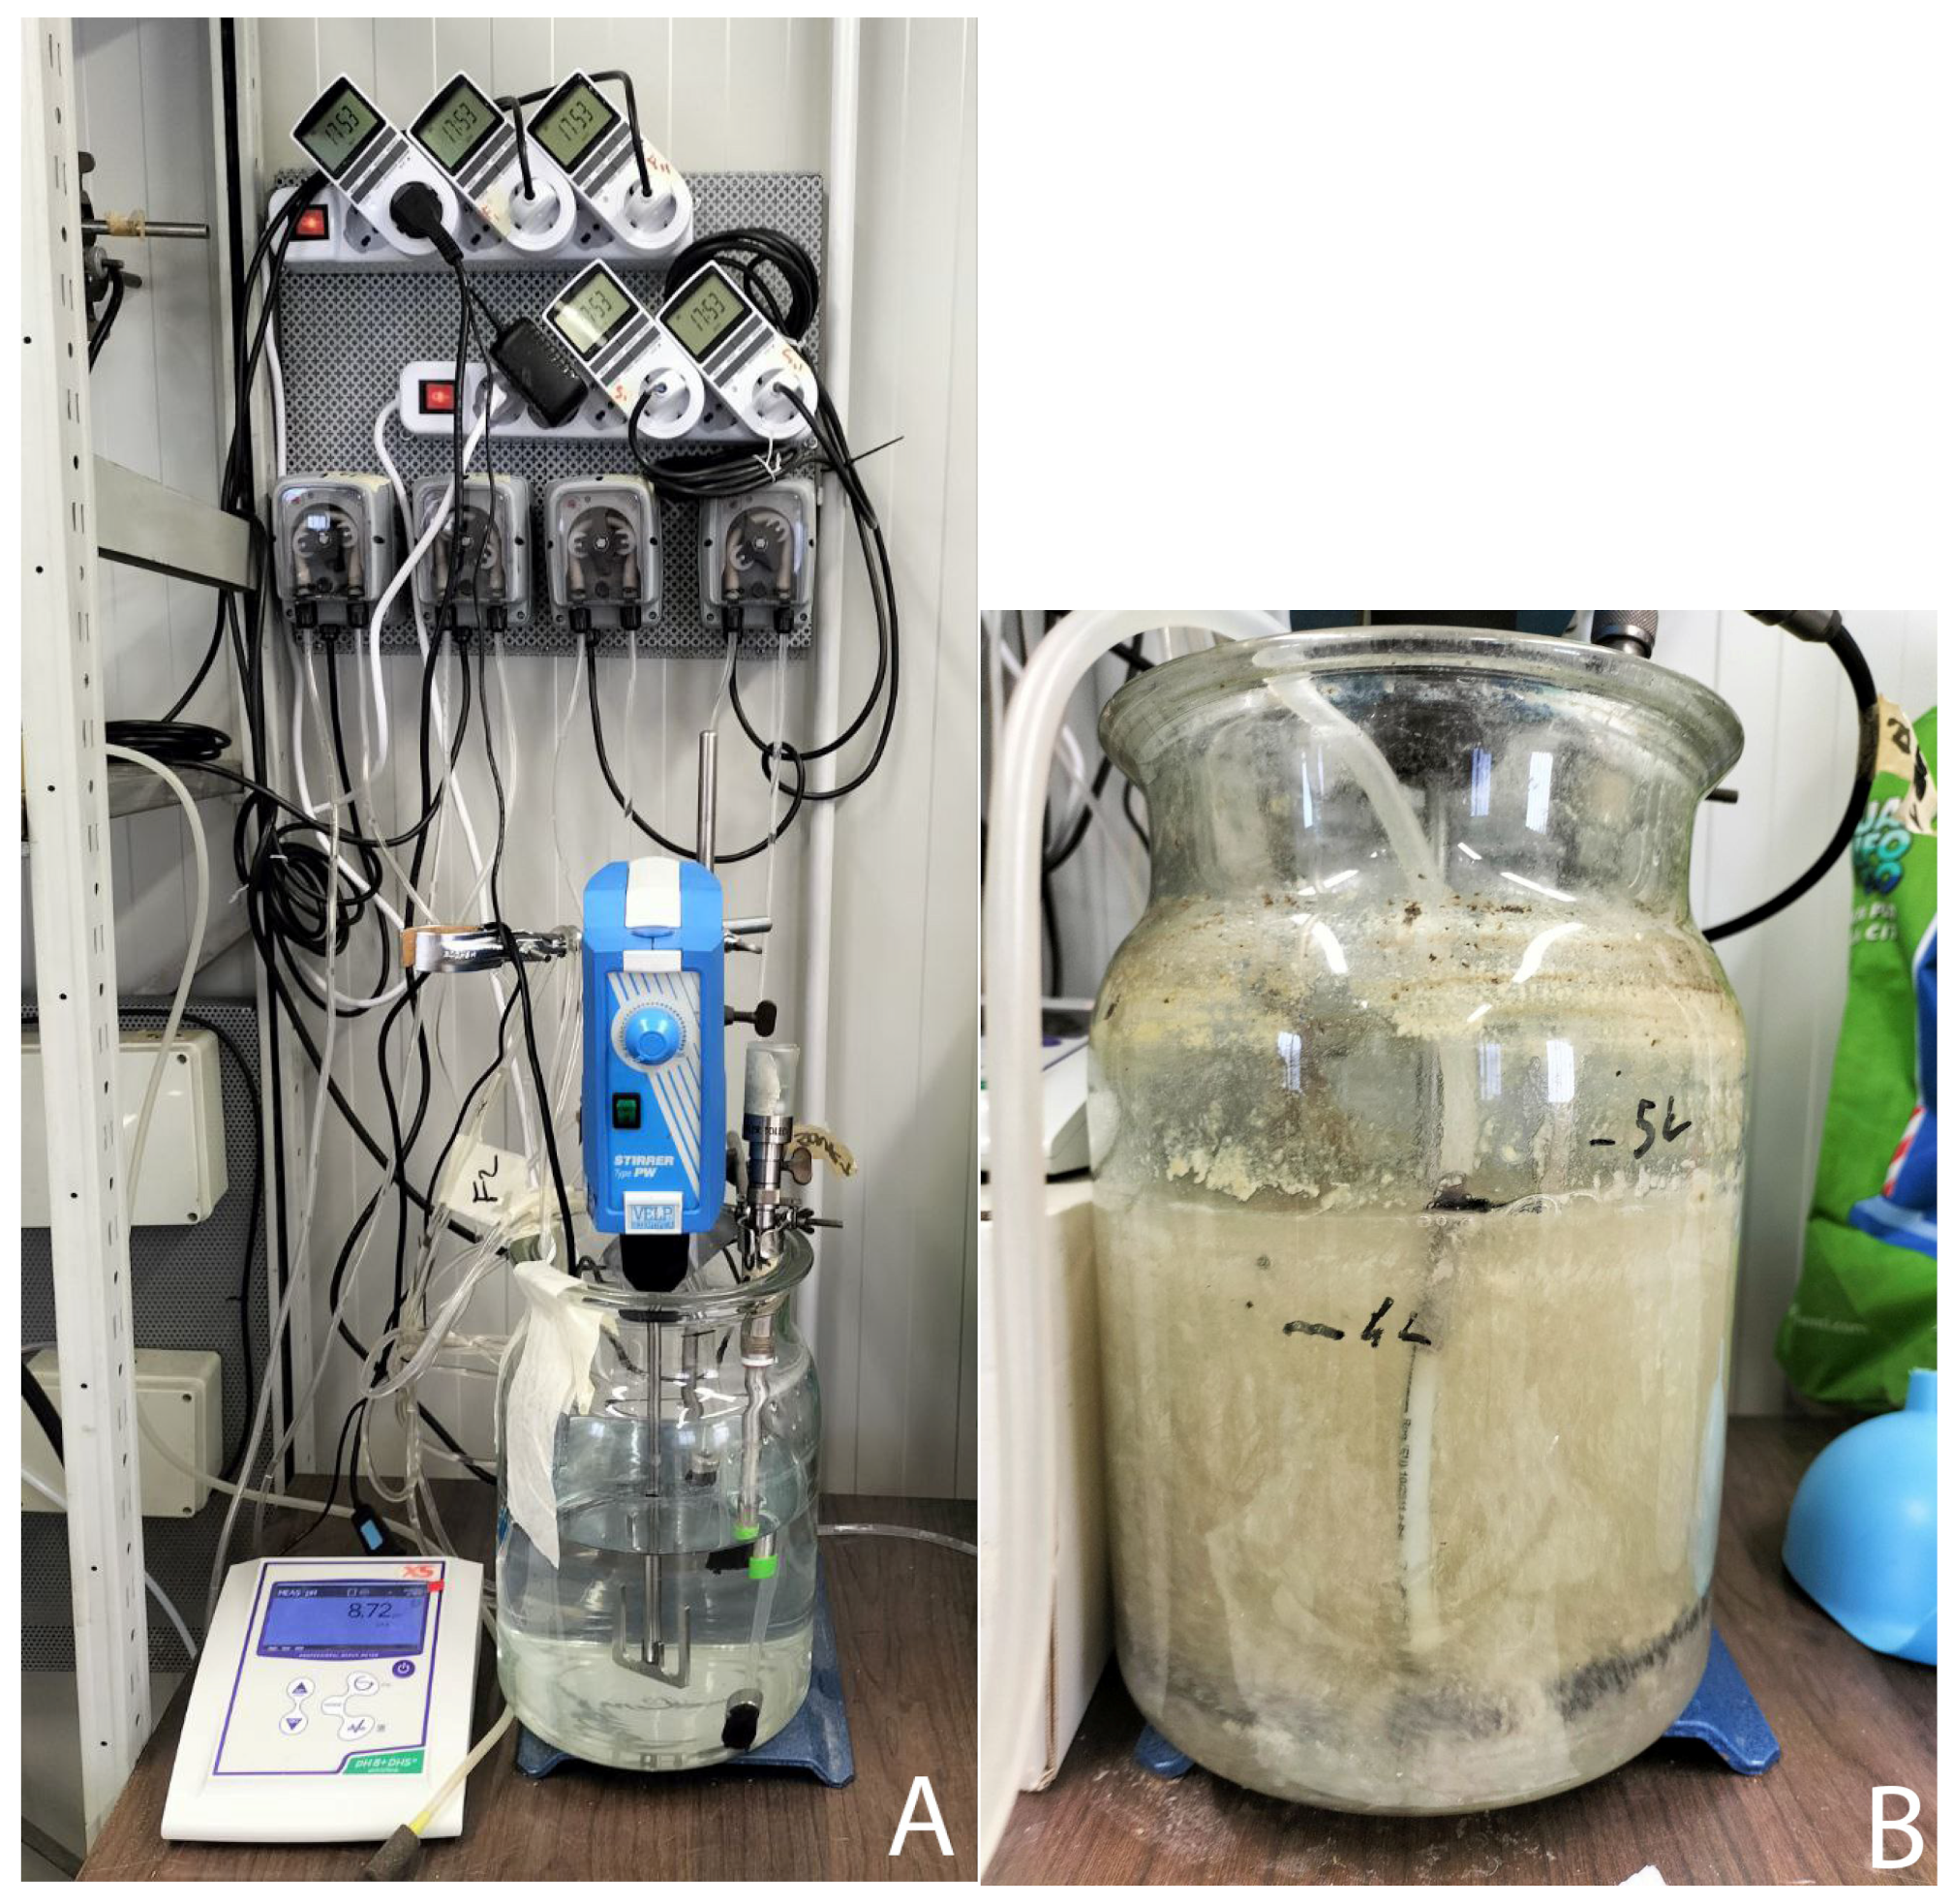
2.1. Selection and Acclimation Stage

Through a selection process with uncoupled feeding [15], a bacterial community capable of using VFA as a substrate and converting it into PHA was selected. The selection process was conducted inside a 5 L reactor, inoculated with a sample of activated sludge taken from the sedimentation tank of the ‘Viareggio’ wastewater treatment plant. The sludge was previously settled to remove the supernatant before being resuspended in a synthetic mineral medium (the composition of which is described below) [22]. Then, the sludge was aerated for one night to remove residual COD, oils, and greases, and finally characterized and inoculated. The TSS and VSS concentrations before the feeding were 1.50 gL−1 and 1.12 gL−1, respectively.
An SBR cycle lasting 12 h and consisting of the following steps was set: VFA feeding (15 min, 1.9 L), feast phase—accumulation (155 min), settling (60 min), supernatant withdrawal (12 min, 1.7 L), nutrients feeding (5 min, 0.6 L), famine phase—replication (468 min), and sludge withdrawal (5 min, 0.58 L). An organic load rate (OLR) of 600 mgCOD L−1d−1 was applied through a mixture of acetic and propionic acid in tap water (80% and 20% on a COD basis, respectively) fed in the first feeding phase. The settling phase allows to remove separately the supernatant and the biomass, applying a hydraulic retention time (HRT) of 1 day and a sludge retention time (SRT) of 4 days with a volume exchange rate (VER) of 50% [23]. The duration of the phases has been defined to reach at least a feast-to-famine ratio (F/F) ≤ 0.33.
The nutrient feeding was prepared to have C:N:P = 100:8:1.5, corresponding to the full availability of ammonium and the limiting phosphorus [24]. This choice was made because, from a plant engineering perspective, it will be easier to control phosphorus than to control ammonium [25,26]. The nutrient feeding composition was (gL−1): NH4Cl (0.327), KH2PO4 (0.071), MgSO4 * 7H2O (0.072), KCl (0.028), EDTA Tritiplex III (0.101), ZnSO4 (0.035), CaCl2 (0.013), MnSO4 (0.008), FeCl2 * 4H2O (0.005), CoCl2 * 6H2O (0.002), CuSO4 * 5H2O (0.002), (NH4)6Mo7O24 * 4H2O (0.002). Allythiourea (0.053 gL−1) was added to inhibit nitrification [22].
After being inoculated, the reactor (shown in Figure 1) was continuously stirred and aerated (except for the settling phase) according to the described conditions. The aeration was provided by an air pump connected to a flow meter to adjust the flow rate, which was then spread by an air ring. It was maintained under the same conditions for 60 cycles to reach stability in the feeding regime [27]. Next, different aeration conditions, lasting 14 cycles, were studied to investigate the impact of aeration on the selection step. The pH and the temperature were monitored but not controlled.
The dissolved oxygen (DO) was measured continuously during each cycle using a DO probe (Mettler Toledo, InPro6000, Optical O2 Sensors, Milan, Italy). An automatic control and data acquisition system (LabView, National Instruments Corporation, Austin, TX, USA) gathered and processed the probe’s signals [28]. The DO concentration declined to a low and nearly constant value throughout feeding; the subsequent increase in DO concentration indicated that the substrate had been depleted. This point also marked the end of the feast phase and the beginning of the famine phase, and it was used to compute the feast-famine ratio for each cycle [29,30].
Three different scenarios have been studied, corresponding to three different aeration rates: 0.08, 0.16, and 0.32 vvm. Each scenario was carried out for 14 cycles.
On working days, end-of-famine sludge was manually sampled and analyzed in COD, N-NH4+, and P- PO43− concentrations. In the middle of each week, a complete cycle analysis was conducted, studying the same concentration throughout the cycle, the TSS and VSS of biomass after 6 hours of the cycle, and the TSS and VSS of the supernatant discharged at the end of the feast. For the last condition studied, the polyhydroxybutyrate (PHB) analysis of the whole cycle was conducted to define the PHB accumulation and its consumption in the replication of the bacteria occurring in the famine phase.

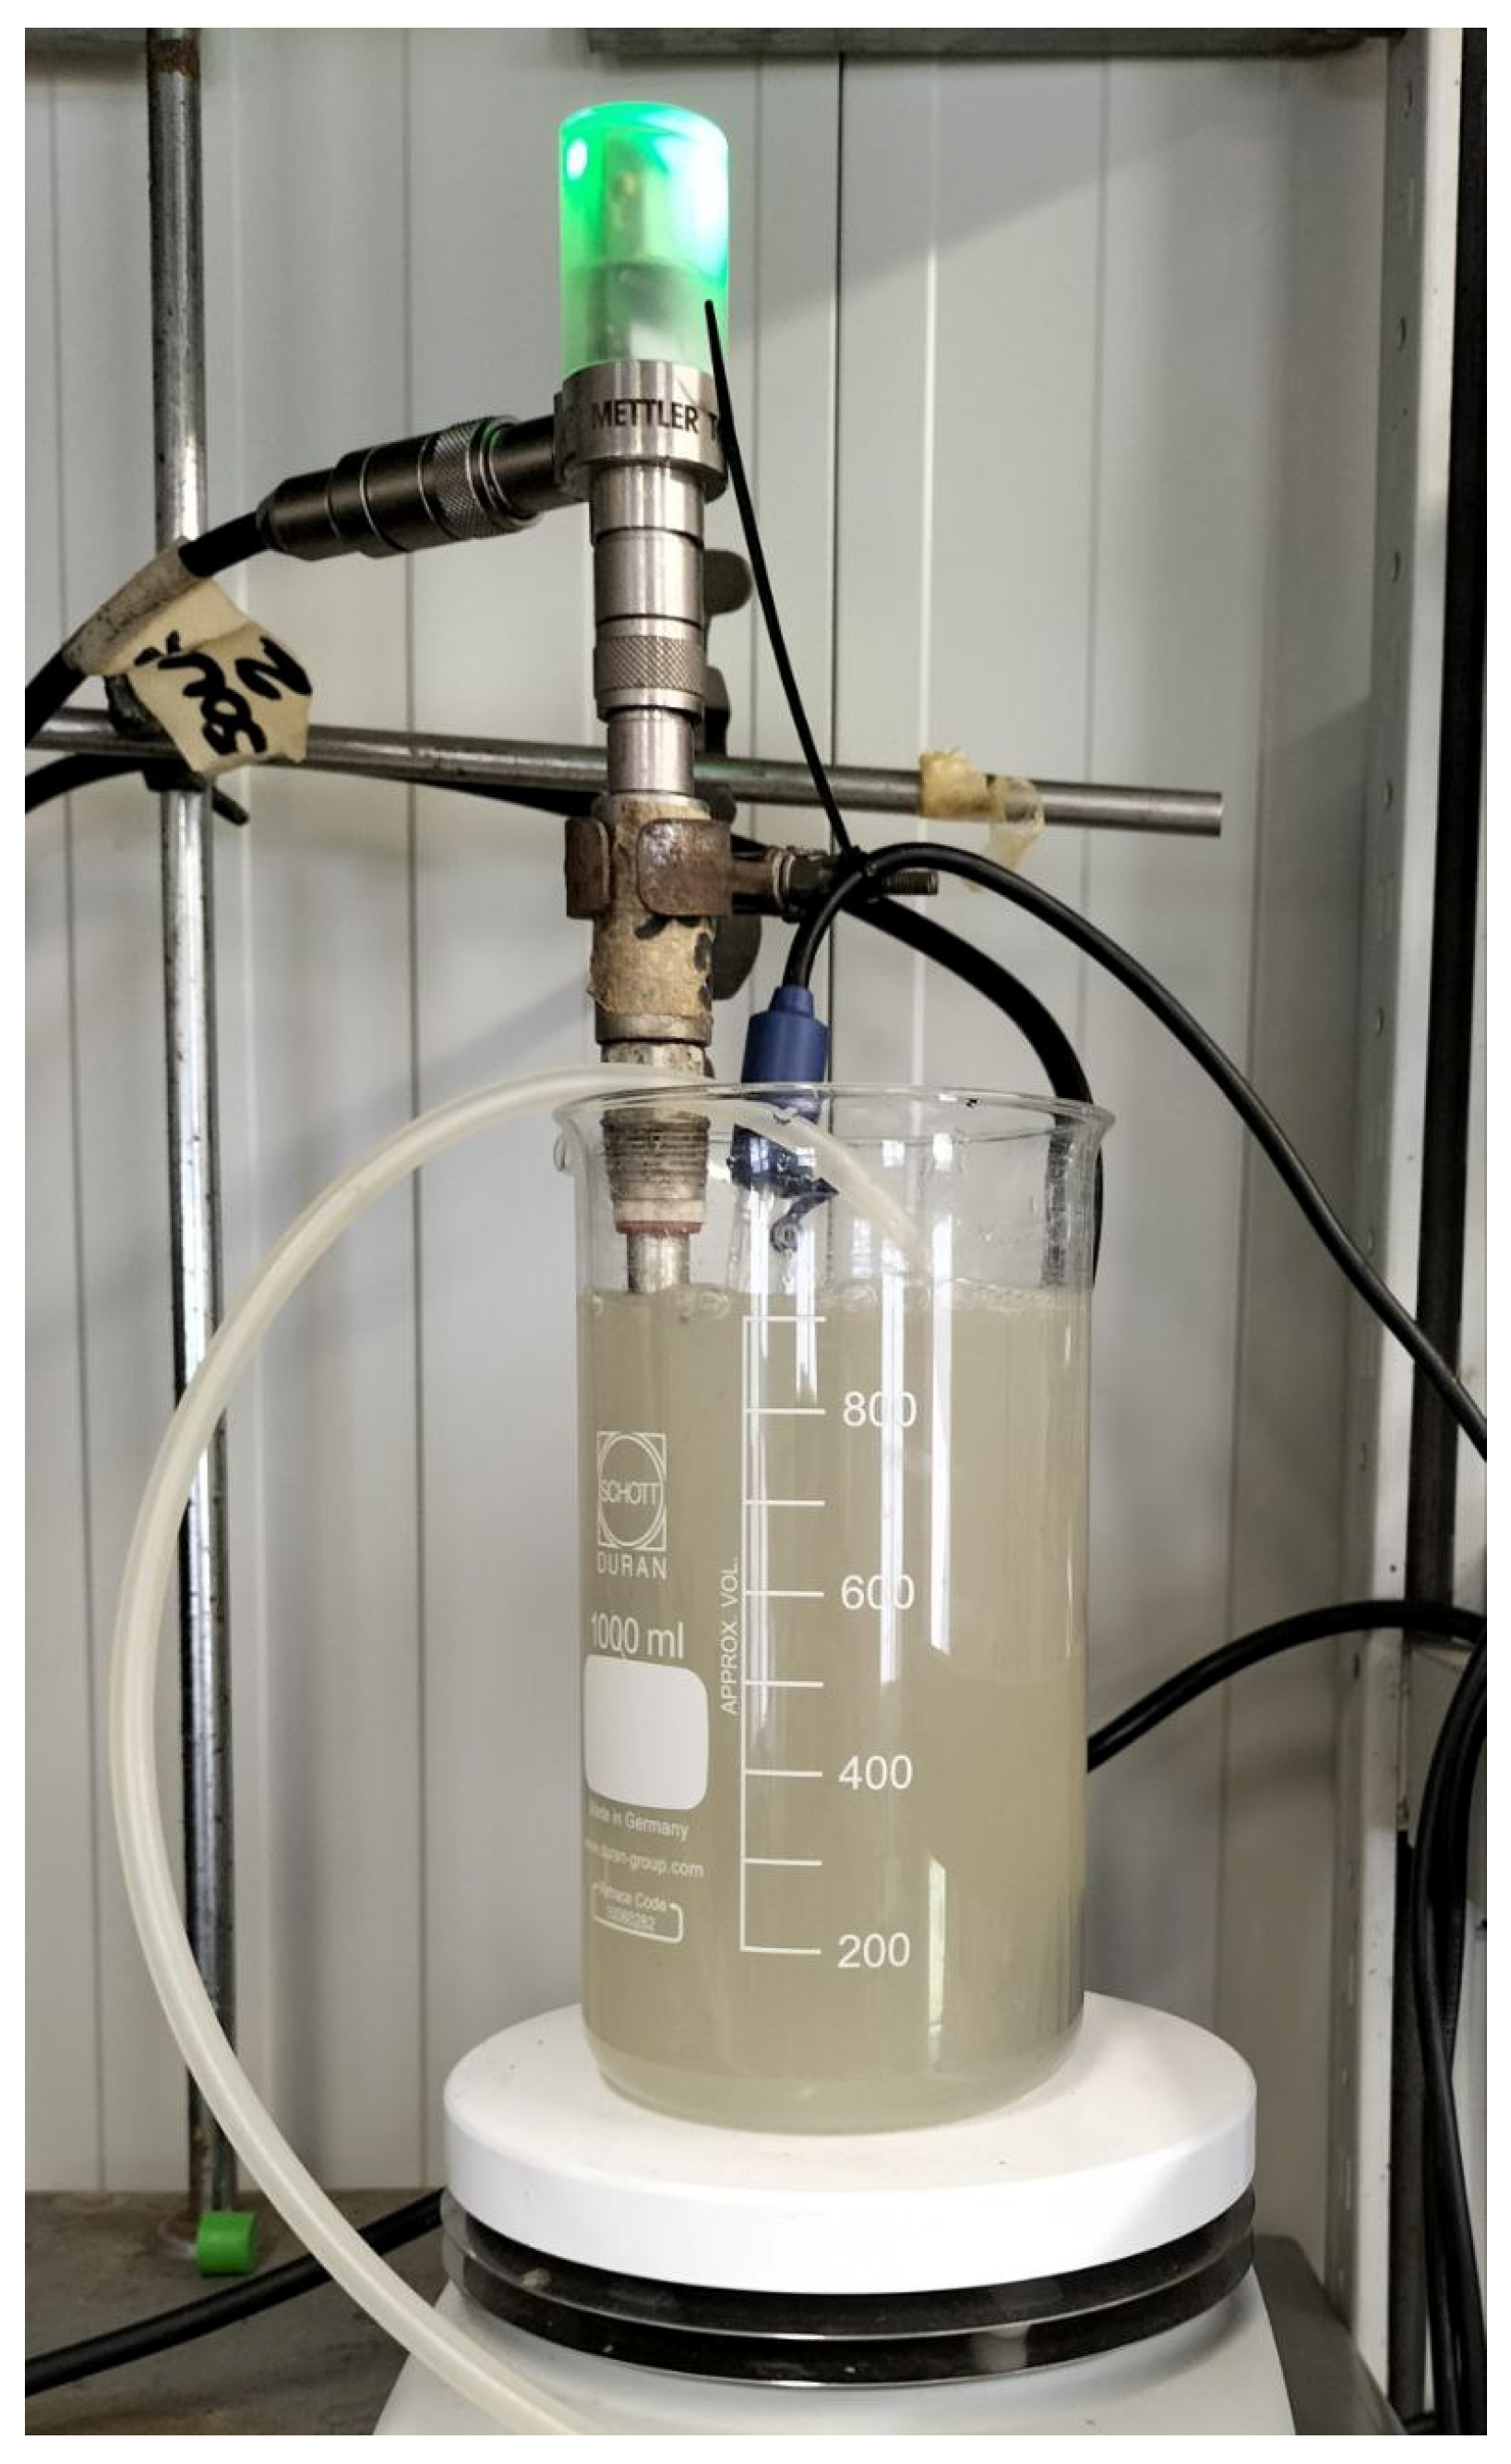
2.2. Batch Accumulation Test

At the end of the third scenario, batch accumulation tests were conducted with biomass sampled for the SBR reactor. The test, conducted in triplicate, took place on three consecutive days to minimize the variability of the selected biomass. All batch tests were performed with multiple and instantaneous spikes of the substrate to obtain a feast phase longer than in SBR to determine the maximum specific PHA storage rates, PHA storage yield, and the maximum polymer content achievable in the biomass. The biomass was withdrawn from the SBR at the end of the famine phase and placed in a smaller reactor (working volume of 600 mL, temperature and pH monitored but not controlled), as shown in Figure 2. The biomass was fed with the same mixture of VFA as in the SBR, but at a higher concentration to have the same concentration in the reactor (300 mgCODL−1) with a smaller volume of feeding solution. The spiking was manually conducted following the DO trend (continuously monitored): the first spike was performed at the beginning of the test, and the operation was then repeated at each DO rising over 5 mgL−1 until the spike caused no further change in DO level [16].
The feeding does not contain nitrogen and phosphorous to prevent cell growth and increase the achievable polymer content. Thus, the only nitrogen available at the beginning of the tests was the residual ammonia content in the mixed liquid withdrawn from the SBR.
At the start and the end of each test, the biomass was sampled to determine TSS, VSS, COD, N-NH4+, P- PO43− and PHB. Before (at least 20 min) and during the test, the batch reactor was maintained under air bubbling (at a DO concentration in the range of 4–6 mgL−1) and completely stirred.
The test allowed us to define the accumulation and process efficiencies and the percentage of final PHB within the biomass.

2.3. Analytical Methods

The substrates (acetate and propionate) and the nutrients (ammonium and phosphate) were measured on filtered samples (0.45 µm porosity). VFAs were measured on a COD basis through the adaptation of USEPA 410.4 [31]. Ammonium ions were measured by the adaptation of the Nessler spectrophotometric method [32], and phosphate ions were measured by the adaptation of the ascorbic acid method [33]. A Hanna spectrophotometer (HI 83099, Hannah Instruments Italy Srl, Padua, Italy) was used for each analysis.
VSS and TSS were determined for difference through filtration of a specific volume (20 mL for the biomass, 50 mL for the supernatant) with a glass fiber filter of 0.45 µm porosity and submitted to 24 h in the oven at 105 °C and 4 h at 550 °C in the muffle [34].
For the three identified scenarios, COD, NH4+, and PO43− at the end of the famine phase were analyzed during the respective weeks. In addition, DO was continuously monitored. For the third scenario, PHB analysis was also performed. Finally, the complete characterization of the ninth cycle, i.e., the first one following the complete biomass change (SRT = 4 d), was performed. During the cycle analysis, COD, NH4+, and PO43− were monitored at defined intervals, as were TSS and VSS, both of the reactor and supernatants.
For PHB determination, a total of 30 mL of the biomass was centrifuged at 14,000 rpm for 8 min, and the supernatant was removed. PHB was determined in the form of crotonic acid by HPLC [35]. Three mL of the solid phase was diluted to 30 mL with distilled water, and 5.0 mL of this was destined for acid digestion to crotonic acid by boiling it in 1.0 mL of pure sulfuric acid for 30 min. This procedure transforms PHB into crotonic acid, which HPLC measures. The latter was carried out with the help of an HPLC-Thermo Finnigan-Spectra System 6000LP (Thermo Finnigan, San Jose, CA, USA) outfitted with a Synergi-Hydro-RP C-18 column (250 4.6 mm i.d.) (Phenomenex International, Torrance, CA, USA) and an ultraviolet detector (214 nm). Using a flow rate of 1.0 mL/min, a mobile phase consisting of 15% (v/v) acetonitrile and 0.1% (v/v) H3PO4 in an aqueous solution was used [36]. For the calibration curve, pure PHB (Biomer, Krailling, Germany) was converted to crotonic acid. All analyses were performed in triplicate.

2.4. Calculations

The selection process was evaluated through the calculation of VFA and nutrient (NH4+ and PO43−) intake rates (IRs). The equation used is the following:
IR = (P1 × t1)/(P2 × t2),
which expresses the intake rate of a parameter (P) in a specific interval of time (i.e., from minute 20 to 50). The average intake rate is an arithmetic average of the single ratios calculated in the feast period (VFA) and during the famine period (NH4+ and PO43−).
For the evaluation of the process, the PHB accumulated (ΔPHB), expressed in mgL−1, the VFA consumed (ΔS), the storage yield (YS), and the process yield (YP), calculated according to Equations (1) and (3), were evaluated [37].
YS = ΔPHB/ΔS,
where
ΔS = Ss − Sr,
YP = ΔPHB/(ΔS+0.5 × OLR),
Storage yield (Ys) represents the conversion efficiency of VFAs to PHB, calculated as the ratio of accumulated PHB (ΔPHB) to consumed substrate (ΔS), in terms of mass. The substrate consumed is calculated by the difference between the substrate supplied, calculated stoichiometrically for the preparation of the feeding solution (Ss), and the residual substrate present at the end of the accumulation test (Sr). Finally, the process yield is calculated as the ratio of the PHB accumulated at the end of the accumulation test to the sum of VFA dosed between the accumulation and one selection cycle (0.5 OLR).

3. Results and Discussions

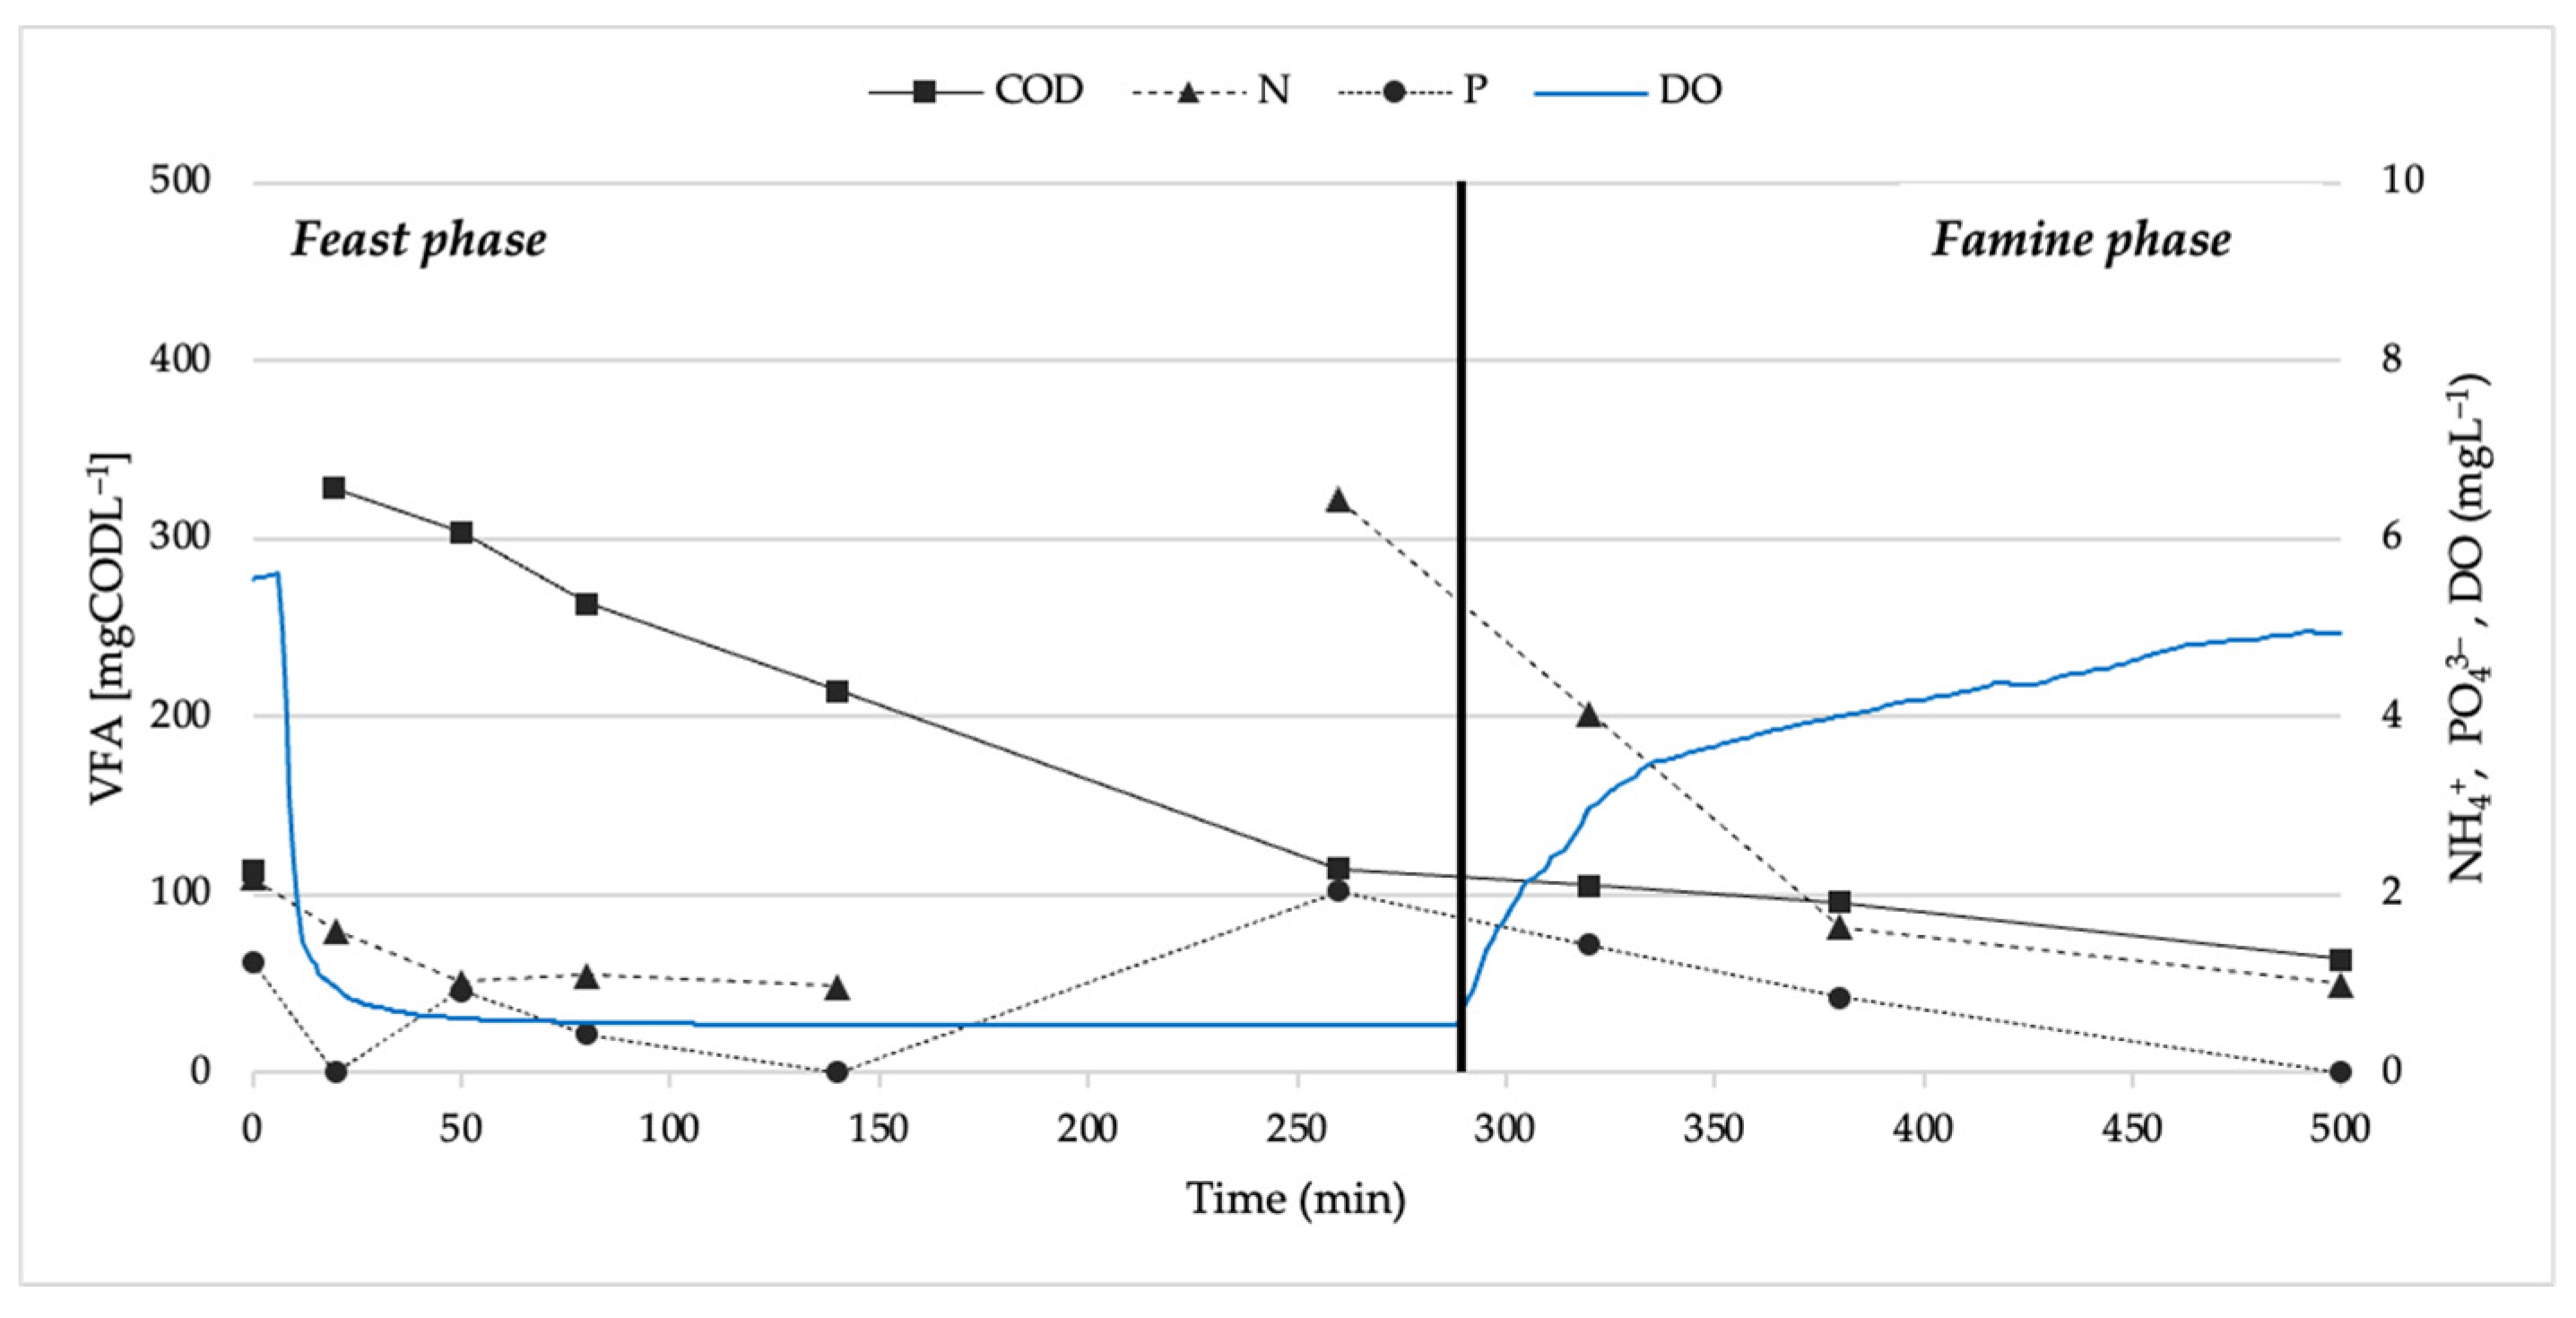
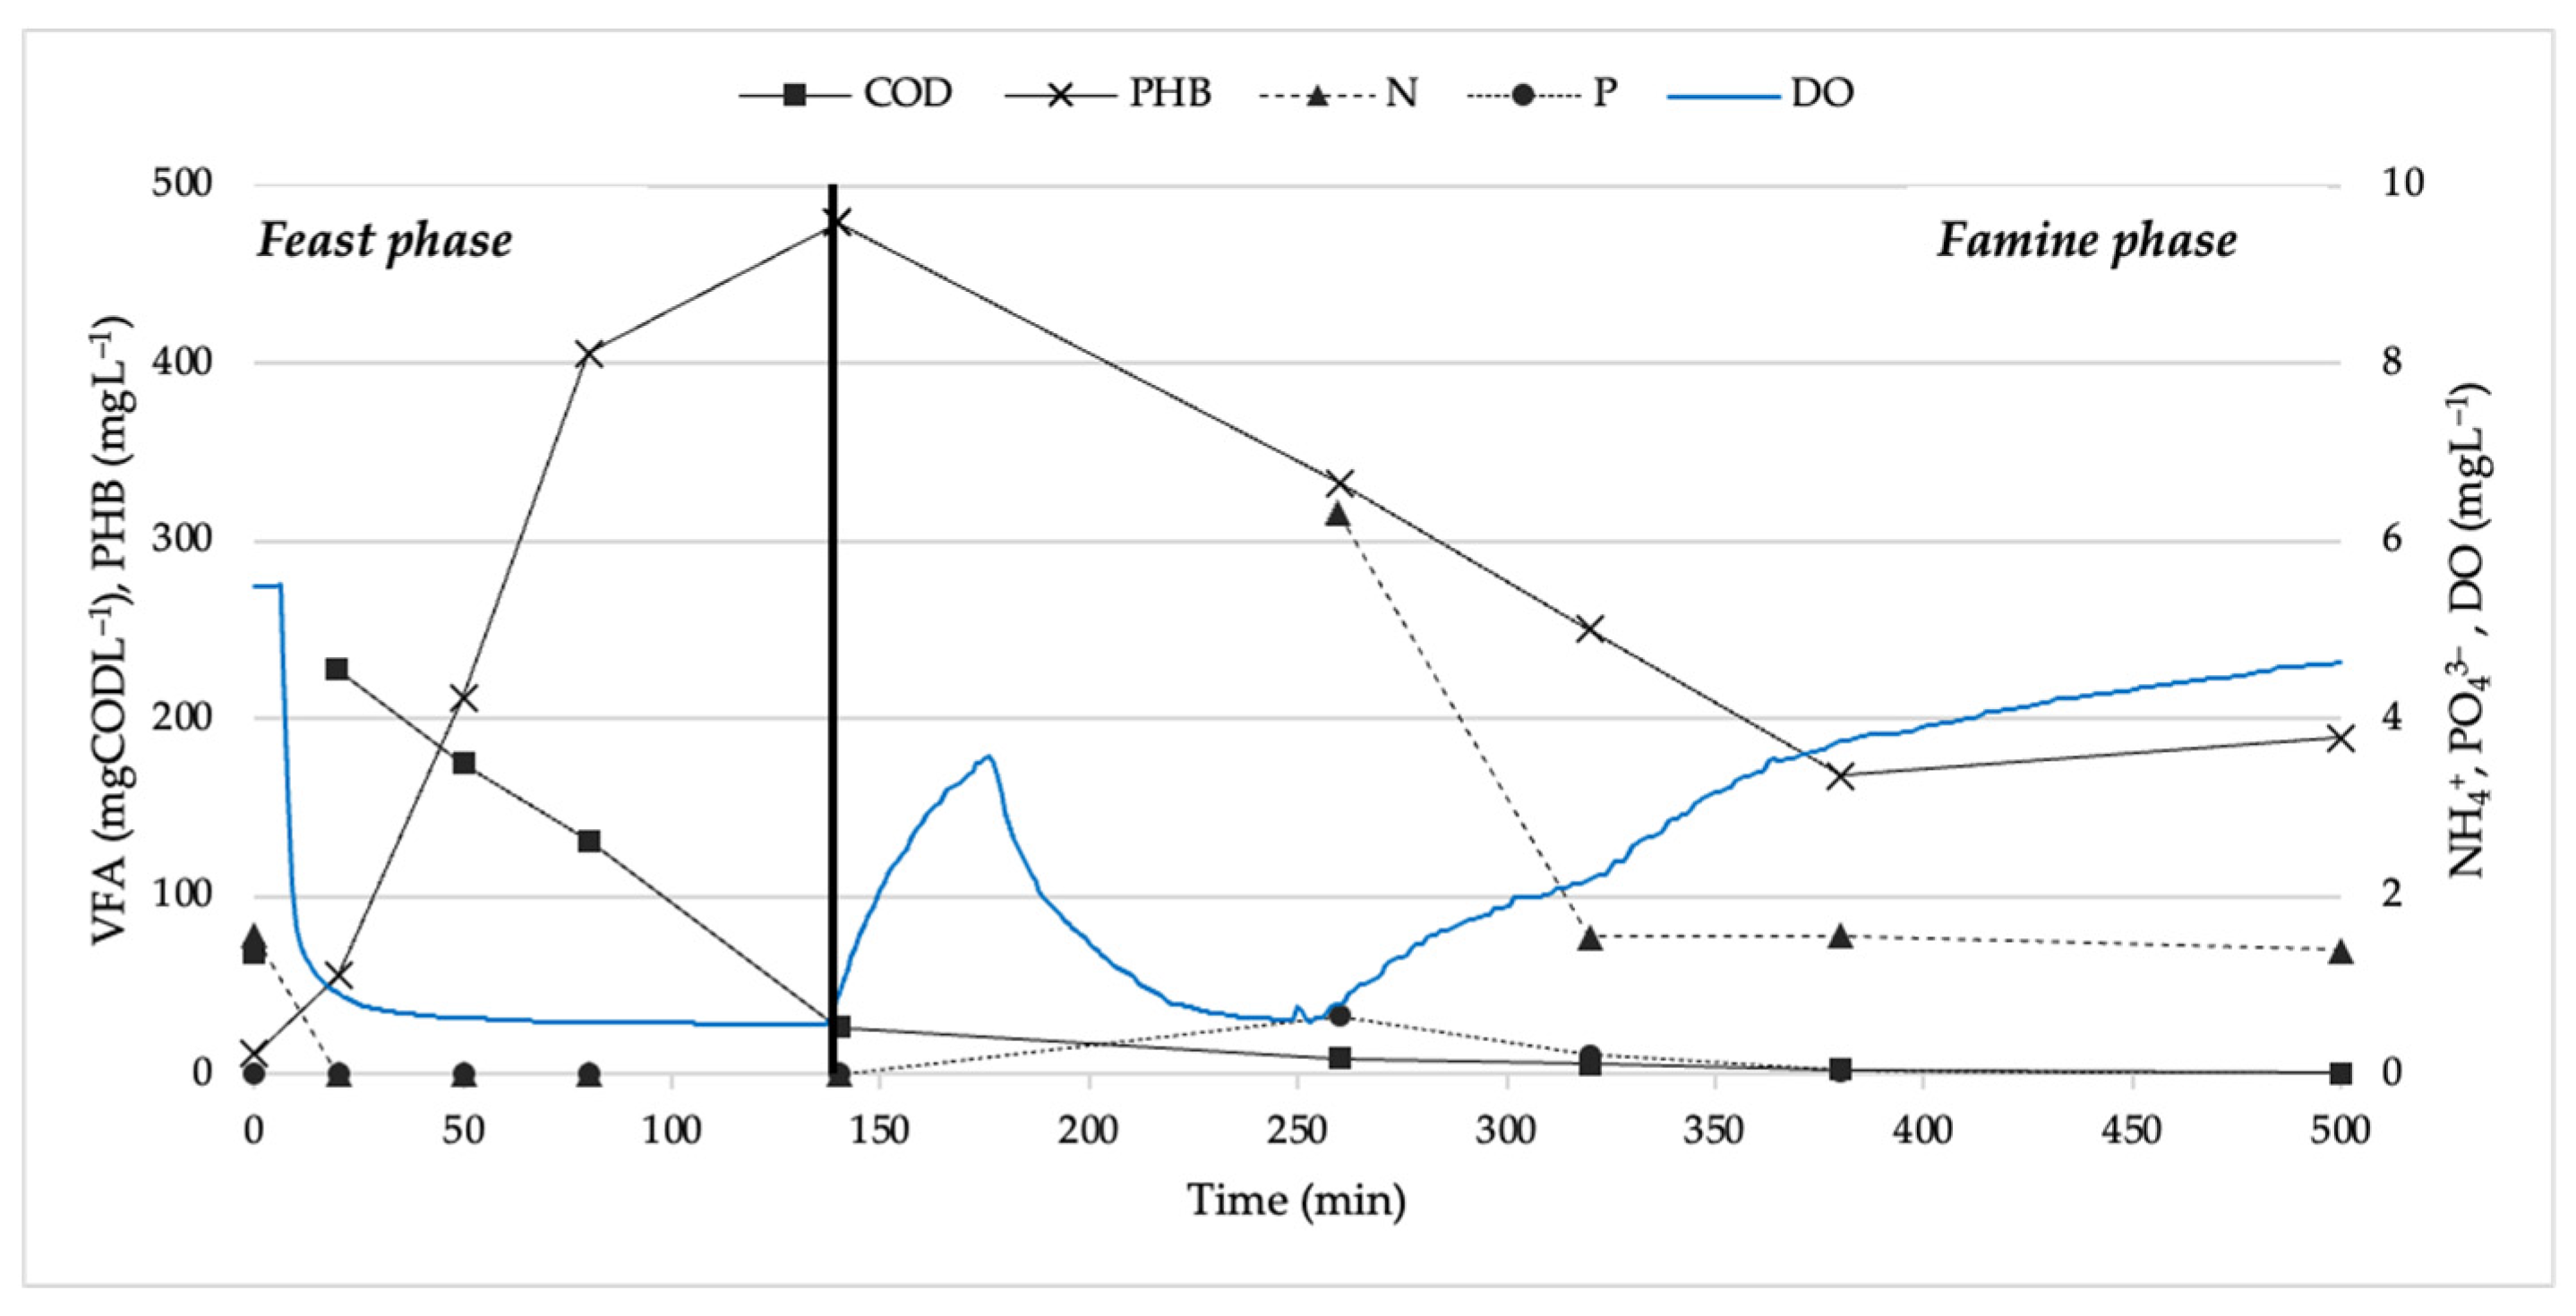
3.1. First Scenario SBR Performance

An aeration rate of 0.08 vvm resulted in a feast length of about 350 min and a consequential feast-to-famine ratio of F/F ≈ 0.82. Table 1 shows the target parameters measured at the end of the famine phase and the related consumption. In these conditions, part of the VFAs are not consumed, probably due to the presence of recalcitrant compounds (EDTA) and part due to the oxidation of other molecules [38]. Even ammonia and phosphate are not completely degraded, indicating that microbial replication is not complete in the famine phase.
The biomass was characterized by TSS = 0.69 ± 0.01 gL−1 and VSS = 0.39 ± 0.01 gL−1, while the supernatants were 0.21 ± 0.01 gL−1 and 0.19 ± 0.01 gL−1, respectively.
Since the feeding is free of colloidal substances, we can assume that the VSS indicates exclusively the microbial component. The results obtained indicate a percentage of volatiles of 58% in the sludge and 92% in the supernatants. The supernatants, which are characterized by a lower concentration, therefore have a greater microbial component, which is probably due to the short starvation period and therefore to a non-optimal selection, with a considerable amount of filamentous bacteria in suspension.
The cycle analysis depicted in Figure 3 shows a slow COD trend, initially higher than 300 mgCODL−1, due to the presence of further molecular complexes as highlighted in the previous paragraph. When the COD drops below 100 mgL−1, there is a recovery of the DO, the starting point of the famine phase. In this case, the feast and the replication phase are partially overlapped, with ammonium and phosphate not reaching the typical values of the end of the feast in the analytical time considered.

3.2. Second Scenario SBR Performance

An aeration rate of 0.16 vvm resulted in a feast length of about 280 min and a consequential feast-to-famine ratio of F/F ≈ 0.67. Table 2 shows the values of the target parameters measured at the end of the famine phase and the related consumption.
Even in this scenario, at the end of the famine period, a residue of COD is identified, completely similar to the previous case, and a residue of nutrients, which in this case undergo a greater but still incomplete degradation.
The biomass was characterized by TSS = 0.75 ± 0.03 gL−1 and VSS = 0.56 ± 0.04 gL−1, while the supernatants were 0.16 ± 0.00 gL−1 and 0.14 ± 0.00 gL−1, respectively.
The results obtained indicate a percentage of volatiles of 74% in the biomass and 89% in the supernatants. Even for this characterization, the results are similar to the previous scenario, indicating that the biomass has probably not undergone any particular changes. The supernatants show a lower concentration, indicating a reduction of filamentous bacteria in the overall sludge.
As illustrated in Figure 4, the VFA reduction follows a similar trend as in the previous scenario, with a constant reduction during the feast phase and steady concentration during the first 100 min of the famine phase. Even in this case, the DO starts to increase when the COD is about 100 mgL−1. In contrast to the previous scenario, the nutrient concentration decreases faster, indicating a higher replication of bacteria, probably due to a higher biomass concentration.

3.3. Third Scenario SBR Performance

An aeration rate of 0.08 vvm resulted in a feast length of about 110 min and a consequential feast-to-famine ratio of F/F ≈ 0.16. Table 3 shows the target parameters measured at the end of the famine phase and the related consumption.
In this scenario, there is also a residue of non-degraded COD that is quantitatively similar to the two previous cases. In this case, we instead identify almost total consumption of phosphorus, which turns out to be limiting and therefore is an indicator of complete microbial replication.
An ammonia residue remains, the elimination of which would require a slightly higher dosage of phosphate or a reduction in the incoming ammonium.
The biomass was characterized by TSS = 0.99 ± 0.10 gL−1 and VSS = 0.48 ± 0.03 gL−1, while the supernatants were 0.06 ± 0.00 gL−1 and 0.04 ± 0.00 gL−1, respectively.
The results obtained indicate a percentage of volatiles of 48% in the sludge and 72% in the supernatants. This indicates a reduction in the biomass fraction in both the reactor and the supernatant, which can be attributed to better selection due to a lower F/F. The solids concentration in the supernatant is near zero, indicating good settling properties of the biomass and a poor presence of filamentous bacteria.
Figure 5 shows a rapid degradation of VFA, which occurred before nutrient dosing, with a consequent shorter feast and a correct uptake of N and P during the starvation phase. Ammonium and phosphorus are consumed rapidly, as confirmed by the DO graph, which shows a rapid decrease from minutes 175 and 250, then a progressive rise. Once all the phosphate is consumed, the ammonium remains constant and shows the typical values found in end-of-mine analyses.
For this scenario, the PHB curve was also constructed, showing a very rapid increase in the early phases of the feast, with a peak reached during the end of the feast and a progressive degradation, almost constant, during the famine phase, which is used for replication of PHA-accumulating bacteria. The consumption of PHB continues even after the consumption of ammonium, indicating that the NH4+ intake and the consumption of PHB for replication probably do not follow the same reaction rates.

3.4. Scenarios Comparison and Overall Discussion

By calculating the VFA, nitrogen, and phosphorous removal rates through the equations (X), different trends are identified for the scenarios. The first and second scenarios show a VFA removal rate of 51.3 and 59.0 mg/h, while on the other hand, for the third scenario, there is a value of 99 mg/h. Thus, oxygen is the limiting factor in such cases, preventing the proper consumption of substrate. A deeper analysis of these two scenarios shows that the consumption rates in scenario 1 are constant, while for scenario 2 there is a rate of 48 mg/h in the first half-hour and 80 mg/h in the second half-hour. This could be due to the presence at first of the phosphate ion, which is subsequently consumed and then found again at a later stage, probably due to some bacteria capable of accumulating it and subsequently releasing it. In fact, in the third scenario, we note that no nutrients are present in the feast phase, a consequence of proper oxygenation and proper consumption in the famine phase. This allowed a higher rate of carbon consumption, optimizing the separation between the accumulation phase and the replication phase.
The famine phase, on the other hand, is characterized by differences related to the mode of nutrient intake. Analyzing the period when replication occurs, there is a nitrogen rate of 1.6 for scenario 1, 2.4 for scenario 2, and 4.8 for scenario 3. For phosphate, there is a different trend. The first scenario is characterized by an intake of 0.3 mg/h, while in the second scenario, the intake is significantly higher, amounting to 0.8 mg/h. Especially for the final interval, we show a higher intake equal to 0.9 mg/h. Finally, for the third scenario, there is an intake of 0.4 mg/h. While for ammonium, the uptake seems to be related to airflow, which is characterized by potential proportionality, for phosphate, this seems not to be the case. This phenomenon could be justified by better selection for the third scenario, characterized by a lower F/F ratio and lower VSS concentration. The lack of overlap between the accumulation phase and the replication phase disfavors conventional heterotrophs, allowing an increase in the PHA-accumulating fraction that probably has lower P requirements. A lower need for phosphorus by PHA-accumulating bacteria confirms the possibility of P-limiting strategies to improve selection, which is especially useful for streams where ammonium is in high concentrations and is difficult to remove, as in the case of digestates.
Applying equation X defines the accumulation and consumption rates that characterize the feast and famine phases, respectively. While PHB accumulation has an increasing rate, it is clear that PHB degradation presents an almost constant trend, with an average consumption of 79.4 mg/h of PHB. This linearity is in line with ammonium intake, reinforcing the theory that phosphorus is accumulated initially for later use, while ammonium intake occurs only during actual replication.
Although the number of observations was limited, the results identified prompted the investigation of the potential correlation between airflow and VFA, NH4+, and PO43− uptake rates, as illustrated in Figure 6.
As shown in the figure, there is a potential linear correlation between airflow and COD uptake and nitrogen uptake, with an R2 value > 0.95. In contrast, for phosphate, no correlation is present (R2 = 0.02). Given that the dosage for each cycle of PO43− is 2.1 mgL−1 and the first value is 0.66, it follows that in the first 20 min following the nutrient dosage, there was a PO43− uptake of 1.5 mgL−1. This would indicate a rate of 4.5 mgL−1 in this first interval, indicating a potential nonlinear correlation. These results need focused investigations aimed at investigating nutrient trends in the first moments after feeding to identify any nonlinear consumption rates and fully understand any correlation with oxygen availability.
The gradual increase in airflow allowed a reduction in the duration of microaerophilic conditions in the feast phase. This affected the quality of the flocs, providing the sludge with greater settleability, as evidenced by the significantly lower supernatant values in the case of the third scenario. This correlation between aeration and floc formation and size is known in the literature, although a clear correlation has not been identified [39]. Further investigations could be carried out to identify a potential correlation between airflow and the Sludge Volume Index (SVI) to develop more efficient management strategies for uncoupled feeding systems.

3.5. Accumulation Test

Table 4 reports the characterization of the biomass before and after the accumulation test. The initial PHB concentration was 0.
At the first spike, the VFAs are consumed rapidly, with times slightly shorter than those of the selection phase. With the progressive accumulation of PHB, the degradation of the remaining VFAs also slowed down, a trend that was maintained in all subsequent spikes (Figure 7, dotted arrow). The last spike was performed shortly after reaching the peak indicated by the undashed arrow, which was not followed by a decrease in COD. Before this moment, a sample was taken for analysis, and the test was continued for the scheduled 12 hours to verify the assumption.
The selected biomass demonstrated the ability to accumulate about three times the VFA provided at the selection stage (300 mgCODL−1), as demonstrated by the characterization in terms of ΔS and PHB concentration. The VSS concentration increased significantly, resulting in a PHB concentration in volatile solids of 0.15 ± 0.02 gPHBgVSS−1. According to Equations (2) and (4), the storage and process yields were calculated, with the resulting Ys = 1.01 ± 0.18 and Yp = 0.80 ± 0.11. At the end of the test, ammonium analysis was also performed, which confirmed the complete consumption of the initial residue, which was equal to what is reported in Table 3.
The results obtained confirmed that oxygenation is a key parameter of the process, essential not only for an adequate feast period but also for improved biomass settling properties, as indicated by the supernatant analyses. Under the conditions studied, with an aeration rate of 0.32 vvm, the accumulation phase finishes in less than 120 min and replication after about 400 min. On a 12-h cycle, about 300 min of famine does not require the strongly aerobic conditions for accumulation and replication processes [40]. Therefore, microaeration or an anoxic phase could be applied in this interval to allow lower energy costs [41].

4. Conclusions

This study investigated the influence of the aeration rate on the selection process of PHA-accumulating bacteria from activated sludge by exploiting an uncoupled feeding strategy in an SBR reactor. Once the biomass was adapted to the feeding regime, three separate scenarios with increasing aeration rates (0.08, 0.16, and 0.16 vvm) were analyzed. Each of these scenarios was continuously characterized through DO monitoring, COD, N and P analysis during the end-of-famine, and full-cycle analysis, with TSS and VSS correlated with the cycle investigated.
The third scenario, for which a better selection was found, evaluated the role of PHBs during the cycle, taking PHB concentration as a reference. The results identified that, in this case, an aeration rate of 0.32 vvm for an OLR of 600 mgCODL−1d−1 ensures adequate selection, thus allowing a correct size parameter to be defined in the design of experimental tasks. A potential correlation between VFA aeration rate and NH4+ intake is also identified, while no correlation is identified for phosphate, probably due to a non-linear intake.
Future developments may investigate larger OLRs to test the correlation between aeration rate, OLR, and F/F and different feedings and the variation of nutrients and substrate intakes in different conditions.

Author Contributions

Conceptualization, A.C., S.F. and I.P.; methodology, A.C., A.M. and S.F.; validation, A.C. and I.P.; formal analysis, A.C. and S.F.; investigation, A.C., E.T., F.P. and E.P.; resources, I.P.; data curation, A.C.; writing—original draft preparation, A.C.; writing—review and editing, A.C., S.F., E.T. and I.P.; visualization, A.C.; supervision, I.P.; project administration, I.P. and E.T.; funding acquisition, I.P and R.I. All authors have read and agreed to the published version of the manuscript.

Funding

This research is supported by the European Union’s Horizon Europe—the Framework Programme for Research and Innovation [grant number 101093150], project LIBRA (Light Based Multisensing Device for Screening of Pathogens and Nutrients in Bioreactors).

Institutional Review Board Statement

Not applicable.

Informed Consent Statement

Not applicable.

Data Availability Statement

Data are contained within the article.

Acknowledgments

This research is supported by the Ministry of University and Research (MUR) as part of the PON 2014–2020 “Research and Innovation” resources—Green/Innovation Action—DM MUR 1061/2022.

Conflicts of Interest

The authors declare no conflicts of interest.

References

  1. Castagnoli, A.; Pasciucco, F.; Iannelli, R.; Meoni, C.; Pecorini, E.I. Keu Contamination in Tuscany: The Life Cycle Assessment of Remediation Project as a Decision Support Tool for Local Administration. Sustainability 2022, 14, 14828. [Google Scholar] [CrossRef]
  2. Pörtner, H.O.; Roberts, D.C.; Adams, H.; Adler, C.; Aldunce, P.; Ali, E.; Begum, R.A.; Betts, R.; Kerr, R.B.; Biesbroek, R.; et al. Climate Change 2022: Impacts, Adaptation, and Vulnerability; Contribution of Working Group II to the Sixth Assessment Report of the Intergovernmental Panel on Climate Change; Cambridge University Press: Cambridge University Press: Cambridge, UK, New York, NY, USA, 2022. [Google Scholar]
  3. Boumaiza, L.; Walter, J.; Chesnaux, R.; Zahi, F.; Huneau, F.; Garel, É.; Stotler, R.L.; Bordeleau, G.; Johannesson, K.H.; Vystavna, Y.; et al. Combined effects of seawater intrusion and nitrate contamination on groundwater in coastal agricultural areas: A case from the Plain of the El-Nil River (North-Eastern Algeria). Sci. Total Environ. 2022, 851, 158153. [Google Scholar] [CrossRef] [PubMed]
  4. Viaroli, S.; Lancia, M.; Re, V. Microplastics contamination of groundwater: Current evidence and future perspectives. A review. Sci. Total Environ. 2022, 824, 153851. [Google Scholar] [CrossRef] [PubMed]
  5. Horton, A.A.; Walton, A.; Spurgeon, D.J.; Lahive, E.; Svendsen, C. Microplastics in freshwater and terrestrial environments: Evaluating the current understanding to identify the knowledge gaps and future research priorities. Sci. Total Environ. 2017, 586, 127–141. [Google Scholar] [CrossRef] [PubMed]
  6. Yadav, B.; Pandey, A.; Kumar, L.R.; Tyagi, R. Bioconversion of waste (water)/residues to bioplastics—A circular bioeconomy approach. Bioresour. Technol. 2020, 298, 122584. [Google Scholar] [CrossRef]
  7. Yates, M.R.; Barlow, C.Y. Life cycle assessments of biodegradable, commercial biopolymers—A critical review. Resour. Conserv. Recycl. 2013, 78, 54–66. [Google Scholar] [CrossRef]
  8. Mukherjee, A.; Singh, R.K.; Mishra, R.; Bag, S. Application of blockchain technology for sustainability development in agricultural supply chain: Justification framework. Oper. Manag. Res. 2022, 15, 46–61. [Google Scholar] [CrossRef]
  9. Bugnicourt, E.; Cinelli, P.; Lazzeri, A.; Alvarez, V. Polyhydroxyalkanoate (PHA): Review of synthesis, characteristics, processing and potential applications in packaging. Express Polym. Lett. 2014, 8, 791–808. [Google Scholar] [CrossRef]
  10. Bengtsson, S.; Pisco, A.R.; Johansson, P.; Lemos, P.C.; Reis, M.A. Molecular weight and thermal properties of polyhydroxyalkanoates produced from fermented sugar molasses by open mixed cultures. J. Biotechnol. 2010, 147, 172–179. [Google Scholar] [CrossRef]
  11. Morgan-Sagastume, F. Characterisation of open, mixed microbial cultures for polyhydroxyalkanoate (PHA) production. Rev. Environ. Sci. Biotechnol. 2016, 15, 593–625. [Google Scholar] [CrossRef]
  12. Jiang, G.; Hill, D.J.; Kowalczuk, M.; Johnston, B.; Adamus, G.; Irorere, V.; Radecka, I. Carbon Sources for Polyhydroxyalkanoates and an Integrated Biorefinery. Int. J. Mol. Sci. 2016, 17, 1157. [Google Scholar] [CrossRef] [PubMed]
  13. Villano, M.; Valentino, F.; Barbetta, A.; Martino, L.; Scandola, M.; Majone, M. Polyhydroxyalkanoates production with mixed microbial cultures: From culture selection to polymer recovery in a high-rate continuous process. New Biotechnol. 2014, 31, 289–296. [Google Scholar] [CrossRef] [PubMed]
  14. Colombo, B.; Favini, F.; Scaglia, B.; Sciarria, T.P.; D’imporzano, G.; Pognani, M.; Alekseeva, A.; Eisele, G.; Cosentino, C.; Adani, F. Enhanced polyhydroxyalkanoate (PHA) production from the organic fraction of municipal solid waste by using mixed microbial culture. Biotechnol. Biofuels 2017, 10, 201. [Google Scholar] [CrossRef] [PubMed]
  15. Lorini, L.; di Re, F.; Majone, M.; Valentino, F. High rate selection of PHA accumulating mixed cultures in sequencing batch reactors with uncoupled carbon and nitrogen feeding. New Biotechnol. 2020, 56, 140–148. [Google Scholar] [CrossRef] [PubMed]
  16. Papa, G.; Sciarria, T.P.; Carrara, A.; Scaglia, B.; D'Imporzano, G.; Adani, F. Implementing polyhydroxyalkanoates production to anaerobic digestion of organic fraction of municipal solid waste to diversify products and increase total energy recovery. Bioresour. Technol. 2020, 318, 124270. [Google Scholar] [CrossRef] [PubMed]
  17. Micolucci, F.; Gottardo, M.; Pavan, P.; Cavinato, C.; Bolzonella, D. Pilot scale comparison of single and double-stage thermophilic anaerobic digestion of food waste. J. Clean. Prod. 2018, 171, 1376–1385. [Google Scholar] [CrossRef]
  18. Strazzera, G.; Battista, F.; Garcia, N.H.; Frison, N.; Bolzonella, D. Volatile fatty acids production from food wastes for biorefinery platforms: A review. J. Environ. Manag. 2018, 226, 278–288. [Google Scholar] [CrossRef] [PubMed]
  19. Rossi, E.; Pecorini, I.; Ferrara, G.; Iannelli, R. Dry Anaerobic Digestion of the Organic Fraction of Municipal Solid Waste: Biogas Production Optimization by Reducing Ammonia Inhibition. Energies 2022, 15, 5515. [Google Scholar] [CrossRef]
  20. del Oso, M.S.; Mauricio-Iglesias, M.; Hospido, A.; Steubing, B. Prospective LCA to provide environmental guidance for developing waste-to-PHA biorefineries. J. Clean. Prod. 2023, 383, 135331. [Google Scholar] [CrossRef]
  21. Vogli, L.; Macrelli, S.; Marazza, D.; Galletti, P.; Torri, C.; Samorì, C.; Righi, S. Life Cycle Assessment and Energy Balance of a Novel Polyhydroxyalkanoates Production Process with Mixed Microbial Cultures Fed on Pyrolytic Products of Wastewater Treatment Sludge. Energies 2020, 13, 2706. [Google Scholar] [CrossRef]
  22. Valentino, F.; Brusca, A.A.; Beccari, M.; Nuzzo, A.; Zanaroli, G.; Majone, M. Start up of biological sequencing batch reactor (SBR) and short-term biomass acclimation for polyhydroxyalkanoates production. J. Chem. Technol. Biotechnol. 2013, 88, 261–270. [Google Scholar] [CrossRef]
  23. Gottardo, M.; Bolzonella, D.; Tuci, G.A.; Valentino, F.; Majone, M.; Pavan, P.; Battista, F. Producing volatile fatty acids and polyhydroxyalkanoates from foods by-products and waste: A review. Bioresour. Technol. 2022, 361, 127716. [Google Scholar] [CrossRef] [PubMed]
  24. Valencia, A.I.S.; Zamora, U.R.; Rodríguez, M.M.; Ramírez, J.; Peláez, M.L.S.; Ortiz, C.F. Effect of C/N ratio on the PHA accumulation capability of microbial mixed culture fed with leachates from the organic fraction of municipal solid waste (OFMSW). J. Water Process Eng. 2021, 40, 101975. [Google Scholar] [CrossRef]
  25. Chen, Y.; Ruhyadi, R.; Huang, J.; Yan, W.; Wang, G.; Shen, N.; Hanggoro, W. A novel strategy for improving volatile fatty acid purity, phosphorus removal efficiency, and fermented sludge dewaterability during waste activated sludge fermentation. Waste Manag. 2021, 119, 195–201. [Google Scholar] [CrossRef] [PubMed]
  26. Wu, J.; Ding, W.; Shen, N.; Song, H.; Li, Y.; Wang, G.; Chen, Y. Selective separation of volatile fatty acids and phosphorous recovery from fermented broth using flow-electrode capacitive deionization. Waste Manag. 2023, 165, 12–18. [Google Scholar] [CrossRef]
  27. Papa, G.; Sciarria, T.P.; Scaglia, B.; Adani, F. Diversifying the products from the organic fraction of municipal solid waste (OFMSW) by producing polyhydroxyalkanoates from the liquid fraction and biomethane from the residual solid fraction. Bioresour. Technol. 2022, 344, 126180. [Google Scholar] [CrossRef] [PubMed]
  28. Pecorini, I.; Peruzzi, E.; Albini, E.; Doni, S.; Macci, C.; Masciandaro, G.; Iannelli, R. Evaluation of MSW Compost and Digestate Mixtures for a Circular Economy Application. Sustainability 2020, 12, 3042. [Google Scholar] [CrossRef]
  29. Wang, X.; Bengtsson, S.; Oehmen, A.; Carvalho, G.; Werker, A.; Reis, M.A. Application of dissolved oxygen (DO) level control for polyhydroxyalkanoate (PHA) accumulation with concurrent nitrification in surplus municipal activated sludge. New Biotechnol. 2019, 50, 7–43. [Google Scholar] [CrossRef] [PubMed]
  30. Wang, X.; Oehmen, A.; Freitas, E.B.; Carvalho, G.; Reis, M.A. The link of feast-phase dissolved oxygen (DO) with substrate competition and microbial selection in PHA production. Water Res. 2017, 112, 269–278. [Google Scholar] [CrossRef]
  31. United States Environmental Protection Agency. Method 410.4, Revision 2.0: The Determination of Chemical Oxygen Demand by Semi- Automated Colorimetry. James W. O’Dell, Inorganic Chemistry Branch Chemistry Research Division, agosto 1993. Available online: https://www.epa.gov/sites/default/files/2015-08/documents/method_410-4_1993.pdf (accessed on 31 March 2024).
  32. ASTM International. Standard Test Methods for Ammonia Nitrogen in Water; National Institute of Technology Surat Gujarat State: Surat, India, 2014. [Google Scholar]
  33. United States Environmental Protection Agency. Method 365.3: Phosphorous, All Forms (Colorimetric, Ascorbic Acid, Two Reagent). 1978. Available online: https://www.epa.gov/sites/default/files/2015-08/documents/method_365-3_1978.pdf (accessed on 31 March 2024).
  34. United States Environmental Protection Agency. EPA Method 160.2 and Standard Methods 208 E. 1999. Available online: https://19january2017snapshot.epa.gov/sites/production/files/2015-06/documents/160_2.pdf (accessed on 31 March 2024).
  35. Touloupakis, E.; Chatziathanasiou, A.; Ghanotakis, D.F.; Carlozzi, P.; Pecorini, I. Poly(3-hydroxybutyrate) production by Rhodopseudomonas s S16-VOGS3 cells grown in digested sludge. Environ. Technol. Innov. 2023, 30, 103058. [Google Scholar] [CrossRef]
  36. Padovani, G.; Emiliani, G.; Giovanelli, A.; Traversi, M.L.; Carlozzi, P. Assessment of glycerol usage by five different purple non-sulfur bacterial strains for bioplastic production. J. Environ. Chem. Eng. 2018, 6, 616–622. [Google Scholar] [CrossRef]
  37. Valentino, F.; Lorini, L.; Gottardo, M.; Pavan, P.; Majone, M. Effect of the temperature in a mixed culture pilot scale aerobic process for food waste and sewage sludge conversion into polyhydroxyalkanoates. J. Biotechnol. 2020, 323, 54–61. [Google Scholar] [CrossRef] [PubMed]
  38. Ferraz, F.M.; Yuan, Q. Nitrite Interference with Soluble COD Measurements from Aerobically Treated Wastewater. Water Environ. Res. 2017, 89, 549–554. [Google Scholar] [CrossRef] [PubMed]
  39. Gao, D.-W.; Liu, L.; Liang, H. Influence of aeration intensity on mature aerobic granules in sequencing batch reactor. Appl. Microbiol. Biotechnol. 2013, 97, 4213–4219. [Google Scholar] [CrossRef] [PubMed]
  40. Mahato, R.P.; Kumar, S.; Singh, P. Production of polyhydroxyalkanoates from renewable resources: A review on prospects, challenges and applications. Arch. Microbiol. 2023, 205, 172. [Google Scholar] [CrossRef]
  41. Frison, N.; Andreolli, M.; Botturi, A.; Lampis, S.; Fatone, F. Effects of the Sludge Retention Time and Carbon Source on Polyhydroxyalkanoate-Storing Biomass Selection under Aerobic-Feast and Anoxic-Famine Conditions. ACS Sustain. Chem. Eng. 2021, 9, 9455–9464. [Google Scholar] [CrossRef]
Figure 1. (A) Setup of the selection reactor: glass reactor with a stirrer, DO probe, pH meter, peristaltic pumps, aeration, and timed sockets; (B) Biomass inside the selection reactor during the famine phase.
Sustainability 16 02961 g001
Figure 2. Setup of the selection reactor: Glass flask, DO probe, pH meter, stirrer, aeration.
Sustainability 16 02961 g002
Figure 3. Analysis of the target parameters (COD, NH4+, PO43−) and DO during the first 500 min of the ninth cycle (first cycle after a time equal to SRT) of the 0.08 vvm aeration rate scenario.
Sustainability 16 02961 g003
Figure 4. Analysis of the target parameters (COD, NH4+, PO43−) and DO during the first 500 min of the ninth cycle (first cycle after a time equal to SRT) of the 0.16 vvm aeration rate scenario.
Sustainability 16 02961 g004
Figure 5. Analysis of the target parameters (COD, NH4+, PO43−), DO, and PHB during the first 500 min of the ninth cycle (first cycle after a time equal to SRT) of the 0.32 vvm aeration rate scenario.
Sustainability 16 02961 g005
Figure 6. Intake rate of VFA, nitrogen, and phosphorous for the aeration rate of each scenario. Linear regression lines are represented, as is their specific coefficient of determination, R2.
Sustainability 16 02961 g006
Figure 7. Dissolved oxygen profile and spike collocation in the timeline of one accumulation test.
Sustainability 16 02961 g007
Table 1. Average values of the target parameters (COD, NH4+, PO4) at the end of the famine phase of the reactor during the week relating to the first scenario.
ParameterMean End of Famine [mgL−1]Standard Deviation [mgL−1]ConsumptionStandard Deviation
COD57.0026.1581%9%
N-NH4+2.530.3879%3%
P-PO43−0.500.3776%17%
Table 2. Average values of the target parameters (COD, NH4+, PO43−) at the end of the famine phase of the reactor during the week relating to the second scenario.
ParameterMean End of Famine [mgL−1]Standard Deviation [mgL−1]ConsumptionStandard Deviation
COD69.4011.6777%4%
N-NH4+1.700.3485%3%
P-PO43−0.410.2577%14%
Table 3. Average values of the target parameters (COD, NH4+, PO43−) at the end of the famine phase of the reactor during the week relating to the third scenario.
ParameterMean End of Famine [mgL−1]Standard Deviation [mgL−1]ConsumptionStandard Deviation
COD60.006.7880%2%
N-NH4+1.550.0386%0%
P-PO43−0.020.0499%2%
Table 4. Characterization of the sludge before and after the three accumulation tests.
ParameterVSSinVSSfinΔS (mgCOD L−1)PHBfin (mg L−1)
Average0.391.201166.561005.97
Standard dev.0.050.17185.3515.57
Disclaimer/Publisher’s Note: The statements, opinions and data contained in all publications are solely those of the individual author(s) and contributor(s) and not of MDPI and/or the editor(s). MDPI and/or the editor(s) disclaim responsibility for any injury to people or property resulting from any ideas, methods, instructions or products referred to in the content.

