Article

Impacts of Spatio-Temporal Changes in Anthropogenic Disturbances on Landscape Patterns in the Nandu River Basin, China

1
School of Tropical Agriculture and Forestry, Hainan University, Haikou 570228, China
2
Intelligent Forestry Key Laboratory of Haikou City, Hainan University, Haikou 570228, China
*
Author to whom correspondence should be addressed.
Sustainability 2024, 16(7), 2724; https://doi.org/10.3390/su16072724
Submission received: 21 February 2024 / Revised: 19 March 2024 / Accepted: 22 March 2024 / Published: 26 March 2024
(This article belongs to the Special Issue Managing Forest and Plant Resources for Sustainable Development)

Abstract

:
We explored the characteristics of landscape pattern (LP) changes in the Nandu River Basin (NRB) and its dynamic response mechanism to anthropogenic disturbance (AD). This is important for ecological protection and for land use decision-making in the basin in the context of the construction of a free trade port. Land use and land cover change (LULCC) data of 1990, 2000, 2010, and 2020 were analyzed with the help of the LP index, moving window method, hemeroby index, geo-information atlas, and geographic information system (GIS) spatial analysis to reveal the dynamic changes in LP characteristics in the NRB. Furthermore, this paper discusses into the correlation between LP and AD. The results indicate that over the past three decades, the NRB showed a staggered LP, dominated by forestland and cropland, whose total area has decreased by 25.27 km2 and 62.75 km2, respectively. On the other hand, the built-up land increased by 91.37%. The overall landscape fragmentation, landscape patch homogeneity, and landscape diversity have increased in the NRB. AD is the main reason for the dramatic changes in the LP of urban agglomerations centered in Haikou city. The area of minor disturbance (over 34%) occupies the largest proportion of the land, followed by higher (about 13~25%) and moderate disturbances (about 17~22%). The area of minor and strong disturbances has increased significantly, whereas those of moderate and higher disturbances have significantly decreased. The spatial distribution pattern of AD is gradually increasing from the southwest (natural landscape) to the northeast (human landscape). A transition in areas of low disturbance levels to higher levels is obvious. The area of the atlas that has transitioned from “minor → lighter disturbance (12)” and “higher → minor disturbance (41)” changed changed most significantly during 2000 to 2010 and from 2010 to 2020, occupying 26.79% and 11.99% of the transfer atlas, respectively. All regions encountering disturbances were significantly correlated with the largest patch index (LPI) from 1990 to 2020. The overall AD in the NRB has increased, especially in Haikou. Urbanization is the main factor for an increase in AD. The ecological and environmental management and monitoring in the basin need to be strengthened.

1. Introduction

A landscape pattern (LP) is defined as the specific manifestation of landscape heterogeneity in space under the combined influence of natural factors and human management activities [1]. It additionally functions as a comprehensive representation of human behaviors and economic advancements within specific societal contexts [2]. However, the impact of rapid socio-economic development, urbanization, and industrialization, coupled with a burgeoning population, has engendered profound repercussions on regional LP and ecosystems through increasingly intensified land development and utilization [3,4,5]. The impact of human activities on the pattern of landscapes is especially noticeable [6]. While causing significant changes in regional landscape types and ecological processes, the landscape types tend to be homogenized, and the changes in the original patterns, functions, and structures of regional ecosystems are intensified [7]. Unreasonable land development is one of the most important reasons for the generation and aggravation of ecological and environmental problems [8]. The aforementioned phenomenon also induces irreversible alterations in the functionality and structure of the landscape, resulting in severe detriment to the ecological environment [9]. Therefore, accurate identification of the characteristics of anthropogenic disturbance (AD) and quantification of its intensity as well as its temporal and spatial distribution is of paramount importance. Additionally, conducting a quantitative analysis of the correlation between LP and AD would help to unveil the fluctuating alterations in regional landscape patterns and their corresponding response mechanisms. These findings are crucial for effectively regulating human activities, ensuring ecological protection of regional landscapes, and promoting sustainable development within watersheds.
Hemeroby was introduced as a comprehensive index by Finnish botanist Jalas during his preliminary investigation into the influence of human activities on forest ecosystems [10]. This index has gained widespread recognition for assessing the influence of human activities and land use and land cover change (LULCC) on ecosystems and their components [11]. In recent years, the research on the degree of AD and the spatial differentiation of LP has made some achievements at home and abroad. Zhang [12] evaluated the mechanism of response of LP to intense human activities in the Three Gorges Reservoir area. Wang [11] used a GIS spatial analysis and geographic detectors to explore the spatio-temporal distribution and various driving forces of AD in the Guangdong–Hong Kong–Macao Greater Bay Area. Feng [13] analyzed the landscape ecological security and LULCC in the typical areas of eastern Qinghai–Tibet Plateau. Guo [14] applied the LP index and AD degree index to quantify the spatio-temporal differences in AD in the Qinling mountains. However, these studies have neglected investigating the trajectory and spatial differentiation characteristics of the degree of AD in different periods. The geo-information atlas can better reveal the trajectory of AD with different temporal characteristics. Moreover, there are relatively few investigations on the trajectory of spatiotemporal variations in AD that are based on a geo-information atlas. At present, studies on the degree of AD mainly focus on urban areas [15], coastal zones [16], estuarine wetlands [17], and mountain areas [14]. However, in previous studies, there are relatively few analyses on the spatial differentiation and spatio-temporal evolution of interference due to human activities. It is rare to explore the mechanism of impact of AD on regional LP on the basis of a geo-information atlas. Especially in tropical or subtropical environments with typical natural settings and socio-economic backgrounds, research on the response relationship between watershed scale LP and AD remains relatively scarce. Therefore, it is crucial to investigate the changes in tropical basin LP and their underlying mechanisms in response to AD within the context of free trade island construction.
Nandu river, as the largest river and primary water source of Hainan Island in China, holds significant importance for its unique geographical position, climatic conditions, and ecological role. Consequently, it is commonly referred to as the ‘Red River’ of the Hainan Island [18]. However, due to the swift progress in the societal economy and increase in population, agricultural water usage has significantly increased. This has led to severe agricultural pollution in the basin. Furthermore, unauthorized and unregulated sand mining activities in certain river sections have inflicted ecological damage [19]. This damage has amplified since Hainan declared to build a free-trade island in 2018. In the context of a rapidly growing social economy in the region, an accelerated process of urbanization, and a significant population increase, the Nandu River basin (NRB) has witnessed rapid advancements in tropical and highly productive agriculture, the real estate sector, and modern fisheries. Human activities have further disturbed the natural and semi-natural ecosystems of the basin. Due to LULCC, especially the development of the riparian zone or Jiangdong New Area in urban areas, regional LP and types have changed significantly. This causes ecological problems and endangers the ecological security of the region [20]. Qualified scholars have carried out relevant studies on the NRB, from the aspects of LULCC [21], habitat quality [22], and spatial distribution of biodiversity [23]. But the mechanism underlying the response that drives the intensity of spatial changes in regional LP due to disturbances caused by human activities remains understudied. The change in LP and its influence on AD in the NRB under the backdrop of the construction of the international free-trade island are discussed less.
Therefore, given the background of national strategy, what is the optimal strategy to coordinate the development and utilization of land resources and AD in NRB? How can we guarantee the sustainable development goal of the river basin under the construction of the free trade pilot zone? The evaluation of AD provides an effective means of answering these questions. In view of this, this study selects the NRB as the research area and is based on LULCC data from four time periods (1990, 2000, 2010, and 2020). The spatio-temporal changes in the regional LP were quantitatively analyzed using LP indices, the hemeroby index, and a geo-information atlas. The spatial distribution characteristics and dynamic change trajectory of AD intensity was also quantified. This paper further investigates the spatio-temporal dynamics of AD on the evolution of regional LP and its underlying response mechanisms. It comprehensively and objectively elucidates the key drivers behind the changes in landscape and ecological processes in the NRB under anthropogenic activities. The objective of these findings is to provide technical support and establish a scientific foundation for the protection and restoration of the ecological environment across the entire basin.

2. Materials and Methods

2.1. Study Area

The NRB (109°12′~110°35′ E, 18°56′~20°05′ N) is located in the central–northern regions of Hainan Island (Figure 1). The Nandu river features a broad channel characterized by numerous sandbanks, hills, and shoals. Spanning a length of 333.8 km, its main stream encompasses over 20 significant tributaries including the Longzhou, Datang, and Yao Zi rivers. The Nandu river originates from Nanfeng Mountain in Baisha, flows through Baisha Li autonomous county, Danzhou city, Chengmai county, Tunchang county, and Ding’ an county, and finally flows into Qiongzhou strait in Haikou city. The total area of the basin is 7076 km2, accounting for 20.75% of the total area of Hainan Island. Both sides of the Nandu river are dominated by flat areas, most of which are cultivated farmland. The upper reaches consist of towering mountains and rolling hills, characterized by undulating terrain. In contrast, the middle and lower reaches exhibit a gentle slope, gradually decreasing from south to north. The study area is a tropical oceanic monsoon climate with an average annual temperature of 23.5 °C and an average annual rainfall of 1935 mm. There are more than 1200 kinds of coniferous broad-leaved trees and 700 kinds of arboreal trees in the NRB. The vegetation types are mainly tropical shrubs, vines, and herbs under evergreen broad-leaved forests.

2.2. Data Sources

The LULCC data of the NRB were obtained from the Resource and Environment Science and Data Center of the Chinese Academy of Sciences (http://www.resdc.cn accessed on 6 June 2023). These datasets had a spatial resolution of 30 m. According to the land classification standard of the center and the actual land use situation of the study area, the LULCC data were reclassified and processed, and the land use types were divided into 6 primary and 19 secondary landscape types. Other basic data were derived from the Geospatial data cloud (http://www.gscloud.cn/ accessed on 19 May 2023), Statistical Yearbook of Hainan Province, and Haikou Statistical Yearbook.

2.3. Methods

2.3.1. Dynamic Characteristics of LULCC

A parameter of a single dynamic degree was used to study the quantitative changes in land use types in a specific time period [20]. The following formula was used for its calculation:
K = U b U a U a × 1 T × 100 %
where K represents the dynamic degree of the landscape; Ua and Ub denote the quantity of land use at the beginning and end of the study, respectively; and T indicates the duration of the study period.

2.3.2. LP Indices

Remote sensing (RS) and geographic information systems (GISs) are the most effective and rapid methods for quantifying landscape structure. The characteristics of regional LP changes at different levels in the NRB were analyzed with the help of LP indices by taking into account a previous study [24] and by taking into account the current circumstances of the NRB. Six landscape metrics were selected that reflected the changing characteristics of LP in the NRB: landscape fragmentation (largest patch index, LPI; mean patch size, MPS), landscape patch shape (edge density, ED; landscape shape index, LSI), and landscape diversity (aggregation index, AI; Shannon’s evenness index, SHEI). The formula for their calculations and test of significance of the landscape index model were based on a previous report [25].
Also, on the basis of relevant results from previous studies [26,27], a feature analysis of landscape index was completed using a 3000 m moving sampling window. The dynamic change characteristics of the landscape during the three time periods of 1990–2000, 2000–2010, and 2010–2020 were explored [28].

2.3.3. Hemeroby

With the help of ArcGIS 10.8 software, a grid sampling of 1931 units, each of a 2 km × 2 km research area, was performed, each of which was regarded as an evaluation unit. With reference to the studies by Liu [6] and Feng [29], the current LP of NRB was studied on the basis of landscape components, landscape type characteristics, and disturbance degrees (Table 1). The hemeroby index was calculated using the normalized area-weighted formula to determine the extent of AD in the different landscape types within the NRB. The intensity and temporal changes in AD on LP were quantitatively described [6]. The formula used for the calculation is as follows:
H I = i = 1 m ( A i A ) × S i
where HI is the hemeroby index; m is the number of landscape types in the statistical unit; the variable Ai represents the area of landscape type i within the statistical unit; A is the total area of the statistical unit; and Si is the disturbance index weight corresponding to the class i landscape type. The degree of disturbance of landscape types in the study area was determined by considering the previous findings (Table 1) [14]. The greater the value, the more serious the degree of AD. A natural breakpoint method was employed to classify the AD into five distinct levels: HI ≤ 3 indicates a minor disturbance, 3 < HI ≤ 4 represents a lighter disturbance, 4 < HI ≤ 5 denotes a moderate disturbance, 5 < HI ≤ 6 signifies a higher disturbance, and HI > 6 indicates a strong disturbance.

2.3.4. Geo-Information Atlas

A geo-information atlas is a comprehensive spatio-temporal composite analysis method that is based on RS, GIS, computer mapping, and spatial information technology [30].
The application of this method has been extensively employed in diverse domains, including land resource management [31], territorial spatial planning [32], and agricultural production [33]. In order to accurately reveal the spatio-temporal evolution trajectory of AD intensity in the study area, we initially developed an AD degree assignment code and applied geo-infographic atlas theory to quantitatively analyze the spatio-temporal evolution trajectory and characteristic variation rule of AD intensity during three timeframes (1990–2000, 2000–2010, and 2010–2020). The formula of the calculation of the graph is as follows:
C   =   10 A + B
where C is the grid of the spectrum elements of the succession of AD degree, and A and B are the unit attribute values of the AD degree map at the beginning and end of the study, respectively.
To explore the primary mechanism that drives the changes in LP resulting from various intensities of AD, this study employs a rising and falling atlas to depict the spatio-temporal dynamics of AD [34]. The details are as follows: an increase of 1 level is defined as a “slight increase”, such as 1 → 2, 2 → 3, 3 → 4, and an increase of 2 or more levels is defined as a “significant increase”, such as 1 → 3, 1 → 4, 2 → 4. No change is defined as “remaining stable”, such as 1 → 1, 2 → 2, 3 → 3, 4 → 4.

2.3.5. Correlation Analysis between Hemeroby Index and LP Index

The Pearson correlation coefficient is a statistical method that reflects the linear relationship between two variables, X and Y, and its value range between −1 and 1. The greater the absolute value, the stronger is the correlation [35]. Using SPSS 26 software, this coefficient was utilized to calculate the degree of correlation between different levels of AD and LP indices.

3. Results

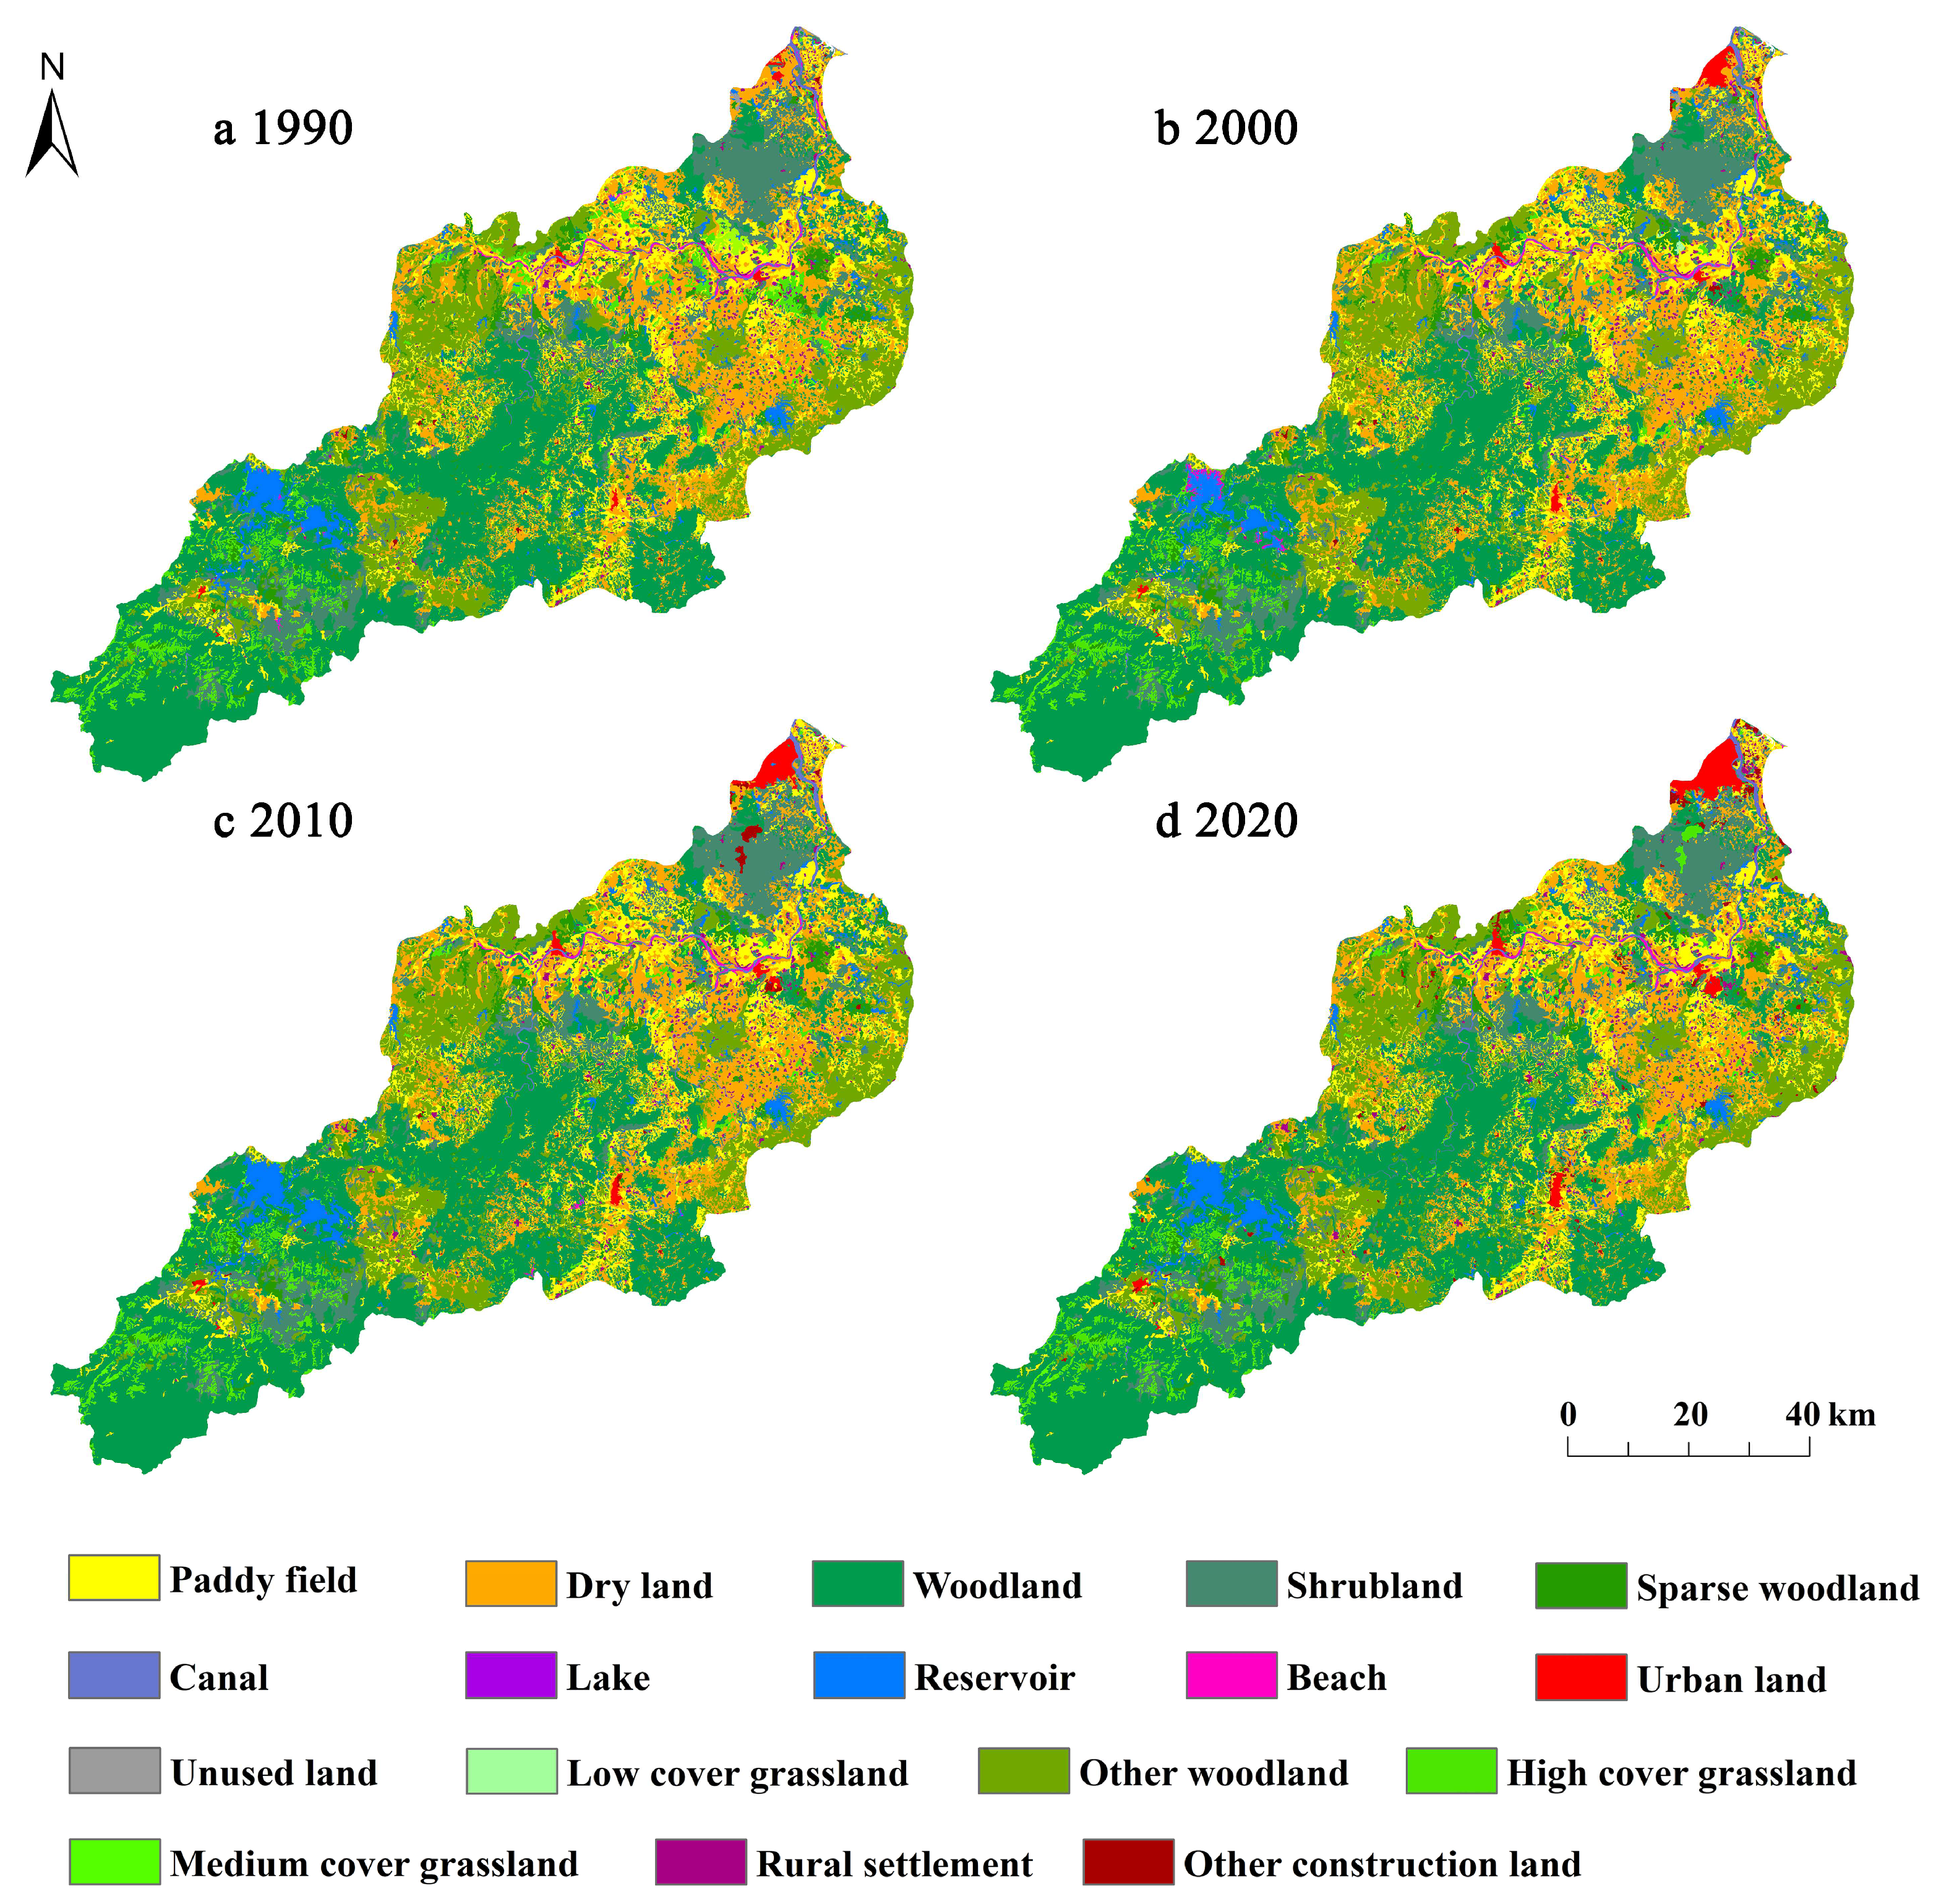
3.1. Characteristics of Spatio-Temporal Changes in LULCC

The landscape structure of the NRB from 1990 to 2020 is shown in Table 2. The largest proportions are the areas of the forestland, followed by croplands, both of which are the dominant landscape types at the study site, which share a combined area of more than 85%. The distribution of forestland is primarily concentrated in the central hilly and southern mountainous areas (Figure 2). The area occupies a certain dominant position, but the total area decreased by 25.27 km2 during the study period. Croplands were mainly distributed in the flat areas of the northern part of the basin, which have decreased, in total, by 62.76 km2. Notably, the period from 2010 to 2020 witnessed a substantial reduction of 22.95 km2 in the area of dry land. This decline mainly occurred within the urban and rural ecotones that are undergoing rapid urbanization. The grasslands were mainly distributed in the mountainous areas in the upper reaches and surrounding the Songtao reservoir. Their distribution was relatively scattered, and their total area decreased by 82 km2. Songtao is the largest reservoir and a key drinking water source in Hainan province. Since 2008, the Hainan provincial government has officially defined the scope of Songtao reservoir management and protection. Also, forestlands and grasslands, which form a natural LP in the local area, are protected to a certain extent. The built-up land is primarily concentrated within the main urban areas of the basin, exhibiting a significant increase in total area of 91.37%. Notably, the estuary region in the north represents the most prominent concentration area. The dynamic attitude for the development of other construction land, with a rate of 10.74% and 11.27%, reached its peak during the periods of 2000–2010 and 2010–2020, respectively. The rate of urban land change was most significant during 2010 to 2020 and witnessed a substantial rise of 49.61%. This indicates a gradual intensification in human intervention, which was particularly evident in the eastern and western coastal regions of Haikou. It directly reflects how rapid population growth drives the acceleration of the processes of urbanization and fosters swift regional economic development [36]. The proportion of unused land area is relatively small and showed a trend of continuous reduction. Except for a continuous reduction in beach land, the other water bodies continued to increase.

3.2. Characteristics of Spatio-Temporal Changes in LP

In terms of landscape level (Figure 3), LPI and MPS experienced a decline of 21.29% and 1.94%, respectively, during the period from 1990 to 2020. This shows that the degree of fragmentation in the NRB is increasing over time. Furthermore, LSI and ED exhibited an initial increase, followed by a subsequent decrease; a marginal overall increment of 0.72% and 0.73%, respectively, was observed in these parameters. This shows that the landscape patch shape in the basin was initially complicated, which was gradually regularized subsequently. SHEI exhibited a pattern of initial decline, followed by a subsequent increase. Its lowest value of 64.52% was recorded in 2000, while the highest value reached 67.19% in 2020; an overall positive growth of 2.24% was estimated. At the same time, AI declined by 4.16% during the study period. This shows that the landscape diversity of the NRB is increasing, but the landscape tends to be dispersed.
The indices of LPI, LSI, AI, and SHEI were employed to assess the overall spatial changes in landscape fragmentation, patch shape, and diversity in the basin (Figure 4). From 1990 to 2010, a declining trend in the LPI was observed in Chengmai, Ding’an, and Tunchang. Notably, both Chengmai and Tunchang have not only facilitated new construction for urbanization but also adjusted their industrial structure by vigorously developing characteristic leisure tourism and efficient tropical agricultural industries (agriculture with tropical characteristics). In the process of promoting the industrial transformation towards rejuvenating agriculture and increasing income while transitioning from traditional to modern and efficient agriculture, there has been an increase in the transformation and utilization of original landscape types along with related supporting facilities. Consequently, this has resulted in a decrease in the extent of large land patches, while an increase in small arable land patches was evident. The intensification of human activities, coupled with an expanded range of activities, have further exacerbated regional fragmentation. From 2010 to 2020, the expansion of LPI predominantly occurred within Haikou’s urban area. This was primarily driven by the setting up of the Hainan special economic and trade zone and by an accelerated urbanization. This disorderly pattern of development has resulted in the encroachment of regional forestlands and croplands and their re-integration and conversion into built-up land, such as transport lines, industrial land, housing, and office land. Consequently, this has caused a decrease in the fragmentation levels within building landscape types while increasing their aggregation degree.
The LSI changes from 1990 to 2000 were complicated; they mainly decreased in the southeast of Chengmai and increased in the west of Tunchang. Additionally, the Songtao reservoir decreased in the east and increased in the west during this specified time period. From 2000 to 2010, LSI was mainly concentrated in Danzhou and Haikou, which had mainly decreased. This indicated that the development advantage of a single landscape was prominent, which was influenced by human factors. From 2010 to 2020, Chengmai and Tunchang showed a trend of linear growth. The other regions mainly declined, especially Haikou, which showed a trend of spreading and gathering from the cluster to the periphery. The population of Haikou has witnessed a significant surge, soaring from 987,000 in 1990 to 2.89 million in 2020. This rapid urban expansion has led to an intensified AD on the regional landscape, resulting in simplified, regularized, and clustered patch shapes. Consequently, there is a growing trend towards landscape aggregation and fragmentation across diverse landscapes. Notably, the coastal zone of Haikou and the riverbank area, downstream of the NRB, are facing unprecedented environmental protection pressures.
From 1990 to 2010, AI revealed a fluctuating trend in the Songtao reservoir and in Tunchang, where initially a decline was recorded, which was followed by an increase. On the other hand, Chengmai experienced an initial increase and subsequently a decrease in AI. Conversely, SHEI displayed an opposite pattern to the Songtao reservoir. Tunchang witnessed an ascending trajectory before declining, whereas Chengmai exhibited a descending trend prior to rising. From 2010 to 2020, notable transformations were observed in the central and estuaries of the NRB. AI predominantly demonstrated a reduction in the central basin alongside an augmentation in the northern basin; conversely, SHEI primarily showcased an elevation in the central basin coupled with a decline in the northern basin.

3.3. Characteristics of Spatio-Temporal Changes in Hemeroby

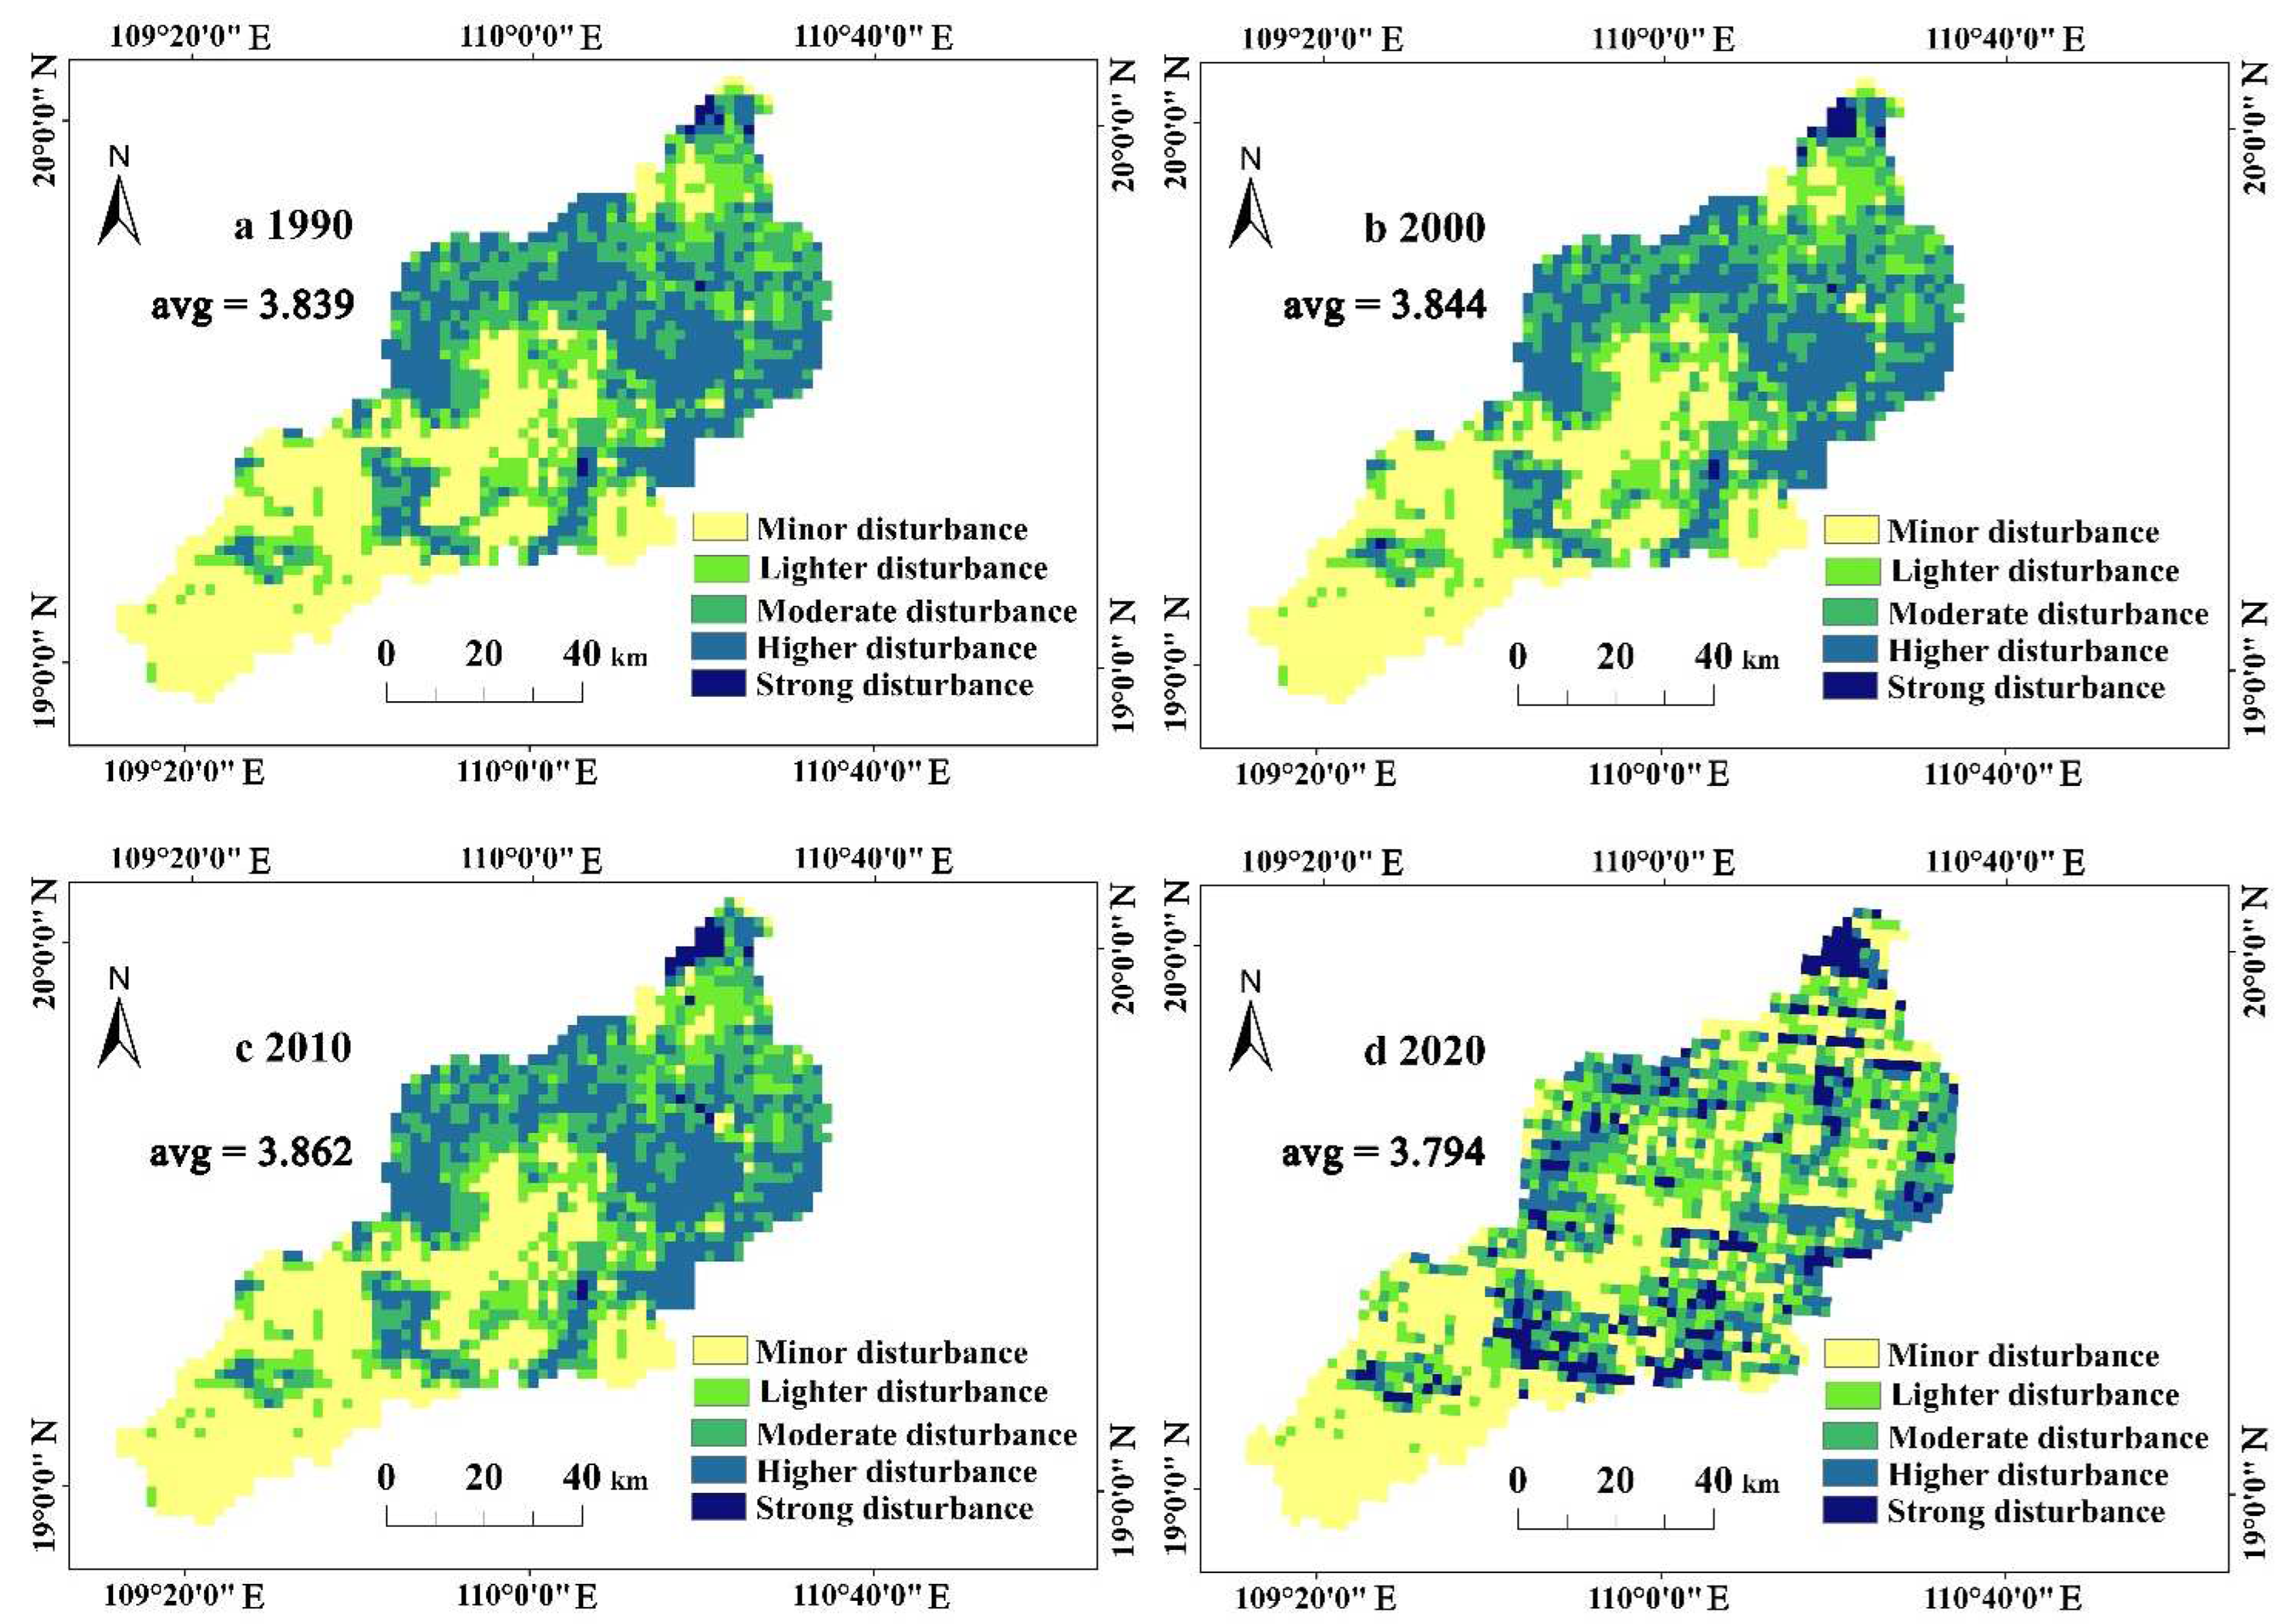
3.3.1. Overall Characteristics and Spatial Distribution of Hemeroby

The spatial distribution of AD in the NRB (Figure 5) exhibited a gradient: higher levels were seen the northern region compared to those in the south, whereas a gradual increase from southwest to northeast was observed. Strong disturbances occupied a relatively small area (Table 3). The study period witnessed a consistent increase in building land, with an expansion of 652.32 km2. This was concentrated in the estuary area of the Nandu river and is currently the location of innovative trade, leisure tourism, cultural creativity, science and education highlands, and economic and technological development zones such as Xinbu, the Haidian islands, the Jiangdong new area (key area of the pilot free-trade zone), and the Beibu gulf city cluster in Haikou city. The aforementioned regions are subject to a significant degree of AD. At the beginning of the study, we had noticed that a higher disturbance had occupied a relatively large proportion of the area, which was primarily concentrated in the northeast, northwest, and other areas with rapid urbanization. However, at the end of the study, a significant decrease of 871.13 km2 was observed due to the influence of ecological policies. The changes due to moderate levels of disturbances were relatively complex. An overall trend of an initial decrease, then an increase, and finally sharp decreases was observed. Concentrated within the peripheral region of the higher disturbance area, there was a reduction in the overall extent by 342.03 km2. Furthermore, minor disturbances occupy a dominant position and are mainly distributed in the central and southern parts of the NRB. The main landscape types in these regions are forestlands, shrub lands, and grasslands. First, the area of minor disturbances had decreased, which later showed a significant overall increase of 382.66 km2. The implementation of an ecological policy has effectively curbed the intensity of regional AD, in line with the principles of sustainable development. The mean values of AD in the four study periods were 3.839, 3.844, 3.861, and 3.794, respectively. This phenomenon indicates that the amplitude of AD has remained stable from 1990 to 2000, it increased from 2000 to 2010, and then it decreased significantly after 2010. However, with the rapid urbanization process in the basin, the AD in the region is obviously aggravated and continues to expand.

3.3.2. Atlas Characteristics Analysis

Based on ArcGIS 10.8 driven analysis and geo-information atlas theory, the maps of changes due to AD of the three periods in the NRB were reconstructed. The spatio-temporal variations that were characteristic of AD during the 30 years at the study site were explored. The key driving mechanisms behind the changes due to AD were revealed (Figure 6 and Table 4). A total of 11 types of atlases have changed from 1990 to 2000. The most obvious changes were “moderate → lighter disturbance (32)”, “moderate → higher disturbance (34)”, and “higher → moderate disturbance (43).” These accounted for 58.7 km2, or 50.53% of the total area of the transfer atlas. It was followed by “lighter → minor disturbance (21)” and “lighter → moderate disturbance (23)”; these transfer areas were more than 40 km2.
Most of these changes occurred in Chengmai and Tunchang, and under the influence of the “Qiongbei Comprehensive Economic Circle”, the urbanization of these regions was obvious. However, in order to effectively plan agricultural development, local governments have appropriated a certain amount of ecological land, including forests and grasslands. To a certain extent, the illegal reclamation behavior is reduced, the land use mode is optimized reasonably, and the regional landscape fragmentation is improved. Therefore, the decrease in AD in these areas is more significant.
The period from 2000 to 2010 witnessed alterations in a total of 13 categories of the atlas. The most obvious change was the one from “minor → lighter disturbance (12)”, which accounted for 26.79% of the overall extent in the transfer atlas. “Moderate → higher disturbance (34)” and “lighter→ moderate disturbance (23)” followed closely and accounted for 14.3% and 14.24% of the total area of the transfer atlas, respectively. The changes in the atlas were concentrated in Haikou City and Chengmai County. Under the double influence of the special policy of the Hainan special economic zone and the local government’s economic investment, Haikou city has developed financial and trade zones such as the Jinpan industrial development zone, yonggui industrial development zone, and free-trade zone. The process of regional urbanization has occurred rapidly. Therefore, influenced by the Haikou economic circle, Chengmai county’s economy has also experienced rapid development, particularly with respect to the industrial planning and construction within the old city economic development zone. Throughout this timeframe, a development model that prioritized economic growth over environmental concerns was adopted. As a consequence, although the regional economy made swift progress, it disrupted the balance between resource utilization and environmental protection while exacerbating the ecological risks in the local areas.
A total of 20 types of atlases have changed from 2010 to 2020. The most obvious change was in the category of “higher → minor disturbance (41)”, which accounted for 11.99% of the total area of the transfer atlas. Next, the category of “higher → moderate disturbance (43)” followed; this accounted for 10.41% of the total areas. The “higher → lighter disturbance (42)” and “moderate → lighter disturbance (31)” categories also accounted for significant changes. They were primarily distributed in the northeastern, northwestern, and northern parts of the NRB. The transfer from a high to a low disturbance category was particularly obvious. But the transition from low to high disturbance became increasingly evident during this period and constituted 46.85% of the total area depicted in the atlas. This shift was primarily concentrated within the rapid urbanization surrounding cities and towns. In June 2010, the outline of the plan for the construction of Hainan as an island for international tourism was issued, which comprehensively promoted Hainan’s tourism industry. This time proved to be a golden period, as and a large number of people have poured in. While the coastal eco-tourism industry prospered, it indirectly facilitated the rapid development of Hainan’s real estate sector, fisheries, and efficient agriculture with tropical characteristics. It also stimulated the local modern service industry to a certain extent. In particular, in 2018, the Hainan provincial government decided to build the Haikou Jiangdong new area as a key component in the construction of the China (Hainan) pilot free-trade zone. This area was constructed under the coordinated development of three regional economic circles of (Haikou, Sanya, and Dan Yang). The AD caused by human activities has emerged as the primary driving force behind the degradation of regional ecological environments, exerting significant pressure on ecological security. Coordination between regional economic development and environmental protection has emerged as an urgent concern for local governments to address.

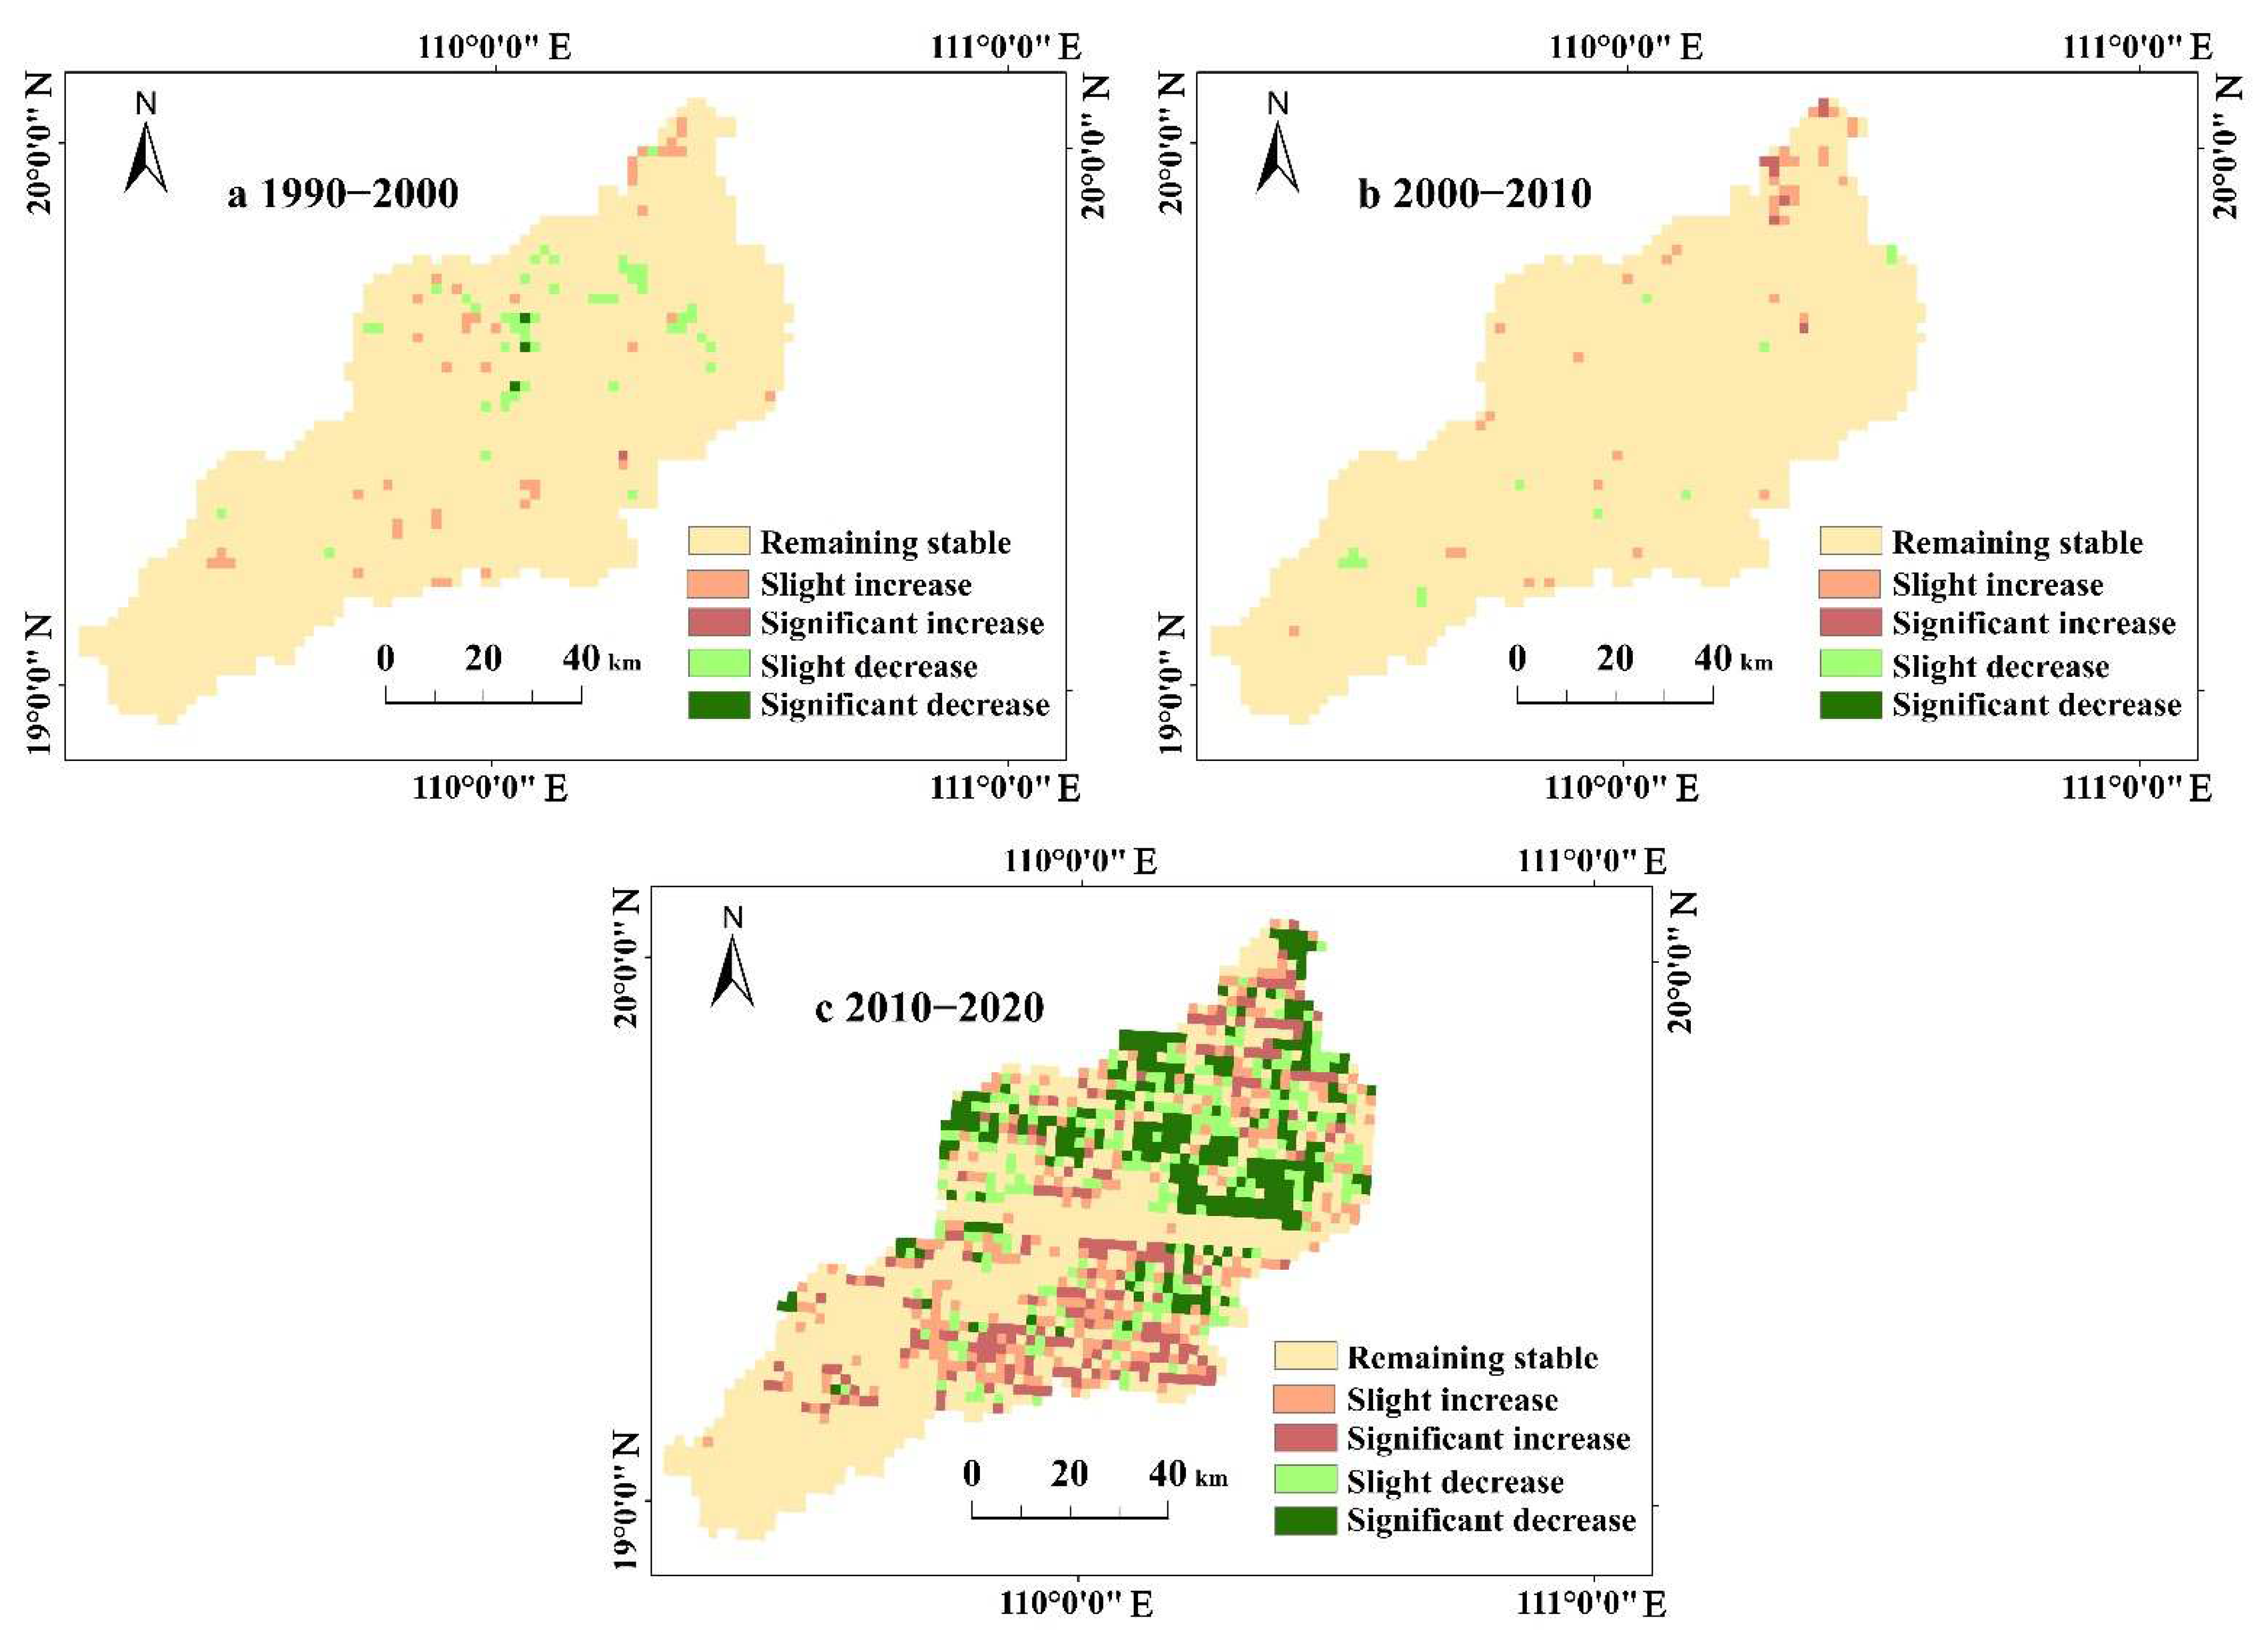
3.3.3. Characteristic Analysis of Fluctuation Atlas

This study constructs the fluctuation atlas of AD to reveal the dynamic variations in the regional AD (Figure 7). The overall disturbance amplitude remained stable from 1990 to 2010. Haikou and the counties of Chengmai and Ding ‘an are the main places where the maps have changed. Amongst these, Haikou city has gathered most of the areas that were recorded to have ‘slight’ and ‘significant’ levels of improvement. Under the influence of the “Haikou Chengmai Wenchang” integrated “Qiongbei comprehensive economic circle”, regional tourism, real estate, and efficient agriculture with tropical characteristics have been developed to a certain extent. The slight and significant decreases were distributed in the periphery of villages and towns in the middle reaches of the NRB. Due to policy of converting farmlands back to the forests, such transformations have resulted in a decrease in degree of AD. On the one hand, due to the acceleration of urbanization, the improvement areas from 2010 to 2020 are mainly distributed in Haikou city, in counties of Ding ‘an, Chengmai and Tunchang, and in other towns. However, even in some of the areas encountering rapid economic development, the distribution is primarily concentrated in the northern region of the NRB, and AD has declined. To a large extent, the local government has carried out ecological and environmental risk assessment work in the NRB in the region and clearly stipulated that economic development should be based on the principle of ecological protection. Forests, grass, and wetlands falling within the designated ecological red lines should be safeguarded while harnessing their full potential for delivering valuable ecosystem services [37] so that a high level of coordination in ecological and economic development is achieved in the basin.

3.4. Correlation between Hemeroby and LP Indices

As shown in Table 5, all the types of disturbances showed significant correlations with LPI during 1990–2020 (p < 0.05). In addition to minor disturbances, lighter, moderate, higher, and strong disturbances were significantly correlated with LPI (p < 0.01). The areas of moderate and higher disturbances are subject to significant human impacts, as they are influenced comprehensively by multiple factors, such as tropical ecotourism, the real estate industry, efficient tropical agriculture, modern logistics industry, high-tech and new technology sectors, and the modern education industry. Consequently, the local AD has intensified as regional landscape fragmentation and spatial heterogeneity have increased. Additionally, there is a tendency towards dispersed shapes of landscapes, which are characterized by higher levels of diversity. The areas encountering minor disturbances are mainly distributed in the forest and grass landscapes in the southern mountainous regions. Due to the impact of the landform and national ecological policy of protection, the natural landscape in the upper reaches of the Nandu river has received relatively little AD. It retains a large area of natural patches, and the landscape fragmentation and diversity are relatively low. On the contrary, the strongly disturbed areas are mainly distributed in the regions facing rapid urbanization processes, such as in the northern estuary. Due to the intense AD, a vast expanse of artificial landscapes emerge, characterized by low fragmentation and limited diversity. Therefore, this shows that to some extent, the influence of AD on the LP index has certain regional characteristics. Additionally, it was observed that although the degree of influence of AD on ED, LSI, SHEI, and AI did not change significantly, they display a complicated relationship.

4. Discussion

Among the three basins (Nandu River Basin, Changhua River Basin, and Wanquan River Basin) of Hainan Island, the NRB is the largest, the most populous, and the strongest in economic development. The spatial distribution of LP in the basin is indirectly affected by natural factors such as terrain, landform, and climate. It is also impacted by human factors including frequent interference and national policies. Therefore, studying the dynamic changes in LP and their response to AD across different periods and regions hold great significance for understanding the mechanisms that drive the dynamics of regional LP as well as for ecological environment protection and management.

4.1. The Homogeneity of Landscapes Driven by AD

This study introduces the regional landscape structure from the secondary landscape types. The landscape structure of the NRB has significant spatial differences. Driven by human activities, the LULCC is one of the leading causes of landscape homogeneity [38]. The results of the spatial characteristics of AD also show that different intensities of AD cause spatial differentiation of regional landscape diversity, which is obviously reflected in this region. As shown in Figure 1, the downstream section of the study area has a flat terrain and significant urbanization processes. In 2018, the Jiangdong New Area of Hainan Province was selected as the pilot area and a key area for the construction of the China (Hainan) pilot free-trade zone. In addition, in Haikou City, “the two sides of the same river, the east and west double port drive, the coordinated development of the north and the south” and other related policies were implemented, which also led to the rapid growth of the regional economy and the rapid development of urbanization process [39]. The population of Haikou City increased by nearly 2 million in 30 years (Figure 8), and the population density also increased from 431 (km2) to 1261 (km2). The high concentration of the population accelerated the increasing demand for built-up land and supporting facilities and accelerated the occupation of some ecological lands such as forests and grass lands in the local coastal zone and riparian zone by artificial landscape such as real estate, tourism, commerce, and industry [20]. The area of landscape structure tends to have more rules and simplification [40], speeding up the area to the process of building homogeneous lands. Strong AD has become the regional LP during the period of dynamic change and similar characteristics of the main driving force [41]. A good example is that the degree of human disturbance in cities, counties, and towns such as Ding ‘an, Chengmai, and Lingao is higher than that in other regions [42]. High level of urbanization and AD made the landscape richness of urbanization fall to the lowest point, which is considered one of the main driving forces of homogeneity [43].
On the contrary, the upper reaches of NRB belong to the ecological function area and the water conservation area. It is protected by topographic factors as well as national parks and active ecological policies [44]. The human activities in this region are limited to a certain extent, the vegetation is protected, and the vegetation coverage is high. The forestland dominated by tropical rain forests is the main landscape matrix of the region, and the natural landscape is rich and homogeneous.
In summary, AD of different intensities influences regional landscape homogeneity. In other words, urban and rural ecotones and agricultural and forestry ecotones are mainly distributed in the middle and lower reaches of the study area, which has many landscape types and intricate landscape structures and is also the main distribution area of the tropical efficient fruit industry, vegetable industry, economic forest industry, and characteristic breeding and planting industries [45]. Under the influence of the tropical efficient agriculture policy and the accelerated urbanization, the landscape type is changed frequently, the regional landscape fragmentation is increased, and the landscape diversity is higher than that of urban areas and ecological functional areas. As shown in Figure 4, the SHEI values in these regions experienced a relatively obvious increase from 2010 to 2020. Therefore, the probability of regional landscape homogenization is relatively low in the semi-natural landscape with multiple landscape types and complex landscape structures caused by human interference to a certain extent.

4.2. Sustainable Development and Policy Objectives of the NRB

This study explored the mechanisms that drive responses to disturbances from human activities in different stages and in different regions that brings dynamic changes to LP in the basin. It puts forward suggestions for ecological protection, restoration, and management in the basin. First, it is imperative to enhance public awareness regarding ecological conservation and the advantageous strategies of eco-tourism [46]. Ensuring the stability, sustainability, and biodiversity of the ecosystem, AD in natural resource consumption must be strictly regulated. Second, based on the Territorial Space Plan of Hainan Province (2020–2035), the rational territorial layout of ecological, agricultural, urban, and marine spaces should be coordinated. It is recommended that a core economic circle in the north of the basin should be developed with Haikou, Chengmai, Wenchang, and Ding’ an in the center, and regional economic construction should be further strengthened on the basis of ensuring environmental health. In addition, priority will be given to protecting the green ecological zone in the south, which is dominated by natural landscapes such as tropical rainforests. This would be helpful for the coordinated development of the river basin economy and preserving the ecology and the environment of the region under the backdrop of free-trade port construction. Third, further development should adhere to the principle of ecological environment protection. Monitoring efforts on the encroachment and destruction of ecological land should be enhanced while striving to reduce emissions of pollutants [19]. The management of water resources, the water environment, and water ecology should be effectively coordinated while simultaneously promoting continuous efforts in basin ecological protection and pollution control [47]. Disaster management and ecological restoration in highly fragile natural ecosystems with significant fragmentation within the basin should be accomplished. Finally, in line with the “Fourteenth Five-Year Plan” for ecological and environmental protection of Hainan province and other relevant regulations, it is important to adhere to the ecological basin concept that integrates mountains, rivers, forests, fields, lakes, grasslands, and deserts [48]. This will enable the development of society towards an ecological civilization that is characterized by the harmonious coexistence of urban areas, towns, rivers (lakes), landscapes, and cultures.

4.3. Contributions and Limitations

At present, research on the impact of AD on LP based on land use is relatively common [16,48]. Compared with these studies, we quantified the intensity of regional AD and its spatio-temporal dynamic change characteristics and explored the ecological impact of AD on regional landscape.
In addition, LP index can effectively link landscape processes with pattern and describe the characteristics and changes in landscape structures [49]. The response of AD to LP is regional and time-sensitive. For example, all LP indices adopted by Wang have significant correlations with the AD degree [48]. In this study, only LPI had a significant correlation (p < 0.05), which was mainly due to two reasons: first, the distribution of different landscape types and the influence of human activities on them were different in the different study areas. Second, the correlation between the AD degree and landscape index was different in different periods, which may have been positive or negative.
For the selection of landscape indicators, we fully considered landscape fragmentation, diversity, and patch shape and selected two LP indexes in each aspect. The advantage of this is that two indicators can confirm the study results more accurately than one indicator and can avoid excessive occurrence of indicators with the same ecological implications. Finally, compared with the studies of Wang [48] and Hu [50], the scale effect of LP was not considered in our study. Therefore, in future, similar studies, it is necessary to explore the differences in the effects of AD on LP at different scales.

5. Conclusions

Based on the LULCC data, this study introduced the hemeroby index and analyzed the dynamic changes in LP and AD in the NRB using GIS and geo-information atlas methods. Furthermore, it quantified the trajectory characteristics of AD. The key findings are as follows: the built-up land area exhibited the most conspicuous increase of 115.8 km2, which was concentrated in the northern cities such as Haikou, Chengmai, and Ding’ an. During the study period, fragmentation, patch shape, and diversity of the landscape increased in the NRB. Over the past three decades, the overall AD in the NRB increased first (1990–2010), and then decreased (2010–2020). Early irregular agriculture and excessive economic construction are the main reasons for the increase in AD. It is worth noting that due to some positive human activities, such as the construction of the rainforest national park and the protection of the Songtao Reservoir water source point, the impact of AD on the NRB has been reduced. But some areas are still increasing (built-up area of Haikou City). At the same time, these positive activities have led to a gradual reduction in the area of high-level AD in the basin. However, due to urbanization, strong disturbances in some cities and counties have become more obvious. In addition, the increase in the number of AD atlases indicates that regional human activity is becoming more frequent. All the types of AD showed significant spatial correlations with LPI. The fragmentation of the NRB landscape is serious, and the landscape diversity is continuously declining.
The spatial heterogeneity of LP in the NRB is influenced to a certain extent by the intensity of AD in our study. The highest and lowest intensities of AD contribute to the monogeneity of both human and natural landscape structures, as well as the homogenization of LP. However, intermediate levels of AD result in heightened fragmentation of regional semi-natural landscapes, the development of intricate patch patterns, reduced connectivity, intensified landscape heterogeneity, and increased species diversity.

Author Contributions

Conceptualization, M.M. and L.W.; methodology, W.G.; software, M.M. and G.W.; validation, M.M. and G.W.; formal analysis, T.L.; investigation, M.M.; resources, W.G.; data curation, M.M.; writing—original draft preparation, M.M. and L.W.; writing—review and editing, W.G. and T.L.; visualization, M.M. and G.W.; supervision, W.G.; project administration, W.G.; funding acquisition, W.G. All authors have read and agreed to the published version of the manuscript.

Funding

This research was supported by the Hainan Provincial Natural Science Foundation of China (No. 621RC507), the National Natural Science Foundation of China (No. 32360386), and the Intelligent Forestry Key Laboratory of Haikou City (No. 2020-057).

Institutional Review Board Statement

Not applicable.

Informed Consent Statement

Not applicable.

Data Availability Statement

Data are contained within the article.

Acknowledgments

The authors would like to thank the editors and the anonymous reviewers for their crucial comments, which improved the quality of this paper.

Conflicts of Interest

The authors declare no conflicts of interest.

References

  1. Liang, F.; Liu, L. Quantitative Analysis of Human Disturbance Intensity of Landscape Patterns and Preliminary Optimization of Ecological Function Regions: A Case of Minqing County in Fujian Province. Resour. Sci. 2011, 33, 1138–1144. [Google Scholar]
  2. Han, W.; Chang, Y.; Hu, Y.; Li, X.; Bu, R. Research advance in landscape pattern optimization. Chin. J. Ecol. 2005, 12, 1487–1492. [Google Scholar]
  3. Hu, Y.; Batunacun. An Analysis of Land-Use and Land-Cover Change in the Zhujiang–Xijiang Economic Belt, China, from 1990 to 2017. Appl. Sci. 2018, 8, 1524. [Google Scholar] [CrossRef]
  4. Ma, L.; Bo, J.; Li, X.; Fang, F.; Cheng, W. Identifying key landscape pattern indices influencing the ecological security of inland river basin: The middle and lower reaches of Shule River Basin as an example. Sci. Total Environ. 2019, 674, 424–438. [Google Scholar] [CrossRef] [PubMed]
  5. Kuang, W.; Zhang, S.; Du, G.; Wu, S.; Li, R.; Lu, D.; Pan, T.; Ning, J.; Guo, C.; Dong, J.; et al. Remotely sensed mapping and analysis of spatio-temporal patterns of land use change across China in 2015–2020. Acta Geogr. Sin. 2022, 77, 1056–1071. [Google Scholar] [CrossRef]
  6. Liu, J.; Dong, C.; Sheng, L.; Liu, Y. Landscape Pattern Change of Marsh and Its Response to Human Disturbance in the Small Sanjiang Plain, 1955–2010. Sci. Geogr. Sin. 2016, 36, 879–887. [Google Scholar] [CrossRef]
  7. Zhu, C.; Zhang, X.; Zhou, M.; He, S.; Gan, M.; Yang, L.; Wang, K. Impacts of urbanization and landscape pattern on habitat quality using OLS and GWR models in Hangzhou, China. Ecol. Indic. 2020, 117, 106654. [Google Scholar] [CrossRef]
  8. OuYang, Z.; Li, X.; Xu, W.; Li, Y.; Zheng, H.; Wang, X. Ecological land use planning and management in Beijing. Acta Ecol. Sin. 2015, 35, 3778–3787. [Google Scholar] [CrossRef]
  9. Xiao, Y.; Zhu, F.; Zhou, S.; Shen, C.; Wang, J. Key Landscape Pattern Factors Affecting Land Ecological Quality in Developed Areas: A Case Study of Kunshan City in Jiangsu Province. J. Nat. Resour. 2017, 32, 1731–1743. [Google Scholar]
  10. Jalas, J. Hemerobic and hemerochoric plant species: An attempt at terminological reform. Acta Soc. Pro Fauna Flora Fenn. 1955, 72, 1–15. [Google Scholar]
  11. Wang, X.; Zhang, C.; Liao, Y.; Liu, G.; Wang, B.; Yu, J. Spatial and Temporal Characteristics of Hemeroby Degree in Guangdong-Hongkong-Macao Greater Bay Area During 1980–2018. Bull. Soil Water. Conserv. 2021, 41, 333–341. [Google Scholar] [CrossRef]
  12. Zhang, Q.; Chen, C.; Wang, J.; Yang, D.; Zhang, Y.; Wang, Z.; Gao, M. The spatial granularity effect, changing landscape patterns, and suitable landscape metrics in the Three Gorges Reservoir Area, 1995–2015. Ecol. Indic. 2020, 114, 106259. [Google Scholar] [CrossRef]
  13. Feng, Z.; Li, X.; Hu, j.; Wang, L. Analysis on the ecological security of the typical area in the eastern Qinghai-Tibet Plateau based on landscape pattern. Chin. J. Ecol. 2022, 41, 1188–1196. [Google Scholar] [CrossRef]
  14. Guo, S.; Bai, H.; Meng, Q.; Huang, X.; Qi, G. Landscape pattern change and its response to anthropogenic disturbance in the Qinling Mountains during 1980 to 2015. Chin. J. Appl. Ecol. 2018, 29, 4080–4088. [Google Scholar] [CrossRef]
  15. Wellmann, T.; Haase, D.; Knapp, S.; Salbach, C.; Selsam, P.; Lausch, A. Urban land use intensity assessment: The potential of spatio-temporal spectral traits with remote sensing. Ecol. Indic. 2018, 85, 190–203. [Google Scholar] [CrossRef]
  16. Zhou, Y.; Ning, L.; Bai, X. Spatial and temporal changes of human disturbances and their effects on landscape patterns in the Jiangsu coastal zone, China. Ecol. Indic. 2018, 93, 111–122. [Google Scholar] [CrossRef]
  17. Xie, R.; Shen, Y.; Lao, H. Dynamic changes and responses of coastal wetland landscape pattern based on human disturbance degree in Yancheng, Jiangsu Province, China. Chin. J. Ecol. 2022, 41, 351–360. [Google Scholar] [CrossRef]
  18. Gong, W.; Duan, X.; Mao, M.; Hu, J.; Sun, Y.; Wu, G.; Zhang, Y.; Xie, Y.; Qiu, X.; Rao, X.; et al. Assessing the impact of land use and changes in land cover related to carbon storage by linking trajectory analysis and InVEST models in the Nandu River Basin on Hainan Island in China. Front. Environ. Sci. Eng. 2022, 10, 1038752. [Google Scholar] [CrossRef]
  19. Liu, Y.; Jia, B.; Li, X.; Wu, J.; Meng, P.; Hong, W.; Zhao, C. Characteristic of nutrients and evaluation of heavy metal contamination on sediments among Xinpo pond, Nandu river in Hainan province. Trans. Chin. Soc. Agric. Eng. 2013, 29, 213–224. [Google Scholar]
  20. Chen, X.; Xie, G.; Zhang, J. Landscape ecological risk assessment of land use changes in the coastal area of Haikou City in the past 30 years. Acta Ecol. Sin. 2021, 41, 975–986. [Google Scholar] [CrossRef]
  21. Cao, C.; Sun, R.; Wu, Z.; Li, Q. Responses of Streamflow to Land Use/Cover Changes in Nandu River Basin Based on SWAT Model. Res. Soil Water Conserv. 2022, 29, 167–175. [Google Scholar] [CrossRef]
  22. Lei, J.; Chen, Y.; Chen, Z.; Chen, X.; Wu, T.; Li, Y. Spatiotemporal evolution of habitat quality in three basins of Hainan lsland based on InVEST model. Chin. J. Appl. Ecol. 2022, 33, 2511–2520. [Google Scholar] [CrossRef]
  23. Hao, X.; He, C.; Chu, K.; Shen, Z.; Zhao, Q.; Gao, W.; Pan, D.; Sun, H. The distribution pattern and biodiversity conservation of freshwater crabs in Hainan Island. Biodiv. Sci. 2021, 29, 605–616. [Google Scholar] [CrossRef]
  24. Wen, J.; Li, R. Temporal and spatial variation of ecosystem service value and its response to landscape pattern change in Guizhou Province, China. Chin. J. Appl. Ecol. 2022, 33, 3075–3086. [Google Scholar] [CrossRef]
  25. Wu, J. Landscape Ecology: Pattern, Process, Scale and Hierarchy; Higher Education Press: Beijing, China, 2007. [Google Scholar]
  26. Lü, L.; Zhang, J.; Peng, Q.; Ren, F.; Jiang, Y. Landscape pattern analysis and prediction in the Dongjiang River Basin. Acta Ecol. Sin. 2019, 39, 6850–6859. [Google Scholar] [CrossRef]
  27. Li, D.; Ding, S.; Liang, G.; Li, D.; Ding, S.; Liang, G.; Zhao, Q.; Tang, Q.; Kong, L. Landscape heterogeneity of mountainous and hilly area in the western Henan Province based on moving window method. Acta Ecol. Sin. 2014, 34, 3414–3424. [Google Scholar] [CrossRef]
  28. Liu, K.; Yang, Y.; Shi, R.; Li, Q.; Wu, B.; Zheng, H.; Mi, C. Yuqiao Reservoir watershed, landscape pattern, moving window analysis, Gray Relational analysis, driving force. J. Agric. Resour. Environ. 2023, 40, 154–164. [Google Scholar] [CrossRef]
  29. Feng, Z.; Zhang, J.; Hou, W.; Zhai, L. Dynamic changes of hemeroby degree based on the land cover classification: A case study in Beijing. Chin. J. Ecol. 2017, 36, 508–516. [Google Scholar] [CrossRef]
  30. Duan, X.; Gong, w.; Sun, Y.; Liu, T.; Qiu, X.; Zhang, Y. Land Use Change and Its Impact on Temporal and Spatial Evolution of Carbon Storage in Coastal Zone of Hainan Island. Bull. Soil Water Conserv. 2022, 42, 1–12. [Google Scholar] [CrossRef]
  31. Yang, A.; Zhu, L.; Chen, S.; Jin, H.; Xia, X. Geo-informatic spectrum analysis of land use change in the Manas River Basin, China during 1975-2015. Chin. J. Appl. Ecol. 2019, 30, 3863–3874. [Google Scholar] [CrossRef]
  32. Lu, C.; Zhou, H.; Zhang, F.; Dong, G.; Fu, J. Land Spatial Transformation Analysis in Shandong Province Based on Geo Information Map. Trans. Chin. Soc. Agric. Mach. 2021, 52, 222–230. [Google Scholar]
  33. Du, G.; Zhang, R.; Yu, F. Analysis of cropping pattern in black soil region of Northeast China based on geo-information Tupu. Chin. J. Appl. Ecol. 2022, 33, 694–702. [Google Scholar] [CrossRef]
  34. Zhang, W.; Lv, X.; Shi, Y.; Sun, P.; Zhang, Y. Graphic Characteristics of Land Use Transition in the Yellow River Basin. China Land Sci. 2020, 34, 80–88. [Google Scholar]
  35. Tian, Y.; Liu, B.; Hu, Y.; Xu, Q.; Qu, M.; Xu, D. Spatio-Temporal Land-Use Changes and the Response in Landscape Pattern to Hemeroby in a Resource-Based City. ISPRS Int. J. Geo-Inf. 2020, 9, 20. [Google Scholar] [CrossRef]
  36. Qiu, L.; Pan, Y.; Zhu, J.; Amable, G.S.; Xu, B. Integrated analysis of urbanization-triggered land use change trajectory and implications for ecological land management: A case study in Fuyang, China. Sci. Total Environ. 2019, 660, 209–217. [Google Scholar] [CrossRef] [PubMed]
  37. Liu, Z.; Wang, S.; Fang, C. Spatiotemporal evolution and influencing mechanism of ecosystem service value in the Guangdong-Hong Kong-Macao Greater Bay Area. Acta Geogr. Sin. 2021, 76, 2797–2813. [Google Scholar] [CrossRef]
  38. Danneyrolles, V.; Vellend, M.; Dupuis, S.; Boucher, Y.; Laflamme, J.; Bergeron, Y.; Fortin, G.; Leroyer, M.; de Römer, A.; Terrail, R.; et al. Scale-dependent changes in tree diversity over more than a century in eastern Canada: Landscape diversification and regional homogenization. J. Ecol. 2021, 109, 273–283. [Google Scholar] [CrossRef]
  39. Zhang, X.; Brandt, M.; Tong, X.; Ciais, P.; Yue, Y.; Xiao, X.; Zhang, W.; Wang, K.; Fensholt, R. A large but transient carbon sink from urbanization and rural depopulation in China. Nat. Sustain. 2022, 5, 321–328. [Google Scholar] [CrossRef]
  40. Morteo-Montiel, S.; Simms, S.R.; Porter-Bolland, L.; Bonilla-Moheno, M. Does the simplification of activity systems produce landscape homogenization? Environ. Dev. Sustain. 2021, 23, 5695–5714. [Google Scholar] [CrossRef]
  41. Solar, R.R.d.C.; Barlow, J.; Ferreira, J.; Berenguer, E.; Lees, A.C.; Thomson, J.R.; Louzada, J.; Maués, M.; Moura, N.G.; Oliveira, V.H.F.; et al. How pervasive is biotic homogenization in human-modified tropical forest landscapes? Ecol. Lett. 2015, 18, 1108–1118. [Google Scholar] [CrossRef]
  42. Luo, W.; Zhong, K.; Zhou, X.; Lu, C.; Xie, G.; Qiu, P.; Zhang, J. Urban expansion and ecological pattern evolution of coastal zone in Jiangdong New District of Haikou City in the past 30 vears. Acta Ecol. Sin. 2022, 42, 2164–2174. [Google Scholar] [CrossRef]
  43. McKinney, M.L. Urbanization as a major cause of biotic homogenization. Biol. Conserv. 2006, 127, 247–260. [Google Scholar] [CrossRef]
  44. Zhang, X.; Zhang, L.; Bai, L.; Liao, J.; Chen, B.; Yan, M. Assessment of Localized Targets of Sustainable Development Goals and Future Development on Hainan Island. Sustainability 2023, 15, 8551. [Google Scholar] [CrossRef]
  45. Sun, R.; Wu, Z.; Chen, B.; Yang, C.; Qi, D.; Lan, G.; Fraedrich, K. Effects of land-use change on eco-environmental quality in Hainan Island, China. Ecol. Indic. 2020, 109, 105777. [Google Scholar] [CrossRef]
  46. Ren, L.; Li, J.; Li, C.; Dang, P. Can ecotourism contribute to ecosystem? Evidence from local residents’ ecological behaviors. Sci. Total Environ. 2021, 757, 143814. [Google Scholar] [CrossRef] [PubMed]
  47. Wang, M.; Guo, Q.; Xie, J.; Wen, Y.; Wang, C. Allocation method of ecological compensation fund in Nandu River Basin based on concept of “water environment, water resources and water ecology”. Yangtze River 2023, 54, 60–65. [Google Scholar] [CrossRef]
  48. Wang, Z.; Ju, S.; Wang, C.; Zhu, H.; Wang, R. Temporal and Spatial Evolution of Landscape Pattern and Its Response to Human Disturbance in Jiangsu Province. Remote Sens. Technol. Appl. 2023, 38, 264–273. [Google Scholar]
  49. Bu, R.; Li, X.; Hu, Y.; Chang, Y.; He, H. Scaling effects on landscape pattern indices. Chin. J. Appl. Ecol. 2003, 12, 2181–2186. [Google Scholar]
  50. Hu, C.; Wu, W.; Zhou, X.; Wang, Z. Spatiotemporal changes in landscape patterns in karst mountainous regions based on the optimal landscape scale: A case study of Guiyang City in Guizhou Province, China. Ecol. Indic. 2023, 150, 110211. [Google Scholar]
Figure 1. Location and scope of the study area.
Sustainability 16 02724 g001
Figure 2. Spatial distribution of landscape types in the NRB from 1990 to 2020.
Sustainability 16 02724 g002
Figure 3. Characteristics of landscape level changes in the NRB from 1990 to 2020.
Sustainability 16 02724 g003
Figure 4. Change characteristics of LP index in the NRB from 1990 to 2020.
Sustainability 16 02724 g004
Figure 5. Distribution of hemeroby in the NRB from 1990 to 2020.
Sustainability 16 02724 g005
Figure 6. Variation trajectory of hemeroby in the NRB from 1990 to 2020.
Sustainability 16 02724 g006
Figure 7. Variations in the fluctuation spectrum in the NRB from 1990 to 2020.
Sustainability 16 02724 g007
Figure 8. Population and GDP statistics for 1990–2020 ((a) is the population statistics of NRB; (b) is the GDP statistics of the NRB; (c) is population and GDP statistics of Hainan Province).
Sustainability 16 02724 g008
Table 1. Landscape type AD index.
Landscape TypesDisturbance Index
Bare land, sand, and marsh1
Woodland, lake, canal, reservoir, and beach2
Shrubland and high-cover grassland3
Sparse woodland and medium-cover grassland4
Other woodland and low-cover grassland5
Paddy field, dry land, and rural settlement6
Urban land and other construction land7
Table 2. Area proportion of landscape types in the NRB from 1990 to 2020.
Landscape Type1990200020102020Dynamic Attitude/%
Area/km2Proportion/%Area/km2Proportion/%Area/km2Proportion/%Area/km2Proportion/%1990–20002000–20102010–2020
CroplandPaddy field787.6811.13794.2511.22795.2611.24787.2911.130.080.01−0.10
Dry land1177.2816.641151.4616.261137.8616.071114.9115.76−0.22−0.12−0.20
ForestWoodland2449.9234.622494.5035.252478.1835.022462.2734.800.18−0.07−0.06
Shrubland701.939.92718.4910.15707.8910.00695.269.830.24−0.15−0.18
Sparse woodland193.852.7210.042.97208.882.95204.252.890.84−0.06−0.22
Other woodland1071.7315.141089.6615.401092.1315.431080.9215.280.170.02−0.10
GrasslandHigh-cover grassland277.553.92208.172.94201.782.85211.462.99−2.50−0.310.48
Medium-cover grassland15.060.2114.930.2114.830.2115.260.22−0.09−0.070.29
Low-cover grassland19.070.273.050.043.050.042.970.04−8.40−0.02−0.27
Water bodyCanal44.080.6244.210.6246.210.6552.45 0.740.030.451.35
Lake0.110.000.110.000.110.000.110.00−0.220.080.31
Reservoir185.632.62165.032.33187.612.65189.482.68−1.111.370.10
Beach20.970.3028.920.4118.990.2715.570.223.79−3.43−1.80
Built-up landUrban land14.020.2036.310.5156.280.8084.191.1915.905.504.96
Rural settlement104.731.48101.891.44103.091.46109.41 1.55 −0.270.120.61
Other construction land7.970.1111.090.1623.000.3248.92 0.69 3.9110.7411.27
Unused landSand land1.760.021.340.021.330.021.10 0.02 −2.41−0.01−1.79
Marsh2.990.043.010.040.000.000.00 0.00 0.06−10.000.00
Bare land0.180.010.180.010.180.010.18 0.01 0.000.000.00
Table 3. Distribution statistics of hemeroby in the NRB from 1990 to 2020.
YearMinor DisturbanceLighter DisturbanceModerate DisturbanceHigher DisturbanceStrong Disturbance
Area/km2/%Area/km2/%Area/km2/%Area/km2/%Area/km2/%
19902487.2435.151107.89 15.661614.1422.811830.5825.8736.68 0.52
20002509.57 35.471114.80 15.751590.86 22.481798.51 25.4262.26 0.88
20102458.19 34.741122.09 15.861601.85 22.641809.56 25.5784.30 1.19
20202869.90 40.561285.54 18.171272.11 17.98959.45 13.56689.00 9.74
Table 4. Changes in the hemeroby map in the NRB from 1990 to 2020 (/km2).
Disturbance Types1990–20002000–20102010–2020
Minor disturbance → lighter disturbance (12)33.02 55.10 190.18
Minor disturbance → moderate disturbance (13)3.677.41 157.68
Minor disturbance → higher disturbance (14)0.00 0.00 94.95
Minor disturbance → strong disturbance (15)0.00 3.65 66.05
Lighter disturbance → minor disturbance (21)51.3614.76 187.08
Lighter disturbance → moderate disturbance (23)40.3529.29 205.38
Lighter disturbance → higher disturbance (24)0.00 11.05 98.99
Lighter disturbance → strong disturbance (25)0.00 3.70 91.91
Moderate disturbance → minor disturbance (31)7.340.00 285.74
Moderate disturbance → lighter disturbance (32)58.70 11.00 282.09
Moderate disturbance → higher disturbance (34)58.7029.40 249.26
Moderate disturbance → strong disturbance (35)0.00 3.70 205.10
Higher disturbance → minor disturbance (41)0.00 0.00 414.62
Higher disturbance → lighter disturbance (42)3.670.00 289.89
Higher disturbance → moderate disturbance (43)58.7018.40 359.74
Higher disturbance → strong disturbance (45)29.3514.59 260.20
Strong disturbance → minor disturbance (51)0.00 0.00 7.30
Strong disturbance → lighter disturbance (52)0.00 0.00 3.65
Strong disturbance → moderate disturbance (53)0.00 0.00 3.65
Strong disturbance → higher disturbance (54)3.673.59 3.65
Table 5. Correlation matrix between hemeroby and LP indices.
Disturbance TypeCorrelation CoefficientLPIEDLSIMPSSHEIAI
Minor disturbancePearson correlation
Significance
(two tails)
−0.987 *−0.8620.6680.6570.729−0.626
0.0130.1380.3320.3430.2710.374
Lighter disturbancePearson correlation
Significance
(two tails)
−1.00 **−0.8550.6250.6140.8310.581
0.000.1450.3750.3860.1690.419
Moderate disturbancePearson correlation
Significance
(two tails)
0.998 **0.856−0.651−0.64−0.7910.608
0.0020.1440.3490.360.2090.392
Higher disturbancePearson correlation
Significance
(two tails)
0.999 **0.862−0.639−0.627−0.8010.595
0.0010.1380.3610.3730.1990.405
Strong disturbancePearson correlation
Significance
(two tails)
−1.00 **−0.8560.6270.6160.827−0.583
0.000.1440.3730.3840.1730.417
Note: * indicates significant correlation at the 0.05 level (two tails); ** indicates significant correlation at the 0.01 level (two tails).
Disclaimer/Publisher’s Note: The statements, opinions and data contained in all publications are solely those of the individual author(s) and contributor(s) and not of MDPI and/or the editor(s). MDPI and/or the editor(s) disclaim responsibility for any injury to people or property resulting from any ideas, methods, instructions or products referred to in the content.

