Article

Biomonitoring: Developing a Beehive Air Volatiles Profile as an Indicator of Environmental Contamination Using a Sustainable In-Field Technique

1
Center for Sensing Technologies, BioSense Institute, University of Novi Sad, 21000 Novi Sad, Serbia
2
Department of Environmental Engineering and Occupational Safety and Health, Faculty of Technical Science, University of Novi Sad, 21000 Novi Sad, Serbia
*
Authors to whom correspondence should be addressed.
Sustainability 2024, 16(5), 1713; https://doi.org/10.3390/su16051713
Submission received: 9 January 2024 / Revised: 9 February 2024 / Accepted: 13 February 2024 / Published: 20 February 2024
(This article belongs to the Special Issue A Multidisciplinary Approach to Sustainability)

Abstract

:
The wellbeing of the honey bee colonies and the health of humans are connected in numerous ways. Therefore, ensuring the wellbeing of bees is a crucial component of fostering sustainability and ecological harmony. The colony collapse disorder (CCD) phenomenon was first reported in 2006 when the majority of bee colonies in Europe died out, due to an increase in infections, contamination of hives with agrochemical pesticides, and persistent organic pollutants (POPs). Only 6 years after the emergence of CCD, more than 6.5 million premature deaths were reported, as a consequence of persistent human exposure to air pollution. The insect species such as the honey bee Apis mellifera L. and the air matrix inside the beehive can be used as tools in biomonitoring, instead of traditional monitoring methods. This may have advantages in terms of cost-effective bioindicators of the environmental health status, showing the ability to record spatial and temporal pollutant variations. In this study, we present the sustainable in-field usage of the portable membrane inlet mass spectrometry (MIMS) instrument for an instant and effective determination of the level of environmental pollution by analytical identification of hive atmosphere volatile organic compound (VOC) contaminants, polycyclic aromatic hydrocarbons (PAHs), polychlorinated biphenyls (PCBs), monocyclic aromatic hydrocarbons (BTEX) compounds, and pesticides. The samples were taken from hives located in urbanized and rural regions, highlighting variations in contamination. The MIMS results were benchmarked against a conventional laboratory sampling technique, such as GC-MS.

1. Introduction

1.1. Surveillance and Assessment of Bee Colony Health

Bees are a wonder of evolution and are indispensable for mankind and animals. They are part of the biodiversity on which we all depend for our survival. Honey bees provide essential environmental services, pollinating both agricultural and natural ecosystems that are crucial for human health. The wellbeing of the bee colony and the health of humans are connected in numerous ways, necessitating responsibility and commitment for the sake of a healthy environment. Approximately 87.5% of flowering plants and, consequently 35% of global food products for human consumption, depend on effective pollination [1]. The positive impact of bee pollination extends beyond food production, enhancing the quality, shelf-life, and economic value of crops. Honey, a plentiful byproduct from various wild and domesticated social bees, has been cherished by humanity for millennia due to its nutritional and medicinal properties. Social and cultural significance worldwide is attached to hive bees [2]. Given their profound value to humanity, the imperative to comprehend and support bees persists. A key approach to advancing our understanding involves researching, comprehending, and actively monitoring their behavior and health, whether in the wild or within managed colony hives. This ongoing effort is vital for sustaining the crucial role that bees play in our ecosystems. This has, arguably, never been more important than today when native and wild pollinator insects face serious anthropogenic obstacles, including pesticide use, agricultural intensification, habitat loss, climate change, and extreme weather events [3,4]. Comprehending bee behaviors like swarming, absconding, clustering, fanning, and foraging holds significant practical value for bee pollination management. It contributes to valuable research for entomologists and promotes conservation, aiding those dedicated to biodiversity maintenance and the sustainability of the natural ecosystem [5]. Although it is difficult to identify any consensus definition of hive health, many studies tried to assess or predict hive health using measurable proxies. Internal hive conditions such as temperature, carbon dioxide (CO2) concentration, humidity, audio, and weight have been used extensively as proxies for hive health [6]. In addition to internal hive conditions, in-hive products, the presence of the queen, the state of the environment around the hive, bee behavior, bee communication through pheromones, sound and vibration, and beekeeping technique are indicators and factors with high relevance, high technical feasibility, and high priority to include in field surveys when assessing the health status of managed honey bee colonies in a holistic manner [7].
Essential for beekeepers is the examination of the queen bee’s health and egg-laying capability. This involves inspecting hive frames by opening the hive. The absence of eggs or larvae signals potential issues—the queen bee might be deceased, unwell, or absent from the hive. Regular checks are crucial for maintaining a thriving bee colony and addressing any concerns promptly [8]. In critical scenarios, the entire swarm’s survival is at risk, necessitating swift intervention. The absence of reproduction, resulting from the demise or incapacity of the queen bee, leads to a lack of younger bees to replace the aging ones. Detecting the absence of a healthy queen bee is imperative and should be promptly addressed. However, frequent hive inspections, especially when the queen bee is present, can disrupt the bee family, inducing stress and anxiety. To mitigate such disturbances, a non-invasive method becomes essential, enabling the timely detection of changes within the hive without compromising the overall wellbeing of the bee colony [9].
Honey bees use vibration and sound signals to exchange information among themselves. Gross motions of the body, wing movements, high-frequency muscle contractions without wing movements, and pressing the thorax against the substrate or another bee are some of the ways honey bees make noise [10]. Moreover, the sound patterns within the beehive serve as valuable indicators of the bee community’s health.
Various chemical compounds elicit distinct sounds from honey bees within the hive. Monitoring these sound variations allows the identification of contaminants, offering a method to track changes in beehive acoustics. This approach extends beyond air quality, as hive sounds can effectively monitor pollution in water and soil. The ability to utilize beehive sounds for multi-environmental pollution monitoring highlights its versatility in safeguarding the wellbeing of bee colonies and environmental ecosystems [8]. Assessing the health status of managed honey bee colonies is a complex, integral, and multi-factorial process, where all parameters are strongly connected, in both ways—from the hive to the environment and the other way around. Defining the health status of the beehive, using different techniques (visual, manual, analytical, sensor based, etc.) starts with the selection of indicators and factors with high relevance, technical feasibility, and high priority for the overall wellbeing of the colony. All indicators can be divided into those with external and internal impacts. The external ones would be beekeeping management practices, resource providing units, environmental drivers, and contamination. The internal influences include in-hive conditions, development of in-hive products, disease, infection, infestation, behavior, physiology, and demography [11].
In this study, a sustainable and up-to-date biomonitoring approach is presented as well as the in-field use of the portable membrane inlet mass spectrometry (MIMS) instrument for the instant and effective determination of the level of environmental pollution through an analytical identification of hive atmosphere volatile organic compound (VOC) contaminants, contained in polycyclic aromatic hydrocarbons (PAHs), polychlorinated biphenyls (PCBs), and pesticides. In order to highlight additional differences in contamination, samples were collected from beehives located in urban areas. The MIMS results are compared to those obtained using a common laboratory sample method, such as GC-MS.

1.2. Interaction and Influences between the Bee Colony and Environment

The quality and features of hive surroundings are of great importance and have a high impact on the overall health of the bee colony. Some of the outdoor environmental parameters that are easy to measure and can affect the development, productivity, and functioning of bees are temperature, relative humidity, solar radiation, total precipitation, and climate type. Honey bees have a strong interaction with nearby vegetables, air, soil, and water. As a result, toxins from these sources are transferred to the honey bees and the products of the hive. Honey bees and honey have been marked over the past century as potential bioindicators for the assessment of the environmental status of the region surrounding the hive. Therefore, the level and type of contamination of the surrounding water, soil, and air are one of the main stressors of bee colonies [12]. Conversely, employing honey bees as environmental and ecological bioindicators is gaining traction, offering a means to collect qualitative and quantitative environmental data based on the species’ consistent reactions to environmental shifts. Honey bees exhibit a remarkable ability to sense chemical signals and detect vapor concentrations as low as a few parts per trillion. Their extensive foraging range, spanning 5.5 km to 9.5 km, allows them to bring various materials, including pollen, nectar, resin, and water, back to a central hive. This makes honey bees valuable contributors to understanding and monitoring environmental changes [12,13]. This makes honey bees an excellent environmental bioindicator species.
In recent times, bees have served as effective monitors for heavy metals like mercury, chromium, cadmium, and lead in both urban areas and natural reserves. Their role extends to sampling airborne particulate matter (PM), aiding in comprehending environmental pollution levels. Additionally, bees play a crucial role in monitoring agricultural pesticide residue, contributing to a comprehensive understanding of environmental conditions [14]. Additionally, a comprehensive review in the literature [12] outlines the extensive applications of honey bee biomonitoring for assessing environmental contaminants, plant and pollinator pathogens, climate change, and antimicrobial resistance. Diverse approaches to environmental and ecological monitoring involve exploring beehive sound emissions. Utilizing machine learning techniques, such as in the detection of air pollutants [15], further enhances the role of honey bees in providing valuable insights into environmental conditions.

1.3. Persistent Chemicals and Airborne Particulate Matter in the Environment

Environmentally persistent pollutants, particle matter (PM), and other air contaminants are a major global issue associated with lung cancer and respiratory illnesses. Persistent organic pollutants (POPs), often known as environmentally persistent compounds, are contaminants that are of concern worldwide. These substances can travel great distances in water or air and withstand environmental deterioration. Furthermore, there is a wealth of evidence that suggests migratory species are responsible for the bioaccumulation, biomagnification, and biotransport of these substances [16]. These characteristics, in addition to their toxicity, make the development of trustworthy POP monitoring methods crucial.
Numerous studies in the literature endorse the utilization of honey bees and their hive matrices for evaluating polychlorinated biphenyls (PCBs) and polycyclic aromatic hydrocarbons (PAHs) as persistent organic pollutants (POPs). PCBs, synthetic organochlorine compounds, emanate from contaminated lakes, outdated electrical equipment landfills, and municipal waste incineration. PCB accumulation in human tissues poses health risks, including immune system suppression, increased cardiovascular disease, and cancer. According to the literature [17], assessing bee-related matrices revealed honey bees as the most PCB-polluted group, followed by honey and bee-collected pollen. PCBs exhibit low concentrations in bee pollen due to limited absorption into plant vascular systems and low water solubility. During periods of hot, dry weather, forager bee PCB concentrations were at their maximum because of the increased evaporation of PCBs from contaminated soil, which exposed them to higher levels of PCBs in the air. A recent correlation study, analyzing PCB levels obtained through passive air samplers (PASs) and bee-related materials, proposed bees and honey samples as viable alternatives for monitoring atmospheric contaminants. The previously mentioned research which recently suggested that utilizing bees and honey can provide an effective and alternative method to passive air samplers in assessing and tracking environmental pollutants.
Another form of air pollution that naturally occurs in coal, crude oil, and gasoline is called polycyclic aromatic hydrocarbons (PAHs). Vehicle exhaust, cigarette smoke, wood burning, and fumes from asphalt roads all contribute to the emission of PAHs into the atmosphere. Some PAHs are thought to cause cancer and irritate the eyes and lungs. French apiaries were tested for PAH levels using pollen, honey, and bees, according to [18]. They showed that bees were the most accurate predictors of PAH pollution in the environment and that the location of the apiary affected the amount of PAHs found. Al-Alam et al. (2019) [19] analyzed PAHs in honey samples from all over Lebanon and showed that measurements in honey could be used to determine PAH sources, such as gasoline or diesel emissions. Several PAHs were found by Perugini et al. (2009) [20] in worker honey bees and honey that was gathered from two different Italian areas.

2. Materials and Methods

2.1. Instrumentation

This research is based on the use of portable membrane inlet mass spectrometry (MIMS) technique. In this study, a portable mass spectrometry system was utilized, comprising a membrane sample inlet, a Prisma Plus® compact mass spectrometer (Pfeifer Vacuum Gmbh, Asslar, Germany), a vacuum system with a diaphragm and turbo pumps, and a laptop PC for data acquisition and processing. The mass spectrometer features a closed electron impact (EI) HS-gas tight ion source with yttriated iridium filaments, a 100 mm long single quadrupole mass analyzer (QMS 200), and a dual detector (Faraday cup and secondary electron multiplier). The electronic control unit (ECU)—QME 220 M3 ensures efficient operation. Specifically designed for partial pressure analysis below 10−4 mbar, this mass spectrometer delivers unit resolution, rapid response times (≤0.5 s), and precise measurements at low concentration levels (parts per billion) throughout the entire working mass range.
Benchmarking analysis was performed using gas chromatography–mass spectrometry, Agilent Technologies 7890A GC System, with an EI source; headspace sampler: Agilent 7694E; 22 mL headspace bottle; 10 uL microinjector. Gas chromatography–mass spectrometry conditions were: chromatographic column: DB-5 ms (30 m × 250 µm × 0.25 µm), Agilent J&W, Santa Clara, CA, USA.

2.2. Sample Collection and Measurement

The samples from 4 beehives were taken in-field by using the MIMS instrument (Figure 1) in the period from June to August. Air from the hive was taken through a polypropylene tube that connected the MIMS instrument with the central part of the hive. The sampling point from the hive was determined by previous analyses of the concentration distribution of compounds in the gas matrix inside the hive. The process of sampling a single beehive typically consumes an average duration of approximately 45 min, correlating with 15 recording cycles on the MIMS device, within the spectral range of 0 to 300 m/z. Samples were taken twice a month for 4 months. The GC-MS benchmarking method was based on sampling with Orbo 32 active charcoal tubes, which were later extracted with dichloromethane (CH2Cl2). An aliquot of the sample was transferred to a headspace vial and heated/agitated to drive volatile analytes into the headspace of the vial. A portion of the headspace was transferred to a gas chromatograph where the compounds were separated and then detected by GC-MS.

3. Results

This study aimed to investigate the chemical composition of beehive air, examining various components potentially causing beehive contamination and posing environmental harm. The MIMS analytical method and GC-MS technique led to the identification of 120 volatile components categorized as alcohols, aldehydes, esters, ethers, hydrocarbons, phenols, ketones, terpenes, pesticides, PAHs, and BTEX compounds (Benzene, Toluene, Ethylbenzene, and Xylenes). The compounds that are separated from all the detected compounds are indicators of the state of contamination of the environment and are shown in Table 1 with a display of the retention time and the class they belong to.
The mass spectrum of VOCs from beehive air samples, recorded by the MIMS device, in the first phase of the research, indicates the presence of PAHs (Indane, 1H-Indene, 2,3-dihydro-5-methyl), pesticides (Carbofuran, Lindane, 6-Methoxybenzofuroxan), and BTEX compounds (Toluene, p-ethyl-, Toluene, o-ethyl, p-Xylene, o-Diethylbenzene, m-Xylene). Figure 2 illustrates part of the mass spectrum of the atmosphere in the hives, which indicates the presence of p-Xylene with its characteristic 91 m/z (mass number/charge number) peak and peak abundance (ion current).
During the course of this study, thirty-two samples from beehives underwent scrutiny, revealing the presence of pesticides in six samples, PAHs in seven samples, and BTEX compounds in nineteen samples (Figure 3).
The geographical coordinates of the site housing the scrutinized beehives are denoted as 45°15′10.1″ N latitude and 19°45′21.3″ E longitude, situated in Veternik, Novi Sad, Serbia. For the beehives’ location of interest for this research, the utilization of USGS (United States Geological Survey) and Global Croplands data proves invaluable in assessing the surface of human settlements for the dispersion of BTEX in air spread assessments (Figure 4 and Figure 5) [21]. One significant advantage lies in the detailed and accurate land cover information provided by USGS, allowing for a precise characterization of the urban landscape. This information is crucial for identifying potential emission sources and understanding how human activities, such as industrial facilities or vehicular traffic, contribute to BTEX levels in the air.
According to the satellite map in Figure 4 and Landsat-derived global rainfed, irrigated, and human settlement area near the beehives’ location in Figure 5, the examined beehives are located in a primarily urban area with a high number of households (buildings and houses), traffic intersections, vehicles, small and large commercial enterprises, warehouses, and gas stations.
Based on the spatial analysis of the location of the beehives, three critical sources contribute to the potential spread of Benzene, Toluene, Ethylbenzene, and Xylenes (BTEX) compounds, which include the following:
  • The presence of gas stations—Three gas stations are situated at a distance of 500 m, 1.3 km, and 2.6 km from the beehives’ location. Gas stations are notorious sources of BTEX compounds due to the release of gasoline vapors during fueling and handling [22]. The cumulative emissions from several gas stations near to the examined location can contribute to elevated BTEX levels in the air;
  • The utilization of coal for heating in residential areas—Heating in residential areas using coal is another major contributor to BTEX dispersion [23]. In areas where beehives are located, coal is a prevalent heating source. As a result, residents and the environment may be exposed to BTEX compounds through the air, affecting both indoor and outdoor air quality;
  • The high traffic volume—Less than 1 km from the location of the beehives there are over eight crossroads, a roundabout, bus stations, and a traffic road that is used by passenger vehicles, light trucks, heavy trucks, buses, and other types of motor vehicles. Traffic-related air pollution is a well-documented concern, and areas with heavy traffic are prone to elevated BTEX concentrations, posing health risks [24,25].
The combination of previously mentioned key sources creates a potential hotspot for BTEX compound exposure in the immediate vicinity of the analyzed beehives. Monitoring and addressing these sources are crucial for mitigating the environmental and public health risks associated with BTEX compounds, emphasizing the importance of sustainable practices, alternative energy sources, and effective pollution control measures in the affected area.
Furthermore, pesticides have also been identified in beehive biomonitoring results. Although the analyzed beehives are in a mainly urban environment, about 1.5 km in distance, there is a large area of cultivated agricultural land. Based on the previously mentioned data that bees can fly up to 9.5 km away from their hive, it can be deduced that the pesticides found in the beehives originate from the agricultural land that surrounds the urban area. Unintentional pesticide application in small urban areas, including lawns and gardens [26], poses a significant threat to the environment, organisms, and food safety, emphasizing the importance of evaluating diverse pollutant sources in urban settings.

4. Discussion

In our quest for sustainable living, biomonitoring has emerged as a crucial tool. The use of bees in environmental biomonitoring coupled with up-to-date analytical techniques such as MIMS, has proven to be both useful and advantageous, offering a unique perspective on the health of our ecosystems. One of the key advantages of bee biomonitoring lies in its cost-effectiveness and efficiency. Bees effortlessly cover vast areas in their foraging expeditions, providing a broad and comprehensive overview of the environmental conditions. This method allows for real-time data collection, offering a dynamic snapshot of the ecosystem’s health. Moreover, bees act as sensitive indicators of environmental stressors. Pesticides, pollutants, and changes in land use can affect bee colonies, leading to observable alterations in their behavior, physiology, and overall wellbeing. By closely monitoring these changes, scientists can pinpoint potential environmental threats and implement timely interventions to mitigate damage. Furthermore, the biomonitoring of PAHs, BTEX, POPs, PCB, etc., compounds play a critical role in environmental science and public health. The application of a portable MIMS device within biomonitoring is also important in the field of regulatory compliance and early warning systems.
  • Regulatory Compliance: Monitoring PAHs and BTEX compounds is often a regulatory requirement to ensure compliance with environmental standards. Biomonitoring data provides valuable information for authorities to assess whether industries and regions are meeting acceptable levels of pollutant concentrations. This information is crucial for implementing and enforcing environmental policies.
  • Early Warning System: Biomonitoring serves as an early warning system for potential environmental and public health crises. Detecting elevated levels of PAHs and BTEX compounds in biological samples can signal the need for prompt intervention and remediation efforts to prevent further contamination and mitigate potential health risks.
This proactive approach allows for informed decision-making, source identification, and the development of effective strategies to mitigate pollution and safeguard both ecosystems and human wellbeing. By integrating these insights, society can foster sustainable practices and fortify the delicate interplay between environmental health and human prosperity.
Furthermore, the dispersion of BTEX compounds in the air depends on various factors, and it is influenced by the specific characteristics of each compound. The distance BTEX compounds can travel from their source is determined by the following factors such as: volatility, meteorological conditions, topography, emission characteristics, chemical properties, and urban density. Given these variables, it is challenging to provide a specific distance that BTEX compounds can travel universally. In some cases, elevated concentrations may be observed closer to the source, while in other situations, atmospheric conditions may allow for the transport of pollutants over longer distances. Understanding the diverse sources of BTEX compounds in urban areas is crucial for implementing effective air quality management strategies. Mitigation efforts often involve regulatory measures, technological advancements in emissions controls, and public awareness campaigns to reduce exposure and enhance the overall environmental quality in urban settings.
Global Croplands data enhances the assessment by offering insights into agricultural practices and land use patterns, which can influence different pollutant emissions [27]. For instance, pesticide application in farming areas or storage facilities for agricultural chemicals may contribute to their spreading in the environment, as well as elevating BTEX concentrations. Integrating this information aids in a comprehensive analysis of the spatial distribution of pesticides and BTEX compounds and potential exposure risks in and around human settlements.
Furthermore, the temporal and spatial resolutions of these datasets enable researchers and policymakers to monitor changes over time and make informed decisions regarding land use planning and environmental management. The combination of USGS and Global Croplands data, therefore, empowers stakeholders to implement targeted measures for reducing emerging pollutant emissions, safeguarding public health, and enhancing the overall sustainability of urban environments.

5. Conclusions

This groundbreaking study marks a pivotal stride in the realm of biomonitoring, specifically focusing on gauging contamination in the vicinity of beehives through the application of non-invasive and sustainable in-field analytical methods. The pivotal role played by portable membrane inlet mass spectrometry during the experiment cannot be overstated, emerging as a swift, highly efficient, and straightforward means of identifying volatile organic compounds within the beehive’s atmosphere. Among the extensive array of 120 compounds discovered within urban beehives, the top 10 recurrent compounds took precedence in analysis, shedding light on the prevalent environmental contaminants. By isolating these compounds, predominantly encompassing polycyclic aromatic hydrocarbons, monocyclic aromatic hydrocarbons, and pesticides, the study unveils the beehive air volatiles profile as a potent indicator of environmental contamination. This revelation underscores the imperative need for heightened environmental awareness and proactive measures to mitigate the detrimental impact on bee colonies and, consequently, ecosystem health. As we delve deeper into comprehending these intricate dynamics, our understanding of sustainable practices is enriched, paving the way for a harmonious coexistence between human activities and the delicate balance of nature.

Author Contributions

D.I.—conceptualization, methodology, investigation, formal analysis, visualization, writing—original draft, writing—review and editing. B.B.—supervision, conceptualization, methodology, writing—original draft, writing—review and editing. M.T.S.—visualization, writing—review and editing. All authors have read and agreed to the published version of the manuscript.

Funding

This research is supported by the ‘Horizon 2020’ ANTARES project under Grant Agreement Number 739570 (https://doi.org.10.3030/739570). Daria Ilić acknowledges the financial support of the Ministry of Education, Science, and Technological Development of the Republic of Serbia (Grant No. 451-03-47/2023-01/200358).

Institutional Review Board Statement

The ethical review and approval for this study were exempted, as the experiment focused on bees without directly performing any procedures on them or disrupting their cardiac rhythm and normal functioning. The investigation specifically centered around the air within the beehive, and the analysis was conducted in a non-invasive manner.

Informed Consent Statement

This study did not involve humans or experiments on humans.

Data Availability Statement

The data cannot be made publicly available upon publication due to legal restrictions preventing unrestricted public distribution. The data that support the findings of this study are available upon reasonable request from the authors.

Acknowledgments

The authors would like to acknowledge all people who were involved in this study: Đorđe Vujić, Đorđe Mrkić, and Branko Šikoparija. The experiment would not have been possible without the lending of the beehives from Đorđe Mrkić, to whom the authors are grateful.

Conflicts of Interest

The authors have no competing interests to declare that are relevant to the content of this article.

References

  1. Hung, K.-L.J.; Kingston, J.M.; Albrecht, M.; Holway, D.A.; Kohn, J.R. The worldwide importance of honey bees as pollinators in natural habitats. Proc. Biol. Sci. 2018, 285. [Google Scholar] [CrossRef]
  2. Prendergast, K.S.; Garcia, J.E.; Howard, S.R.; Ren, Z.-X.; McFarlane, S.J.; Dyer, A.G. Bee Representations in Human Art and Culture through the Ages. Art Percept. 2021, 10, 1–62. [Google Scholar] [CrossRef]
  3. Goulson, D.; Nicholls, E.; Botías, C.; Rotheray, E.L. Bee declines driven by combined stress from parasites, pesticides, and lack of flowers. Science 2015, 347, 1255957. [Google Scholar] [CrossRef]
  4. Gill, R.J.; Ramos-Rodriguez, O.; Raine, N.E. Combined pesticide exposure severely affects individual- and colony-level traits in bees. Nature 2012, 491, 105–108. [Google Scholar] [CrossRef] [PubMed]
  5. Amsalem, E.; Grozinger, C.M.; Padilla, M.; Hefetz, A. The physiological and genomic bases of bumble bee social behaviour. In Genomics, Physiology and Behaviour of Social Insects; Advances in Insect Physiology; Elsevier: Amsterdam, The Netherlands, 2015; Volume 48, pp. 37–93. ISBN 9780128021576. [Google Scholar]
  6. Tashakkori, R.; Hamza, A.S.; Crawford, M.B. Beemon: An IoT-based beehive monitoring system. Comput. Electron. Agric. 2021, 190, 106427. [Google Scholar] [CrossRef]
  7. Souza Cunha, A.E.; Rose, J.; Prior, J.; Aumann, H.M.; Emanetoglu, N.W.; Drummond, F.A. A novel non-invasive radar to monitor honey bee colony health. Comput. Electron. Agric. 2020, 170, 105241. [Google Scholar] [CrossRef]
  8. Yu, B.; Huang, X.; Sharif, M.Z.; Jiang, X.; Di, N.; Liu, F. A matter of the beehive sound: Can honey bees alert the pollution out of their hives? Environ. Sci. Pollut. Res. Int. 2023, 30, 16266–16276. [Google Scholar] [CrossRef] [PubMed]
  9. Cejrowski, T.; Szymański, J.; Mora, H.; Gil, D. Detection of the bee queen presence using sound analysis. In Intelligent Information and Database Systems; Nguyen, N.T., Hoang, D.H., Hong, T.-P., Pham, H., Trawiński, B., Eds.; Lecture Notes in Computer Science; Springer International Publishing: Cham, Swizterland, 2018; Volume 10752, pp. 297–306. ISBN 978-3-319-75419-2. [Google Scholar]
  10. Kirchner, W.H. Acoustical communication in honeybees. Apidologie 1993, 24, 297–307. [Google Scholar] [CrossRef]
  11. EFSA Panel on Animal Health and Welfare (AHAW). Assessing the health status of managed honeybee colonies (HEALTHY-B): A toolbox to facilitate harmonised data collection. EFSA J. 2016, 14, e04578. [Google Scholar] [CrossRef]
  12. Cunningham, M.M.; Tran, L.; McKee, C.G.; Ortega Polo, R.; Newman, T.; Lansing, L.; Griffiths, J.S.; Bilodeau, G.J.; Rott, M.; Marta Guarna, M. Honey bees as biomonitors of environmental contaminants, pathogens, and climate change. Ecol. Indic. 2022, 134, 108457. [Google Scholar] [CrossRef]
  13. Bromenshenk, J.J.; Henderson, C.B.; Seccomb, R.A.; Welch, P.M.; Debnam, S.E.; Firth, D.R. Bees as Biosensors: Chemosensory Ability, Honey Bee Monitoring Systems, and Emergent Sensor Technologies Derived from the Pollinator Syndrome. Biosensors 2015, 5, 678–711. [Google Scholar] [CrossRef]
  14. Niell, S.; Jesús, F.; Pérez, N.; Pérez, C.; Pareja, L.; Abbate, S.; Carrasco-Letelier, L.; Díaz, S.; Mendoza, Y.; Cesio, V.; et al. Neonicotinoids transference from the field to the hive by honey bees: Towards a pesticide residues biomonitor. Sci. Total Environ. 2017, 581–582, 25–31. [Google Scholar] [CrossRef]
  15. Zhao, Y.; Deng, G.; Zhang, L.; Di, N.; Jiang, X.; Li, Z. Based investigate of beehive sound to detect air pollutants by machine learning. Ecol. Inform. 2021, 101246. [Google Scholar] [CrossRef]
  16. Jones, K.C. Persistent organic pollutants (pops) and related chemicals in the global environment: Some personal reflections. Environ. Sci. Technol. 2021, 55, 9400–9412. [Google Scholar] [CrossRef]
  17. Sari, M.F.; Esen, F.; Tasdemir, Y. Levels of polychlorinated biphenyls (PCBs) in honeybees and bee products and their evaluation with ambient air concentrations. Atmos. Environ. 2021, 244, 117903. [Google Scholar] [CrossRef]
  18. Lambert, O. Contamination Chimique de Matrices Apicoles au Sein de Ruchers Appartenant à des Structures Paysagères Différentes. Undergraduate Thesis, Université Blaise Pascal, Clermont-Ferrand, France, 2012. [Google Scholar]
  19. Al-Alam, J.; Fajloun, Z.; Chbani, A.; Millet, M. Determination of 16 PAHs and 22 PCBs in honey samples originated from different region of Lebanon and used as environmental biomonitors sentinel. J. Environ. Sci. Health Part A 2019, 54, 9–15. [Google Scholar] [CrossRef]
  20. Perugini, M.; Di Serafino, G.; Giacomelli, A.; Medrzycki, P.; Sabatini, A.G.; Persano Oddo, L.; Marinelli, E.; Amorena, M. Monitoring of polycyclic aromatic hydrocarbons in bees (Apis mellifera) and honey in urban areas and wildlife reserves. J. Agric. Food Chem. 2009, 57, 7440–7444. [Google Scholar] [CrossRef] [PubMed]
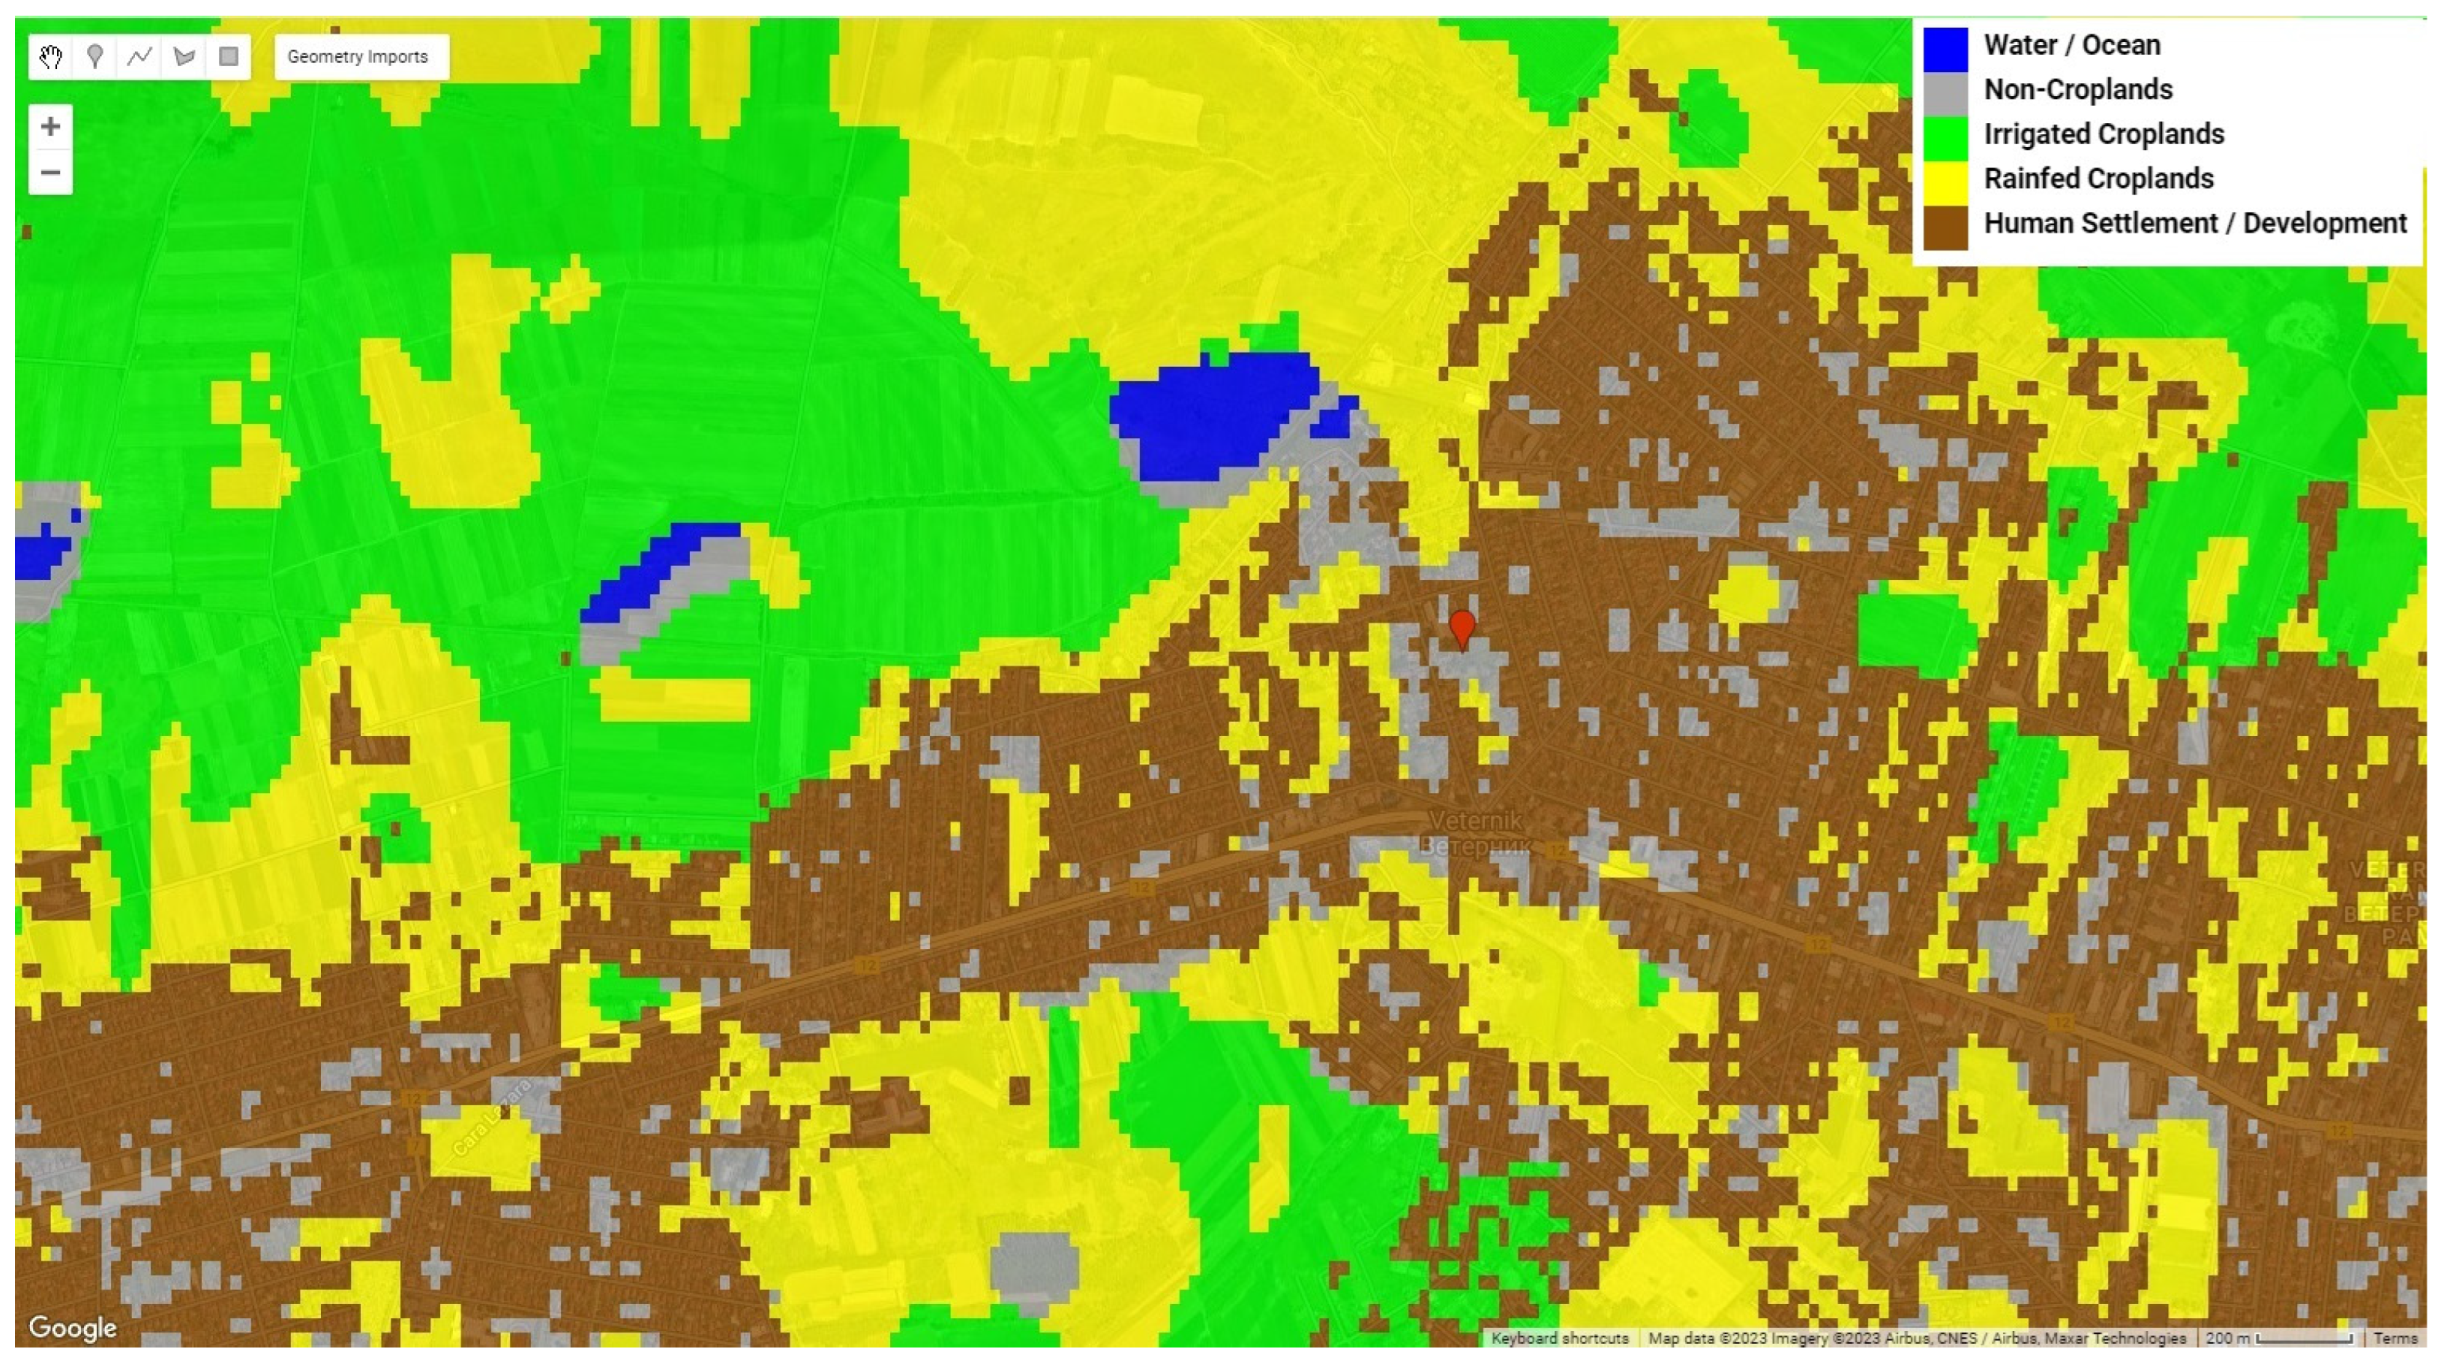
  21. Global Croplands. Available online: https://www.usgs.gov/apps/croplands/app/map?lat=0&lng=0&zoom=2 (accessed on 5 January 2024).
  22. Correa, S.M.; Arbilla, G.; Marques, M.R.C.; Oliveira, K.M.P.G. The impact of BTEX emissions from gas stations into the atmosphere. Atmos. Pollut. Res. 2012, 3, 163–169. [Google Scholar] [CrossRef]
  23. Mokammel, A.; Rostami, R.; Niazi, S.; Asgari, A.; Fazlzadeh, M. BTEX levels in rural households: Heating system, building characteristic impacts and lifetime excess cancer risk assessment. Environ. Pollut. 2022, 298, 118845. [Google Scholar] [CrossRef] [PubMed]
  24. Phuc, N.H.; Kim Oanh, N.T. Determining factors for levels of volatile organic compounds measured in different microenvironments of a heavy traffic urban area. Sci. Total Environ. 2018, 627, 290–303. [Google Scholar] [CrossRef] [PubMed]
  25. Buczynska, A.J.; Krata, A.; Stranger, M.; Locateli Godoi, A.F.; Kontozova-Deutsch, V.; Bencs, L.; Naveau, I.; Roekens, E.; Van Grieken, R. Atmospheric BTEX-concentrations in an area with intensive street traffic. Atmos. Environ. 2009, 43, 311–318. [Google Scholar] [CrossRef]
  26. Md Meftaul, I.; Venkateswarlu, K.; Dharmarajan, R.; Annamalai, P.; Megharaj, M. Pesticides in the urban environment: A potential threat that knocks at the door. Sci. Total Environ. 2020, 711, 134612. [Google Scholar] [CrossRef] [PubMed]
  27. Effect of the land use change characteristics on the air pollution patterns above the Greater Athens area (GAA) after 2004. Glob. NEST J. 2013, 15, 169–177. [CrossRef]
Figure 1. In-field system setup: (a) Portable membrane inlet mass spectrometer with (b) sampling probe and (c) laptop for acquisition and processing of the results.
Sustainability 16 01713 g001
Figure 2. Mass spectrum scan of the gas matrix inside the hive (91 m/z peak indicates the presence of p-Xylene), using the MIMS device.
Sustainability 16 01713 g002
Figure 3. Chemical analysis of beehive samples.
Sustainability 16 01713 g003
Figure 4. Satellite view of the location of the beehives (red marker) with the surrounding area [21].
Sustainability 16 01713 g004
Figure 5. Satellite view of the Landsat-derived global rainfed, irrigated, and human settlement area near the beehives’ location (red marker) [21].
Sustainability 16 01713 g005
Table 1. Detected VOCs that are indicators of the state of the contaminated environment.
RT *Compound NameClass
5.775IndanePAH
6.8881H-Indene, 2,3-dihydro-5-methylPAH
4.052CarbofuranPesticide
9.0336-MethoxybenzofuroxanPesticide
10.860LindanePesticide
5.088Toluene, p-ethyl-BTEX
5.230Toluene, o-ethylBTEX
5.939o-DiethylbenzeneBTEX
6.131p-XyleneBTEX
6.164m-XyleneBTEX
* Retention time (RT) is a measure of the time taken for a solute to pass through a chromatography column. Each compound has a unique retention time, which is influenced by its chemical properties and the specific conditions of the GC column and operating parameters.
Disclaimer/Publisher’s Note: The statements, opinions and data contained in all publications are solely those of the individual author(s) and contributor(s) and not of MDPI and/or the editor(s). MDPI and/or the editor(s) disclaim responsibility for any injury to people or property resulting from any ideas, methods, instructions or products referred to in the content.

