1. Introduction
With the continuous depletion of non-renewable energy sources, such as coal and oil, the shortage of fossil energy and the search for renewable energy have become new problems facing the development of the world. The primary sources of renewable energy are the sun, wind, ocean, etc., which have the advantages of large reserves and low emissions, among which wind energy is also considered as renewable energy with the most potential for development [
1]. Based on a recent estimation, China has abundant wind energy resources, and reserves have reached 4350 GW [
2]. Furthermore, with the current technical support, about 1000 GW of land-based wind energy and about 200 GW of offshore wind energy can be developed [
3]. Meanwhile, the 18th Party Congress report released by China’s government also pointed out that it was urgent to strengthen energy conservation and reduce consumption to support the development of energy-saving, low-carbon industries and the development of new energy, renewable energy, to ensure national energy security [
4]. Therefore, it is crucial to carry out relevant research on wind energy development. At present, development of wind energy is primarily distributed in its western part and the coastal regions [
5]. This paper focuses on wind power generation within the coastal port area. Specifically, this paper targets a study of how to locate the wind farm area and wind turbines scientifically and rationally and proposes the corresponding methods. Following the location decision-making process, this paper further proposes methods for evaluating the scale of wind energy resources and wind power generation in port areas.
Based on a literature review, it is found that substantial research efforts by scholars have been dedicated to determining optimal locations for wind farms, which can be categorized into the locations of onshore or offshore wind farms. This dichotomy highlights the importance of considering distinct environments for developing wind energy projects. Beyond location selection, a parallel line of inquiry has emerged, emphasizing the necessity for a rational and scientific approach to site wind farms. Scholars in this domain investigate not only the geographical aspect but also delve into the broader implications of wind farm locations, including their impacts on the life cycle of wind farms and pricing of the electricity market. Moreover, the specific decision-making process regarding the location of individual wind turbines within a wind farm has been a focal point in numerous studies. Researchers have explored innovative methods and technologies to optimize turbine locations within a given wind farm, considering factors such as safety, efficiency, and environmental impact.
The literature review carried out for this paper also underscores the existence of mainstream databases, such as ECMWF, AROME, ERA5, and CERRA2, proposed and developed for evaluating wind energy resources and power generation. These databases serve as valuable tools for researchers, providing data for comprehensive assessments. However, it is noted that while extensive research has been conducted on wind farm locations and resource evaluations, there remains a relative shortfall of studies focusing on evaluating the potential of wind power at different locations. In addition, the majority of existing research has concentrated on offshore wind farm optimization, leaving a gap in the exploration of onshore port areas for wind farm locations and wind power generation. This highlights the need for further investigation and is the basis for this study.
Therefore, this paper targets developing a method for locating the wind farm and turbine in port areas and further studies methods for evaluating wind resources and power from port turbines. Firstly, based on the proposed methods, the boundary of the port wind farm is defined, and then a facility location method for port wind farm and port turbine selection is proposed. After reasonable wind farm and turbine sites are selected, this paper proposes methods to evaluate wind resource and wind power generation from wind turbines in port areas. Finally, this paper takes the wind power generation projects in China’s coastal port clusters as examples to test and validate the proposed model.
Thus, the main contributions of this paper are as follows: (1) novel methods for selecting wind farms and turbine sites, and (2) novel methods for evaluating wind resource and power generation from wind turbines in port areas.
The remainder of this paper is organized as follows:
Section 2 presents the literature review.
Section 3 investigates the methodology for locating wind farm areas and wind turbines.
Section 4 examines the methodology for evaluating wind energy resources and wind power generation in port areas.
Section 5 provides the case study based on the wind power generation projects at China’s coastal port clusters.
Section 6 presents the results and discussion.
Section 7 presents the conclusions, limitations, and future recommendations.
2. Literature Review
In recent years, scholars have conducted extensive research for determining the locations of wind farms using different methods, which can be divided into two categories: onshore wind farm location selection and offshore wind farm location selection. In the field of onshore wind farm location selection, existing research mainly adopts the multiple criteria decision making (MCDM) method, multiple attribute decision making (MADM) methods, and mathematical modelling to realize location selection. With regard to the MCDM or MADM method, Yeh et al. [
6] examined the key factors considered in determining the locations of wind farms. Then, many methods to optimize the wind farm location were proposed. Gigović et al. [
7] developed a reliable model for the identification of locations for the installation of wind farms. Konstantinos et al. [
8] presented a methodology based on AHP and GIS to determine the most suitable locations for wind farm installation. Xenitidis K. et al. [
9] proposed a methodology based on computational geometry and geographical information systems (GIS) to cluster the locations of wind turbines (WT) and define the boundaries of the areas that are affected by them. Saraswat et al. [
10] looked into the technical, economic, and socio-environmental aspects of solar and wind farm locations in India to determine how suitable they are spatially in relation to the mathematical model. Wimhurst et al. [
11] introduced a logistic regression model that predicts suitable sites for state-level and nationwide wind energy development in the United States. In the field of offshore wind farms location selection, existing research also mainly adopts the multiple criteria decision making (MCDM) method, multiple attribute decision making (MADM) methods, and mathematical modelling to realize location selection. With regard to the MCDM or MADM method, in order to support the Republic of Ghana’s aim for the growth of renewable energy, Fahd et al. [
12] looked into the site counter of wind farms and proposed a novel method for locating and optimizing the site contour of wind farms within the framework of transmission expansion plans. Díaz and Soares [
13] developed a decision tool for planning offshore wind farm locations, combining multi-criteria decision analysis and geographic information systems. Díaz H. et al. [
14] introduced a novel procedure to optimize wind turbines’ placement in a wind farm. With regard to mathematical modelling, Díaz et al. [
15] created a Monte Carlo simulation process that applies decision makers’ subjective judgments along with key decision factors to determine the best locations for wind farms. Irawan, Salhi, and Chan [
16] introduced a novel algorithm that integrates a genetic algorithm, variable neighborhood search, and a Weiszfeld-based algorithm to examine the integrated continuous location. Díaz H. and Soares C. G. [
17] proposed a cost and financial evaluation model for floating wind farm designs. Acaroğlu and Márquez took the utilization of alternative power systems as prominent for energy transmission, supply, and security into consideration, and conducted an economic analysis for offshore wind farms. Taking into account the importance of alternative power systems for energy transmission, supply, and security, Márquez [
18] carried out an economic study for offshore wind farms.
Additionally, other scholars explored the need for rational and scientific wind farm locations and studied the impact of wind farm location on the life-cycle of wind farms, electricity market prices, etc. Vicente D.-C. and Laura C. S. [
19] ascertained the impact that the site has on the life cycle of an offshore floating wind farm. Awad et al. presented a probabilistic-based bi-level optimization approach for evaluating the impacts of the wind farm location and control strategy on the penetration level of wind farms and electricity market prices. A probabilistic-based bi-level optimization technique was introduced by Awad et al. [
20] to assess how wind farm site and control strategy affect wind farm penetration and electricity market prices. McWilliam et al. [
21] determined the wind farm structure that produced power at the lowest possible cost by utilizing population, wind resource, and transmission line locations. Gao et al. [
22] used a life cycle perspective to analyze energy consumption and the environmental impacts of wind farms and compared the results to a biomass power plant.
Moreover, the location decision for wind turbines within a wind farm has been a subject of numerous studies. Spielhofer et al. [
23] demonstrate how a state-of-the-art evolutionary optimization algorithm can inform policy makers in leveraging various planning policies to optimize the location of wind turbines. Using GH WindFarmer and WAsP software, Mohamed et al. [
24] improved the placement of wind turbines in the Kaberten park and reduced losses as a result of the trail’s influence. Li et al. [
25] selected fourteen small- to medium-sized commercially available wind turbines in Urumqi and Xining in China and analyzed their mean energy outputs and capacity factors. Adaramola and Oyewola [
26] examined the performance of selected small- to medium-sized wind turbines in three selected locations in Oyo state. Using a well-established Jen-sen wake model and ISO-9613-2 noise calculation, Mittal et al. [
27] carried out a wind farm layout optimization to maximize energy generation and minimize noise propagation. This involved a multi-objective trade-off between minimizing noise propagation and maximizing the wind turbine location.
This paper also investigates the method of evaluating wind energy resources and wind power generation. As a result, it is necessary to review the research. At present, there are several mainstream databases constructed for the evaluation of wind energy resources and wind power generation, such as ECMW, AROME, ERA5, CERRA2, etc. [
28,
29,
30]. Then, numerous studies are applied to the evaluation of wind energy resources and wind power generation based on these databases. In the field of wind energy resource evaluation, Jin et al. [
31] proposed a multi-scale coupling numerical simulation method based on atmospheric stability to investigate a wind energy resource assessment. Prasad et al. [
32] processed validated long-term reanalysis datasets (1979–the present) to find the most reliable reanalysis datasets for a wind resource assessment. For the evaluation of offshore wind, Elshafei et al. [
33] suggested a hybrid method combining measurements and results from numerical models. A study of a sensitivity analysis in a wind resource assessment was given by Tsvetkova and Ouarda [
34], who provided classifications based on the sensitivity analysis output variable (or model), method, application, nation, and software. Elshafei et al. [
35] proposed a hybrid approach to combine the merits of measurements and simulations for the assessment of offshore wind resources. Patel et al. [
36] re-assessed offshore wind resources and analyzed the wind climate along the Indian coast using the latest ERA5 near-hub-height wind products. Dayal et al. [
37] summarized an assessment of the wind resources at selected locations in Fiji for the potential of future utility-scale wind power development. Ayik et al. [
38] conducted an initial evaluation of South Sudan’s wind resources. A early evaluation of the offshore wind resource up to around 80 km off the coast of Mexican territory was suggested by López and Badaoui [
39]. Moreover, in the field of wind power generation assessments, Chen et al. [
40] introduced an innovative framework for multi-task learning and used it to achieve regional wind–photovoltaic combined power generation forecasting. Han et al. [
41] proposed a methanol-based energy storage system to meet regional power demand by combining a hybrid wind–solar source. Chen et al. [
42] proposed a novel multi-objective optimized recurrent neural network with temporal pattern attention (TPA) to address the randomness and uncertainty of wind farms in regional wind power prediction. Wilberforce et al. [
43] presented extant wind turbine designs and evaluated the potential for micro-wind production under poor wind quality situations, such as those seen in densely populated, suburban, or sparsely forested regions.
In summary, numerous research studies on wind farm location and wind resource evaluation and relatively little research on wind power measurement have been executed. However, most of them are focused on the location optimization of offshore wind farms, and there are relatively few studies on the location selection of onshore port area wind farms. In the field of wind resource evaluations and wind power generation measurements, most of the studies are focused on the evaluation of wind turbine potentials and wind resource potentials, or the evaluation of wind power generation, and there are relatively few studies on the evaluation of wind power generation generated by wind turbines.
3. Methodology for the Location Selection of the Wind Farm Area and Wind Turbine
This section first defines the scope and boundary of the wind farm area and introduces the location selection method for the wind farm area. Taking into consideration that this paper mainly studies the location selection method for the wind turbine and that the wind turbine is constructed into the wind farm area, so the location selection principles and method of the wind turbine are introduced in turn in this section.
3.1. The Scope and Boundary of the Wind Farm Area
Before constructing wind turbines in the port area, a more critical step is to define the scope and boundary appropriate to conduct wind power generation in the port area, which is named the wind farm area. Generally, according to the relevant port development and planning documents formulated by local maritime authorities, the scope and boundary of the port area can be clarified. Additionally, because the wind farm area is resolved and located in the port area, as a result, after figuring out the scope and boundary of the port area, the scope of the wind farm area is obtained.
Normally, the principles of selecting the wind farm area are given as follows:
- (1)
The chosen wind farm area cannot interfere with the port’s production routine;
- (2)
The wind farm area should be defined as an area with high wind speed and abundant wind energy resources;
- (3)
The wind farm area should be adequate, sufficient, and able to accommodate the proposed wind turbines.
As shown in
Figure 1, the scope and boundary of the port area are enclosed by port shoreline A, port extents B and D, and port land boundary C. The defined scope E represents the designated port area where port production activities take place. These five parts are spatially separate areas. Then, port routine production is carried out in this area. Based on the authors’ on-the-spot research on the wind power generation layout and management in Jiangyin Port and Tianjin Port, the alternative space of the wind farm area is proved within the scope of port extents B and D and port land boundary C, rather than scope E and shoreline A. The reason is principle 1 referred to above.
3.2. Location Selection Method for the Wind Farm Area
Wind farm location selection, in general, can be divided into two types: locations in the macro-region area and the micro-region area. The former aims at optimizing the wind farm area spatially, and the latter aims at optimizing the wind turbine constructed into wind farm area spatially. This paper focuses on the location selection method for wind farm areas that can be used in the macro-region area.
According to the literature review of existing research, the location selection of wind farm areas at the macro stage is mainly categorized into two types: a location selection method with real-time wind speed data and a location selection method without real-time wind speed data. Therefore, there exist different methods for these two types. When facing no efficient real-time wind speed data, based on the technical regulations for the selection of a wind farm area delivered by national public service platform for standards information, the (1) topographic and geomorphologic features discrimination method, (2) vegetation deformation discrimination method, (3) wind-forming geomorphology discrimination method, and (4) residents’ survey method are commonly used means to determine the scope and location reasonably. Nevertheless, when there are valid real-time wind speed data for the corresponding research of the wind farm area, mesoscale meteorological data such as ERA5 and Merra2, meteorological stations in the port area, wind speed and direction data in and around the port area, and experts’ experience or other data are mainly adopted to determine the scope and location of the wind farm area reasonably.
3.3. Wind Turbine Location Selection Principles and Method
As described above, this paper mainly studies the location selection method for the wind turbine, and the wind turbine is constructed into the wind farm area; so, only after figuring out the location selection method of the wind farm area can it be further clarified how to carry out the optimal location selection method of the wind turbine, and the location selection principles and method for the wind turbine are stated below.
3.3.1. Wind Turbine Location Selection Principles
Wind turbine location selection is the process of screening out suitable location points for wind turbine construction within the planned port boundary scientifically and reasonably based on a comprehensive consideration of the wind turbine, such as construction conditions, the wind resource distribution, and the economy. Consequently, the following principles are derived from a comprehensive review of the existing literature in this domain:
- (1)
The selected location for the wind turbine should meet the requirements of national industrial policy, local development, and port space planning. Documents, such as territorial spatial planning, control detailed planning, construction detailed planning, and port space planning, should be collected and studied thoroughly to figure out the scope and boundary of the port area. The areas within the port boundary that have been used for other planning purposes or occupied by other projects should be excluded. Meanwhile, areas in the port area, such as basic farmland, ecological red line, national public welfare forests, nature reserves, important mineral deposits, military areas, etc., should be discarded. Then, a location point can be selected within the rest of the port area.
- (2)
The selected locations of wind turbines should have abundant wind energy resources, characterized a high wind speed and stable wind direction. Regions with higher wind speeds generally exhibit greater wind energy potential. In addition, a stable wind direction is conducive to the standardized layout of the wind turbine and reduce the frequent yawing faults and energy consumption, thus obtaining a more ideal wind power generation effect. Thus, in alignment with principle (1), the wind speed, wind direction, and other data can be further collected from the remaining available areas in the port area to rationalize the decision-making process of the wind turbine location.
- (3)
The selected location of wind turbines should consider the construction requirements, safety requirements, state grid access requirements, environmental protection requirements, and economic requirements designed during the construction process to rationalize the layout. This implies that the selected location should have simple terrain, little construction difficulty, and better transportation conditions within the remaining available area of the port area. The safety construction requirements during the construction period, the requirements for grid access that exist after the completion of construction (e.g., close to the substation or grid that meets the conditions for grid access), as well as environmental protection requirements (e.g., away from the needs of the residential area, the CBD, etc.), and the economic requirements for wind turbine construction during the whole cycle (input–output ratio) should be maximized, which is convenient to achieve ideal and fast wind power generation construction.
3.3.2. Wind Turbine Location Selection Method
This paper mainly constructs the indicator evaluation system for the wind turbine location and adopts the hierarchical analysis and fuzzy comprehensive evaluation method to evaluate the indicator system efficiently.
- (1)
Indicator evaluation system
Through a thorough literature review and multiple rounds of expert consultations, the indicator evaluation system mainly includes four level 1 indicators: regional wind energy resources, grid access situation, project environmental factors, and meteorological and geological conditions.
Within wind energy resources, four level 2 indicators are included: wind speed, wind energy density, wind direction, and the number of available hours per year. For grid access situations, two level 2 indicators are considered: the length of grid access lines and located transportation conditions. The project economy category comprises four level 2 indicators: unit power generation cost, total project investment, payback period, and net capital utilization rate of the project. Lastly, meteorological and geological conditions contain two level 2 indicators: the topographic slope and land suitability. The specific structure of the indicator evaluation system is shown in
Figure 2.
- (2)
Hierarchical analysis and fuzzy comprehensive evaluation method
Hierarchical analysis and fuzzy comprehensive evaluation methods are used to evaluate each wind turbine location candidate point, and the purpose is to evaluate a series of reasonable wind turbine location points from all selected turbine candidates to improve the efficiency and effectiveness of wind turbine power generation. The methodology is described below.
① The weights of indicators need to be determined. Firstly, we should figure out the importance ranking of indicators; that is, we should compare them to decide which one is more important when we choose any two indicators. Then, the comparison results are quantified and ranked on a scale of 1–9, and the judgment matrix of indicators is obtained. The scale of 1–9 is described following
Table 1, the scale points 2, 4, 6, and 8 are the medium values in the judgment matrix.
Take the four key indicators as an example and set
to represent regional wind energy resources, the grid access situation, project environmental factors, and meteorological and geological conditions. Then, the judgment matrix is obtained and expressed as follows:
represents the comparison result between the indicator regional wind energy resources and grid access situation.
According to the obtained judgment matrix, we adopt a hierarchical analysis to calculate the relative importance of the indicators and figure out the weight of each indicator. After figuring out the weights of indicators, it is necessary to test the consistency of the judgment matrix. When the consistency result is less than 0.1, it is generally considered that the judgment matrix has a satisfactory consistency; otherwise, it needs to be adjusted to make it satisfactory. Thus, the corresponding weight of each indicator in the wind turbine location evaluation indicator system is obtained.
② The fuzzy evaluation matrix needs to be determined. The values of all indicators in the evaluation system of each wind turbine location candidate point are collected to obtain the relative affiliation matrix of each wind turbine location candidate point. To preserve the information of each indicator, it is necessary to standardize the indicators that belong to the larger and better type. The standardized formula is stated below.
On the contrary, the standardized equation for indicators that belong to the smaller and better type is stated below.
In this formula,
represents the indicator value, and
are the maximum and minimum values of row
in the collected sample set, respectively.
In this formula, is the fuzzy evaluation matrix of indicator in level 1. represents the comparison results of indicators in level 2.
③ Fuzzy matrix composite operations need to be executed.
After determining the indicator evaluation system, the indicator weights, and the fuzzy evaluation matrix for each wind turbine location candidate point, based on the collected indicator values of samples, the fuzzy matrix composite operation of the level 2 indicators is carried out to derive the fuzzy evaluation matrix of the level 1 indicators.
In this formula, matrix
represents the weights of all level 2 indicators that belong to the level 1 indicator
. In addition, the final fuzzy evaluation matrix
is calculated and obtained based on the fuzzy matrix composite operations.
represents the weights of all level 1 indicators.
④ The composite assessment value needs to be determined.
In this formula, matrix is the quantitative matrix of adaptability evaluation for a wind turbine candidate location point, and the specific value of matrix is given as so that the final adaptability evaluation of a single wind turbine candidate location point can be derived.
4. Methodology for Evaluating Wind Energy Resources and Wind Power Generation in the Port Area
The methodology in
Section 3 describes how to select suitable wind farm areas as well as wind turbine locations, and so the next step is how to evaluate the wind energy resources and wind power generation based on the selected wind farm areas and wind turbine locations. At present, China has issued a series of national and industrial standards around wind energy resource measurement [
44,
45,
46,
47]. Additionally, at the same time, according to the existing literature [
48], in the process of wind energy resource evaluation, mainly including the average wind speed, the average air density, the average wind energy density, etc., and through the calculation of these indicators, we can ultimately obtain the total generation of the regional wind energy resources.
Consequently,
Section 4 describes the methodology for evaluating the wind energy resources and the methodology for assessing wind power generation in the port area.
4.1. Methodology for Evaluating Wind Energy Resources
4.1.1. Air Density Measurement
If equipment for measuring pressure and temperature and recording data is available at the wind farm area in the port area, the air density is calculated according to Equation (8):
is the air density, is the annual mean atmospheric pressure, is the air constant, and is the annual mean air absolute temperature in Kelvin.
If there is no equipment and recorded data for measuring pressure and temperature in the wind farm area in the port area, the air density is calculated according to Equation (9):
is the air density, is the elevation of the wind farm in the port area, and is the annual average air absolute temperature in Kelvin.
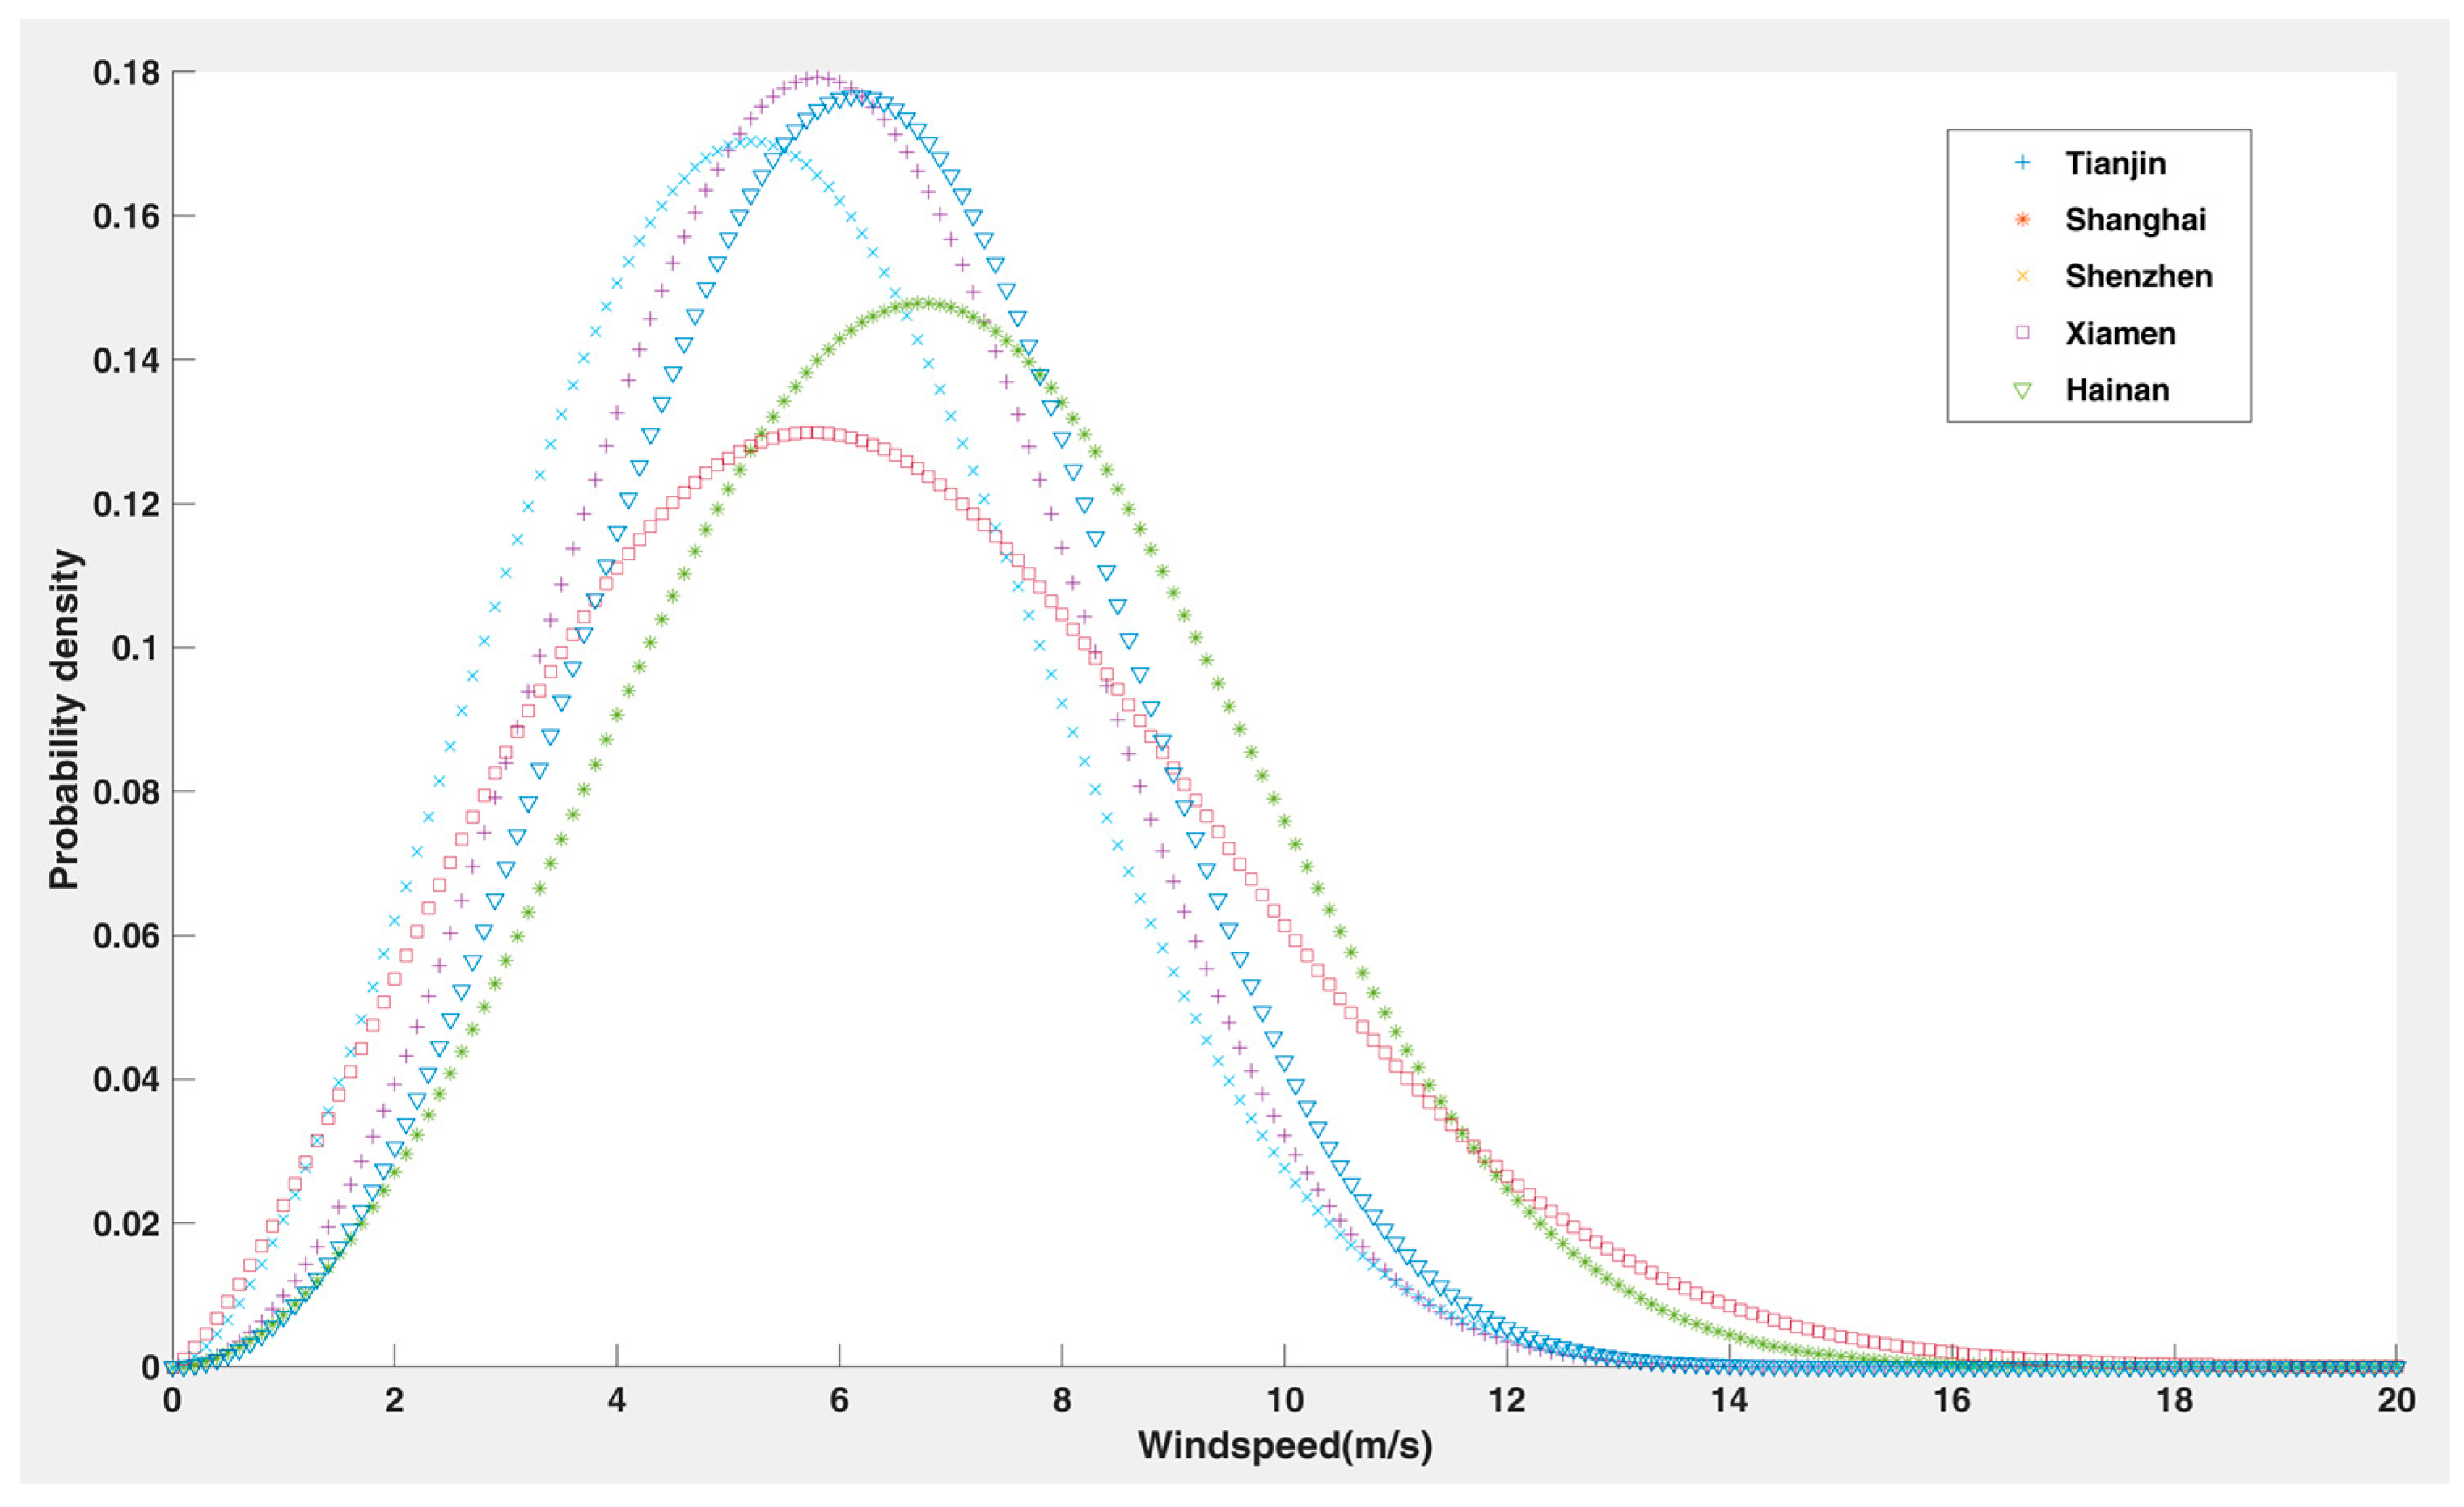
4.1.2. Mean Wind Speed Calculation and Wind Speed Distribution Fitting
Based on the equipment in the wind farm area to obtain the observed wind speed data in periods, the average wind speed can be obtained using Equation (10), where
represents the observed wind speed data and
represents the average wind speed. At the same time, based on the observed wind speed data, the probability distribution function of wind speed in a continuous time frame can be carried out using the Weibull distribution model, and the parameters
,
,
and
of the Weibull model can be estimated using the results of the mean wind speed and the standard deviation of the wind speed with the formulas shown in Equations (11) and (12).
4.1.3. Average Wind Power Density Measurement
Average wind power density refers to the wind power in the area of the wind turbine perpendicular to the wind direction, which can directly reflect the scale of the wind power in the port area to be evaluated, and the expression of the average wind power density for the set period is shown in Equation (13).
is the average wind power density, is the number of records in the set period, represents the air density, and is the cube of the ith recorded wind speed value. When calculating the average wind power density, it is necessary to use the average value of the hourly wind power density in the set period.
It can be seen that the average wind power density is closely related to the wind speed and air density. Although the air density is relatively stable, the wind speed is always changing. As a result, in order to calculate the average wind power density more reasonably, the current research is mainly conducted by simulating the wind speed data to analyze the change style of the wind speed in a period of time.
At present, the main simulation models, Weibull distribution, Rayleigh distribution, gamma distribution, and lognormal distribution included are adopted to simulate the change style of the wind speed, and many studies believe that the Weibull distribution can better simulate the change of wind speed [
49,
50]. The cumulative probability density function of the Weibull distribution is shown in Equation (14):
is the cumulative probability density, is the wind speed, is the Weibull scale parameter, and is the Weibull shape parameter.
Additionally, the derivative of the Weibull cumulative probability density function is the Weibull wind frequency distribution probability density function, as shown in Equation (15):
is the Weibull wind frequency distribution probability density.
Therefore, the Weibull distribution is used for wind speed fitting and average wind power measurement in this paper. Additionally, the wind power density is calculated as in Equation (16) based on the Weibull distribution.
is the representative wind power density value of the ith area in the Weibull distribution function.
4.2. Methodology for Evaluating Wind Power Generation
Firstly, based on the observed data from the wind farm area, the data of atmospheric pressure, temperature, altitude, wind speed, etc., which are multi-recorded in periods, are obtained. Then, the atmospheric pressure, temperature, and altitude data are used to calculate the average air density based on Equations (8) and (9), and then the average wind power density results are obtained based on Equations (10)–(16). Finally, based on the average wind power density and Equations (17) to (19), the total generation of wind energy resources is calculated.
represents the angle between the wind direction and the due north direction. Currently, 0 degrees is specified as the due north wind direction, 90 degrees is specified as the due east wind direction, 180 degrees is specified as the due south wind direction, and 270 degrees is specified as the due west wind direction, and the wind direction varies from 0 to 360 degrees. is the ith area between the contour lines of wind power density in the annual average wind power density Weibull distribution map. is the part of wind power generation in which belongs to or ; is the part of wind power generation in which belongs to . is the total wind power generation.
Because the wind direction continues to change, the effective wind power density is different and can be calculated using trigonometric functions, and the effective wind power generation is calculated based on Equations (17) to (18) according to different wind directions. As a result, the total effective wind power generation is calculated based on Equation (19).
It should be noted that here, only the wind direction factor is considered in the calculation of wind power generation, and the effect of wake losses is not taken into account. The main reason is that the number of wind turbines constructed in port scenarios is often limited and in a single distribution to ensure the normal operation of the port. Normally, the number is no more than 5 based on actual research in China coastal ports and the wind turbines are constructed in different port areas. As a result, this paper does not consider the wake losses in the wind power generation calculation process.
7. Conclusions and Recommendations
This paper innovatively proposed methods for locating wind farms and wind turbines in port areas based on a fuzzy comprehensive evaluation method. After choosing reasonable and optimum locations for wind turbines, an evaluation method of wind resource and power generation from wind turbines in port areas is proposed based on the national standard. In addition, a case study was conducted with the wind power generation projects in China‘s coastal ports, which validates the validity of the methods and models proposed in this paper, and this contributes to technically promoting the construction of wind power generation projects in China.
- (1)
Regarding the facility location method for locating wind turbines in different port scenarios, this paper constructs an index system containing four level 1 indicators and twelve level 2 indicators, and adopts the fuzzy comprehensive evaluation method to calculate the weights of indicators and the indicator values. Finally, this paper takes the location design of wind turbines in Tianjin Port as an example for empirical validation, and effectively selects one site from three candidate sites of wind turbine for the location and construction of wind turbines.
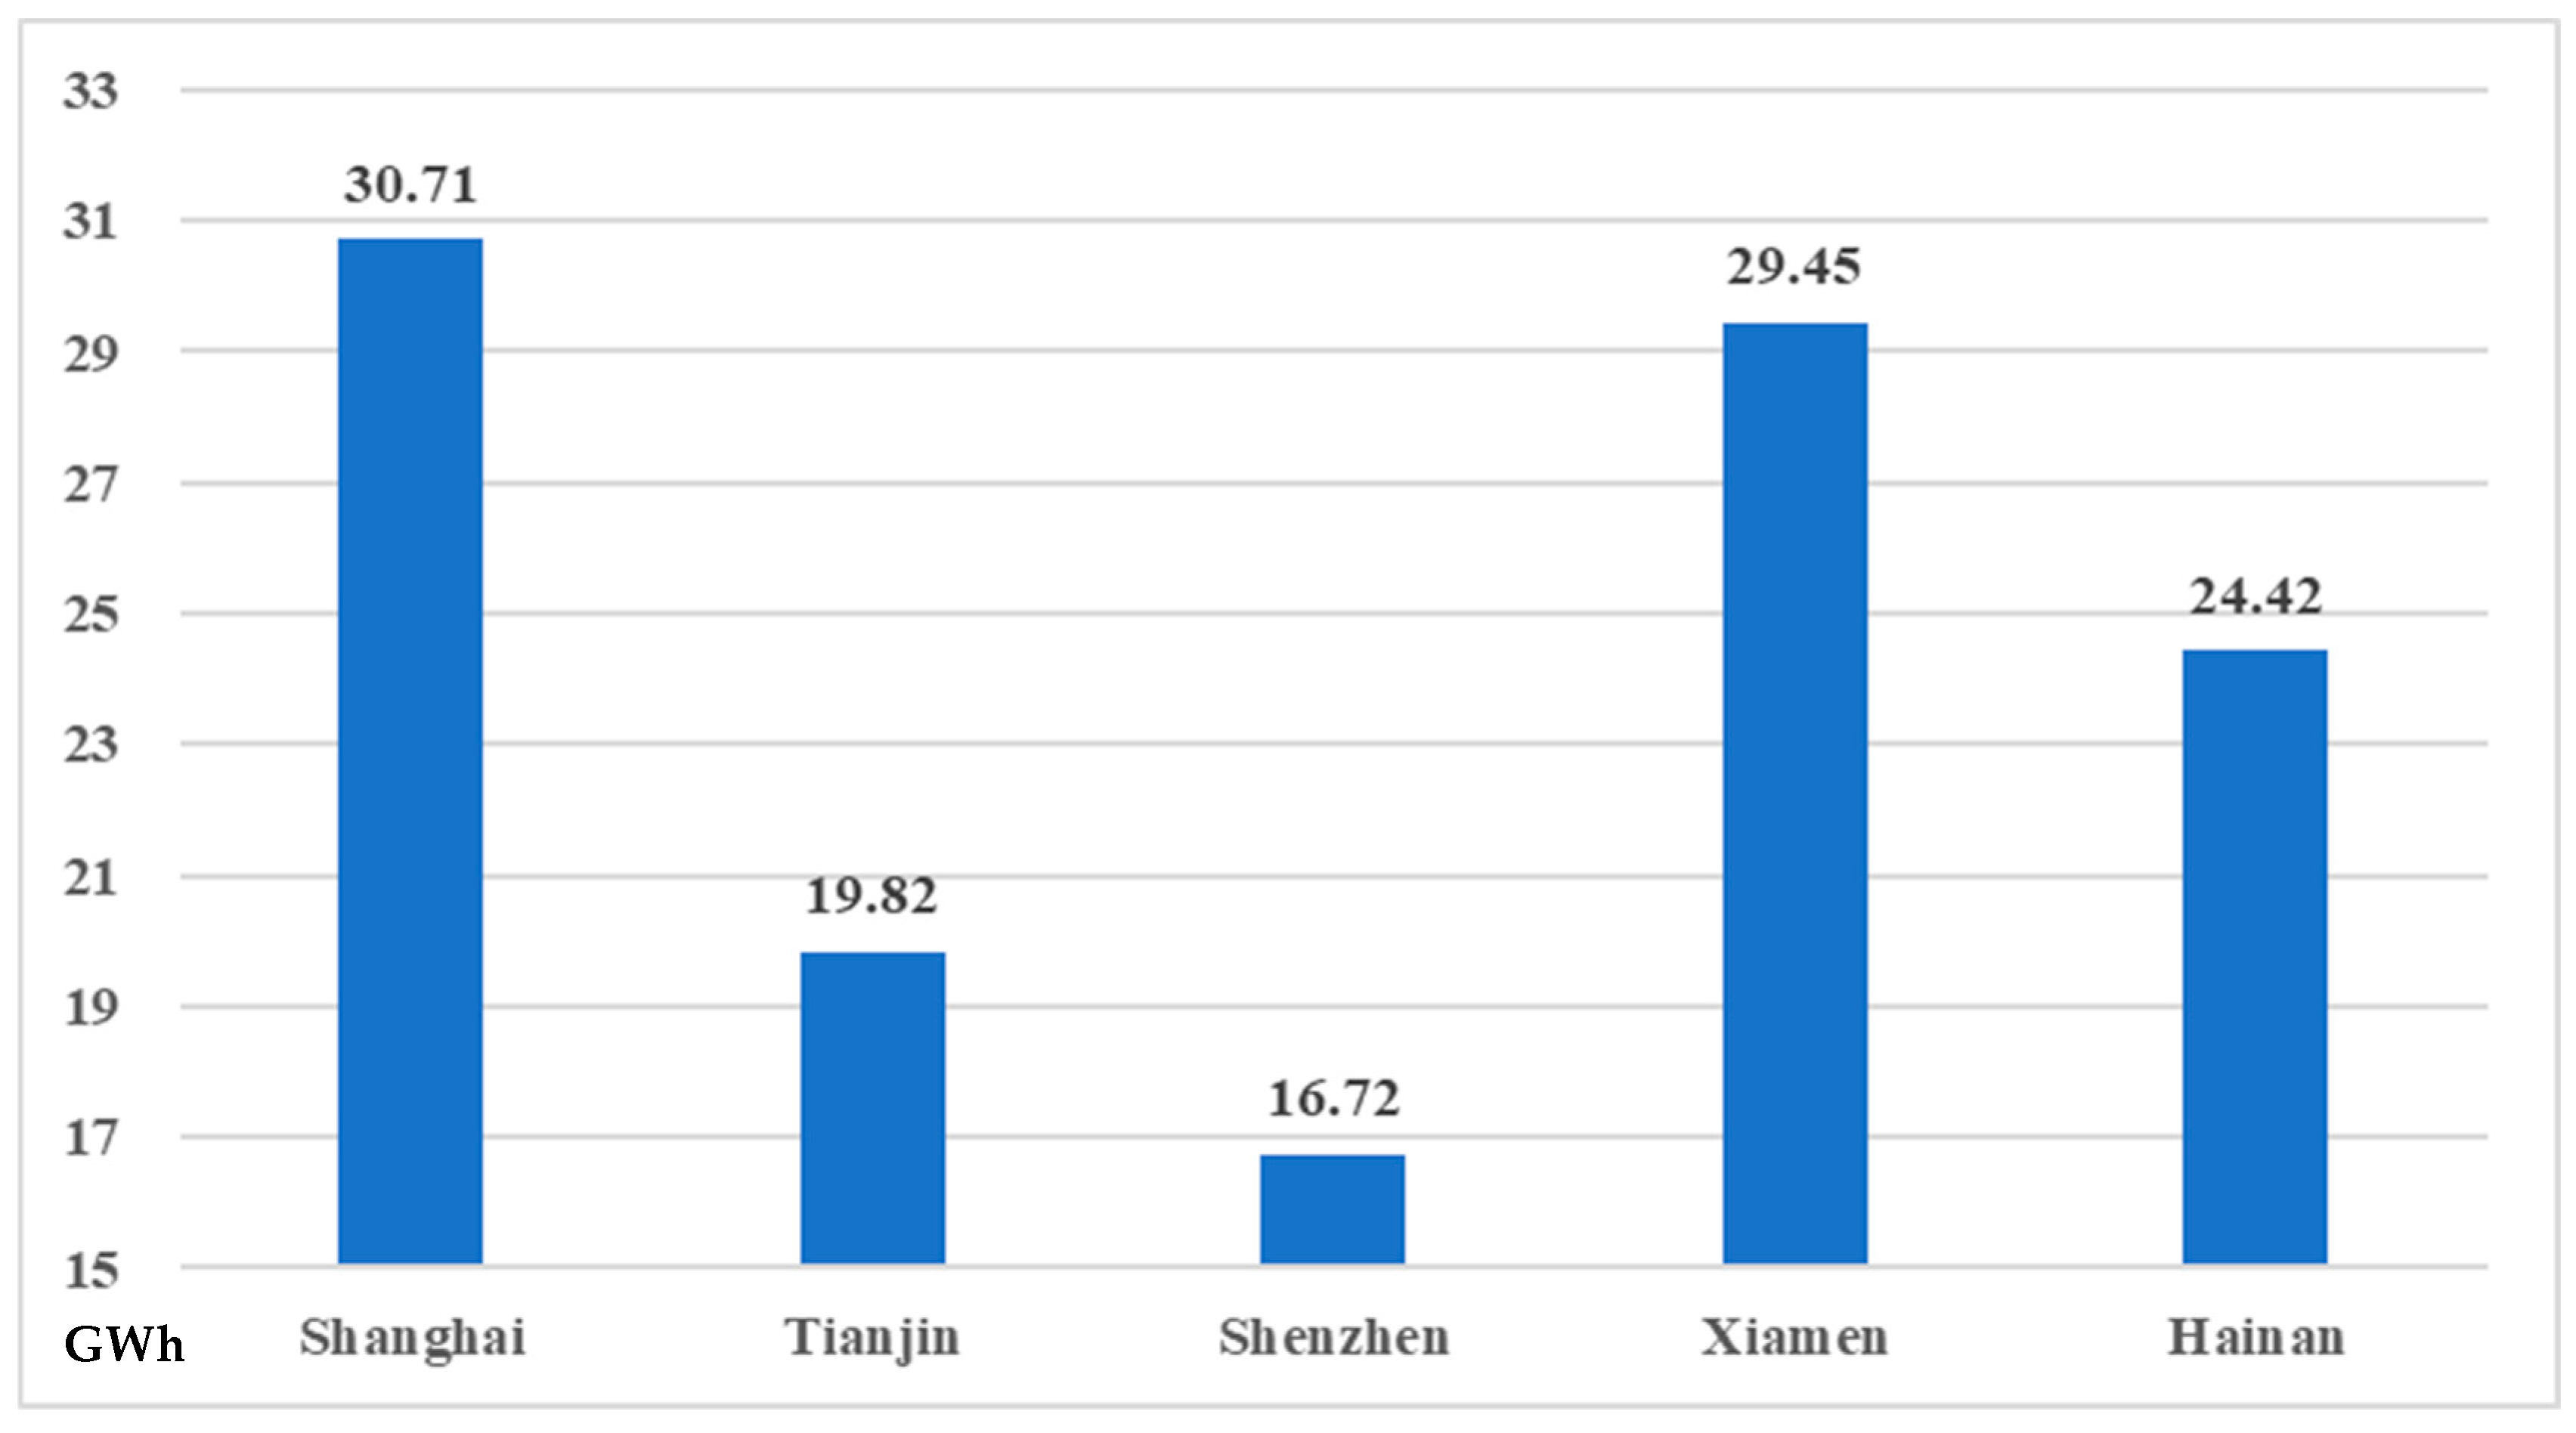
- (2)
Based on the proposed evaluation method of wind resources in port areas and the evaluation method of power generation of wind turbines, this paper analyzes the wind power construction projects in Tianjin Port, Shanghai Port, Xiamen Port, Shenzhen Port, and Hainan Port, and obtains final power generation capacities of 30.71 GWh, 19.82 GWh, 16.72 GWh, 29.45 GWh, and 24.42 GWh, respectively.
- (3)
Based on the results of the case study, this paper further analyzes the sensitivity of the type of wind turbine, and ultimately finds that if analyzed purely from the economic point of view, substitution type 2 is better, but in the real-world environment, the construction of the wind turbine should also be considered from various aspects.
However, there are still deficiencies in this paper’s research, e.g., the method proposed in this paper involves many human factors. Thus, more practical methods for locating wind turbines and evaluating wind resources in the port areas can be developed in the future. Moreover, methods for locating the wind turbines and evaluating wind resources in other scenarios can also be studied.
In summary, the methods proposed in this study are essential for optimizing the location and construction of wind turbines, which may help ports in adopting a low-carbon and green development path, thereby mitigating air pollution and promoting sustainable development.

 ,
, 


