Article

Analysis of Thermodynamic Events Taking Place during Vacuum Drying of Corn

1
Institute of Manufacturing Systems, Environmental Technology and Quality Management, Faculty of Mechanical Engineering, Slovak University of Technology in Bratislava, 812 31 Bratislava, Slovakia
2
Institute of Energy Machinery, Faculty of Mechanical Engineering, Slovak University of Technology in Bratislava, 812 31 Bratislava, Slovakia
*
Authors to whom correspondence should be addressed.
Sustainability 2024, 16(2), 879; https://doi.org/10.3390/su16020879
Submission received: 21 July 2023 / Revised: 2 November 2023 / Accepted: 13 November 2023 / Published: 19 January 2024
(This article belongs to the Topic Innovation and Solution for Sustainable Agriculture)

Abstract

:
Agricultural materials (LF products) can be considered biologically living organisms due to their structure and the composition of colloidal capillary-porous substances in them. They contain a large number of microscopic pores, microcapillaries and macrocapillaries, in which water is able to pass from the inner parts to the surface of the grain, and vice versa. Thus, it can be concluded that drying is an important and demanding aspect of agricultural production. To determine the optimal drying process for agricultural cereals from a nutritional, energy, economic and environmental point of view, it is necessary to address in detail the application of the technology of vacuum drying from a thermodynamic point of view. An analysis of the research results shows that drying temperature, harvest date and corn variety can significantly affect the properties of the main components of corn grain. This study investigates the individual technological parameters of the vacuum drying process for corn, such as the pressure used in the drying chamber, the grain drying temperature and the heating time, in order to achieve a maximum reduction in water content. The aim of the investigation is to determine the optimal parameters for the design of a functional prototype of a vacuum dryer. For this purpose, laboratory and semi-operational experiments using different types of organic materials are necessary. The structural design of the individual elements of the vacuum dryer is based on an analysis of laboratory and experimental tests, whose results are presented in this article.

1. Introduction

Agricultural crops can be considered biologically living organisms due to their structure and the composition of colloidal capillary-porous substances in them. They contain a large number of microscopic pores, microcapillaries and macrocapillaries, in which water can pass from the internal parts to the surface of the grain, and vice versa. After harvesting, agricultural crops go through a series of processes, such as receiving, cleaning, sorting and drying, in order to preserve the useful properties of their products during storage and processing. It can, therefore, be concluded that drying is an important and demanding aspect of agricultural production [1] for food producers and livestock breeders. The parameters of drying agricultural crops [2,3] have been investigated to increase the efficiency of the process or to ensure a minimum impact on the nutritional content. Among the wide spectrum of agricultural crops, attention is paid to the drying of cereals [4,5], lemons [6], olive pomaces [7], eggplants [8] and corn. Agricultural crops can also be used in ways other than those in the food industry, such as their use as biomass [9]. Maize is the most cultivated cereal in the world [10] according to the International Grains Council (IGC). Its total global production reached almost 1200 million tons in 2020, covering a total area of 200 million ha. Maize is considered an important crop [11] and is used in several fields, including the food industry, animal production and agricultural production. New procedures and technological solutions for corn drying have been compared with the classical approach, for example, in [12]. The advantage of low-temperature vacuum drying has been demonstrated, mainly due to the small influence of this process on the nutritional value of corn [13]. The key principle is to understand the composition of corn grains and their behavior during the drying process [14], with a focus on the moisture transfer process throughout the grain. In major agricultural countries, maize drying entails a reduction in moisture from values of about 17–30% to values between 8 and 14%, depending on the type of grain [15]. The authors of [9] reported that a moisture content below 14% and a storage temperature below 25 °C preserved the physico-chemical quality of corn grains and achieved better processing results for corn products.
Corn grain [16] contains dry matter [17,18] (carbohydrates, proteins, fats, minerals, vitamins and enzymes) and water. Temperature is an important parameter that affects the dynamics of the drying process and its energy consumption. It also has an impact on the final nutritional value of dried corn. Proteins, sugars, vitamins and enzymes are very sensitive to elevated temperatures.
For the evaporation of water, it is necessary to spend a certain amount of energy. This amount of energy is largely dependent on the temperature of the dried grains [19]. Depending on the requirements of the nutritional value of corn after drying, it is necessary to prevent overheating of the grain core and damage to its surface layer. Several studies have discussed this issue in the drying process [20,21,22,23].
In a conventional dryer, the material to be dried is heated by an air stream until moisture reaches the surface of the material [24,25,26]. The quality criterion for the drying process depends on the psychometric properties of the drying air. This is an energy-intensive process. In vacuum drying, “sensitive” agricultural crops are dried under reduced pressure in a vacuum.
In a vacuum dryer, water evaporates at a lower temperature due to reduced pressure. For example, at an atmospheric air pressure of 100 kPa, the boiling point of water is 99.6 °C, and, at a reduced pressure, e.g., 10 kPa, the boiling point is 45.8 °C. This reduces the energy required to reach the drying temperature.
Vacuum drying [27,28] has a number of advantages over air drying. It is mainly used for drying products with large surface areas, such as hygroscopic materials in the production of plastics [29,30], chemicals, food [28,31] and pharmaceutical products [32,33,34]. During the production of fruit concentrates or lyophilization of coffee or fruit, the consistency, the content of vitamins and the taste of the product are preserved. In [10], it is assumed that the use of a vacuum in a drying chamber reduces the risk of thermal stress on the corn grain itself. Vacuum drying has additional advantages, including a significant reduction in the drying time, a reduction in energy consumption, an avoidance of material degradation due to long-term heat load in the air stream, lower operation and maintenance requirements and smaller built-in dimensions of the dryer [12,35].
The efficiency of vacuum drying depends on the input moisture content of the crop being dried [36]. To optimally set the drying process from the nutritional, energy, economic and environmental points of view, it is necessary to address in detail the application of the vacuum drying technology in a thermodynamic context. A previous study [37] shows that drying temperature, harvest date and corn variety can significantly affect the properties of the main components of corn grain, with a possible impact on its further usefulness.
It is analytically difficult to optimize the process of vacuum drying corn and other agricultural cereals. In this process, it is necessary to determine the pressure of the drying medium, the temperature and the drying time of the grain to achieve maximum moisture reduction. Laboratory experiments using various types of organic materials are essential. The aim of this study is to experimentally investigate the drying process of maize under reduced pressure and temperature in a vacuum. The appropriate conditions for the implementation of the heating and drying phases are determined separately. The parameters being manipulated are the pressure in the vacuum chamber, the drying time interval and the number of drying cycles. The research results of this study are used as input data for the design of a prototype dryer working under the principle of vacuum drying.
One of the results of this study is the increased drying efficiency obtained by using repeated cycles, and the prototype dryer is being developed to reflect this fact. Its main benefit is the heat recovery between cycles. The components of the dryer under development are designed based on the results of this study.

2. Material and Methods

A simplified physical model of a vacuum dryer was installed in the laboratory of the Institute of Production Systems, Environmental Technology and Quality Management of the Faculty of Engineering of the Slovak University of Technology (STU) in Bratislava, Slovakia (Figure 1). The model was used to analyze the thermodynamic events taking place during the vacuum drying of corn.
A perforated grain basket is suspended in the vacuum chamber on a tensometric scale. A specially shaped heating coil is installed in the basket for even heating of the measured sample. The desired heating coil power is regulated by a rheostat. During the preparation of a corn sample, the temperature sensors and the selected corn grain are inserted into the basket. Heating of the corn grain in the basket by the heating coil provides informative data regarding the vacuum drying process.
The required pressure in the vacuum system is provided by a water circulation pump and a vacuum air reservoir. In the vacuum system, air with humidity, which is increased by steam evaporated from corn kernels, flows through the primary side of the condenser. Condensed water then flows into the condensate collection tank.
After the end of the vacuum drying process, the corn sample is removed from the vacuum chamber and dried on a sieve under atmospheric conditions.

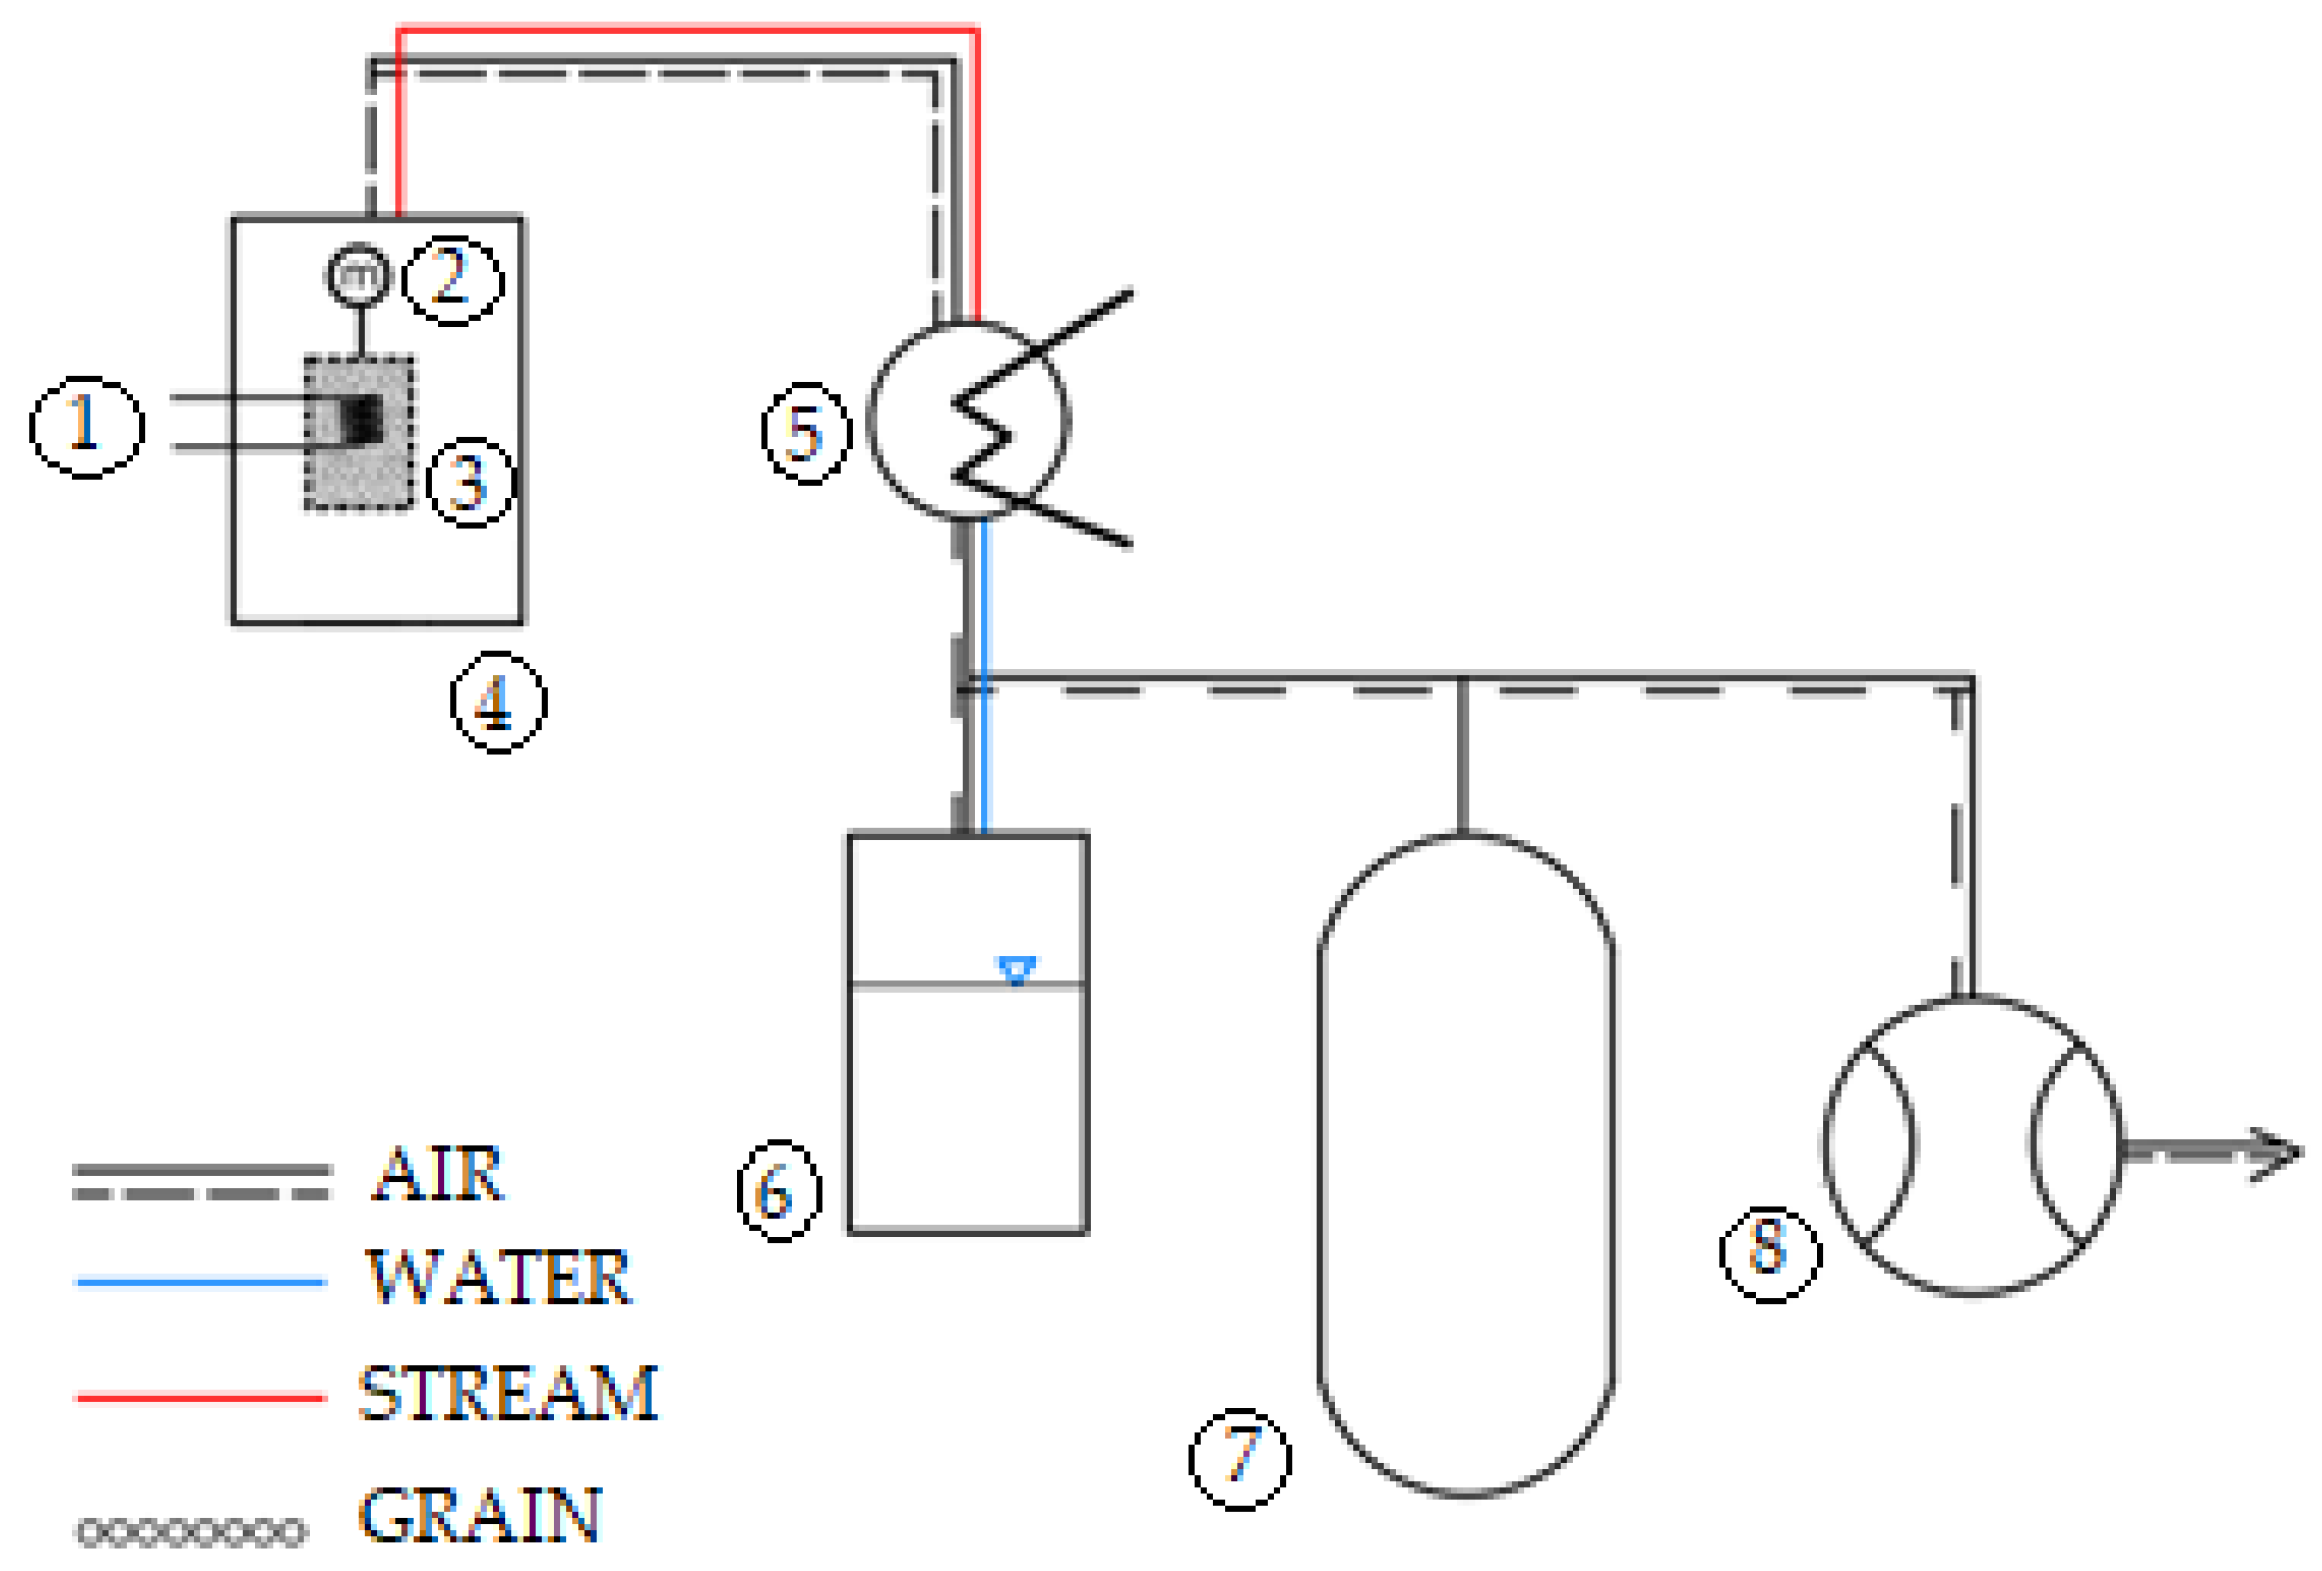
Vacuum Drying of Corn under Laboratory Conditions

The thermodynamic events occurring during vacuum drying were analyzed using corn samples. The corn samples were harvested in September 2021 and had a moisture content of 14.46% [38]. Kernels were naturally dried on corn cobs before measurements were taken.
Vacuum drying of corn in an experimental facility consists of the following stages:
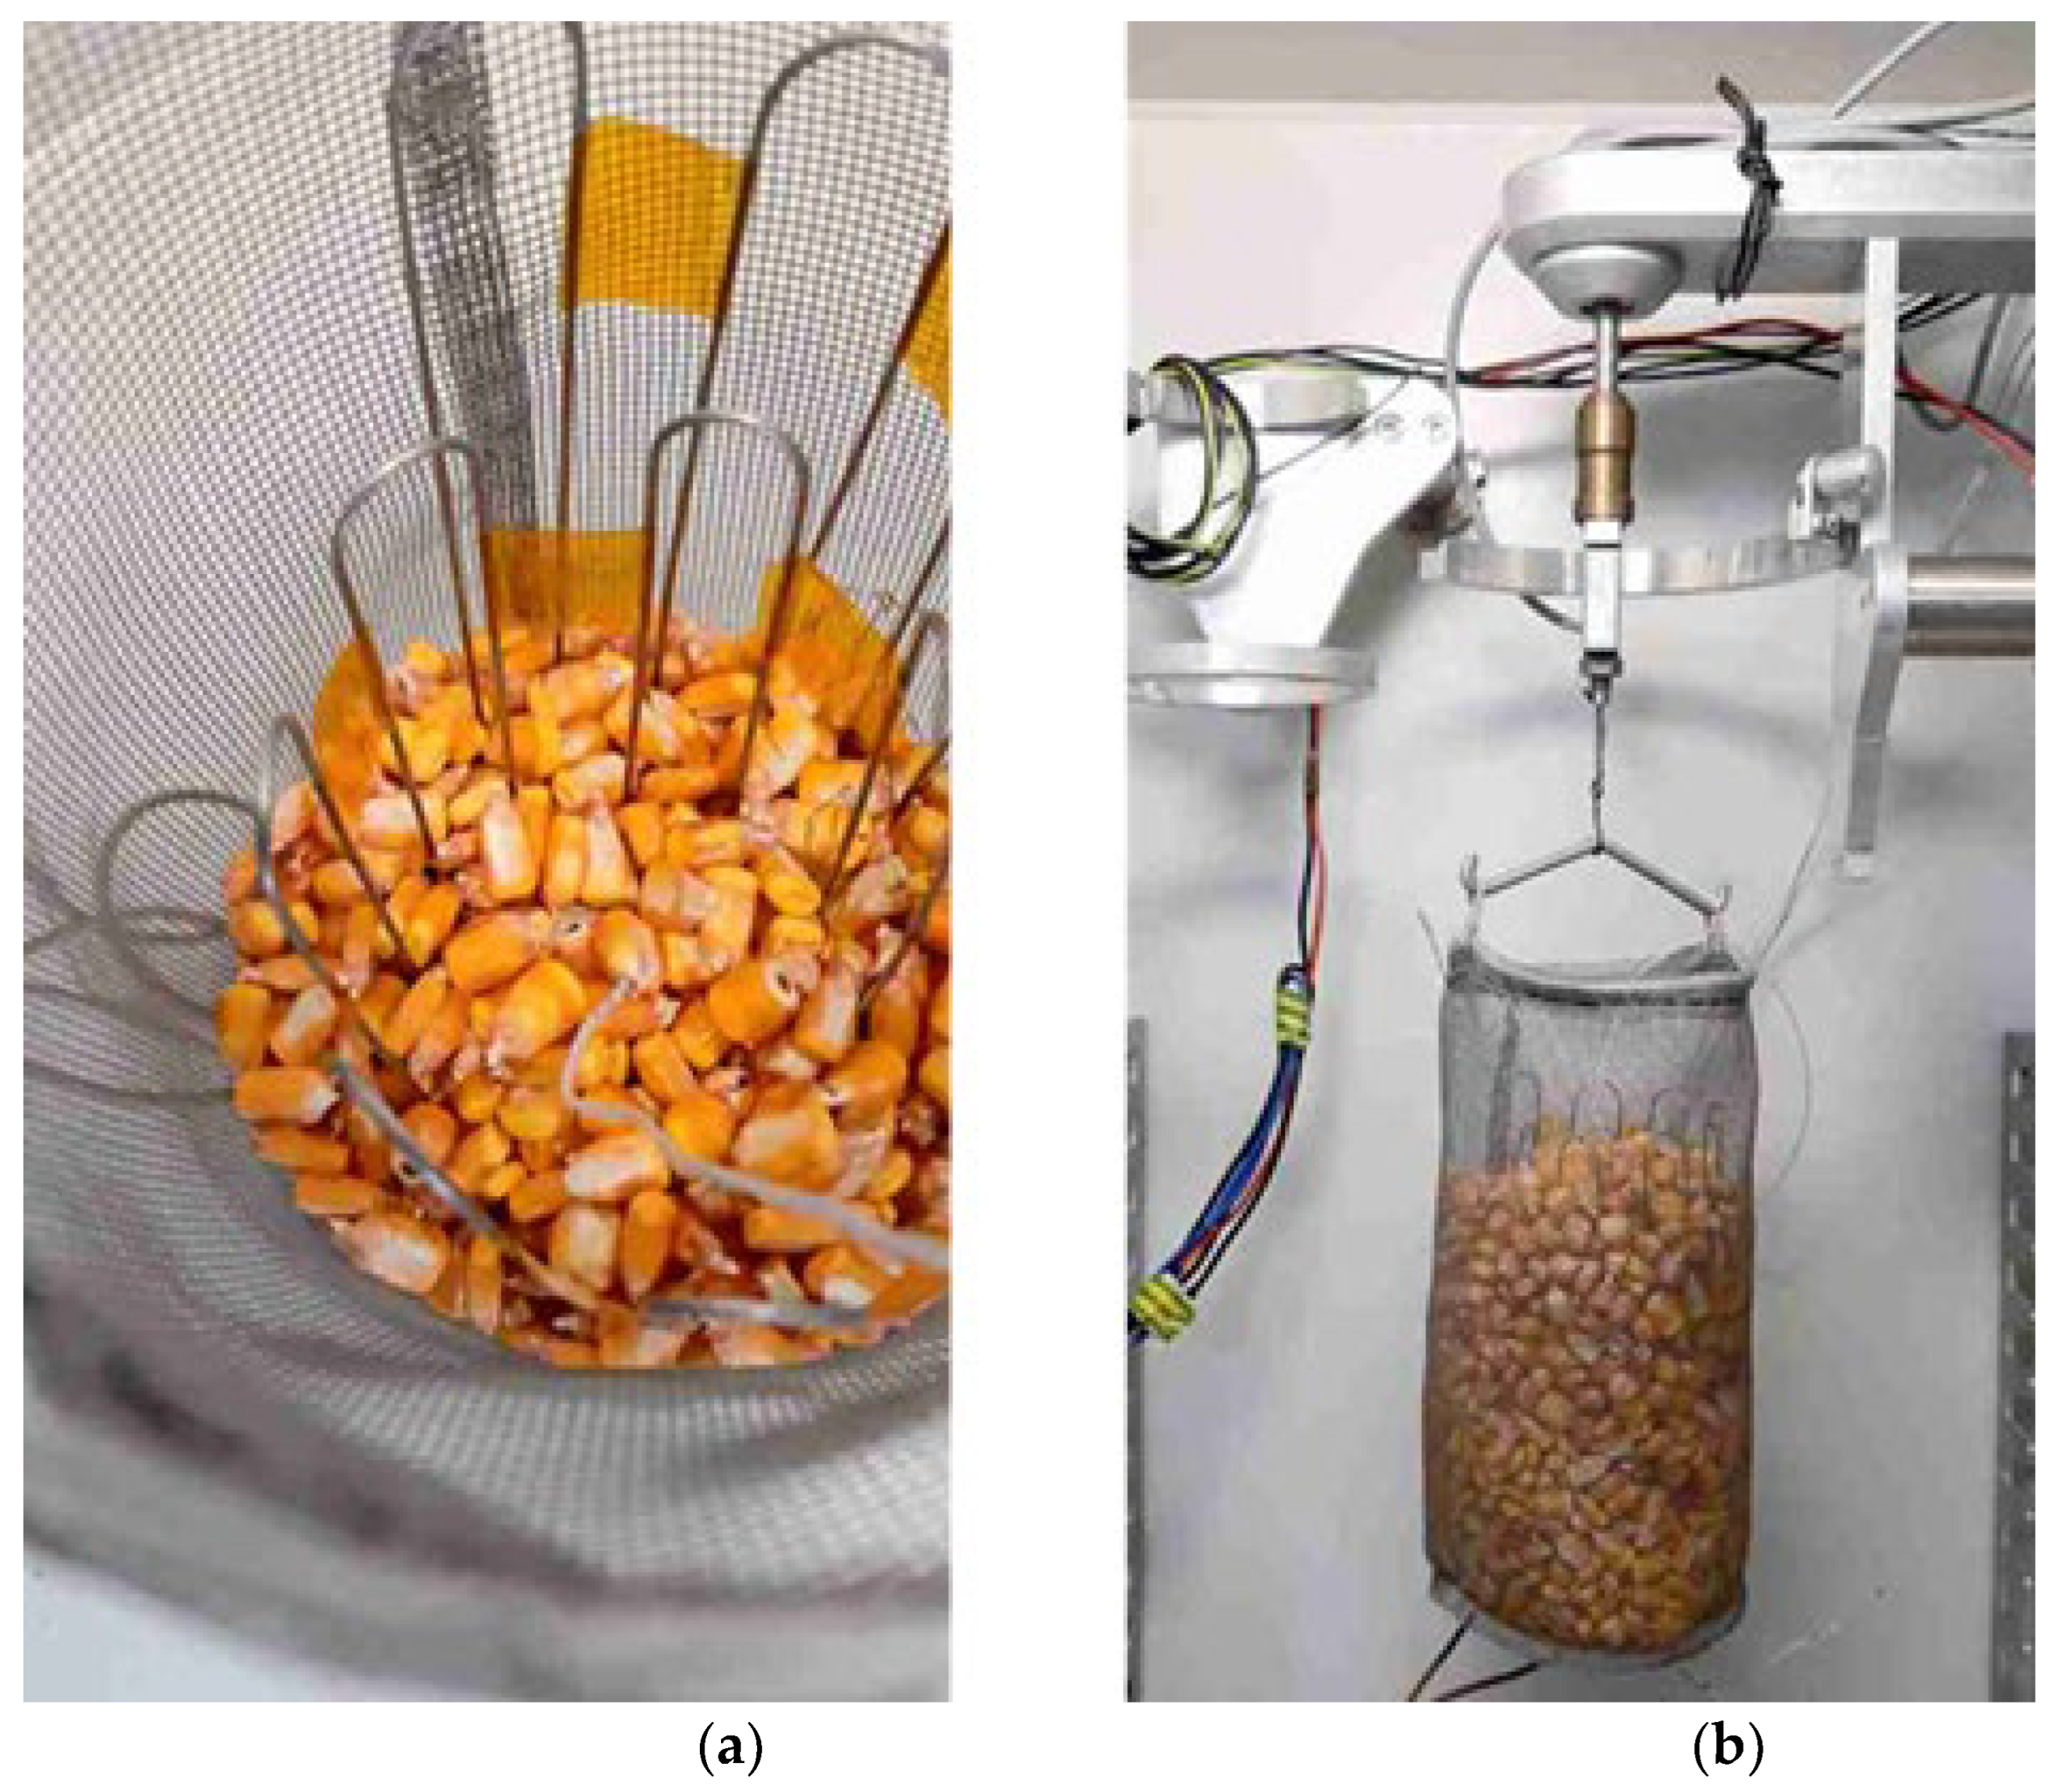
  • Preparation of a corn sample;
  • Heating of the corn sample in a vacuum chamber;
  • Evaporation of water from corn kernels in the vacuum chamber;
  • Drying of the corn sample on a sieve.
During the individual measurements of the corn samples under vacuum drying, the values of the following parameters were measured:
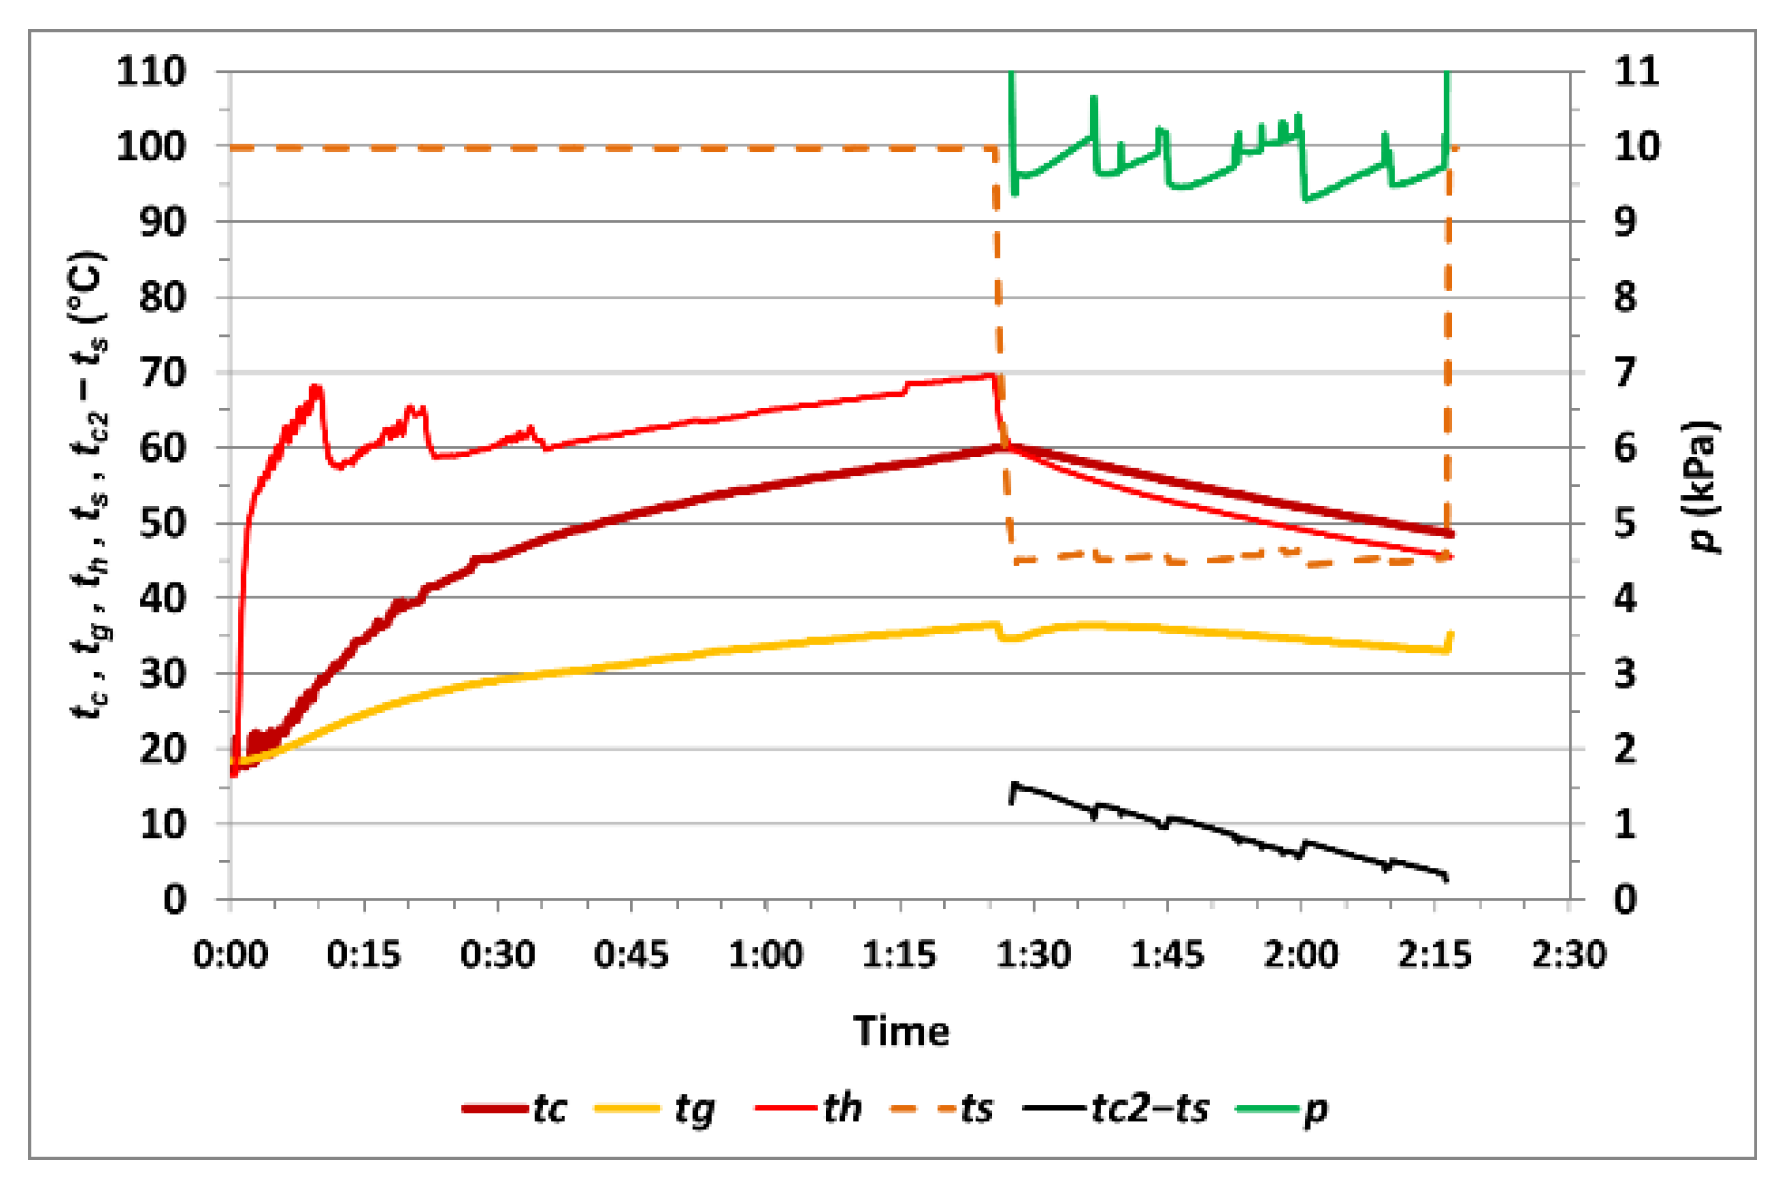
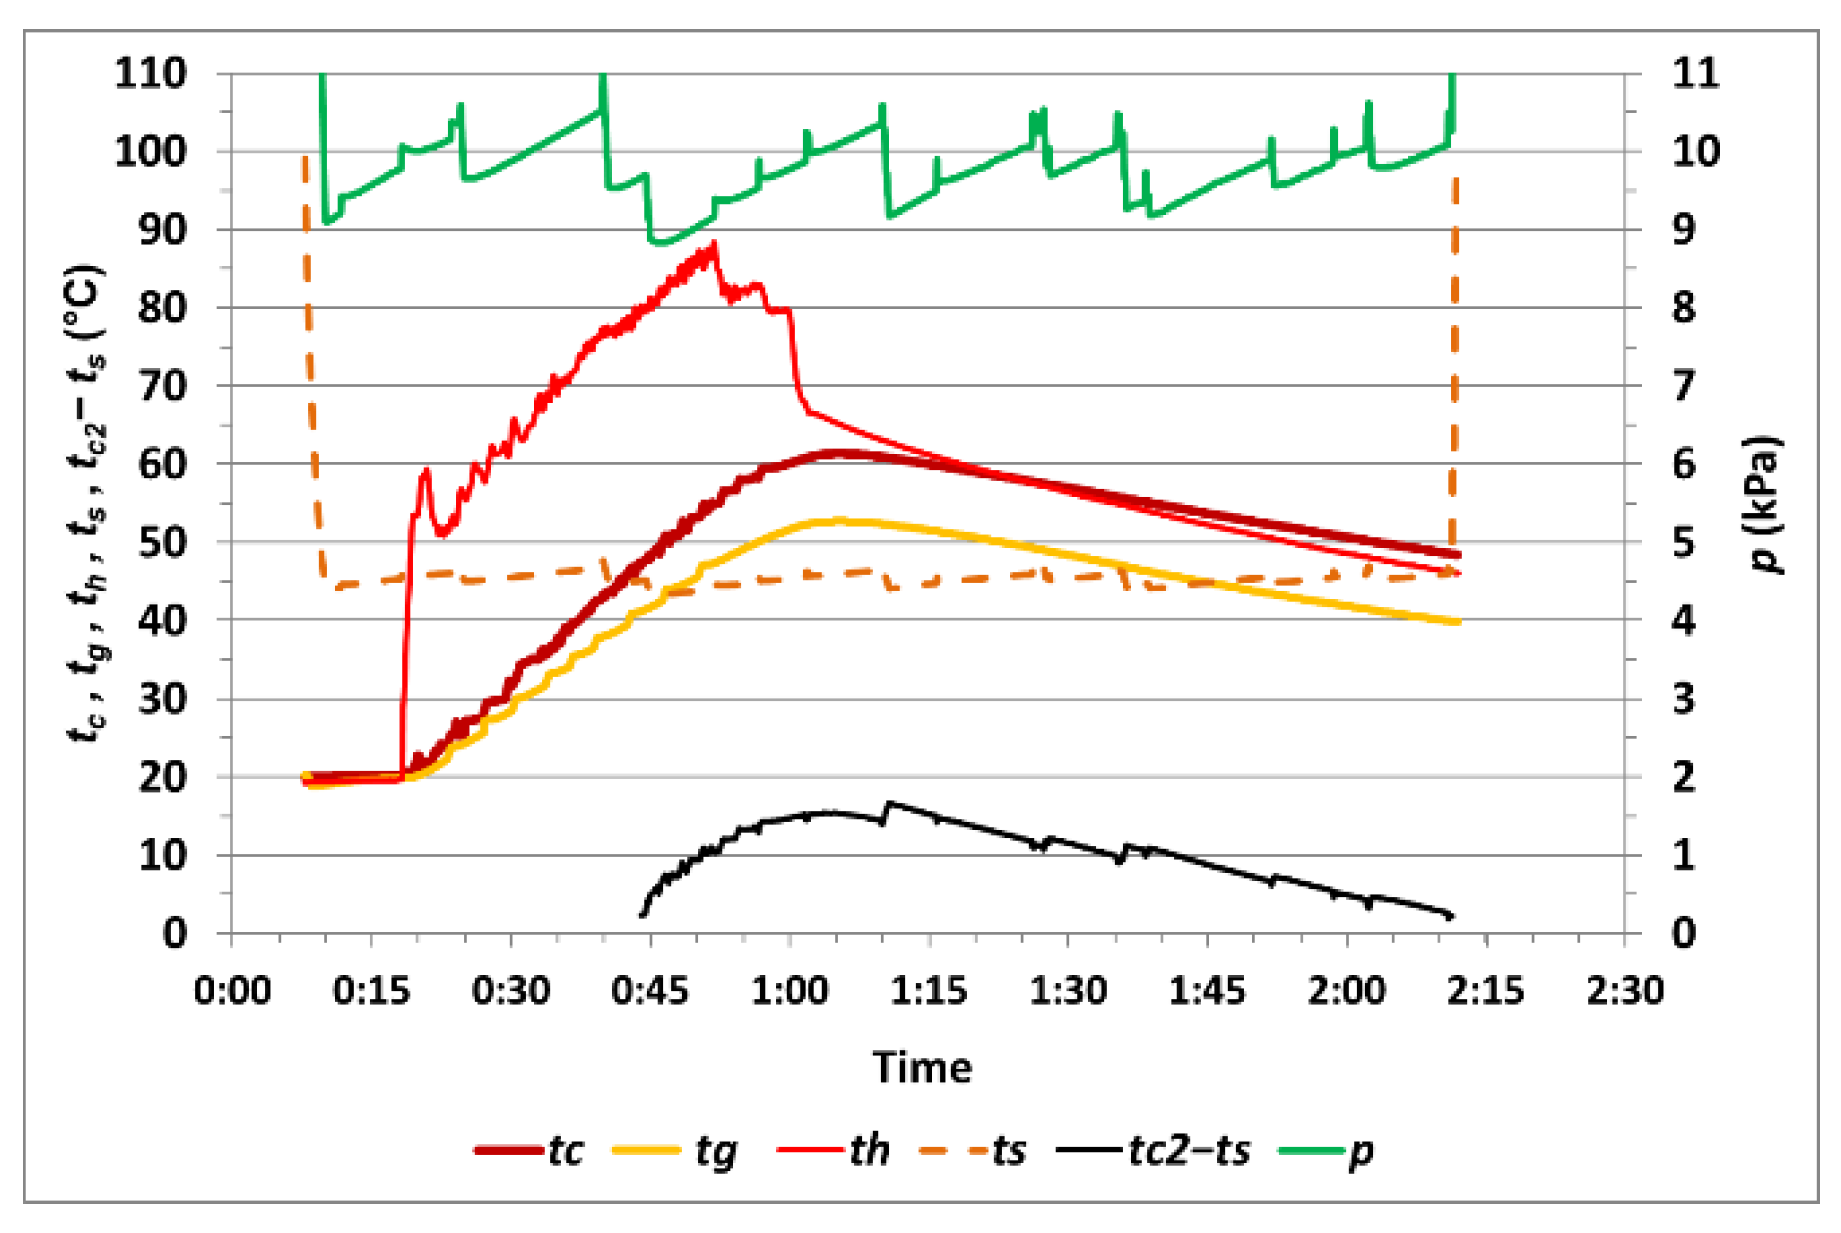
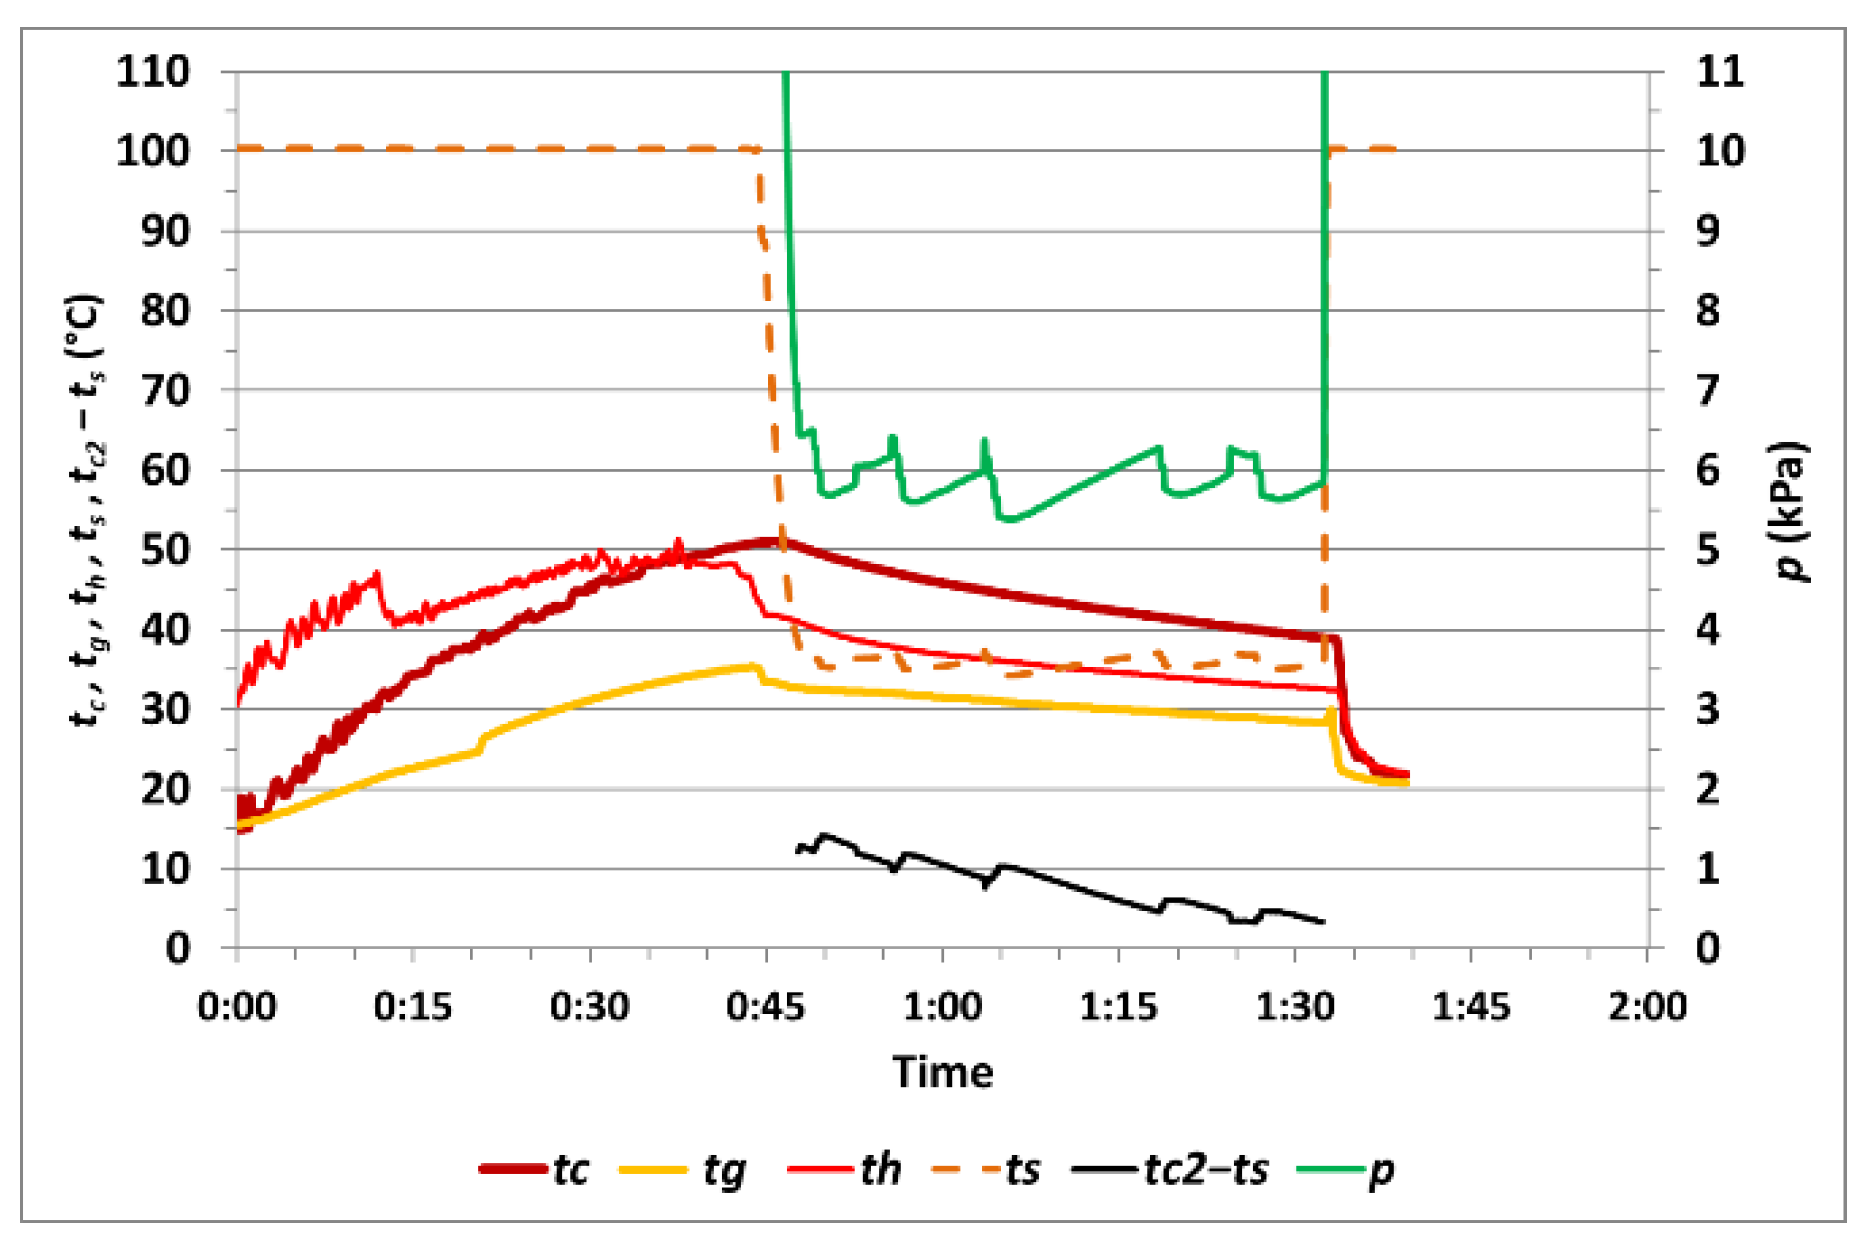
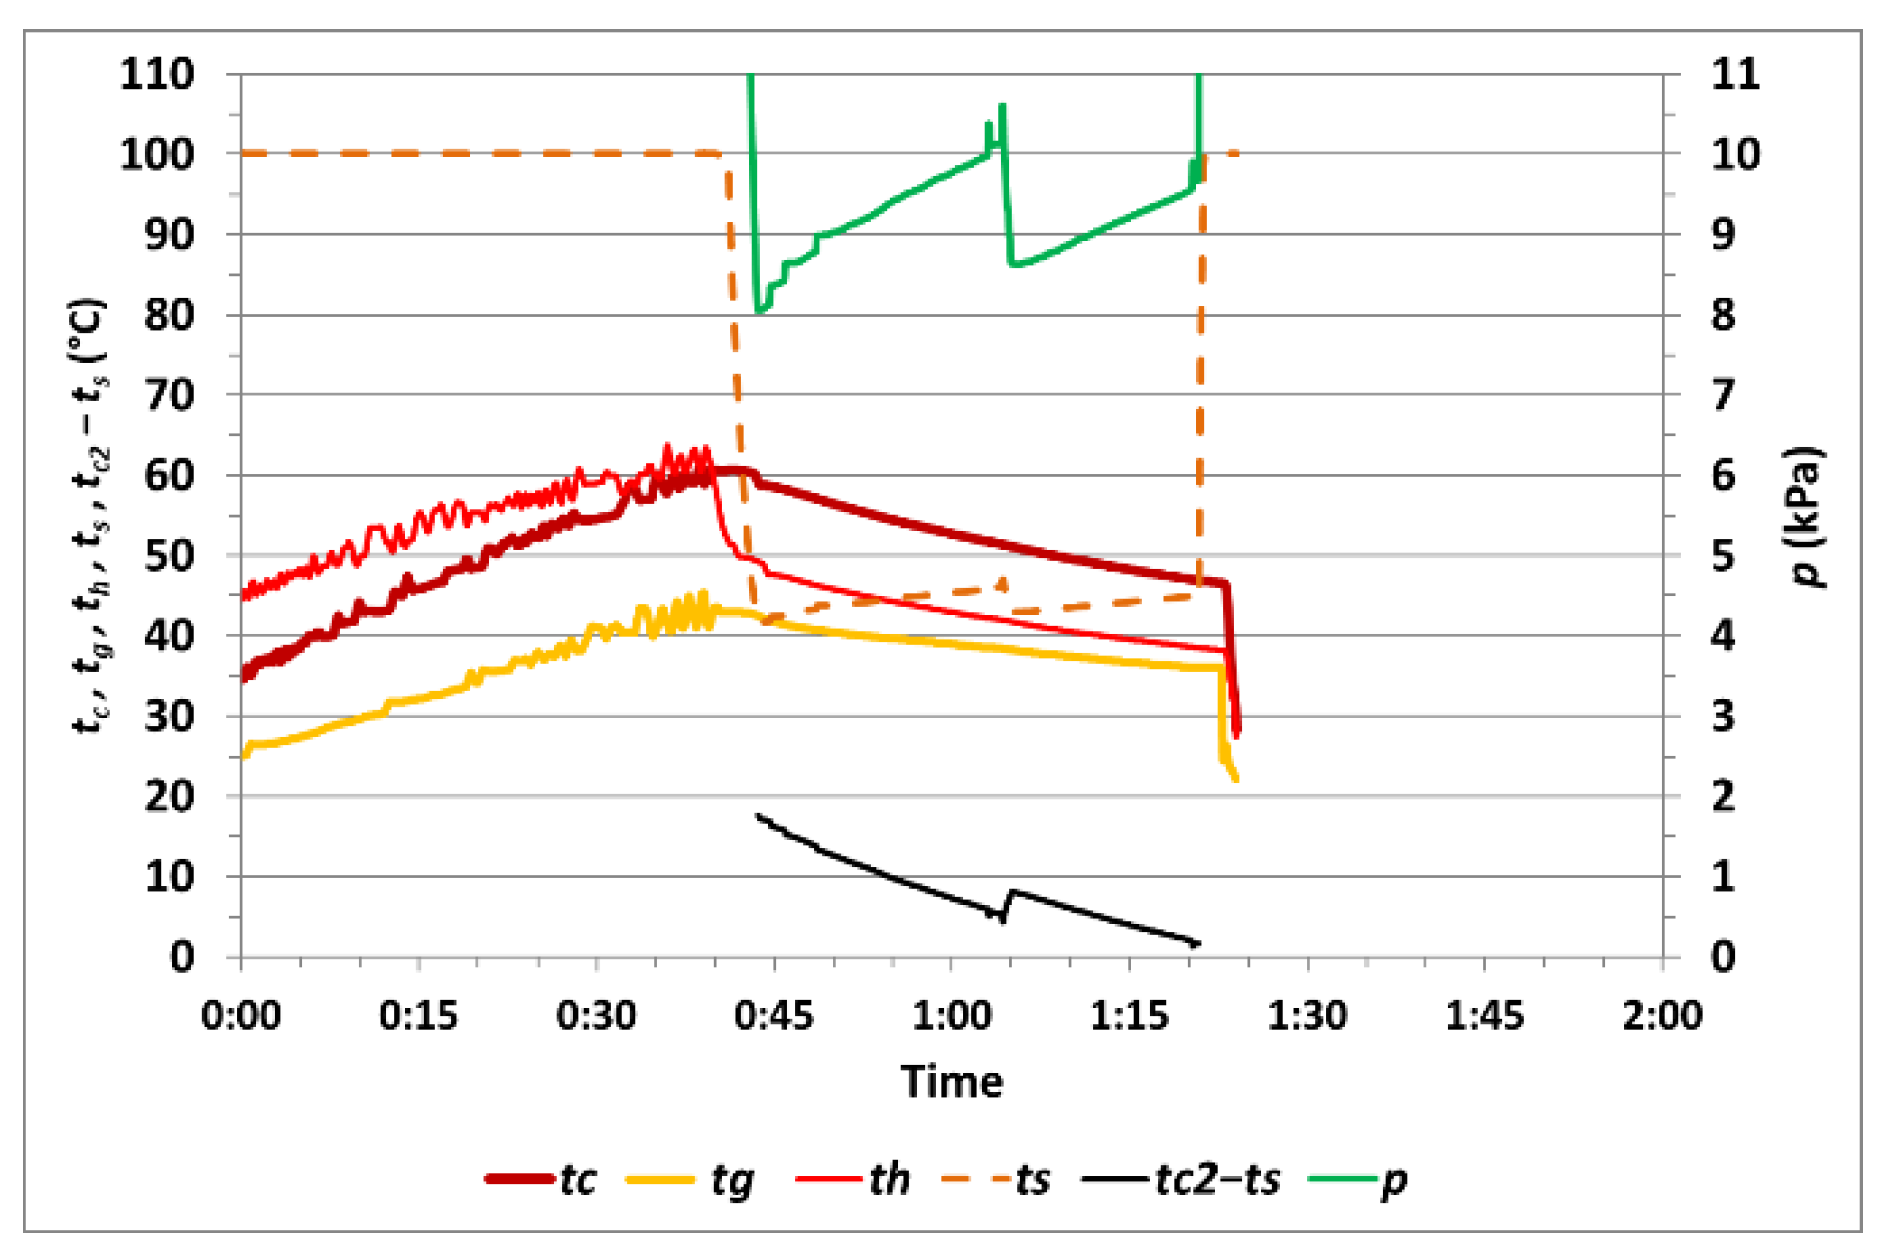
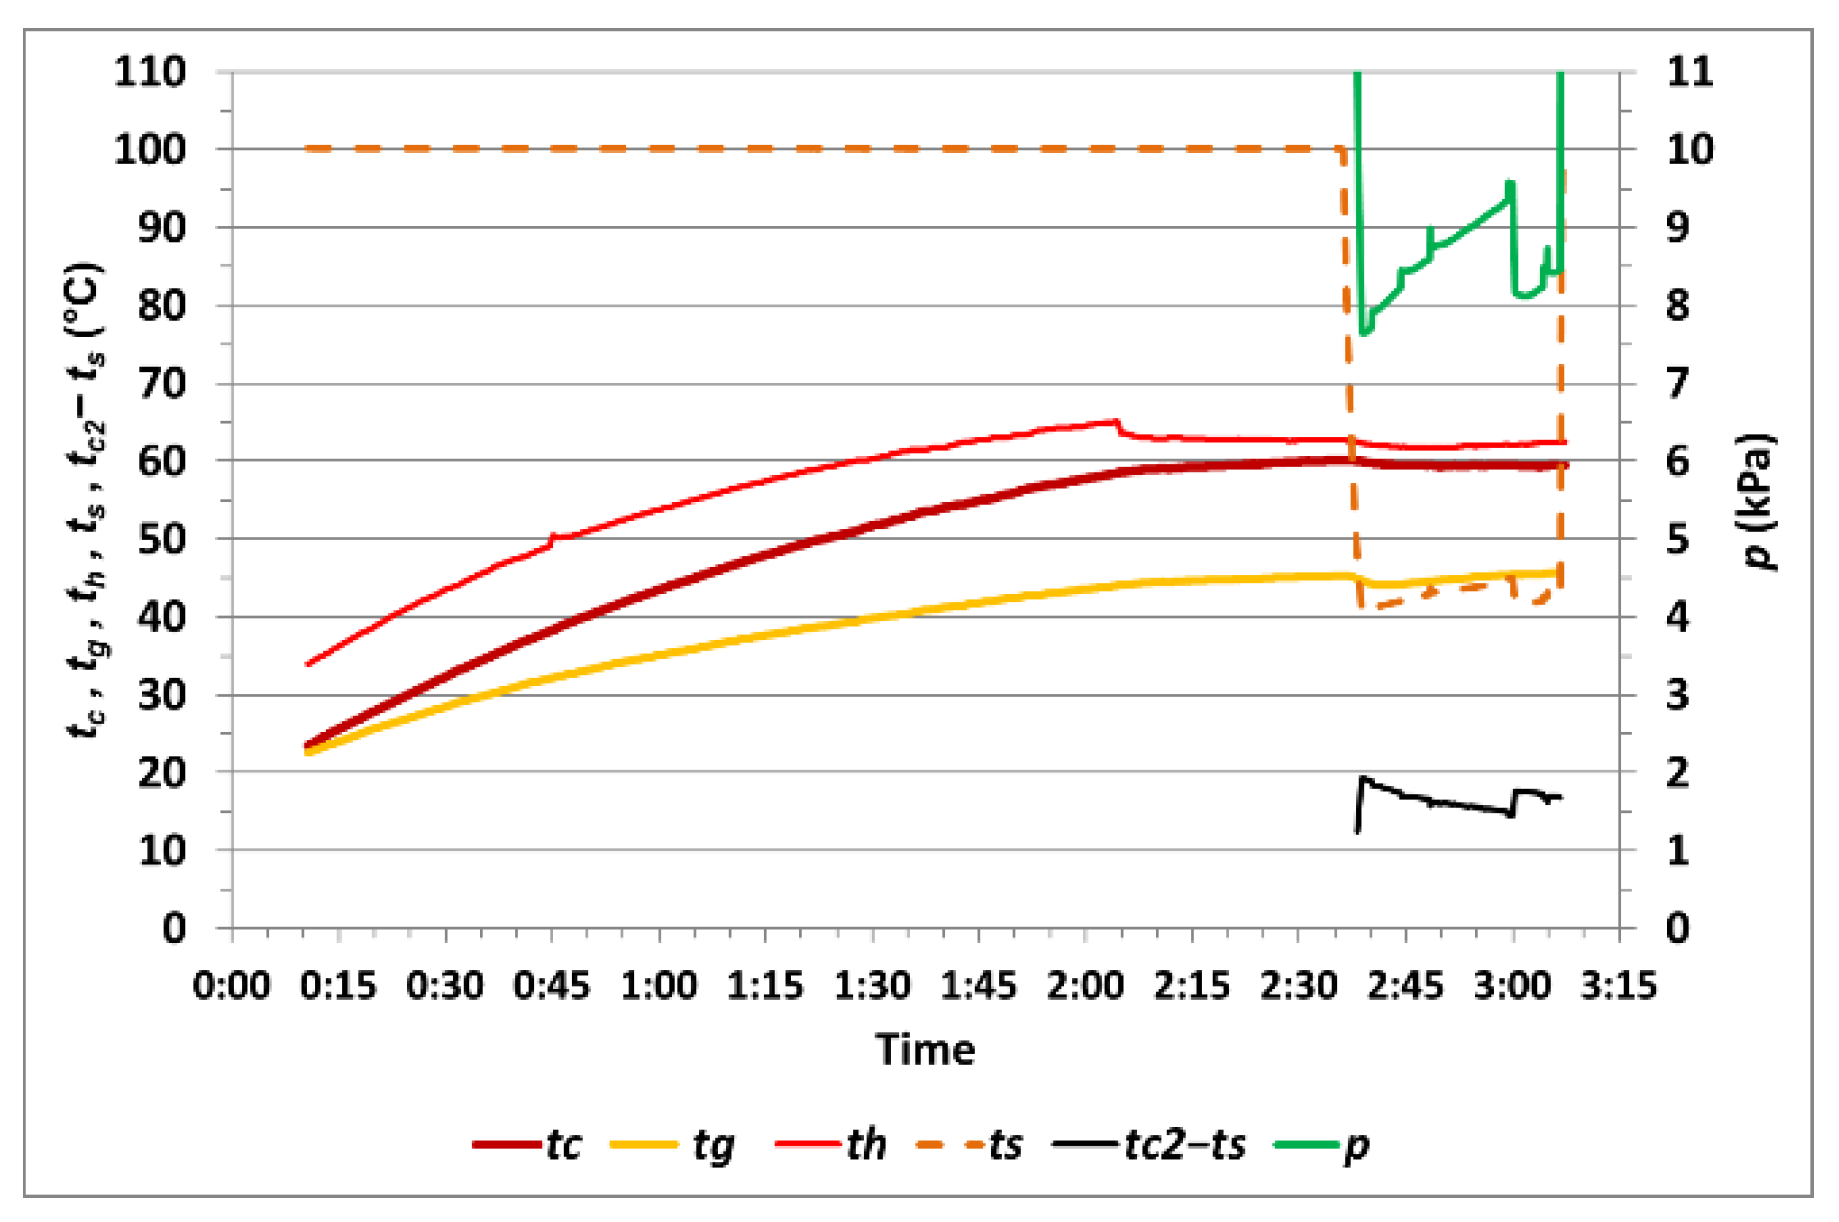
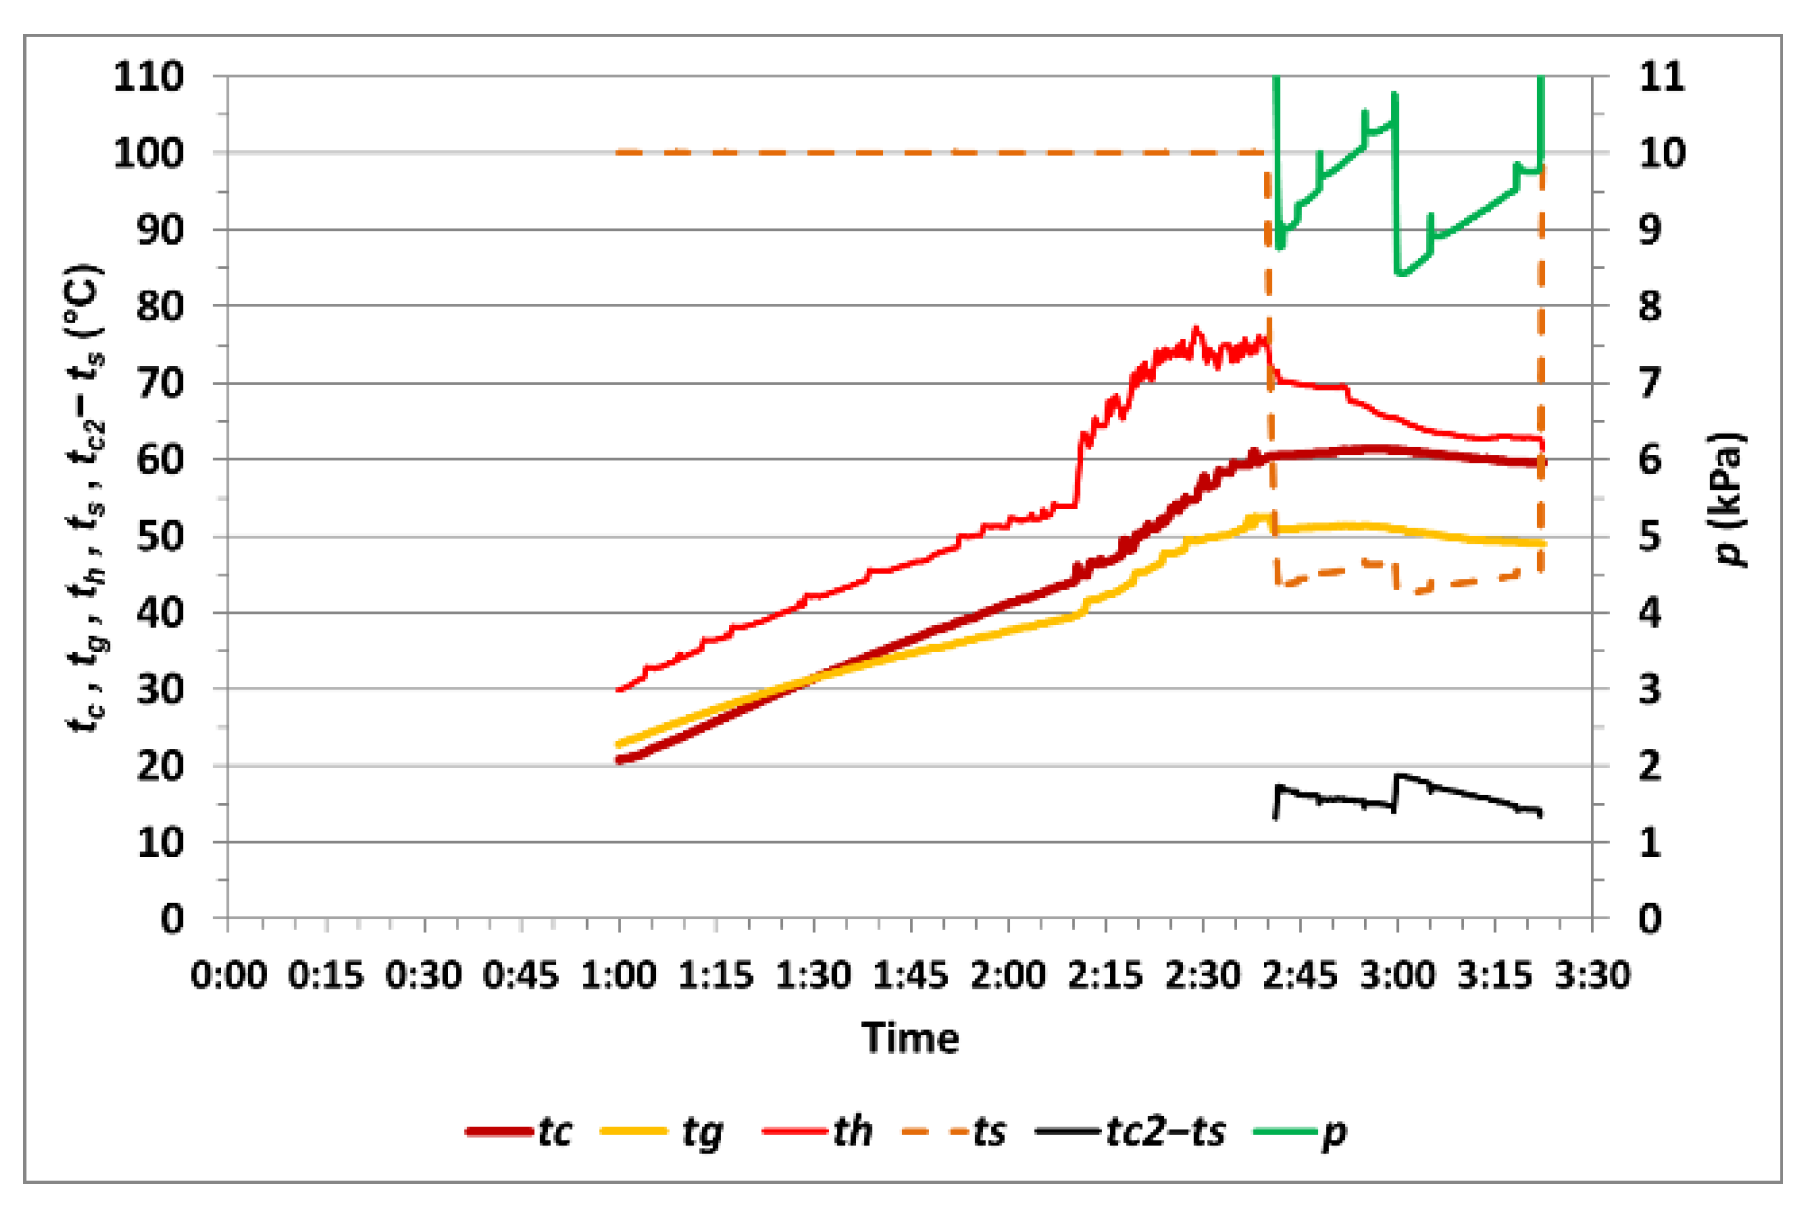
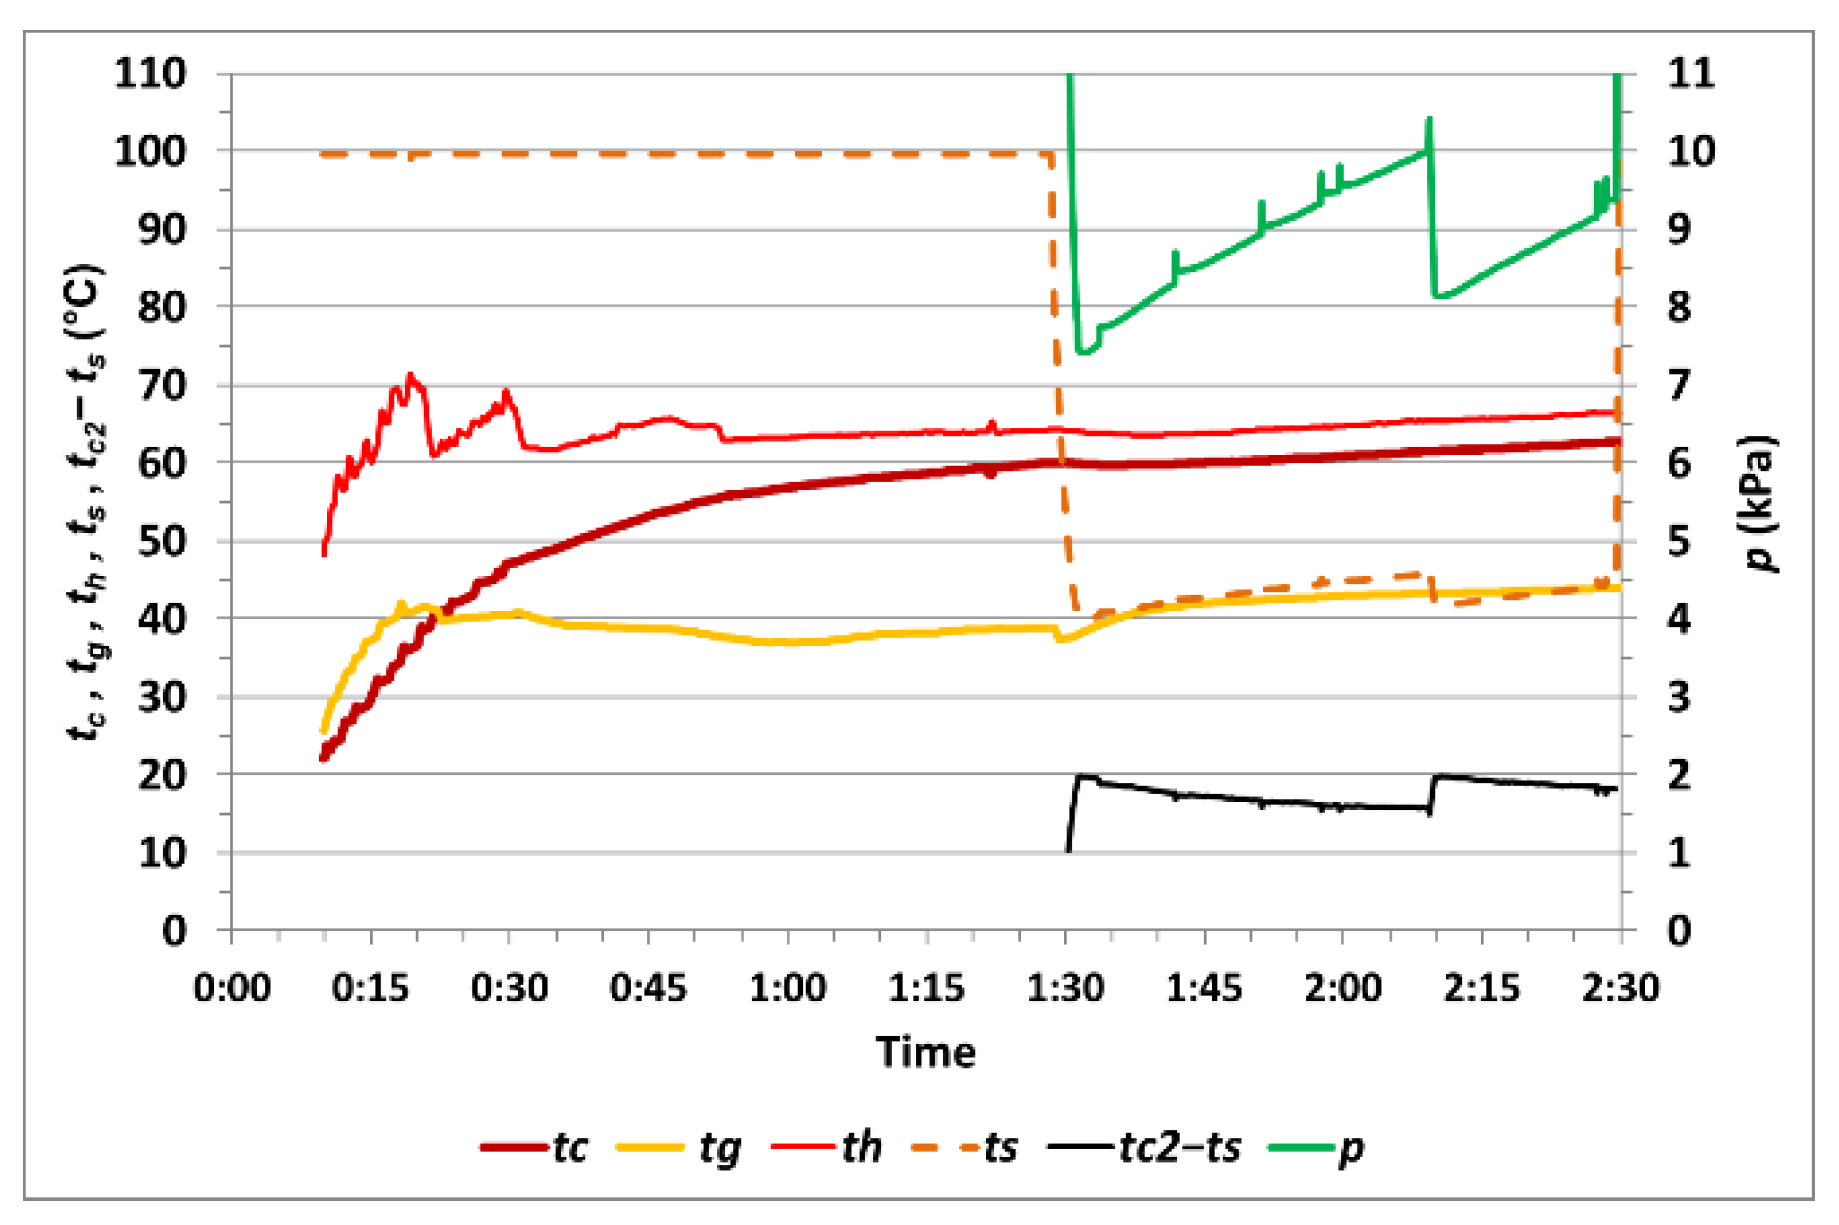
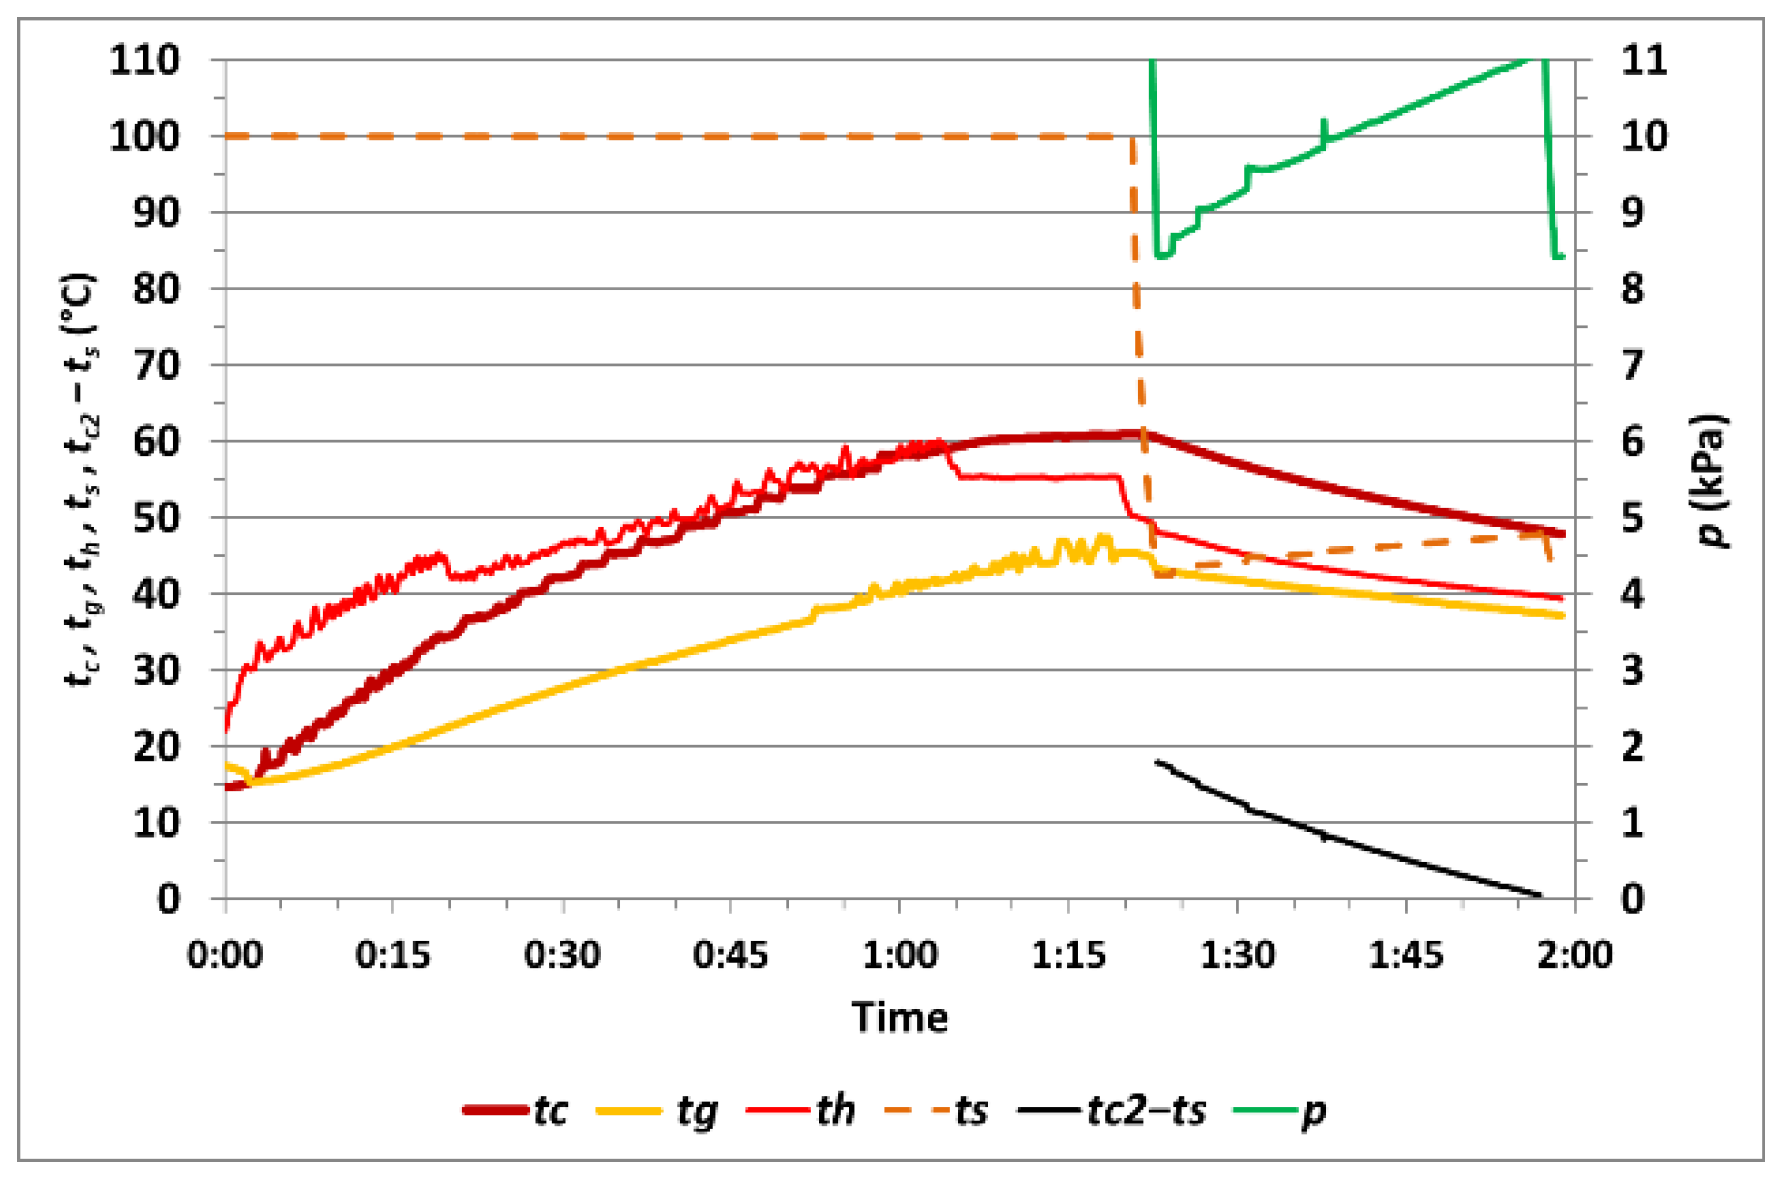
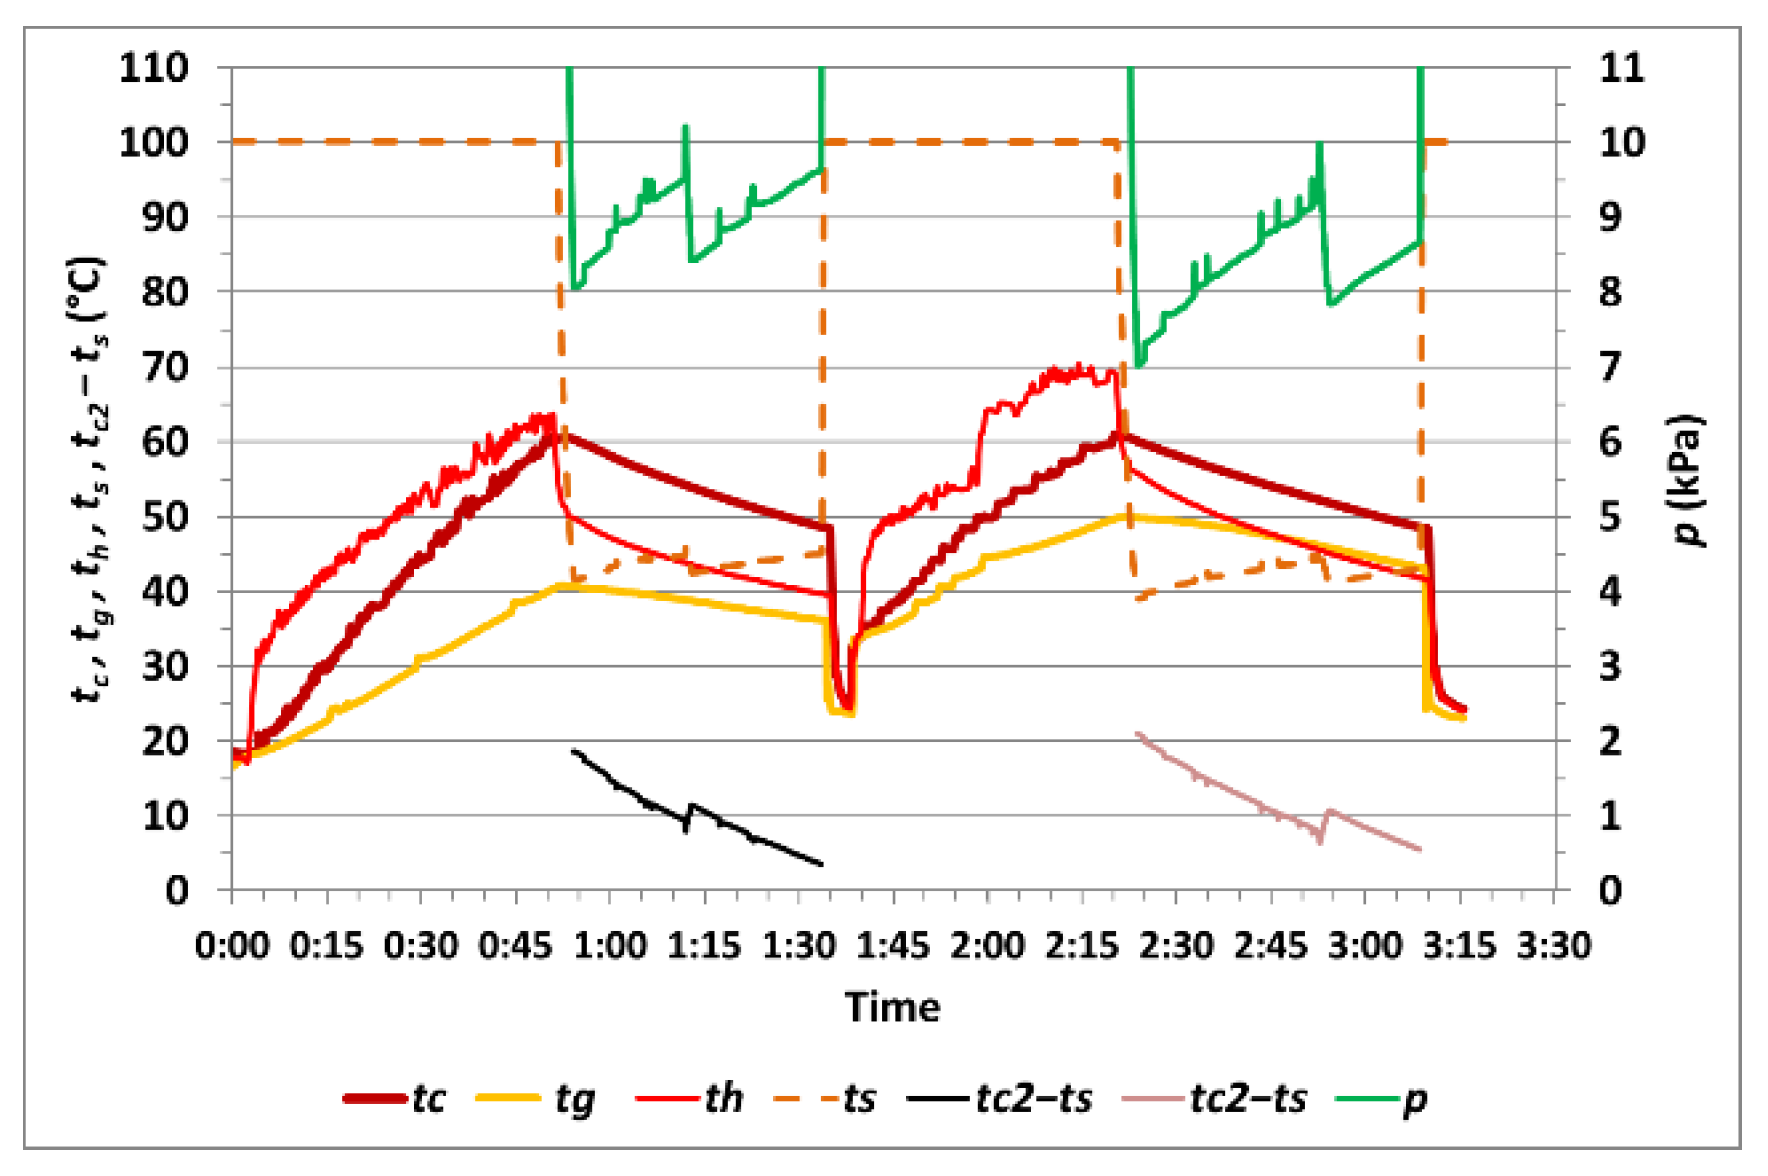
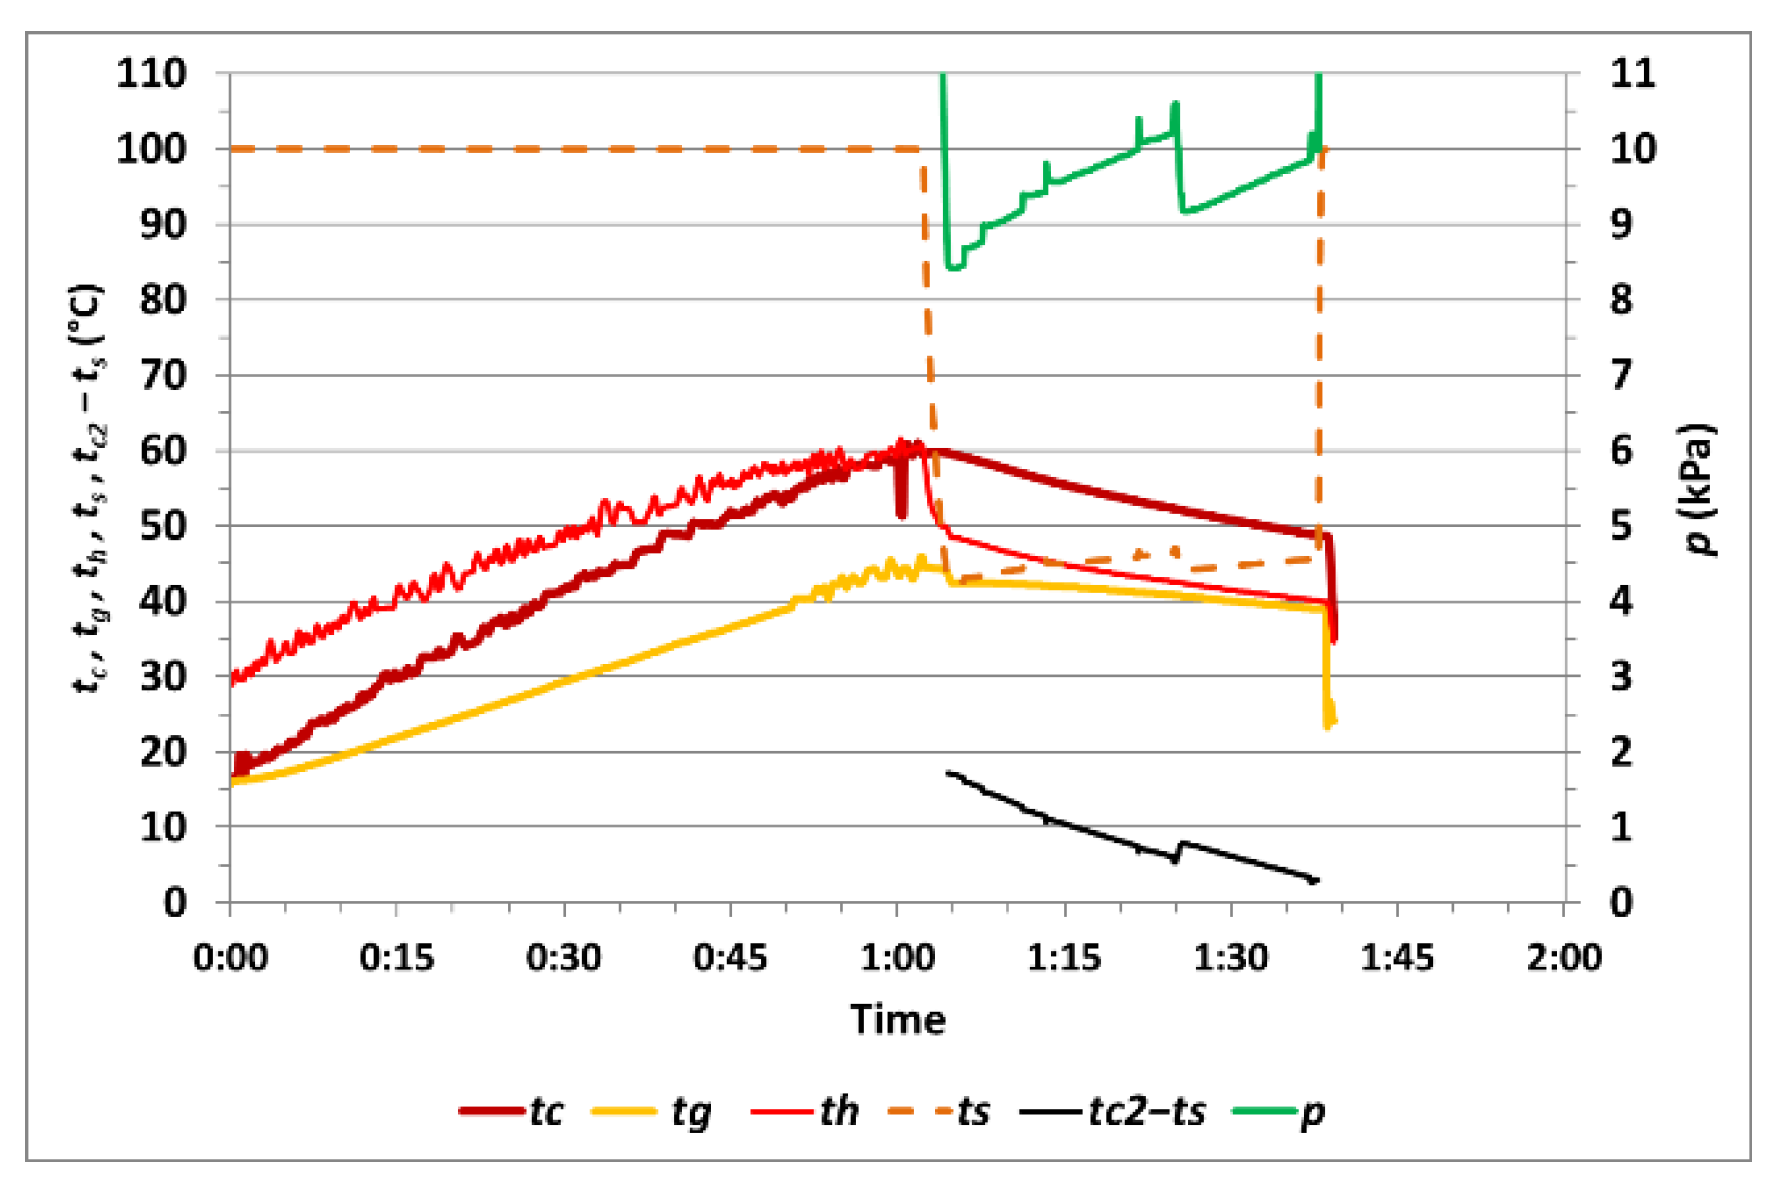
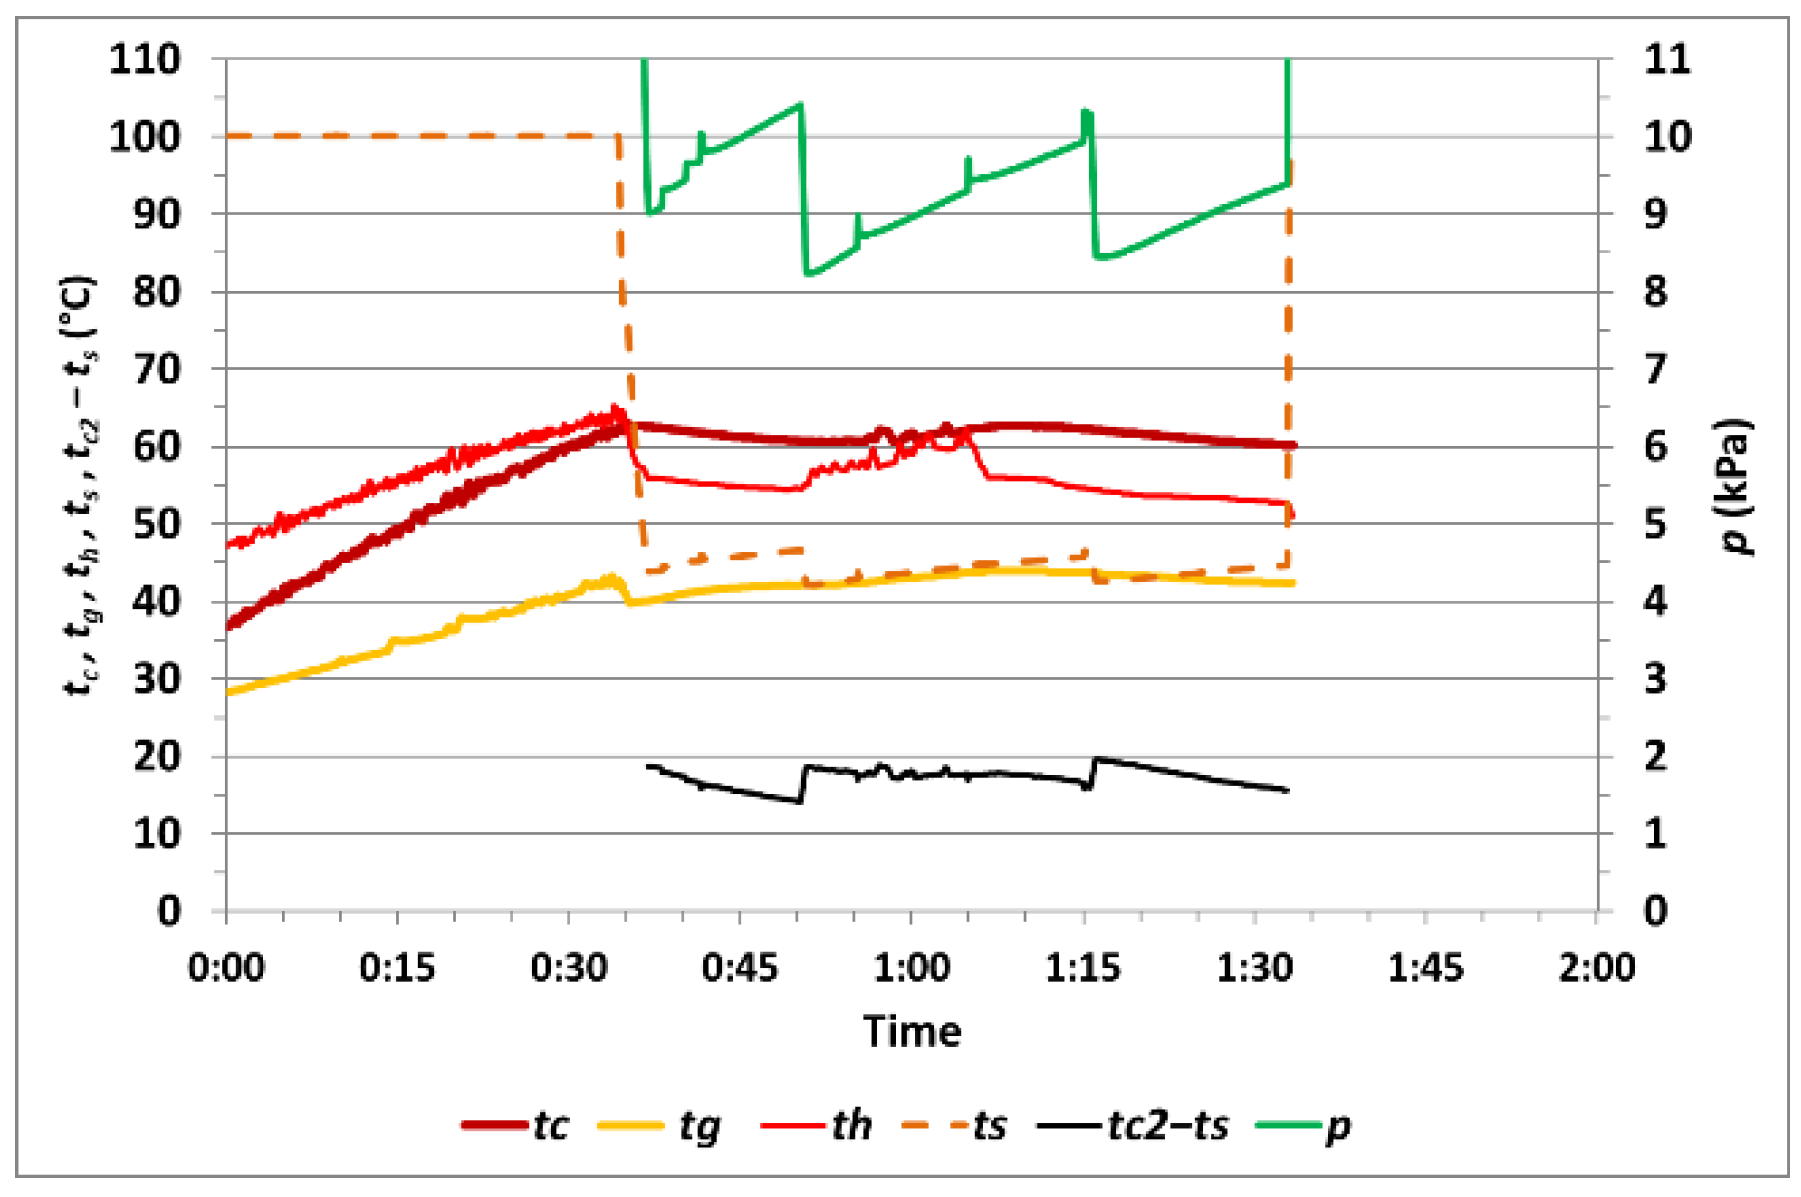
  • tc—temperature of the corn sample;
  • tg—temperature of the selected corn grain;
  • th—temperature of the electrically heated coils;
  • t—temperature of moist air in the vacuum chamber;
  • p—pressure of moist air in the vacuum chamber.
The weight of each corn sample was measured using a laboratory scale at different time points:
  • mc1—at the beginning of the measurement;
  • mc2—after removing the sample from the vacuum chamber;
  • mc3—after drying the sample on the sieve.
Considering the goal of the research task—to structurally design, manufacture and operate a prototype of a mobile vacuum dryer intended for drying corn—the methodology of the experiment was aimed at optimizing the vacuum drying process.
Using a simplified physical model of the vacuum dryer, individual measurements of the corn samples under vacuum drying were performed so that the influence of the following variables could be analyzed:
  • Pressure p1 in the vacuum chamber during the heating of a corn sample;
  • Pressure p2 in the vacuum chamber during the evaporation of water from the corn sample;
  • Changes in the temperature tc2 of the corn sample due to the regulation of the power input by the coils during the evaporation of water from the corn sample;
  • Time τ2 of heating during the evaporation of water from the corn sample;
  • Number of cycles of evaporation of water from the corn sample to reduce moisture.
A total of 14 measurements of the corn samples were carried out using the experimental equipment of the vacuum dryer. In February 2022, measurements no. 1 to no. 9 were performed, and then measurements no. 10 to no. 14 were carried out in April 2022. The values of the measured variables obtained from the individual measurements of the corn samples under vacuum drying are listed in Table 1.
During measurements no. 1 to no. 14, the moisture content of the samples was measured before drying (wc1), after removal from the vacuum chamber (wc2) and after the additional evaporation of water from the surface of the grains that were placed loosely on a sieve (wc3). The accuracy of the class I hygrometer used in this study, as a typical instrument used in commercial transactions, was subjected to verification. Uncertainties of the hygrometer measurements affected the corn moisture values wc1, wc2 and wc3. For example, measurements no. 9 to no. 14 were carried out over a period of 7 days in April 2022, while the detected moisture values wc1 of the corn samples at the beginning of the measurement differed by 6.7%.
During the verification of the metrological accuracy of the hygrometer, the testing methods were defined. Determination of the moisture content of five samples with the same measured corn moisture content was carried out using the reference gravimetric method under the conditions listed in Table 2.
The corn samples were prepared just before the measurements by separating the kernels from the husks. The initial moisture wc1 of the reference corn samples during the two periods of the experiment was as follows (Table 3):
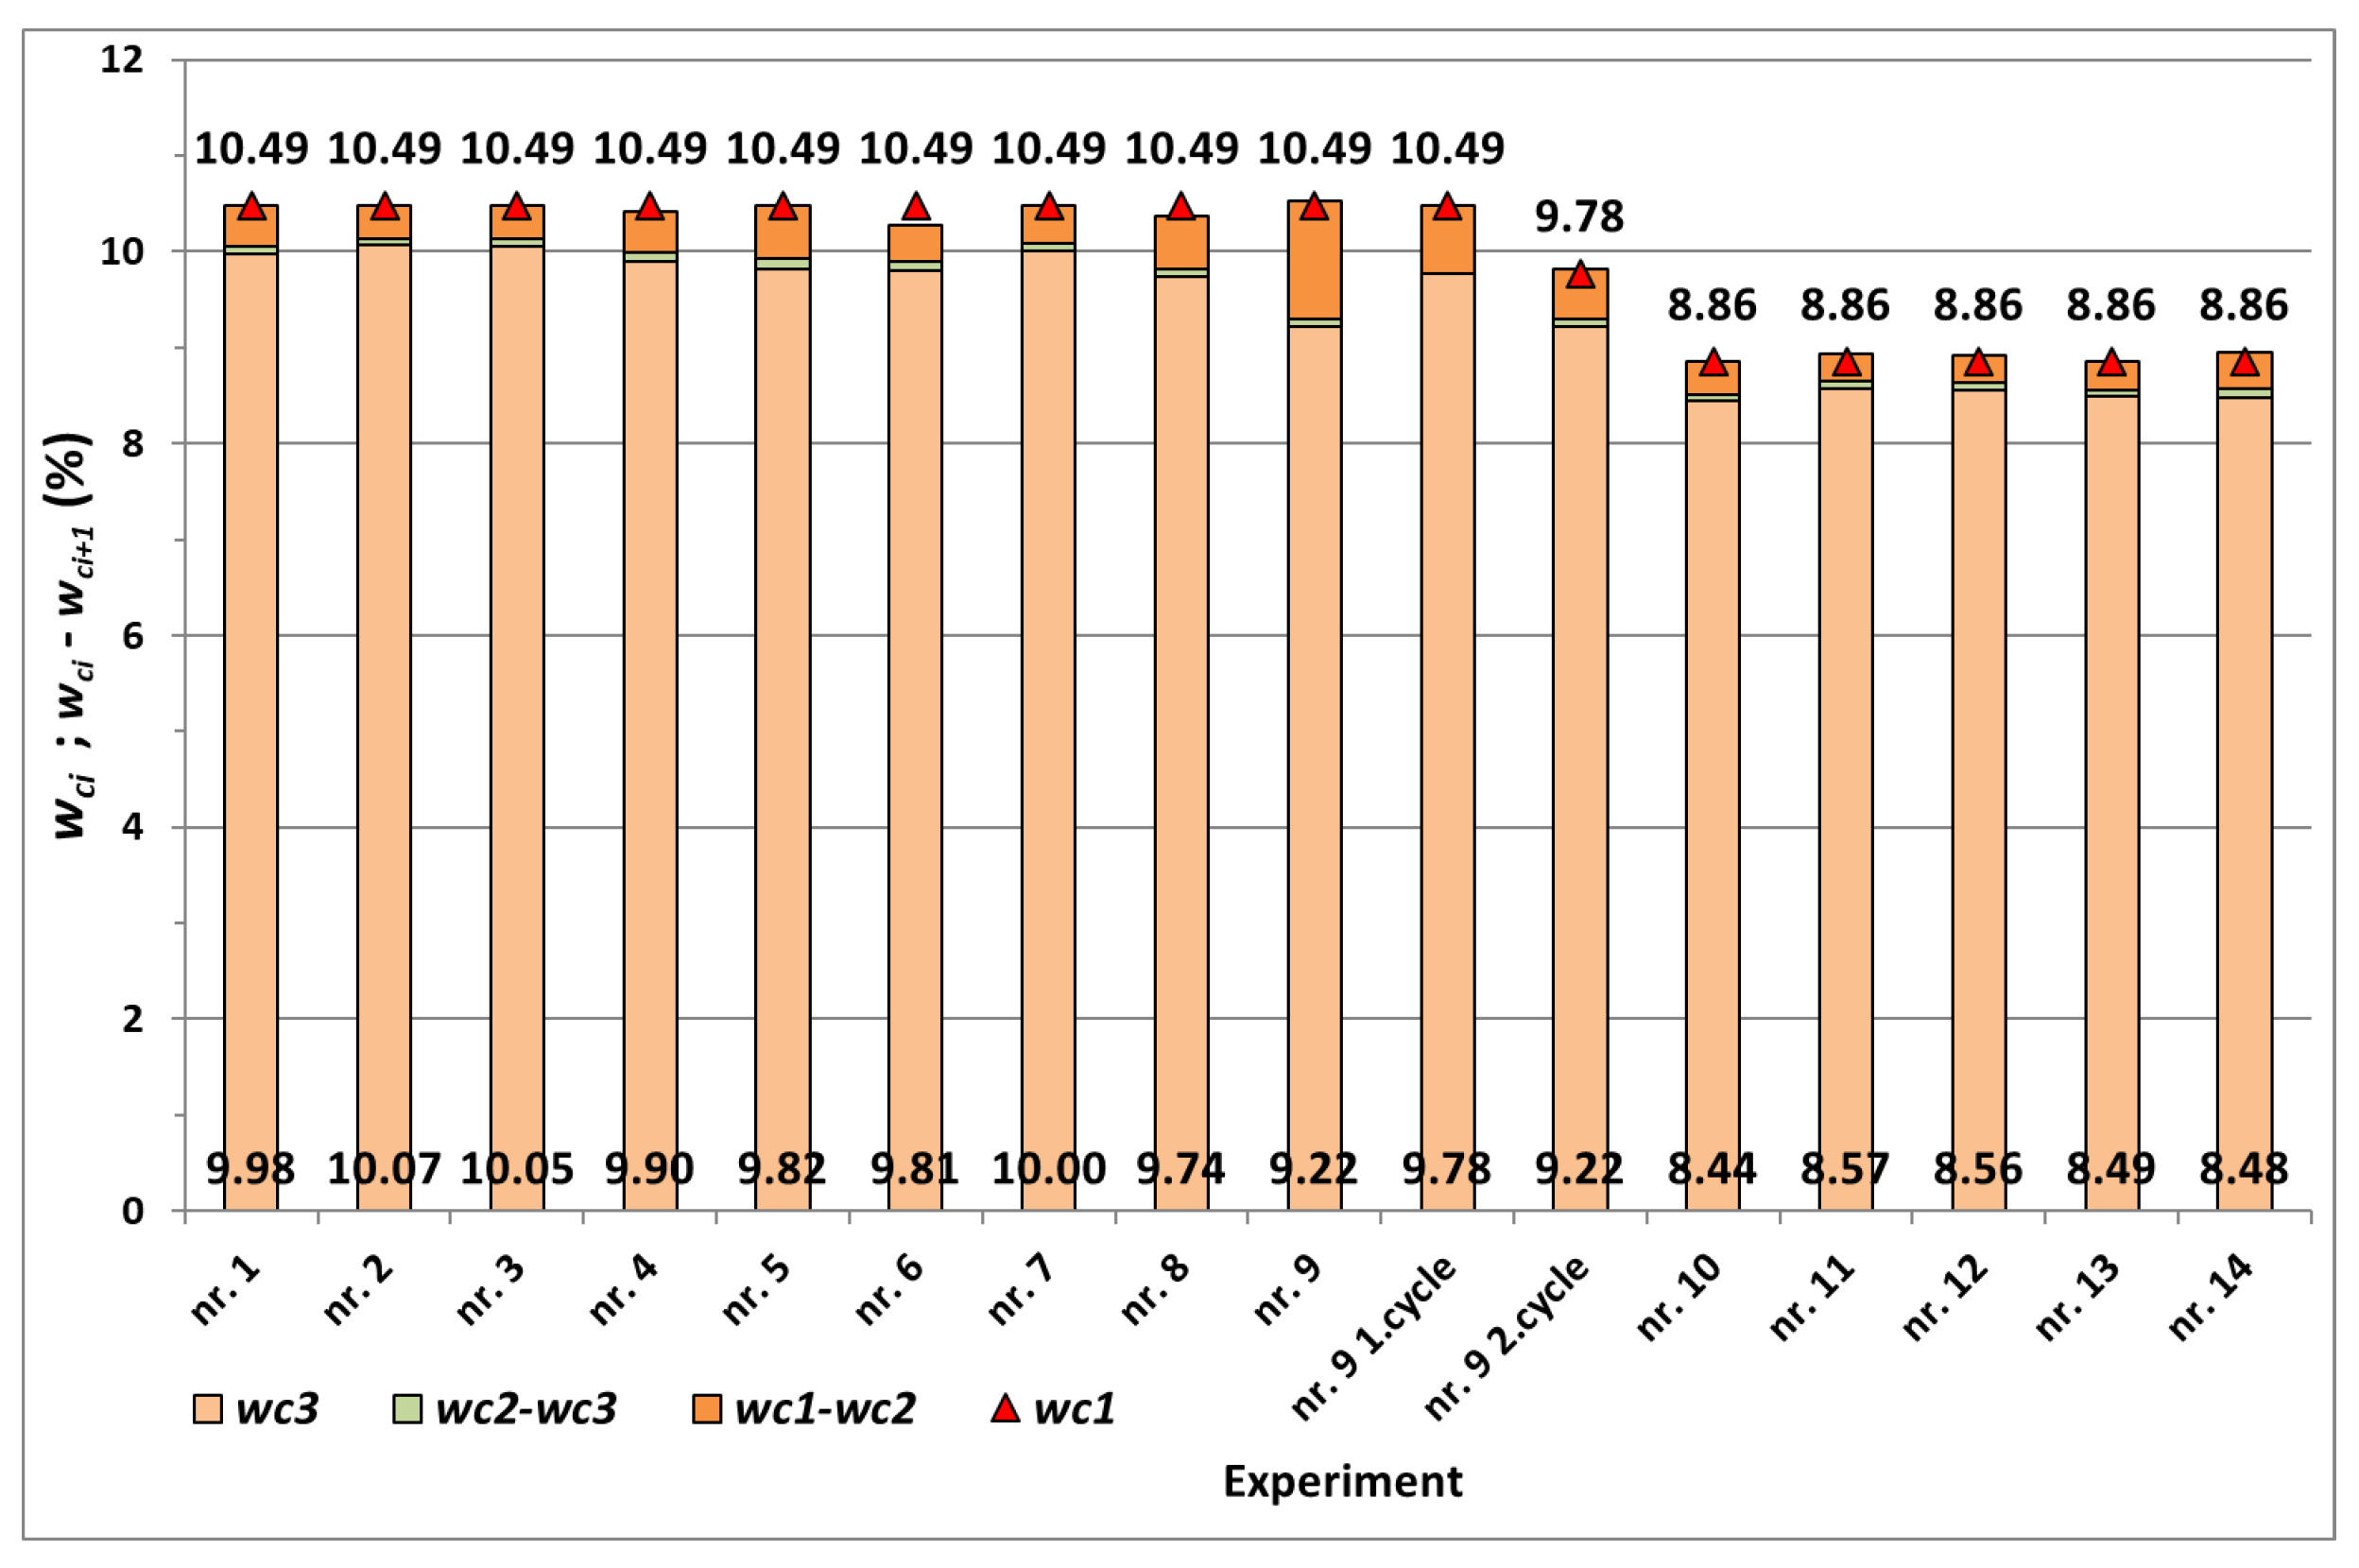
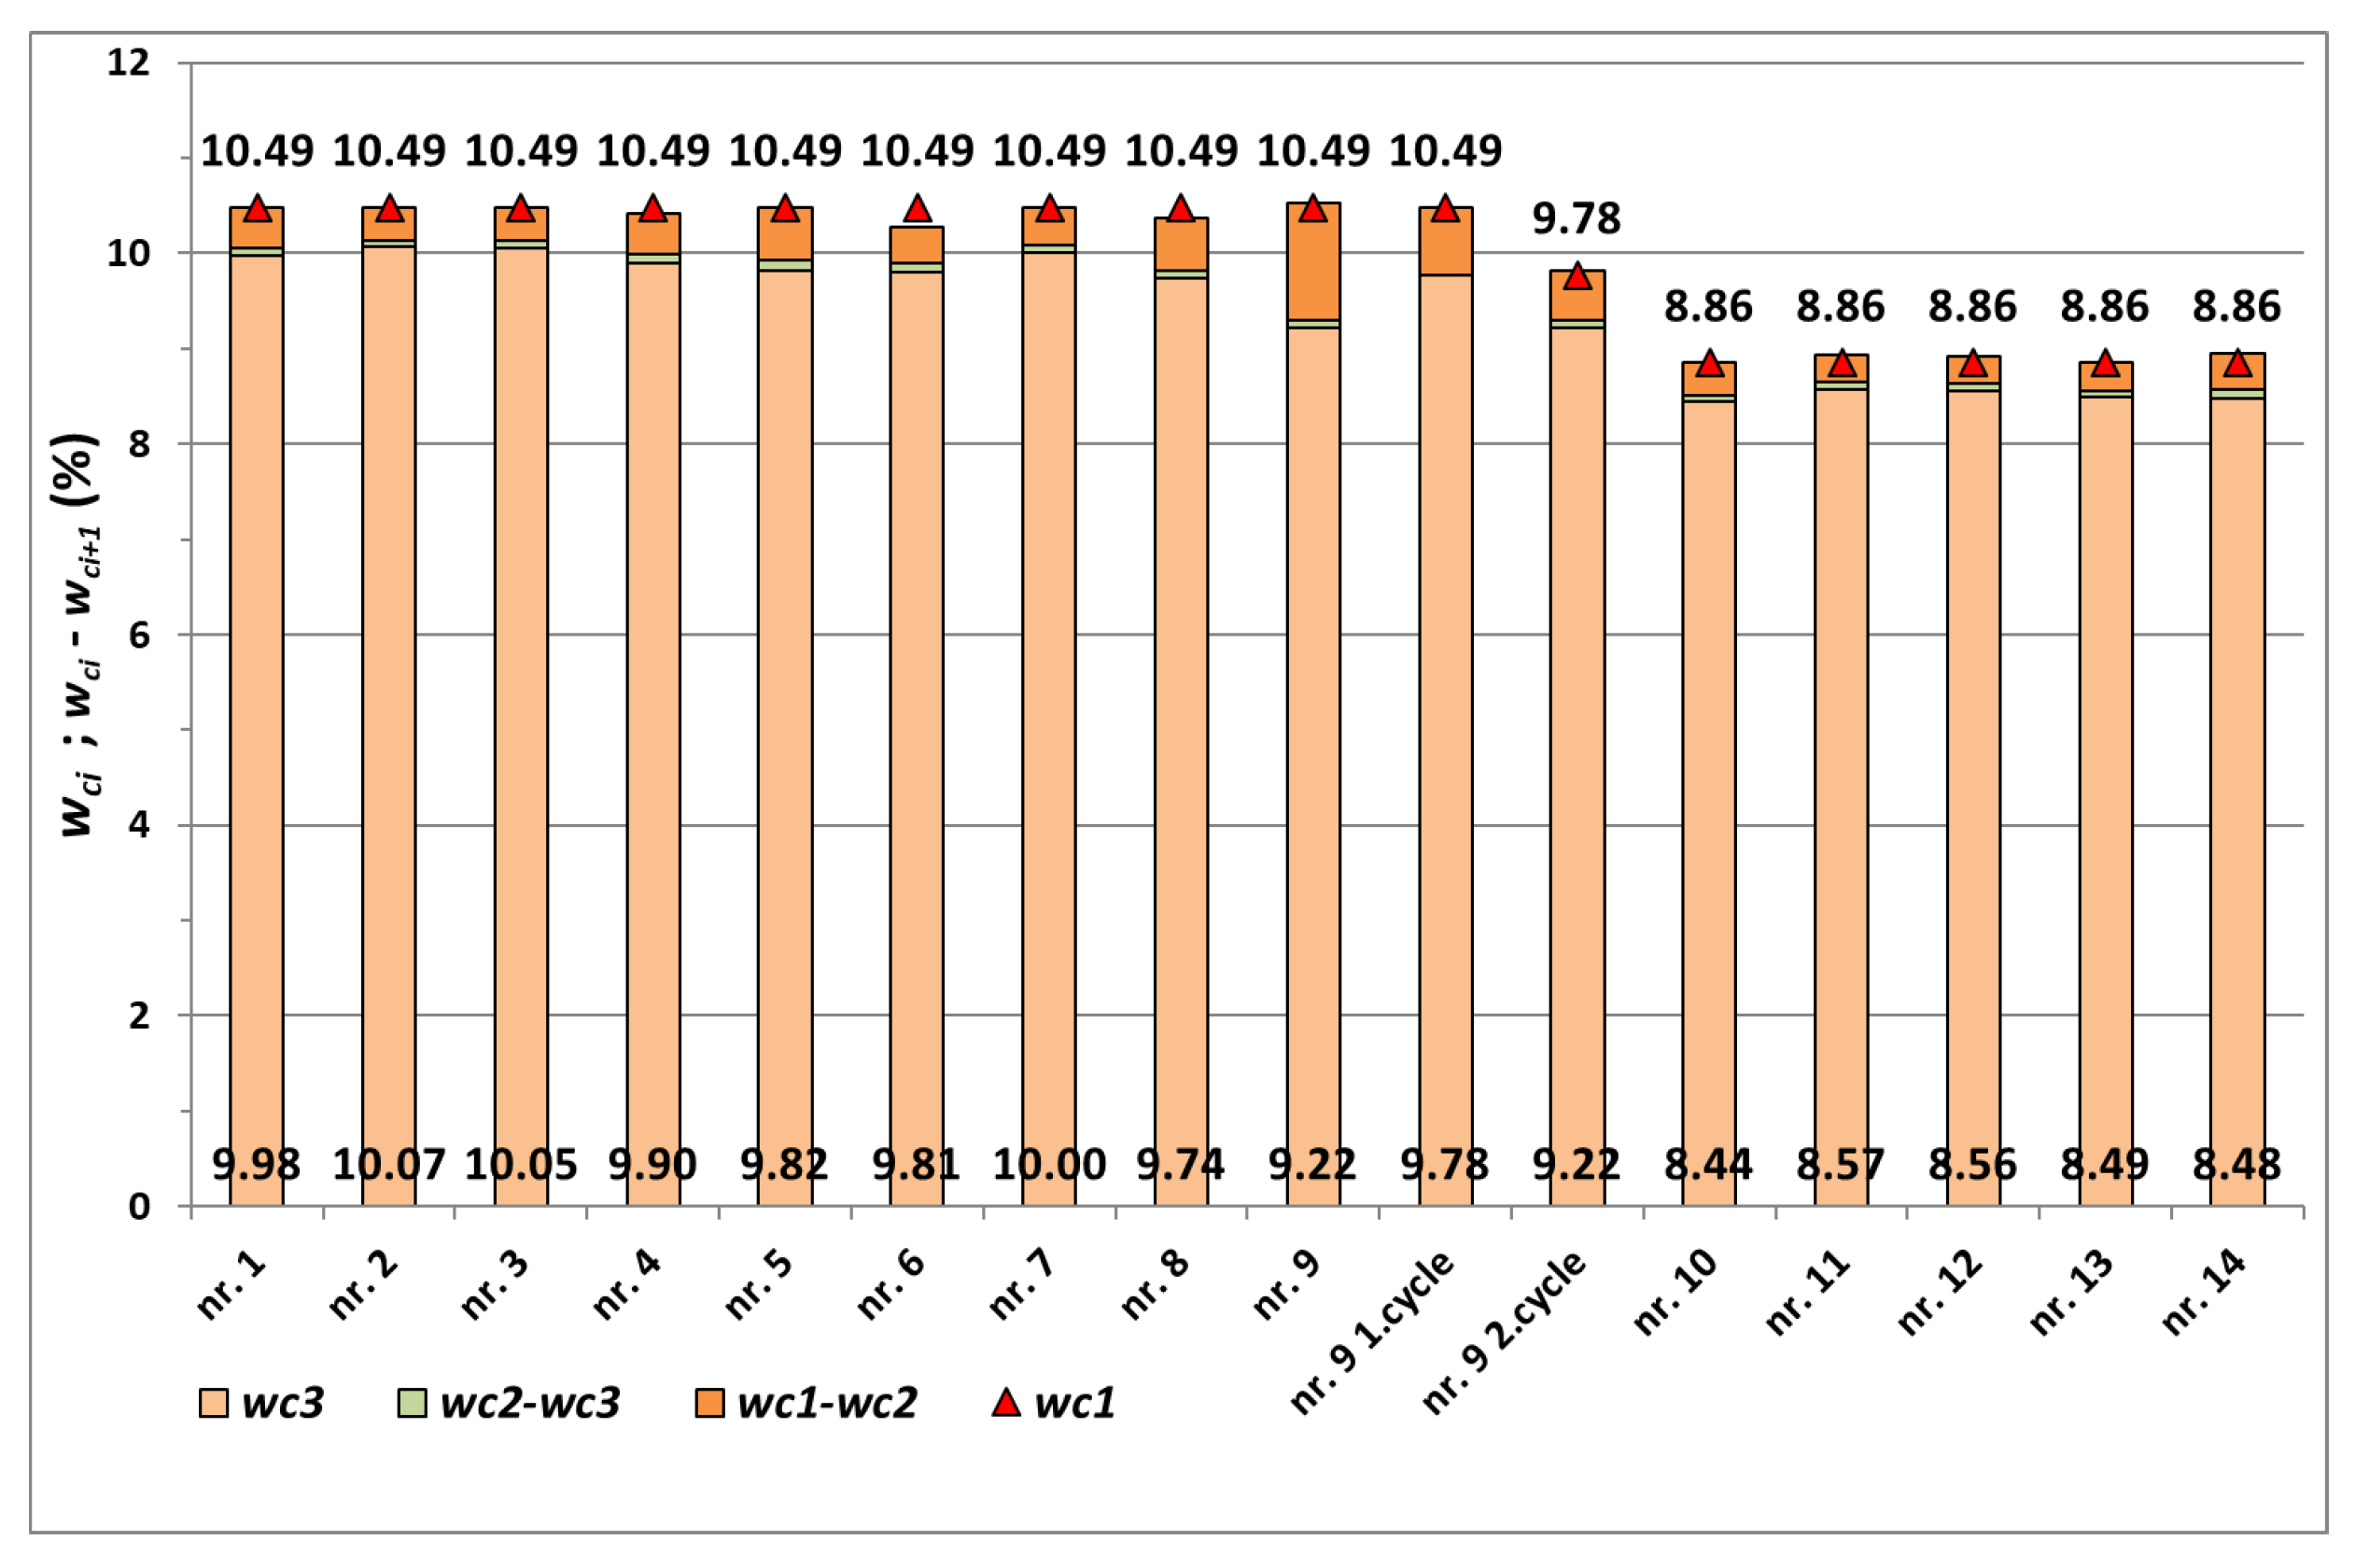
  • wc1 = 10.487% for measurements no. 1 to no. 9 carried out in February 2022;
  • wc1 = 8.858% for measurements no. 10 to no. 14 carried out in April 2022.
The corn sample (Figure 2) was placed in the perforated basket at an mc1 of 1300 g, the temperature tc1min was in the range of 16 °C to 21 °C and the moisture content wc1 was determined. In the basket, a temperature sensor was placed at the middle height of the sample to continuously detect the temperature of the corn sample.
From the experimentally determined weights mc1, mc2 and mc3 of a corn sample during its drying, it is possible to use the corresponding moisture value wc1 to calculate the dry weight md and the moisture content values wc2 and wc3 of the corn sample.
The mass of dry matter md is determined using the following equation:
m d = m c 1 · 1 w c 1 100   ( g )
The relative humidity wci of the corn sample (relative water content) is defined as the ratio of the weights of mwi of water and mc1 of the corn sample:
w c i = 100 · m w i m c i = 100 · m c i m d m c i = 100 · 1 m d m c i   ( % )
The moisture content wc2 of the corn sample after removing the sample from the vacuum chamber and the moisture content wc3 after drying the sample on the sieve are calculated using the gravimetric method based on the dry weight md and the measured weights mc2 and mc3, respectively (Table 1).
The individual measurements of the corn samples during vacuum drying, which took place with the selected modes of heating and evaporation of water from the corn grains, can be compared with each other based on the following values:
  • The difference w c in the corn moisture content wc1 at the beginning of the measurement and wc3 after drying the sample on the sieve:
    w c = w c 1 w c 3   ( % )
  • The relative moisture difference w c r e l of the corn sample as defined by the proportion of the difference w c and the moisture content of the corn sample wc1 at the beginning of the measurement:
    w c r e l = 100 · w c 1 w c 3 w c 1   ( % )
Leakages in the vacuum system caused an increase in pressure pi during corn heating (i = 1) and vacuum drying (i = 2). The pressure in the system dropped after the pump was restarted. The pressure pi during the phases of heating and vacuum drying was characterized based on its mean value piavg.
The temperature tc1max (60 + 3) °C was determined for all phases of vacuum drying. The corn samples were heated at atmospheric pressure. The exception was during measurement no. 11, wherein the mean pressure in the vacuum chamber was p1avg = 9.90 kPa during the heating of the sample. The temperature tc1max was the same as the temperature tc2max at the beginning of the vacuum drying of the corn samples.
Water from the corn kernels during measurements no. 1 to no. 3 was evaporated at a pressure p2avg (5.82 ÷ 6.62) kPa. During these measurements, the corn samples were heated to a temperature tc1max of (50.9 ÷ 55.2) °C. Measurements no. 4 to no. 14 took place at pressures p2avg ranging from 8.31 kPa to 9.81 kPa, while the temperature tc1max of the corn samples at the end of the heating ranged from 59.8 to 62.6 °C.
Heat was removed from the dry matter of the grain, and the temperature tc2 of the corn samples gradually decreased to the value of tc2min. The drop in temperature tc2 was dependent on the power input of the coils. The temperature tc1max during heating was set so that, even at the end of the evaporation of water from the corn kernels, the temperature tc2 min was higher than the temperature ts(p2) of water saturation at pressure p2.
During the vacuum drying of the corn samples for measurements no. 1 to no. 6 and measurements no. 9 to no. 11, the coil power was reduced. Vacuum drying was terminated when the difference (tc2ts)min between the corn temperature and water saturation temperature was in the range of 0.6–5.5 °C.
During measurements no. 7, no. 8 and no. 12 to no. 14, the spiral input power compensated for the heat of evaporation of water from the corn grains via vacuum drying. The temperature difference tc1max at the beginning and tc2min at the end of vacuum drying was in the range of −2.7–2.4 °C. At the end of vacuum drying, the difference (tc2ts)min was in the range of 14.2 °C to 18.2 °C.
Vacuum drying of each corn sample was completed by increasing the pressure p3 in the vacuum chamber to the value of atmospheric pressure. Subsequently, after 5 min, the corn sample was taken out of the vacuum chamber and weighed. The loss of water from the grains reduced the weight of the corn sample to the value of mc2.
In the last stage of drying, each corn sample was placed loosely on a sieve. Water from the surface of the corn kernels was allowed to evaporate into the air for 60 min. After finishing all stages of the vacuum drying of the corn sample, its final weight mc3 was determined.
For measurements no. 1 to no. 14, Table 1 lists the values of the weight mc1 of the corn samples at the beginning of the measurement, mc2 after removing the samples from the vacuum chamber and mc3 after drying the samples on the sieve. These weights of the corn samples formed the basis for calculating the weight of dry matter md of the corn samples and the corresponding moisture contents wc2 and wc3 during their drying.

3. Results

The reference gravimetric method was used to determine the initial moisture wc1 of representative samples of corn that were dried in two periods: February and April 2022 (Table 3). According to the experimentally determined weights mc1, mc2 and mc3 of the corn samples (Table 1) and Equations (1)–(4), the weight of dry matter md was calculated based on the weight wc2 of the corn samples after removal from the vacuum chamber, wc3 after drying the samples on the sieve, the moisture difference w c and the relative moisture difference w c r e l of the corn samples.
The calculated moisture values wc1, wc2 and wc3 of the corn samples during vacuum drying for measurements no. 1 to no. 14 are summarized in Table 4. The moisture values wc1 at the beginning and wc3 after the completion of vacuum drying for the individual measurements are shown in Figure 3. The difference in humidity wc1wc2 was determined from the moisture content during the heating of the corn sample and the moisture content during the evaporation of water from the grains in the vacuum chamber, and wc2wc3 was determined from the moisture content when the sample was removed from the vacuum chamber and the moisture content at the end of drying the sample on the sieve. In Table 4 and Figure 4, the difference in humidity wc1wc3 as w c and the relative difference w c   r e l are given for the reference corn samples.
The efficiency of vacuum drying depends on the input moisture of agricultural grains [39]. It should be noted that the moisture measurements of the corn samples using a simplified laboratory model of a vacuum dryer were carried out in the spring months. During the natural drying of corn kernels on cobs, the values of moisture difference w c and relative moisture difference w c r e l were affected by the low initial moisture wc1 of the corn samples, which was 10.49% in February 2022 and 8.86% in April 2022.

3.1. Effect of Vacuum Chamber Pressure on Reduction in Moisture during Heating of Corn Sample

The influence of pressure p1 in the vacuum chamber on the reduction in moisture during the heating of the corn samples was experimentally determined based on measurements no. 10 and no. 11.
During measurement no. 10 (Figure 5), the corn sample was heated from a temperature tc1min of 17.8 °C to tc1max of 60.0 °C under an atmospheric pressure p1 of 100.74 kPa in the vacuum chamber. Depending on the power input of the coils, heating took 1:24 h. Vacuum drying of the corn sample took place under a pressure p2 and vg of 9.74 kPa. Evaporation of water from the corn kernels at a reduced spiral power took 0:48 h, while the temperature tc2min of the corn sample dropped to 48.7 °C, and the difference (tc2ts)min between the corn temperature and the water saturation temperature at pressure p2 was 2.6 °C. By vacuum drying the corn sample, the difference w c between the corn moisture content wc1 at the beginning of the measurement and wc3 after drying the sample on the sieve was 0.42%, which corresponded to a relative moisture difference w c   r e l of 4.69%.
Measurement no. 11 (Figure 6) of the corn sample took place under a medium pressure p1avg of 9.90 kPa during heating and under a pressure p2avg of 9.70 kPa during vacuum drying. The temperature tc1min was 20.2 °C after 0:23 h of heating and rose to the value tc1max of 44.7 °C. Vacuum drying lasted 1:29 h, while tc2max was 61.4 °C, tc2min was 48.5 °C and the temperature difference (tc2ts)min was 2.2 °C. During the corn drying process, the moisture difference w c of the corn sample was 0.29%, and the relative difference w c   r e l was 3.26%.

3.2. Effect of Vacuum Chamber Pressure on Reduction in Moisture during Evaporation of Water from Corn Sample

From the point of view of the heating of the corn samples under atmospheric pressure and the phase of evaporation of water from corn kernels at a reduced spiral power, the values of measurements no. 1 to no. 6 were similar. The effect of pressure p2 in the vacuum chamber on the reduction in moisture during the evaporation of water from the corn samples was experimentally determined based on measurements no. 1 to no. 3, when the mean pressure p2avg was in the range of 5.82–6.62 kPa, while measurements no. 4 to no. 6 took place under pressure p2avg in the range of 9.19–9.81 kPa. Figure 7 shows the course of the values detected during measurement no. 2, and Figure 8 shows the values of measurement no. 4.
During measurement no. 2, the corn sample was heated to a temperature tc1max of 50.9 °C under an atmospheric pressure of 102.77 kPa in the vacuum chamber. Vacuum drying of the corn sample took place under a pressure p2 and vg of 5.91 kPa. Evaporation of water from the corn kernels under reduced spiral power took 0:45 h, while the temperature tc2min of the corn sample dropped to 38.9 °C, and the difference (tc2ts)min between the corn temperature and water saturation temperature at pressure p2 was 2.1 °C. By vacuum drying the corn sample, the moisture difference w c was 0.42%, which corresponded to a relative moisture difference w c   r e l of 4.00%.
Measurement no. 4 of a corn sample took place under an atmospheric pressure p1 of 101.95 kPa during its heating and under a pressure p2 and vg of 9.19 kPa during vacuum drying. The temperature tc1max at the end of heating rose to 60.3 °C, and, during vacuum drying, the temperature tc2min was 46.9 °C. The temperature difference (tc2ts)min was 1.7 °C. Vacuum drying took 0:37 h. During the corn drying process, the moisture difference w c   of the corn sample was 0.58%, and the relative moisture difference w c   r e l was 5.55%.

3.3. Effect of Heating Time on Reduction in Moisture during Evaporation of Water from Corn Sample

Measurements no. 12, no. 13 and no. 14 were carried out during atmospheric heating of the corn samples. During the evaporation of water from corn kernels, the pressure p2avg in the vacuum chamber was in the range of 8.41–9.42 kPa. The increased power input of the coils compensated for the heat of evaporation of water from the grains during vacuum drying of the corn samples so the temperature tc2 of the corn samples changed minimally. The influence of the heating time τ2 during the evaporation of water from the corn samples on the reduction in their moisture was investigated.
The heating time τ2 during the vacuum drying of a corn sample for measurement no. 12 was 0:28 h (Figure 9). At a pressure p2avg of 8.41 kPa, the temperature tc1max of the sample was 60.0 °C at the end of heating, and tc2min was 59.5 °C at the end of vacuum drying, while the temperature difference (tc2ts)min was 16.9 °C. By vacuum drying the corn sample, the difference w c between the moisture content wc1 of 8.86% at the beginning of the measurement and the moisture content wc3 of 8.56% after drying the sample on the sieve was 0.295%, which corresponded to a relative moisture difference w c   r e l of 3.335%.
Vacuum drying of a corn sample for measurement no. 13 took 0:42 h (Figure 10). The temperature of the corn sample during this phase was tc1max = 60.5 °C at the end of heating and tc2min = 59.6 °C at the end of vacuum drying, while the temperature difference (tc2ts)min was 14.2 °C. The moisture difference w c was 0.366%, and the relative moisture difference w c   r e l was 4.132%.
During measurement no. 14, the heating time τ2 during the vacuum drying of the corn sample was 0:58 h. The course of the measured values is shown in Figure 11. The pressure p2avg reached a value of 8.73 kPa, and the measured temperatures of the corn sample were tc1max 60.1 °C and tc2min 62.8 °C, while the temperature difference (tc2ts)min was 18.2 °C. The resulting value of the moisture difference   w c was 0.373%, and the relative moisture difference w c   r e l was 4.212%.
During measurements no. 12, no. 13 and no. 14, the temperature difference t c 2 m a x   of the corn samples at the beginning of vacuum drying and t c 2 m i n at the end of drying ranged from 0.9 °C (measurement no. 13) to −2.7 °C (measurement no. 14). For these measurements, the enthalpy change of steam corresponded to h e v a in the range of 2.0 kJ·kg−1 to −3.4 kJ·kg−1. The average temperature t c 2   a v g of the samples was in the range of 59.5 °C (measurement no. 12) to 61.0 °C (measurement no. 14). From the point of view of steam enthalpy change h e v a and temperature   t c 2   a v g , vacuum drying of the corn samples took place under comparable conditions during these measurements. However, the most favorable conditions for the evaporation of water from corn grains were during measurement no. 14.
The moisture content of the corn samples from the initial wc1 value of 8.858% demonstrated the following course:
  • During measurement no. 13 after a heating time τ2 of 0:42 h of vacuum drying, the moisture content decreased to a value of wc3 = 8.492%, which corresponded to a moisture difference w c of 0.366%, and relative moisture difference w c   r e l = 4.132%;
  • During measurement no. 14 after a heating time τ2 of 0:58 h of vacuum drying, the moisture content decreased to a value of wc3 = 8.485%, which corresponded to a moisture difference w c of 0.373%, and relative moisture difference w c   r e l = 4.212%.
During measurement no. 14, the time τ2 of vacuum drying was 0:16 h longer than during measurement no. 13, with a moisture difference w c of 0.007% and a relative moisture difference w c   r e l of 0.080% between these measurements.

3.4. Effect of Number of Cycles of Water Evaporation on Reduction in Moisture

The effect of the number of cycles during the evaporation of water from the corn samples on the reduction in moisture was analyzed during the course and evaluation of measurements no. 5 and no. 9.
In these measurements, the corn samples were heated under atmospheric air pressure. During the time τ2 of vacuum drying, the spiral power input was limited, and the pressure p2avg was in the range of (8.31 ÷ 9.81) kPa.
The course of the measured values during measurement no. 5 with one cycle of vacuum drying is shown in Figure 12. The temperature tc1max at the end of heating rose to 60.6 °C, and, during vacuum drying, the temperature tc2min was 48.4 °C, while the temperature difference (tc2ts)min was 0.6 °C. Vacuum drying of the corn sample took 0:34 h. The calculated difference in moisture w c was 0.66%, and the relative moisture difference w c   r e l was 6.32%.
Vacuum drying of a corn sample during measurement no. 9 took place over two cycles (Figure 13). After heating the corn sample at the beginning of the first cycle, the value of tc1max reached 60.5 °C, and the value of tc2min reached 48.7 °C, while the temperature difference (tc2ts)min was 3.6 °C. After time τ2 at 0:40 a.m., the sample was taken out of the vacuum chamber, and its weight mc2 was determined to be 1289.80 g. Based on the initial moisture content value wc1 and the subsequent moisture content values wc2 and wc3, the moisture difference w c was calculated to be 0.71%, and w c   r e l was 6.75%. The second drying cycle in the vacuum chamber began by heating the corn sample from a temperature tc1min of 34.0 °C to a temperature tc1max of 60.4 °C. Evaporation of water from the corn kernels took place for 0:46 h at a pressure p2avg of 8.31 kPa. The corn sample was cooled to a temperature tc2min of 48.6 °C, and the temperature difference (tc2ts)min was 5.5 °C. From the determined weights mc1, mc2 and mc3 of the corn sample and the moisture content values wc1, wc2 and wc3, the moisture difference w c was calculated to be 0.56%, and the relative difference w c   r e l was calculated to be 5.76%. During the two cycles of vacuum drying, the initial mass mc1 of the sample decreased from a value of 1300 g to a mass mc3 of 1281.80 g after drying on a sieve. The difference w c in the moisture content of the sample from wc1 at the beginning of the measurement to wc3 after drying the sample on a sieve corresponded to a change of 1.27%, and the relative moisture difference w c   r e l was 12.12%.

4. Discussion

To optimize the process of vacuum drying corn, an experimental methodology was carried out using a simplified physical model of a vacuum dryer.
The courses of the temperature tci of the corn samples placed in a perforated basket, tgi of the selected corn grain, thi of the electrically heated coils, ts of water saturation, temperature difference tc2ts during vacuum drying, pressure pi in the vacuum chamber during the heating of the corn samples and the evaporation of water from the grains during measurements no. 1 to no. 14 are listed in Table 1 and shown in Figure 6, Figure 7, Figure 8, Figure 9, Figure 10, Figure 11, Figure 12, Figure 13, Figure 14 and Figure 15. The values of these variables were recorded in 5 s intervals.
During the dynamic events taking place under vacuum drying, it is possible to observe the temperature difference between the temperature tci of a corn sample and the temperature tgi measured inside the grain. This difference, within the duration of the experiments, is caused by a delay in the penetration of the temperature wave propagated from the heat source through the environment into the grain of the dried material. The ability of the environment to spread heat also plays an important role. In cases where the speed of heat propagation through the environment is higher, it is possible to observe a smaller temperature difference and a better correlation of both processes.

4.1. Effect of Vacuum Chamber Pressure on Reduction in Moisture during Heating of Corn Sample

Let us briefly address the mechanism of heat propagation in the given environments of our study. The corn sample placed in the perforated basket contains a considerable intergranular volume due to the relatively large diameter of its grains. It is filled with the same substance as in the entire vacuum chamber. The heating process involves the transfer of heat from the heating source to the corn grains. Due to the shape of the grains, their mutual contact area is very small, which results in a reduction in the transmitted energy through heat conduction. A larger part of the grain surface is heated via thermal interaction with the surrounding environment. In the space between the grains, there is a combination of heat conduction and the flow of a low-pressure steam–gas mixture.
Under atmospheric pressure, there is a relatively high density of water vapor molecules in the space of the chamber and in the space between the grains, which is largely involved in heat transfer. In conditions where the pressure in the chamber is lower than the atmospheric pressure, there is a reduction in the number of these particles in such spaces, which also results in a reduced ability to transfer heat using the abovementioned mechanisms.
Heat transfer by radiation can take place between the heating medium and the heated material or between the grains themselves. However, due to the small temperature differences between individual grains, the amount of energy transferred by radiation is minimal.
From the experimentally determined values of moisture difference w c and relative moisture difference   w c   r e l , and the above brief explanation of heat transfer from the electric coils to the corn kernels in the vacuum chamber, it follows that it is more appropriate to heat a corn sample under atmospheric pressure p1.

4.2. Effect of Vacuum Chamber Pressure on Reduction in Moisture during Evaporation of Water from Corn Sample

During measurements no. 2 and no. 4, the influence of the absolute pressure level p 2   a v g on the vacuum drying process can be observed. Keeping the conditions as similar as possible in terms of the temperature difference between the grain temperature and the water saturation temperature, the effect can be attributed to the change in the value of the vaporization heat of water:
h = h p 2   a v g h p 2   a v g  
where h p 2   a v g represents the enthalpy of saturated steam, and h p 2   a v g is the enthalpy of saturated water at pressure p 2   a v g .
During measurement no. 2 (Figure 7), the pressure p2avg of 5.91 kPa corresponds to a saturation temperature ts (p2avg) of 35.9 °C and a vapor heat h 2 of 415.8 kJ·kg−1. The pressure p2avg of 9.19 kPa during measurement no. 4 (Figure 8) corresponds to a saturation temperature ts (p2avg) of 44.2 °C and a vapor heat   h of 2396.0 kJ·kg−1. The relative difference in the values of vaporization heat of measurements no. 4 and no. 2 is 0.82%. The value of the heat of vaporization h decreases with an increase in pressure, which results in an increase in the amount of evaporated water while maintaining the same amount of accumulated energy in the grains or the same amount of heat supplied by the spiral coils.
From the experimentally determined values of moisture difference w c and relative moisture difference w c   r e l , it follows that it is more appropriate to vacuum dry a corn sample under a pc2avg range of 9–10 kPa, with the most appropriate pressure being around 6 kPa.

4.3. Effect of Controlling the Power Input of Coils on Reduction in Moisture during the Evaporation of Water from Corn Kernels

The effect of heating intensity during the evaporation of water from corn kernels on the reduction in maize moisture content was investigated. During measurement no. 6, the power consumption of the coils was reduced (Figure 14). At a pressure p2avg of 9.51 kPa, the temperature tc1max of the sample dropped from a value of 59.8 °C at the end of vacuum drying to a temperature tc2min of 48.8 °C, while the temperature difference (tc2ts)min was 3.0 °C. Evaporation of water from the corn kernels took 0:33 h. By vacuum drying the corn sample, the difference in moisture w c between the value wc1 at the beginning of the measurement and the value wc3 after drying the sample on the sieve was 0.68%, which corresponded to a relative moisture difference w c   r e l of 6.48%.
Measurement no. 8 during the vacuum drying of a corn sample took 0:56 h at a pressure p2avg of 9.26 kPa (Figure 15). The spiral coils compensated for the heat of evaporation of water from the grains with increased power during the vacuum drying process of the corn sample. The temperature tc2 of the corn sample varied from 62.6 °C to 60.2 °C, while the mean temperature tc2avg was 61.5 °C. The difference (tc2ts) between the corn sample temperature and water saturation temperature was 15.6 °C. During the corn drying process, the moisture difference w c of the corn sample was 0.74%, and the relative moisture difference w c   r e l was 7.09%.
Let us compare the enthalpy change of steam during the vacuum drying of the corn samples in measurements no. 6 and no. 8. The calculation was as follows:
h e v a   = h s t e a m p 2   a v g ,   t c 2   m a x h s t e a m p 2   a v g ,   t c 2   m i n
Vacuum drying during measurement no. 6 took place at a reduced spiral power. At a medium pressure p 2   a v g in the vacuum chamber, the cooling of the corn sample from the temperature t c 2   m a x to t c 2   m i n by 11.0 °C corresponded to a decrease in the enthalpy change of steam h e v a of 9.6 kJ·kg−1. During measurement no. 8, the spiral coils heated the corn sample so that the temperature t c 2 changed as little as possible (by 2.4 °C). The corresponding decrease in the enthalpy change of steam h e v a was 2.6 kJ·kg−1. The dry matter of corn grains was cooled less, and water evaporation took place under more favorable conditions.
Heating a corn sample during the phase of vacuum drying has a favorable effect on the moisture difference w c and the relative moisture difference w c   r e l of the corn sample.

4.4. Effect of Heating Time on Reduction in Moisture during Evaporation of Water from Corn Sample

Based on the results of measurements no. 12, no. 13 and no. 14, which were experimentally determined during the heating time τ2 during the evaporation of water from the corn sample to reduce its moisture, and from the point of view of the values of moisture difference w c and w c   r e l and the energy requirement of heating the dry matter of a corn sample, it is recommended that the τ2 phase of vacuum drying of a corn sample lasts for a duration of 0:40–0:45 h.

4.5. Effect of Number of Cycles of Water Evaporation on Reduction in Corn Moisture

When vacuum drying over two cycles, the difference in the moisture content of the corn sample ( w c ) is reduced by a factor of 1.92 compared to drying in one cycle (measurement no. 5). For measurement no. 9 with two cycles of vacuum drying of a corn sample, let us compare the moisture reduction w c 1 .   c y c in the first cycle with the moisture reduction w c 2   c y c in the second cycle. The moisture reduction ratio w c   1 .   c y c   w c   2   c y c   was 1.29 so, in the first cycle, the moisture difference w c was reduced 1.29 times more than in the second cycle.
Measurement no. 9 was affected by the selection of the corn sample from the vacuum chamber due to the need to determine the mass mc2 of the sample after the first cycle. Without selecting the sample from the vacuum chamber, the heat consumption for heating the corn sample and the heating time would be reduced.
Vacuum drying a corn sample over two cycles can be recommended if a moisture reduction w c of approximately twice that obtained when drying in one cycle is desired.

5. Conclusions

For the individual measurements, the initial moisture content of the corn samples was different. The reason was different collection dates. The initial moisture content ranged from 10.49% to 8.86%. Considering the preservation of the nutritional quality of dried corn, the maximum temperature tcmax = 63 °C was set for all phases of vacuum drying. The temperature during drying, tc2, changed due to the evaporation of moisture and the current performance of the coils. With reduced spiral power, vacuum drying ended if the difference between the corn temperature tc2min and the water saturation temperature ts(p2) was less than or equal to 0.5–5.5 °C. For the drying process, it is necessary that the water saturation temperature is lower than the current temperature of the corn sample. Considering this difference in the given interval and the maximum temperature of 63 °C, it is necessary to maintain the pressure in the vacuum chamber at a level of 10 kPa. If, during the drying of corn, the heat supplied by the spiral coils is compensated by the vapor heat of evaporated water (the temperature does not change during this process), a higher saturation temperature can be chosen, e.g., ts(p2) = 58.0 °C. This temperature corresponds to a saturation pressure ps(t2) = 18.17 kPa and a heat of vaporization h = 2362.6 kJ·kg−1. Under these conditions, the heat of vaporization is 1.23% less than the heat of vaporization at a pressure of 10 kPa. This has the effect of reducing the energy consumption of the drying process.
Based on the obtained data, it can be concluded that the following procedures are appropriate to dry corn with minimal energy consumption:
  • Heat the corn sample at a higher pressure value in the vacuum chamber using better heat transfer for more intense heat convection;
  • Carry out the drying phase in the pressure range of 9–10 kPa, and, when drying at a lower pressure, a higher moisture content of corn is achieved;
  • Continuously heat the corn sample during the entire drying phase so that the temperature of the corn sample changes minimally;
  • Choose a heating time in the range of 40–45 min and a heating intensity corresponding to the rate of heat transfer in the given environment;
  • Due to the dynamics of the drying process, it is advantageous to carry out the drying process with a low intensity over several cycles.
In this study, individual recommendations were applied in the construction and operation process design of a prototype mobile vacuum dryer intended for drying corn. The measurements show the advantage of drying under a higher pressure, i.e., 9–10 kPa. The maximum pressure is limited by the maximum temperature under which maize can be heated while still maintaining its nutritional content. These values are also used for the strength calculation of the proposed drying chamber. With multiple drying cycles, thermal energy capture can be realized, and the captured energy can then be reused. This includes the use of condensation heat from the previous cycle for heating during the subsequent cycle. However, the temperature level needs to be adjusted. Verification of the recommendations and possible further optimization of the drying process during the test operation of the prototype vacuum dryer are necessary.

Author Contributions

Conceptualization and methodology, Ľ.Š.; software F.U. and P.M.; validation, I.Č., Ľ.K., V.Č. and J.B.; formal analysis, F.U.; investigation, Ľ.Š.; resources, I.Č. and Ľ.K.; data curation, F.U. and P.M.; writing—original draft preparation, F.U. and J.B.; writing—review and editing, Ľ.Š.; visualization, V.Č., I.Č., P.M. and J.B.; supervision, Ľ.Š. and F.U.; project administration, Ľ.Š.; funding acquisition, Ľ.Š. All authors have read and agreed to the published version of the manuscript.

Funding

This research was funded by the Slovak Educational Grant Agency KEGA as part of the project KEGA 030STU-4/2022 “RORESA Application of augmented reality in the education process of machine tools and production systems” and by the Slovak Research and Development Agency as part of the project APVV-19-0607 “Optimized progressive shapes and unconventional composite raw materials of high-grade biofuels”.

Institutional Review Board Statement

Not applicable.

Informed Consent Statement

Not applicable.

Data Availability Statement

Data are contained within the article.

Conflicts of Interest

The authors declare no conflicts of interest.

References

  1. Liu, Z.; Wu, Z.; Zhang, Z.; Wu, W.; Li, H. Research on online moisture detector in grain drying process based on V/F conversion. Math. Probl. Eng. 2015, 2015, 565764. [Google Scholar] [CrossRef]
  2. Ertekin, C.; Firat, M.Z. A comprehensive review of thin-layer drying models used in agricultural products. Crit. Rev. Food Sci. Nutr. 2017, 57, 701–717. [Google Scholar] [CrossRef] [PubMed]
  3. Ali, M.; Niazi, F.; Ali Siddiqui, M.; Saleem, M. Comparative Study on Oven and Solar Drying of Agricultural Residues and Food Crops. Int. J. Renew. Energy Dev. 2022, 11, 1165–1178. [Google Scholar] [CrossRef]
  4. Rogovskii, I.L.; Titova, L.; Trokhaniak, V.I.; Solomka, O.V.; Popyk, P.S.; Shvidia, V.O.; Степаненкo, C. Experimental studies on drying conditions of grain crops with high moisture content in low-pressure environment. INMATEH-Agric. Eng. 2019, 57, 141–146. [Google Scholar] [CrossRef] [PubMed]
  5. Tagawa, A.; Muramatsu, Y.; Nagasuna, T.; Yano, A.; Iimoto, M.; Murata, S. Water absorption characteristics of wheat and barley during soaking. Trans. ASAE 2013, 46, 361–366. [Google Scholar] [CrossRef]
  6. Wang, J.; Law, C.-L.; Nema, P.K.; Zhao, J.-H.; Liu, Z.-L.; Deng, L.-Z.; Gao, Z.-J.; Xiao, H.-W. Pulsed vacuum drying enhances drying kinetics and quality of lemon slices. J. Food Eng. 2018, 224, 129–138. [Google Scholar] [CrossRef]
  7. Ibn Maamar, M.; Badraoui, M.; Mazouzi, M.; Mouakkir, L. Mathematical Modeling on Vacuum Drying of Olive Pomace. Trends Sci. 2022, 20, 3822. [Google Scholar] [CrossRef]
  8. Wu, L.; Orikasa, T.; Ogawa, Y.; Tagawa, A. Vacuum drying characteristics of eggplants. J. Food Eng. 2007, 83, 422–429. [Google Scholar] [CrossRef]
  9. Yu, S.; Yang, X.; Li, Q.; Zhang, Y.; Zhou, H. Breaking the temperature limit of hydrothermal carbonization of lignocellulosic biomass by decoupling temperature and pressure. Green Energy Environ. 2023, 8, 1216–1227. [Google Scholar] [CrossRef]
  10. da Silva Timm, N.; Coradi, P.C.; Dos Santos Bilhalva, N.; Nunes, C.F.; da Costa Corrêa Cañizares, L. Effects of corn drying and storage conditions on flour, starch, feed, and ethanol production: A review. J. Food Sci. Technol. 2023, 60, 2337–2349. [Google Scholar] [CrossRef]
  11. Wang, J.; Dai, J.W.; Yang, S.L.; Wen, M.D.; Fu, Q.Q.; Huang, H.; Qin, W.; Li, Y.L.; Lin, Y.W.; Yin, P.F.; et al. Influence of pulsed vacuum drying on drying kinetics and nutritional value of corn kernels. J. Food Process. Eng. 2020, 43, e13550. [Google Scholar] [CrossRef]
  12. Liu, Z.; Wu, Z.; Wang, X.; Song, J.; Wu, W. Numerical Simulation and Experimental Study of Deep Bed Corn Drying Based on Water Potential, Special Issure, Modeling, Optimization, and Verification for Complex Systems. Math. Probl. Eng. 2015, 2015, 539846. [Google Scholar] [CrossRef]
  13. Bazyma, L.A.; Guskov, V.P.; Basteev, A.V.; Lyashenko, A.M.; Lyakhno, V.; Kutovoy, V.A. The investigation of low temperature vacuum drying processes of agricultural materials. J. Food Eng. 2006, 74, 410–415. [Google Scholar] [CrossRef]
  14. Sheng, S.; Ši, A.; Xing, J. A Systematic Rheological Study of Maize Kernel. Foods 2023, 12, 738. [Google Scholar] [CrossRef] [PubMed]
  15. Rao, K.R.; Ram Prasanth, M.G.; Sangeetha, M. Review on Multi Grain Dryer. Int. J. Res. Eng. Sci. 2022, 10, 464–469. [Google Scholar]
  16. Song, J.; Li, D.; He, M.; Chen, J.; Liu, C. Comparison of carotenoid composition in immature and mature grains of corn (Zea mays L.) varieties. Int. J. Food Prop. 2016, 19, 351–358. [Google Scholar] [CrossRef]
  17. Ferraretto, L.F.; Taysom, K.; Taysom, D.M.; Shaver, R.D.; Hoffman, P.C. Relationships between dry matter content, ensilage, ammonia-nitrogen, and in vitro rumen starch digestibility in high-moisture corn samples. J. Dairy Sci. 2014, 97, 3221–3227. [Google Scholar] [CrossRef]
  18. Parvej, M.D.; Rasel, C.R.; Hanna, H.M.; Licht, M.A. Dynamics of corn dry matter content and grain quality after physiological maturity. Agron. J. 2020, 112, 998–1011. [Google Scholar] [CrossRef]
  19. Sadjad, A.; Saeid, M. Effect of drying temperature on the mechanical properties of dried corn. Dry. Technol. Int. J. 2013, 32, 774–780. [Google Scholar] [CrossRef]
  20. Barrier-Guillot, B.; Zuprizal; Jondreville, C.; Chagneau, A.M.; Larbier, M.; Leuillet, M. Effect of thermal drying temperature on the nutritional value of corn in chickens and pigs. Anim. Feed. Sci. Technol. 1993, 41, 149–159. [Google Scholar] [CrossRef]
  21. Li, Q.; Shi, M.; Shi, C.; Liu, D.; Piao, X.; Li, D.; Lai, C. Effect of variety and drying method on the nutritional value of corn for growing pigs. J. Anim. Sci. Biotechnol. 2014, 5, 18. [Google Scholar] [CrossRef]
  22. Liu, H.; Liu, H.; Liu, H.; Zhang, X.; Hong, Q.; Chen, W.; Zeng, X. Microwave drying characteristics and analysis of corn drying quality in China. Processes 2021, 9, 1511. [Google Scholar] [CrossRef]
  23. Applegate, T.J.; Troche, C.; Jiang, Z.; Johnson, T. Nutritional value of high-protein corn distillers dried grains for broiler chickens and its effect on nutrient excretion. Poult. Sci. 2009, 88, 354–359. [Google Scholar] [CrossRef] [PubMed]
  24. Ononogbo, C.; Nwufo, O.C.; Nwakuba, N.R.; Okoronkwo, C.A.; Igbokwe, J.O.; Nwadinobi, P.C.; Anyanwu, E.E. Energy parameters of corn drying in a hot air dryer powered by exhaust gas waste heat: An optimization case study of the food-energy nexus. Energy Nexus 2021, 4, 100029. [Google Scholar] [CrossRef]
  25. Onwude, D.I.; Hashim, N.; Chen, G. Recent advances of novel thermal combined hot air drying of agricultural crops. Trends Food Sci. Technol. 2016, 57, 132–145. [Google Scholar] [CrossRef]
  26. Wang, H.; Torki, M.; Taherian, A.; Beigi, M.; Xiao, H.-M.; Fang, H.-M. Analysis of exergetic performance for a combined ultrasonic power/convective hot air dryer. Renew. Sustain. Energy Rev. 2023, 185, 113607. [Google Scholar] [CrossRef]
  27. Parikh, D.M. Vacuum drying: Fundamentals and application. Chem. Eng. 2015, 122, 48–54. [Google Scholar]
  28. Bao, X.; Min, R.; Zhou, K.; Traffano-Schiffo, M.V.; Dong, Q.; Luo, W. Effects of vacuum drying assisted with condensation on drying characteristics and quality of apple slices. J. Food Eng. 2023, 340, 111286. [Google Scholar] [CrossRef]
  29. Yao, K.; Jiang, S.; Li, S.; Zhang, C.; Hou, H. Solvothermal imidization to polyimide composite aerogels by vacuum drying. Compos. Commun. 2023, 38, 101503. [Google Scholar] [CrossRef]
  30. Xu, J.; Sun, J.; Zhao, J.; Zhang, W.; Zhou, J.; Xu, L.; Guo, H.; Liu, Y.; Zhang, D. Eco-friendly wood plastic composites with biomass-activated carbon-based form-stable phase change material for building energy conversion. Ind. Crops Prod. 2023, 197, 116573. [Google Scholar] [CrossRef]
  31. da Silva, A.C.C.; Biz, A.P. Longhi, D.A.; Schmidt, F.C. Effect of concentration and temperature on the physical and thermophysical properties of coffee extract. J. Food Eng. 2023, 340, 111304. [Google Scholar] [CrossRef]
  32. Zhao, L.; Xie, H.; Liu, Y.; Ran, C.; Wu, Z. Heat and mass transfer in vacuum drying process of fructooligosaccharides syrup. Int. J. Food Eng. 2023, 19, 397–409. [Google Scholar] [CrossRef]
  33. Zang, Z.; Huang, X.; He, C.; Zhang, Q.; Jiang, C.; Wan, F. Improvement of the drying properties and physicochemical quality of Angelica sinensis by a novel microwave vacuum drying with tray rotation. Groc. Store 2023, 12, 1202. [Google Scholar] [CrossRef]
  34. Liu, Y.Y.; Liao, F.J.; Li, Y.S.; Chen, H.P.; Wang, F.; Hu, Y.; Liu, Y.P. Effects of different drying methods on the quality of male flowers of Eucommia ulmoides based on color and chemical composition. Zhongguo Zhong Yao Za Zhi Zhongguo Zhongyao Zazhi China J. Chin. Mater. Medica 2023, 48, 1876–1884. [Google Scholar] [CrossRef]
  35. Zhang, Y.; Zhu, H.; Wu, W.; Li, J.; Yin, L. Internal Stress Analysis on Corn Grain During Vacuum Drying, Source: Sensor Letters. Am. Sci. 2012, 10, 574–579. [Google Scholar] [CrossRef]
  36. Kalus, V. Analysis of Operational and Economic Indicators of a Gas Dryer of Agricultural Commodities. Diploma Thesis, Faculty of Agriculture Mendel University, Brno, Czech Republic, 2010. Available online: https://is.mendelu.cz/zp/index.pl?podrobnosti=36068 (accessed on 3 April 2023).
  37. Odjo, S.; Béra, F.; Beckers, Y.; Foucart, G.; Malumba, P. Influence of variety, harvesting date and drying temperature on the composition and the in vitro digestibility of corn grain. J. Cereal Sci. 2018, 79, 218–225. [Google Scholar] [CrossRef]
  38. Šooš, Ľ. Research on Thermal Processes in the Process of Reducing the Humidity of Organic Materials; Research Report for 2020; Project no. Window Glass, s.r.o.; Faculty of Mechanical Engineering, STU in Bratislava: Bratislava, Slovakia, 2021. [Google Scholar]
  39. Martynov, V.; Gabitov, I.; Karimov, K.; Masalimov, I.; Permyakov, V.; Ganeev, I.; Saitov, I.; Saitov, B. Reasoning Barley Grain Drying Modes for Vacuum-Infrared Drying Machines. J. Eng. Appl. Sci. 2018, 13, 8803–8811. [Google Scholar] [CrossRef]
Figure 1. Diagram of the simplified physical model of a vacuum dryer [38], where 1—electric heating, 2—tensometric balance, 3—perforated basket for the grain, 4—vacuum chamber, 5—condenser, 6—condensate tank, 7—vacuum air reservoir and 8—vacuum pump.
Sustainability 16 00879 g001
Figure 2. Perforated grain basket and electric heating coils for grain heating [38]: (a) detail and (b) scale for determining the weight of the grain sample, along with the basket and the heating coils.
Sustainability 16 00879 g002
Figure 3. Corn sample water content wc1 at the beginning of the measurement, wc3 after drying the sample on the sieve and differences in water content wc1wc2 and wc2wc3 for measurements no. 1 to no. 14.
Sustainability 16 00879 g003
Figure 4. Difference in water content w c and relative difference in water content w c r e l of the corn samples during measurements no. 1 to no. 14.
Sustainability 16 00879 g004
Figure 5. Measurement no. 6: Δwc = 0.68% and Δwc rel = 6.48%.
Sustainability 16 00879 g005
Figure 6. Measurement no. 11: Δwc = 0.29% and Δwc rel = 3.26%.
Sustainability 16 00879 g006
Figure 7. Measurement no. 2: Δwc = 0.42% and Δwc rel = 4.00%.
Sustainability 16 00879 g007
Figure 8. Measurement no. 4: Δwc = 0.58% and Δwc rel = 5.55%.
Sustainability 16 00879 g008
Figure 9. Measurement no. 12: Δwc = 0.295% and Δwc rel = 3.335%.
Sustainability 16 00879 g009
Figure 10. Measurement no. 13: Δwc = 0.366% and Δwc rel = 4.132%.
Sustainability 16 00879 g010
Figure 11. Measurement no. 14: Δwc = 0.373% and Δwcrel = 4.212%.
Sustainability 16 00879 g011
Figure 12. Measurement no. 5: Δwc = 0.66% and Δwc rel = 6.32%.
Sustainability 16 00879 g012
Figure 13. Measurement no. 9: Δwc = 1.27% and Δwc rel = 12.12%.
Sustainability 16 00879 g013
Figure 14. Measurement no. 6: Δwc = 0.68% and Δwc rel = 6.48%.
Sustainability 16 00879 g014
Figure 15. Measurement no. 8: Δwc = 0.74% and Δwc rel = 7.09%.
Sustainability 16 00879 g015
Table 1. Values of selected measured variables during vacuum drying of corn. p1 is the pressure in the vacuum chamber during the heating of a corn sample; tc1max is the temperature of the corn sample; tc2max is the change in the temperature tc2 of the corn sample due to the regulation of the power input by the coils during the evaporation of water from corn grains; tcavg is the average temperature of the corn sample; pavg is the average pressure of moist air in the vacuum chamber; τ2 is the drying period; mc1 is the weight of the corn sample at the beginning of the measurement; mc2 is the weight of the corn sample after being removed from the vacuum chamber; and mc3 is the weight of the corn sample after drying the sample on a sieve.
Measurement
No.
p1tc1max
tc2max
pavgtc avgtc2min(tc2ts)minτ2mc1mc2mc3
(kPa)(°C)(kPa)(°C)(°C)(°C)(h:min)(g)(g)(g)
1100.7655.25.8245.638.81.91:061300.001293.781292.70
2102.7750.95.9143.938.92.10:451300.001295.001293.93
3102.4552.76.6244.939.12.30:541300.001294.801293.65
4101.9560.39.1952.446.91.70:371300.001292.821291.60
5101.6660.69.8153.848.40.60:341300.001292.001290.45
6101.2859.89.5153.848.83.00:331300.001291.491290.20
7102.0661.69.3561.662.717.60:571300.001294.201293.00
8101.9562.69.2661.560.215.60:561300.001290.361289.29
9 over 2 cycles101.9360.58.6654.148.64.61:261300.001282.931281.80
9 in 1st cycle101.9360.59.0254.048.73.60:401300.001289.801289.80
9 in 2nd cycle101.6960.48.3154.148.65.50:461289.801282.861281.80
10100.7460.09.7454.248.72.60:481300.001295.001294.10
119.9044.7/61.49.7055.248.52.21:291300.001297.111295.90
12102.0860.08.4159.559.516.90:281300.001296.861295.80
13101.9560.59.4260.759.614.20:421300.001295.801294.80
14100.0060.18.7361.062.818.20:581300.001295.901294.70
Table 2. Conditions for determining the metrological accuracy of the class I hygrometer used for measuring the water content of the corn samples.
Conditions for Determining the Metrological Accuracy of the Hygrometer
Pre-drying temperature (°C)60 ± 1
Pre-drying time (min)360
Sample weight (g)10
Kernelwhole
Drying temperature (°C)130 ± 1
Drying time (min)240
Sample weight (g)5
Kernelground
Table 3. Results of the weight of dry matter and the water content wc in a representative sample of corn determined using the reference gravimetric method.
Corn Water Content Measurement PeriodFebruary 2022April 2022
Weight of corn sample, mc (g)10,0009996
Sample weight after pre-drying (g)98009866
Sample weight before drying (g)50005002
Sample weight after drying (g)45674619
Weight of dry matter in the sample,
md (g)
89519111
Water content of the corn sample, wc (%)10,4878858
Table 4. Calculated water content wc of corn during vacuum drying. md is the weight of dry matter of the sample; wc1 is the initial moisture content of the sample; wc2 is the moisture content after removal from the vacuum chamber; wc3 is the moisture content after drying the sample on the sieve; w c is the moisture difference; and w c r e l is the relative moisture difference of the corn sample.
Measurement
No.
mdwc1wc2wc3ΔwcΔwc rel
(g)(%)(%)(%)(%)(%)
11163.6710.4910.069.980.514.82
21163.6710.4910.1410.070.424.00
31163.6710.4910.1310.050.444.19
41163.6710.499.999.900.585.55
51163.6710.499.939.820.666.32
61163.6710.499.909.810.686.48
71163.6710.4910.0910.000.484.62
81163.6710.499.829.740.747.09
9 over 2 cycles1163.6710.499.309.221.2712.12
9 in 1st cycle1163.6710.499.789.780.716.75
9 in 2nd cycle1163.679.789.299.220.565.76
101184.858.868.518.440.424.69
111184.858.868.658.570.293.26
121184.858.868.648.560.2953.335
131184.858.868.568.490.3664.132
141184.858.868.578.480.3734.212
Disclaimer/Publisher’s Note: The statements, opinions and data contained in all publications are solely those of the individual author(s) and contributor(s) and not of MDPI and/or the editor(s). MDPI and/or the editor(s) disclaim responsibility for any injury to people or property resulting from any ideas, methods, instructions or products referred to in the content.

