Article

Determining Usage Intention for the Sustainability of Public Transport in Northern Cyprus Using the Theory of Planned Behaviour

by
Mehmet Angın
1,*,
Shaban Ismael Albrka Ali
1 and
Hussin A. M. Yahia
2
1
Department of Civil Engineering, Faculty of Civil and Environmental Engineering, Near East University, Nicosia 99138, Cyprus
2
Department of Civil & Mechanical Engineering, Middle East College, Muscat 124, Oman
*
Author to whom correspondence should be addressed.
Sustainability 2024, 16(2), 804; https://doi.org/10.3390/su16020804
Submission received: 21 November 2023 / Revised: 9 January 2024 / Accepted: 13 January 2024 / Published: 17 January 2024
(This article belongs to the Collection Transportation Planning and Public Transport)

Abstract

:
Transportation plays an important role in serving economic, social, political, and population mobility. Public transport is gaining importance for providing sustainability, such as by reducing traffic congestion, noise levels, providing better air quality, and contributing to public health. Public transportation facilities are undeveloped in Northern Cyprus, and only buses and minibuses are available. Many people are ready to shift to public transportation if safe, reliable, and affordable transportation options are available. The theory of planned behaviour was used, and an online survey including 33 questions was conducted with the contributions of 385 participants. All variables of the theory of planned behaviour have a greater than 0.70 Cronbach’s alpha value; therefore, multiple linear regression analysis with the SPSS V27 program was conducted to detect the impact of attitude, subjective norms, and perceived behavioural control on behavioural intention. Note that 32.2% of intention is indicated by attitude, subjective norms, and perceived behavioural control. The study concluded that subjective norms and perceived behavioural control have a positive influence on behavioural intention. Attitude is not a predictor of behavioural intention. Subjective norms are the strongest (β = 0.438, p < 0.001), and perceived behavioural control is the weakest (β = 0.438, p < 0.001) predictor of public transport usage intention.

1. Introduction

Transportation comprises the displacement of people and objects for a specific purpose. The fulfilment of the relocation operations, which are supposed to be useful, is also called transportation [1]. It is an important factor and serves social, economic, political, and population mobility that grows and follows developments that occur in different sectors and fields [2]. Transportation systems are considered to be the lifeblood of cities [3].
Public transport (PT) is referred to as transportation by a conveyance that provides continuing special or general transportation to the public. It includes different types of modes, such as rails, buses, trolleys, subways, and ferry boats [4]. PT systems operate along lines that were determined months or weeks before the journey [5]. Furthermore, it can be described as a shared passenger transportation activity that is suitable for public use, like the movement of goods and people to fulfil the primary needs of communities that require access and mobility [6]. It is a high-capacity vehicle sharing system that serves as the backbone of urban transport networks, particularly in densely populated areas [7]. It plays a key role in accommodating public travel needs, and its ability to move people around makes it extremely significant [8,9]. Moreover, PT networks are key factors in urban structure that enable elements of urban interactions and circulations to be improved [10].
The main purpose of PT accessibility evaluation is to make the connectivity of locations and people easier in order to decrease the congestion on roads [11]. PT reduces the external costs of driving private vehicles, but numerous urbanites prefer not to use it [12]. Door-to-door service packages play a vital role as a feasible alternative for a private car [13]. Therefore, PT should be accessible and safe for everyone in order to encourage both the use and further development of a sustainable transport system [14]. It is significant for improving commercial and industrial life in a region, increasing labour markets, and reaching environmental goals. Municipalities also emphasised that road traffic should be minimised in favour of walking, cycling, and PT. Reducing the number of cars leads to reduced traffic congestion, lower noise levels, better air quality, reduced overall environmental impact, and better public health [15]. PT also has another remarkable benefit in that it allows individuals to be less stressed, remain relaxed, and potentially read or rest while travelling [16].
PT directly affects the quality of life of local communities and performs the required function for social, economic, and business development in large urban centres [17]. One of the purposes of PT in urban areas is to improve commuting. Therefore, employment rates may increase due to a rise in job accessibility [18]. The impact of PT on daily life is presented in Table 1 [15].
Although PT has advantages, it also has some disadvantages, such as time wastage, uncomfortable conditions, crowded services, unreliability, uncertainty of time, long waiting times, need for transfers, traffic, lack of flexibility, and long walking times [16].
One of the previous studies emphasised that air pollution concentrations achieve higher levels in the absence of a PT system [19]. On the other hand, the rising number of cars in Northern Cyprus is also arguably the source of dangerously high levels of carbon dioxide emissions per capita. In 2017, the number of registered vehicles increased by nearly 66% compared with 2015, including registered vehicles of around 182,709 and non-registered vehicles of approximately 109,665 [20].
The migration from rural areas to urban areas causes problems due to the incremental growth of the population in recent years, and population growth leads to an increment in travel demand [1,21]. The rising number of cars and growth in urbanisation lead to traffic congestion in urban centres and, subsequently, to the occurrence of more traffic accidents. Road traffic accidents are a substantial public problem in the world and have become a major cause of death among young adults in many societies. Both developed and developing countries care about road accidents because of their effect on economic, social, and health issues [22]. Developed public transit systems are not only needed for better public services, they are also required to minimise personal vehicle usage [23].
Sustainable PT has become complex all over the world as a result of economic, social, political, cultural, and technological developments [24]. A commonly observed trend was that the need for PT grew steadily over time. It has become a must in increasingly congested metropolitan centres due to traffic congestion and since people no longer choose to own cars [25]. Road traffic congestion is one of the most common transport problems in urban areas due to the reduced liveability and attractiveness of cities [26]. It has always been the main policy goal of transportation authorities to explore ways of promoting public transit [27]. PT is a strategic choice in order to construct an environmentally friendly society [28]. Sustainable transportation has three main goals:
  • Limits waste and emissions within the planet’s capability to absorb, reduces non-renewable resource consumption, and reduces the production of noise.
  • Operates efficiently, offers a choice of transportation mode, and supports a vibrant economy.
  • Allows the basic access needs of individuals and societies to be met safely and in a manner consistent with human and ecosystem health [3].
Table 2 describes how sustainable PT contributes to the development of environmental, economic, and social life [3].
This study was conducted to determine the intentions of people living in Northern Cyprus regarding PT within the framework of the theory of planned behaviour. This research finds out or detects users’ satisfaction with the efficiency and quality of the offered PT facilities. The effects of attitude, subjective norms, and perceived behavioural control on intention were evaluated, and their effects were seen. The results obtained from this study can be used to maintain and develop current transportation facilities in the future.

2. Literature Review

Redman et al. [29] conducted a study in order to provide a greater level of understanding of aspects of PT quality to attract car users. They attempted to determine which quality attributes of public services are attractive to users and what changes in the quality attributes of PT services could encourage a modal shift from private motor vehicles to PT. They followed two stages to evaluate the research questions. Firstly, an analysis was conducted of how the quality of PT is defined according to the review of studies on the quality of PT, how it is evaluated, and how it can be improved to increase ridership. Secondly, empirical studies measuring the effects of PT improvements were analysed, considering the specific improvements targeted and then focusing on studies that targeted car use. The study findings indicated that reduced fare promotions and other habit-interrupting transport policy measures can encourage car users to initially test PT services.
Ambak et al. [21] conducted a study in the region of Batu Pahat and Kluang in Malaysia. PT is important for daily life in Malaysia. This study presents behavioural intention for using PT, mainly public bus-based transport, based on the theory of planned behaviour. A questionnaire survey was used as a research tool, and 282 respondents completed the survey in order to identify factors that contribute to and influence users to use public buses and to determine the factors that are most effective using the TPB model. Regression and correlation analyses were also applied for this study. The results of the study showed that education is the primary factor in the use of public buses, and the frequency of public bus usage was 1–5 times per week. The study results indicated that attitude was found to be the factor that most affected the respondents’ use of public buses. On the other hand, most of the survey participants preferred to use public buses, as they are a cheap alternative for travel that can generate cost savings compared with private vehicles.
Saif et al. [11] conducted another interesting study in order to review the existing literature about PT accessibility. They focused on the relationship between PT and other aspects of social life. The review study included PT perceived accessibility, PT accessibility and public health, PT accessibility and employment rates, PT accessibility and social exclusion, PT accessibility and mobility, PT accessibility and sustainability, and PT accessibility and economical, spatial, and temporal efficiency. The study concluded that the effect of PT on other social aspects should be taken into account in PT facilities, not only PT performance.
Shaaban and Maher [8] focused on the theory of planned behaviour and aimed to investigate the possible usage of future metro services by applying a questionnaire-designed survey in Doha City. Qatar is confronted by high traffic demand, poor infrastructure, and limited land. Therefore, the country is constructing a new metro system in order to minimise traffic congestion and meet transportation needs. The theory of planned behaviour was followed to detect the intention of people to use the upcoming metro according to their attitudes, perceived norms, and sense of control. At the end of the study, it was found that perceived behavioural control was significant for residents in terms of using the metro for work and not for leisure.
Brohi et al. [30] worked on the factors that affect commuters’ behavioural intentions for using the Karachi Circular Railway in the Karachi metropolitan area and investigated the most effective factor by using the theory of planned behaviour. A questionnaire survey was used as a research tool to categorise variables that affect users’ intentions to use the Karachi Circular Railway. A total of 240 respondents contributed to the survey. Cronbach’s alpha values were also used to check the reliability of the questionnaire. At the end of the study, most of the respondents agreed that they would choose to use the Karachi Circular Railway because it could save money and provide comfortable, environmentally friendly, and satisfactory services.
Rezaimoghadam [31] aimed to investigate the impact of the theory of planned behaviour variables on citizens considering the use of PT vehicles. Questionnaire research was conducted in Gorgan, Northern Iran, and 650 questionnaires were delivered to different schools in the region. Then, students gave the questionnaires to their parents to respond. A total of 362 of the questionnaires were collected, and 339 of them were approved. Subsequently, statistical data were analysed using SPSS V23 software. According to the study findings, attitude is the most important factor that affects intention to use PT. The results of the study also emphasised that those who used PT more frequently were more aware of its benefits than others.
Borhan et al. [32] conducted another study in Libya. The theory of planned behaviour was used to predict the travel intentions of car drivers with respect to new low-cost carriers (LCC). In total, 338 valid responses were collected for this study. Confirmatory factor analysis was used to analyse the data using the AMOS 21.0 program. The results of the study showed that the LCC service in Libya has the potential to attract the interest of people who tend to drive their own cars. The model of the study was well supported, and most hypotheses were confirmed. The results showed relatively good predictive validity.

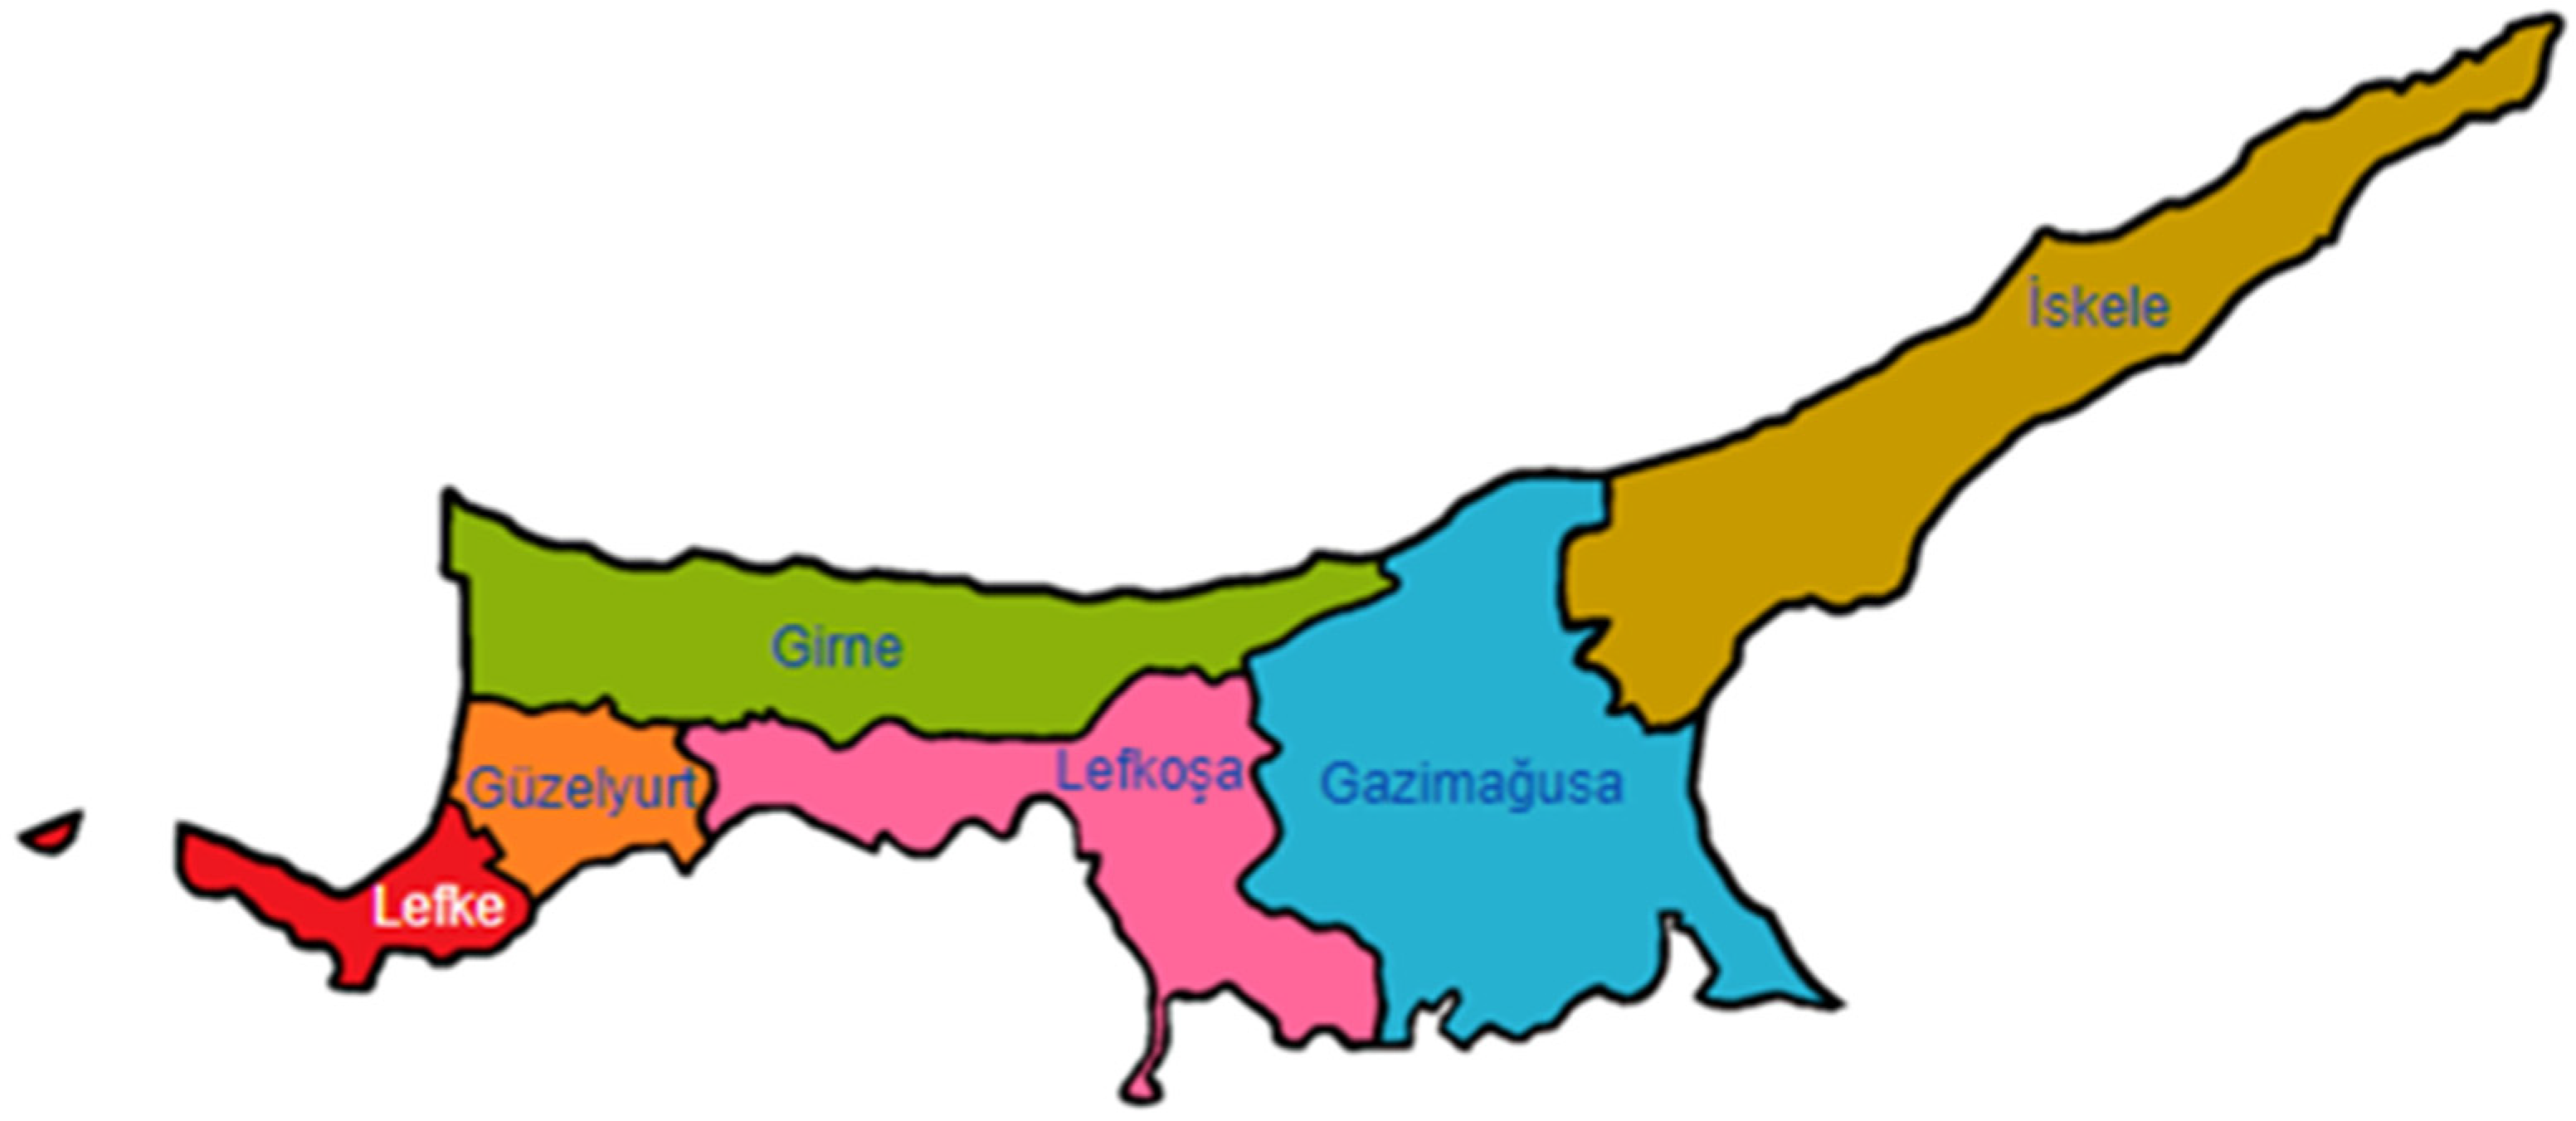
2.1. Public Transport in Northern Cyprus

Transportation is served by road transportation in Northern Cyprus, and a railway system does not exist. Airlines and ferries are only used for travel purposes abroad. Since it is not a populous country, PT facilities are limited. There are no other choices offered in other countries here. PT is carried out with only bus and minibus services. Universities provide transportation services to their students who reside outside of the campuses or in different districts. Students are also able to benefit from on-campus ring services arranged during lecture hours. Transportation is a significant problem in Northern Cyprus, and PT issues have always been a challenge in cases where PT cannot provide a high level of service.
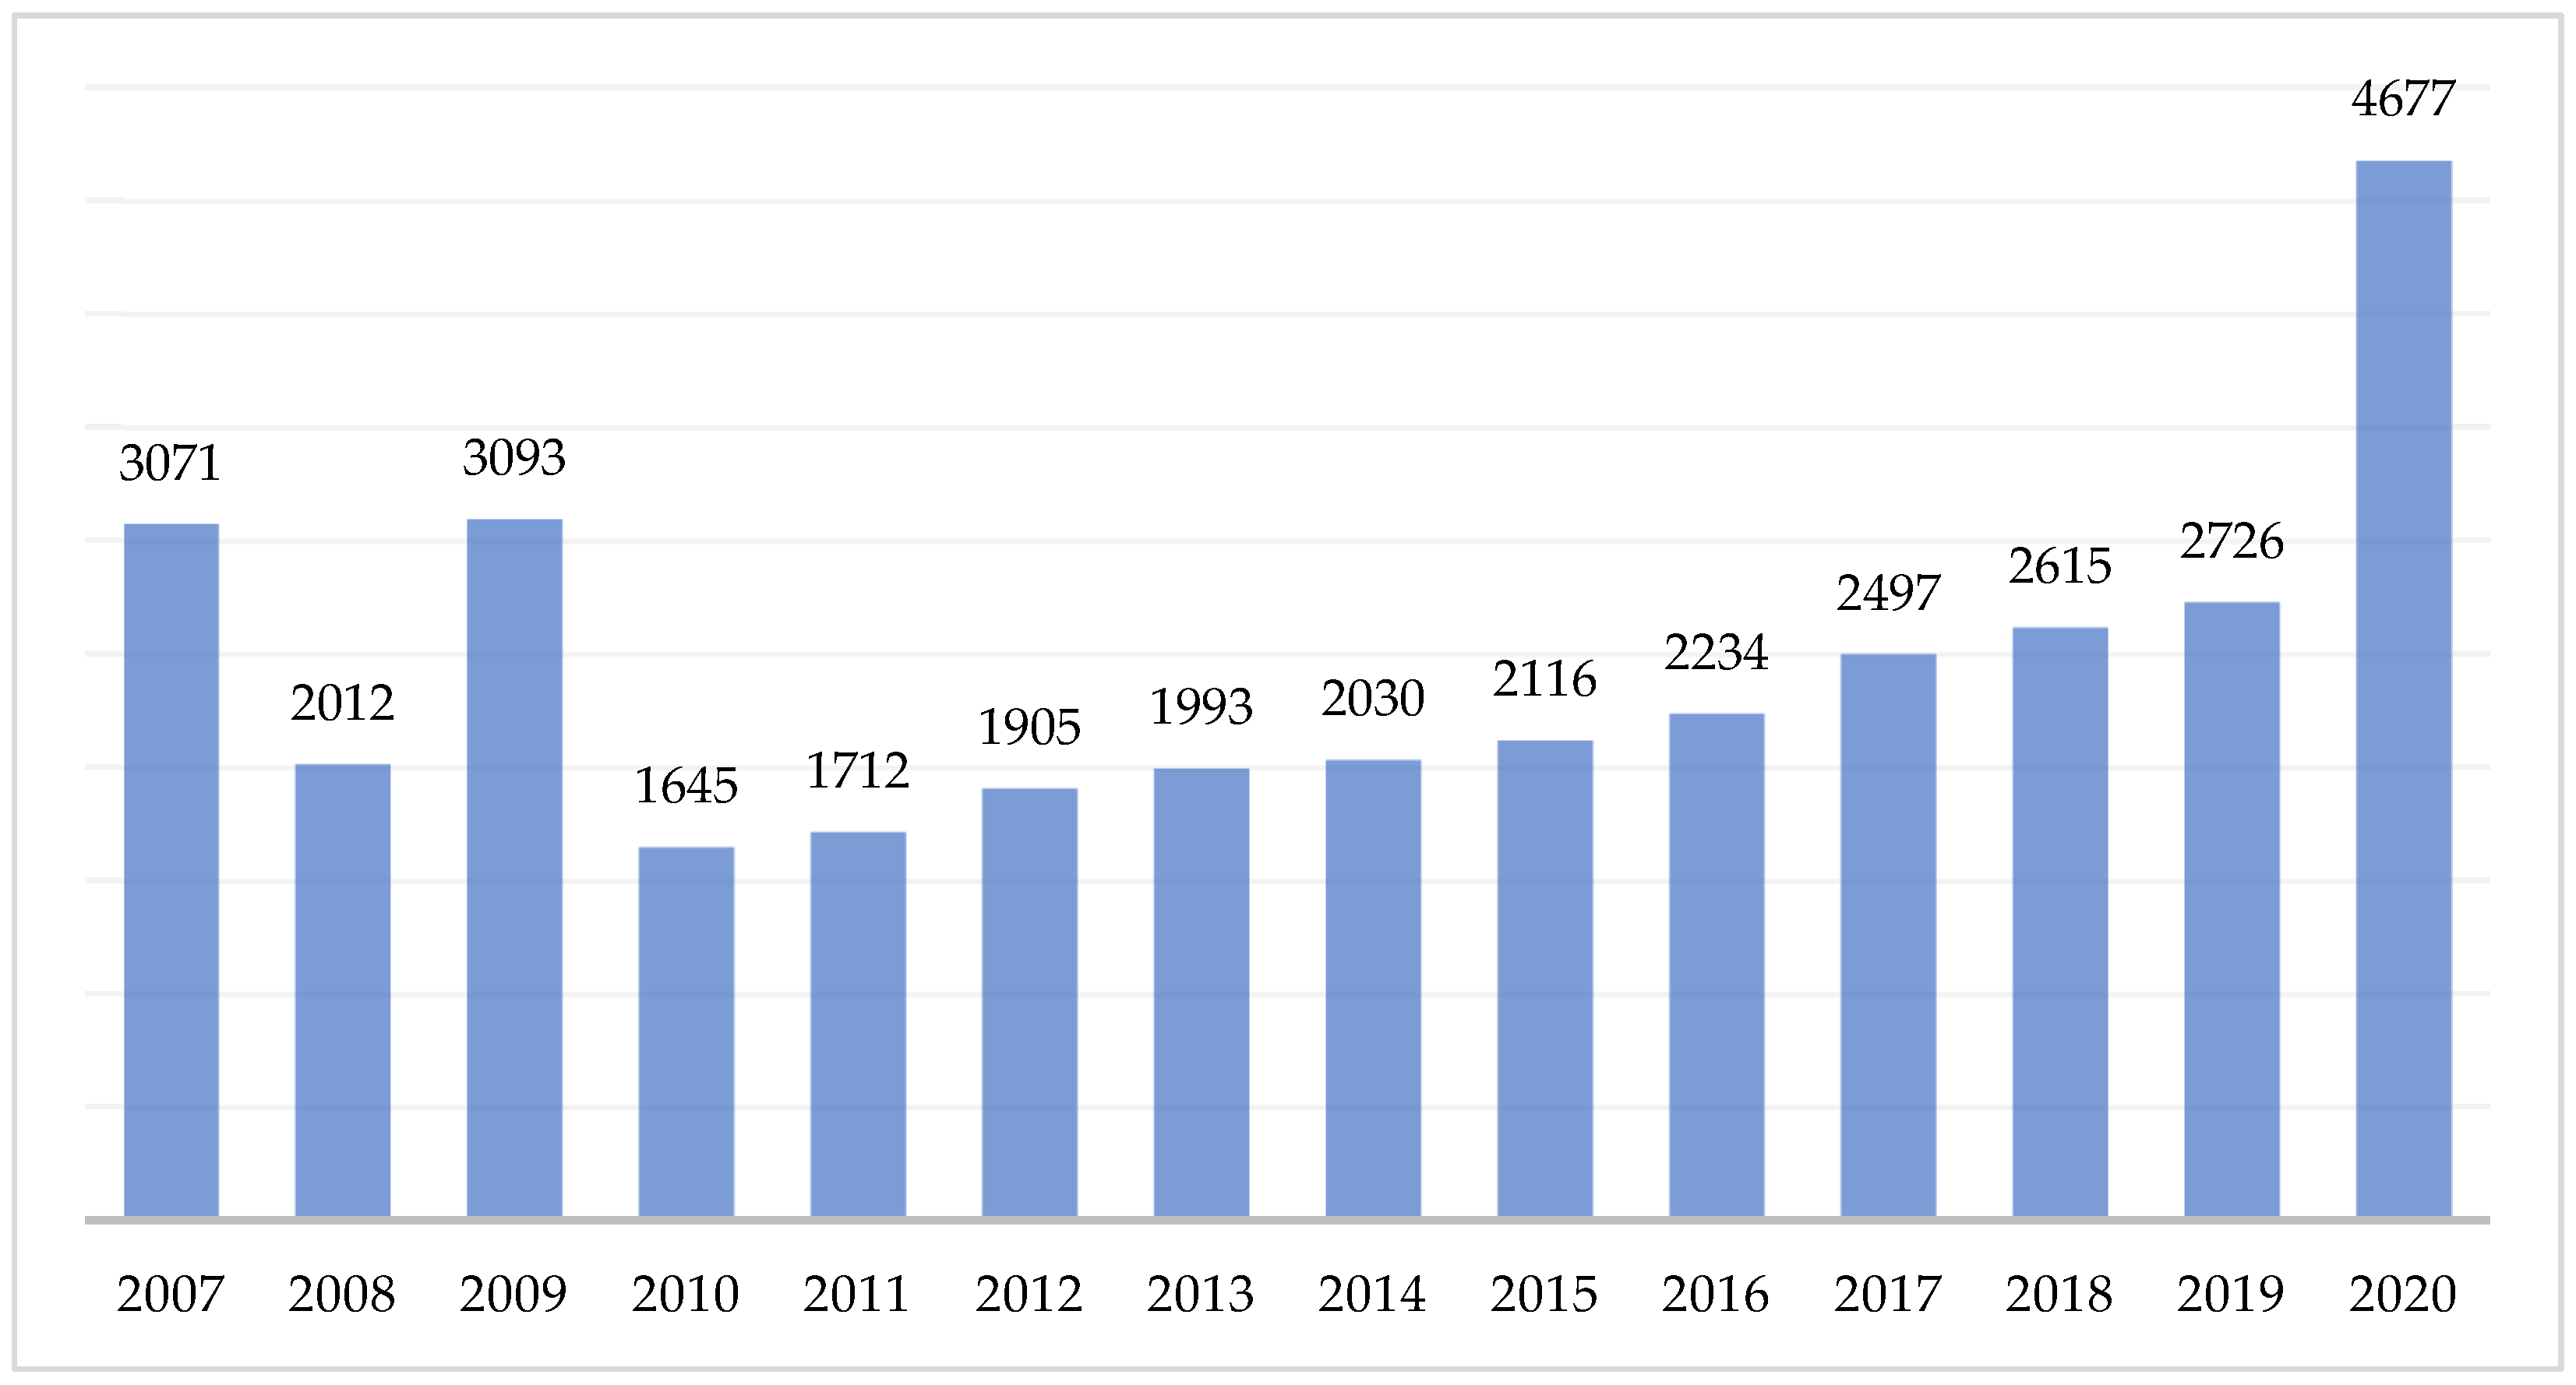
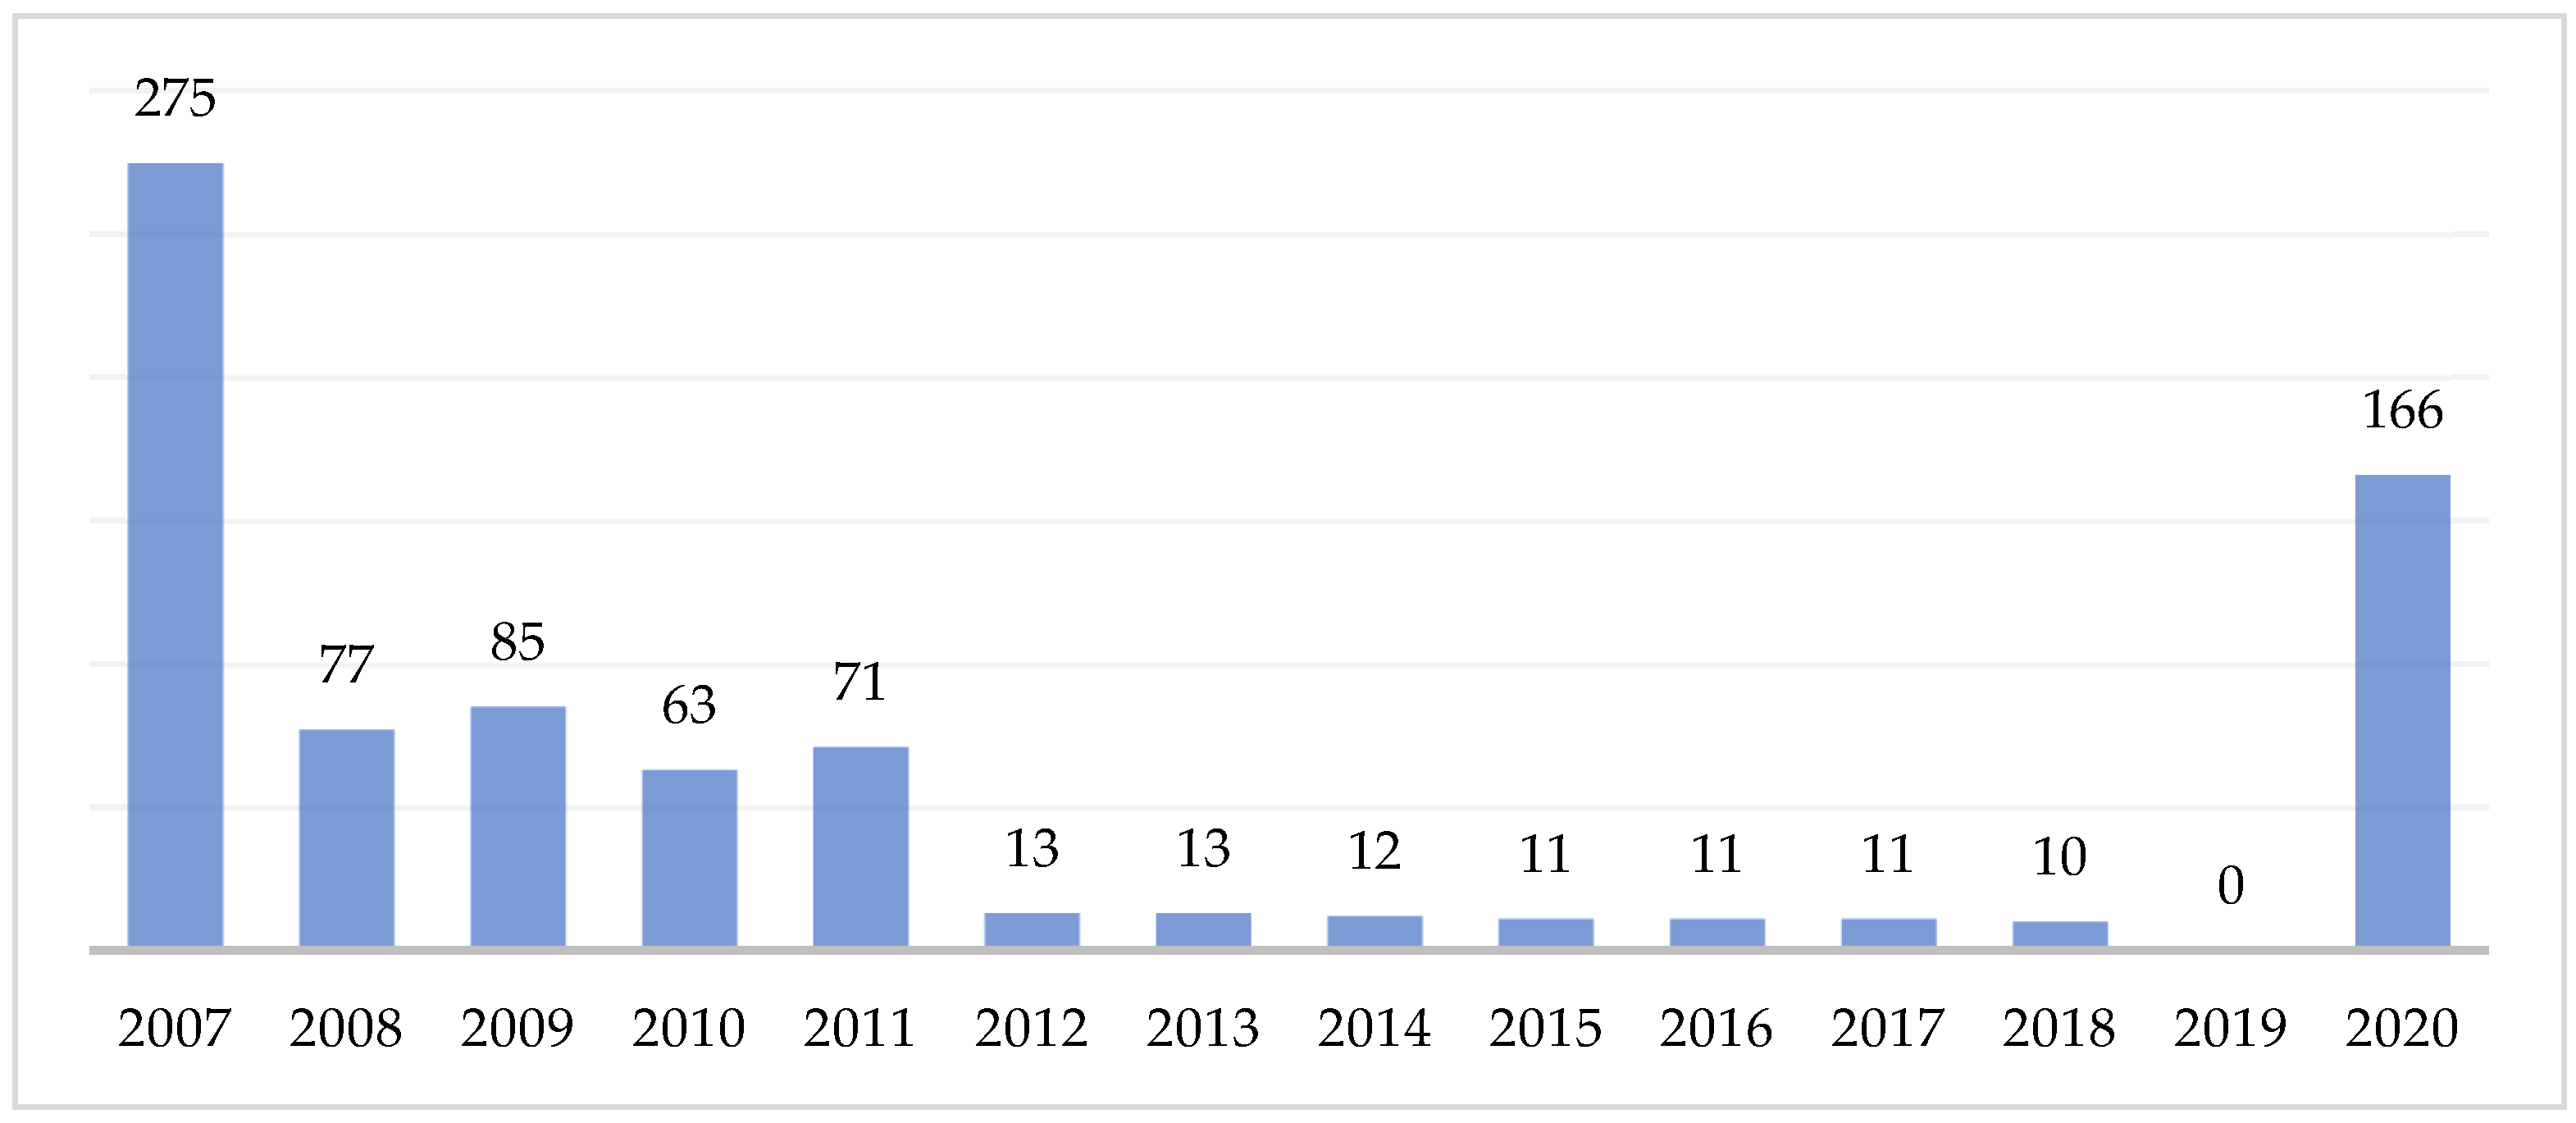
 Figure 1 and Figure 2 show the yearly number of recorded buses and minibuses, respectively, according to official country statistics [33,34,35,36,37,38,39].
It is easily seen that the number of buses varies every year when the number of buses in the 2007–2020 period is examined. The number of buses has been on a regular, increasing trend since 2010. In 2020, the number of buses reached its maximum level. The increase in the number of higher education students contributed to this situation.
It is seen that there are not many minibuses in Northern Cyprus, according to Figure 2. In fact, it seems that there were fewer minibuses in 2020 compared to 2007. This situation can be considered as minibuses being replaced by buses in the PT network. 
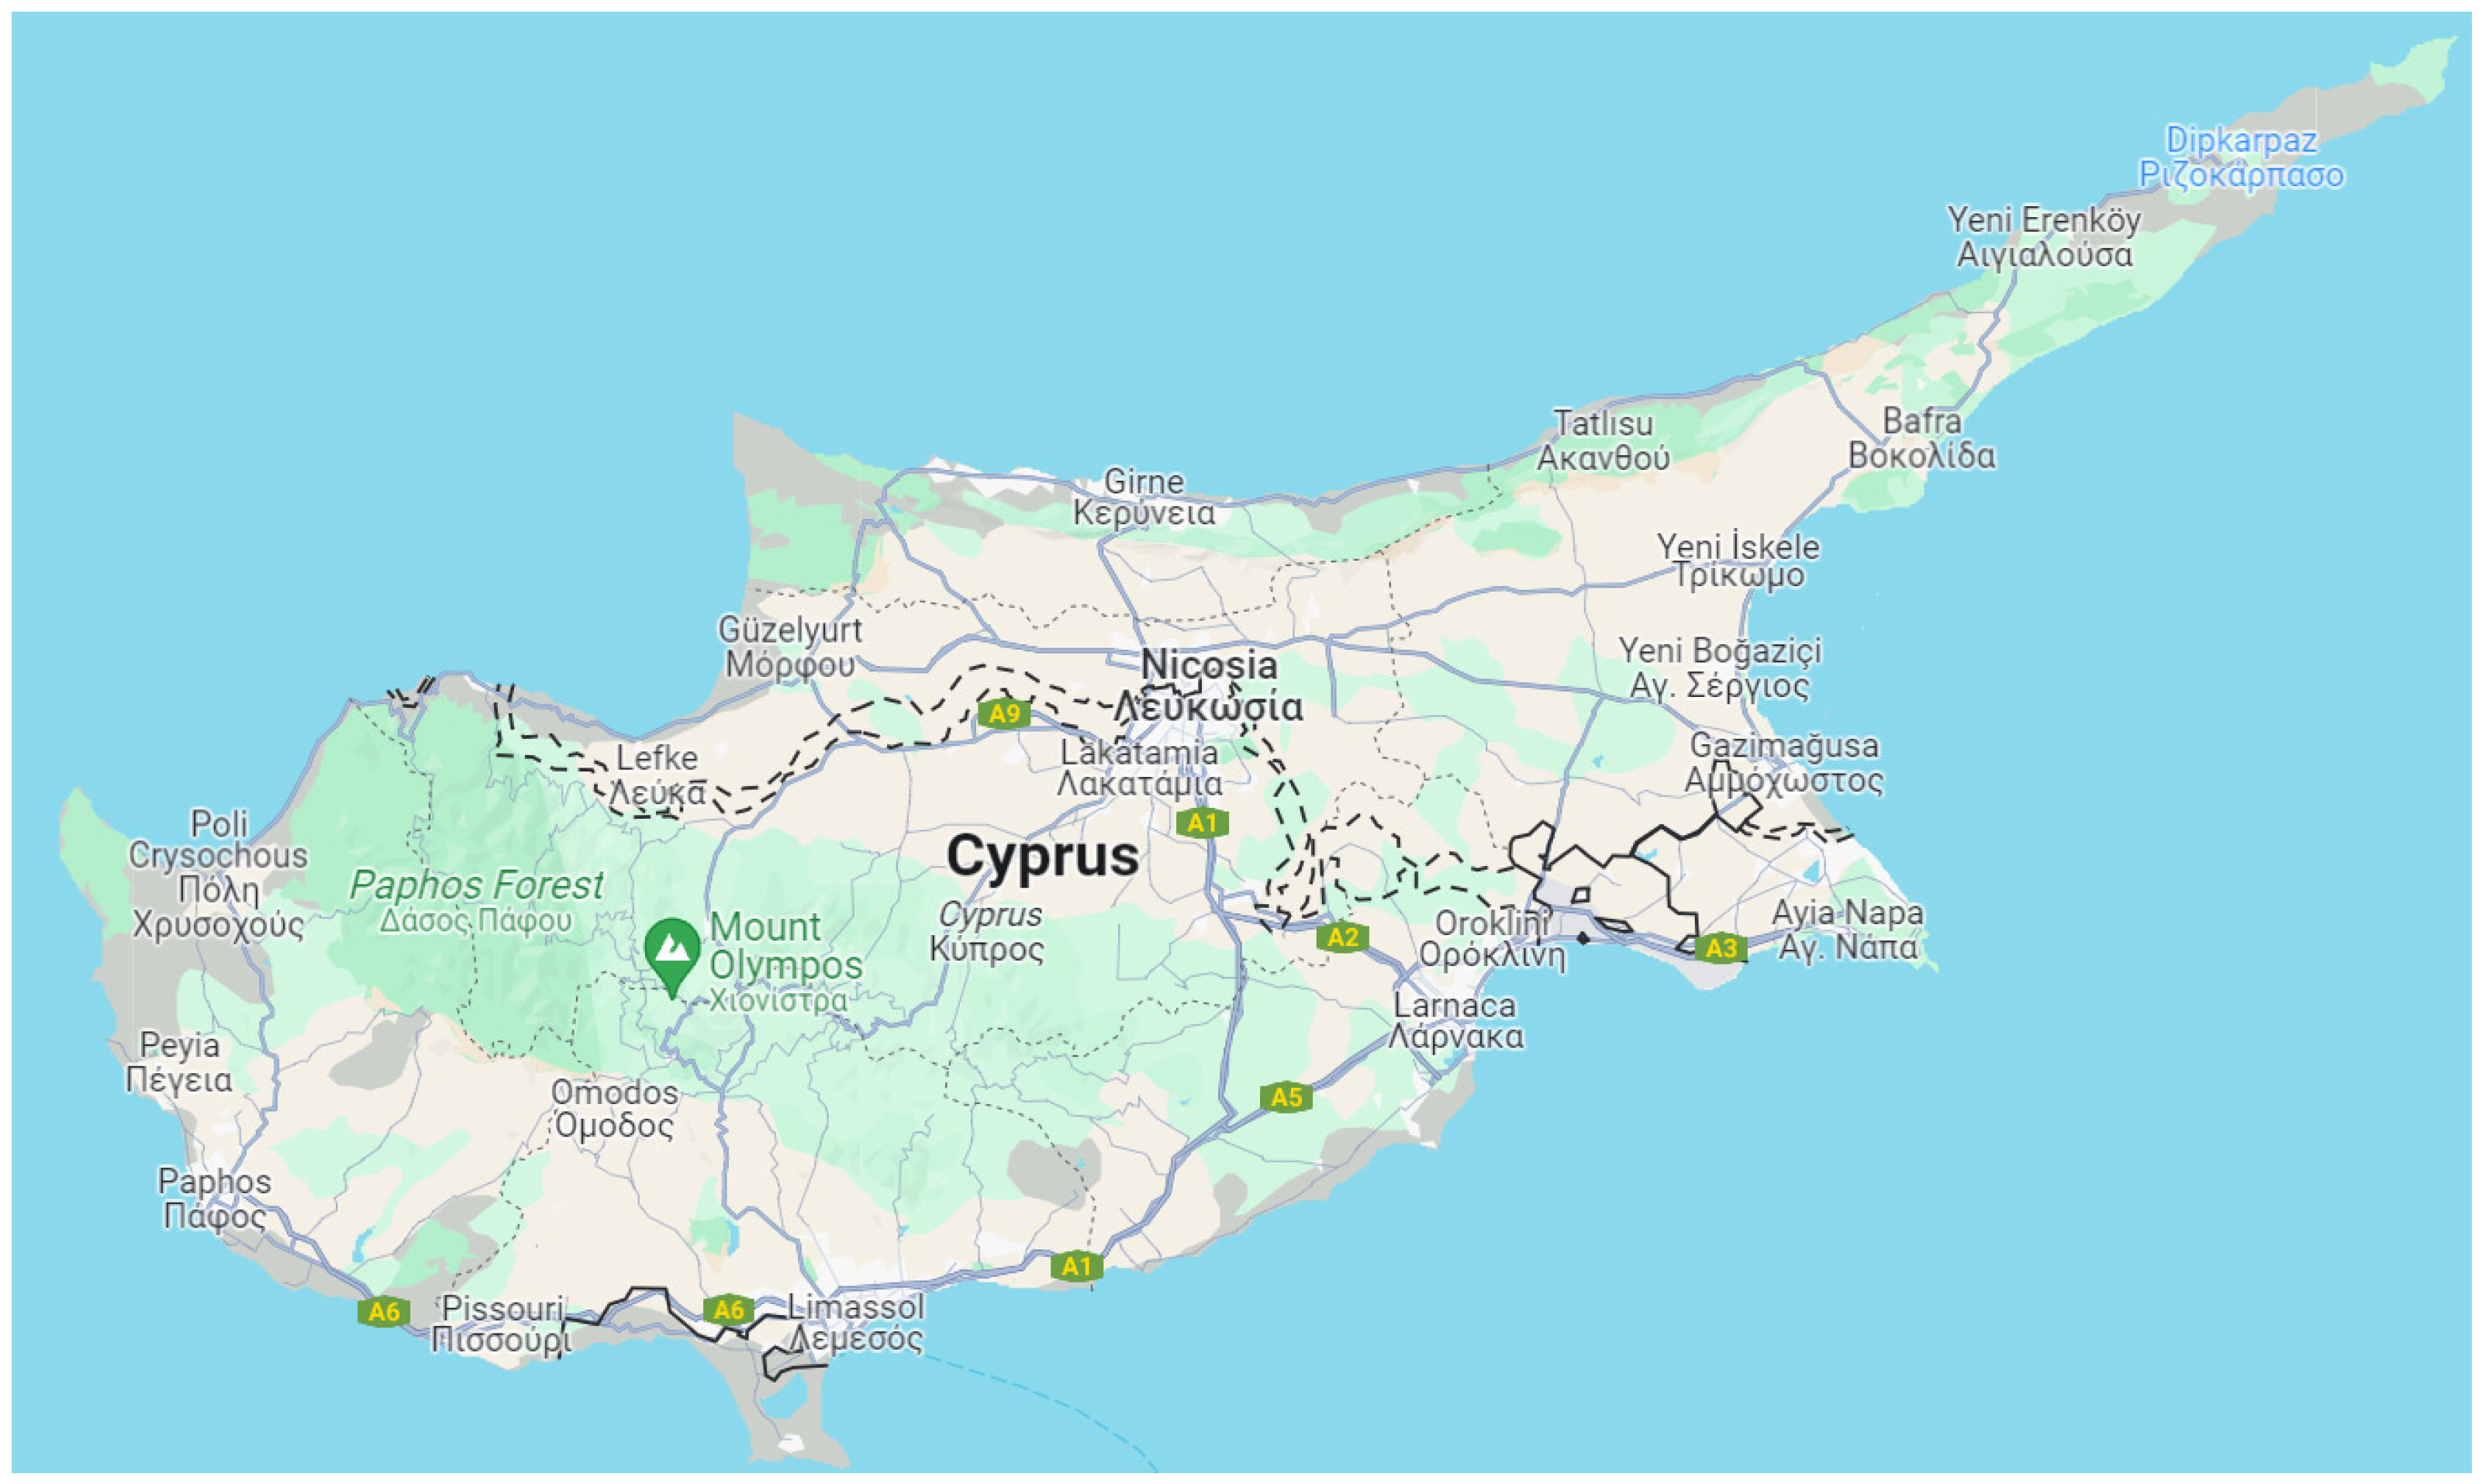
Figure 3 shows the PT lines between districts of Northern Cyprus.

2.2. Theory of Planned Behaviour

The Theory of Planned Behaviour (TPB) was developed by Icek Ajzen in 1985 and is an extension of the theory of reasoned action [21]. Perceived behavioural control was added to the theory of reasoned action to define individuals’ perception of the difficulty or ease of performing a particular behaviour [40]. TPB has three main determinants: attitude towards behaviour, subjective norms, and perceived behavioural control [41]. It proposes behaviour as a function of perceived behavioural control and behavioural intentions [42].
It is a social-psychological theory that is used to quantify and describe how human acts are driven [30,43]. TPB is the most commonly used way of explaining human behaviour [44]. One of the advantages of TPB relates to the possibility of increasing its potential to predict behaviour [45]. It emphasises the importance of the individual’s attention and action while also understanding and predicting their attitude [46]. People’s social behaviour is under the control of certain factors, resulting from certain reasons, and occurs in a planned way, according to the TPB. The goal of the behaviour can be measured, and the probability of its occurrence can be determined with TPB [47].
TPB has been used to predict and explain diverse behaviours like weight loss, smoking cessation, social sciences, voting choices, committing traffic violations, transportation, choice of travel mode, recycling, physical activity, consumer behaviour, protection of privacy, and technology adoption [21,48]. Additionally, TPB also describes the psychological reasons for taking PT [30].
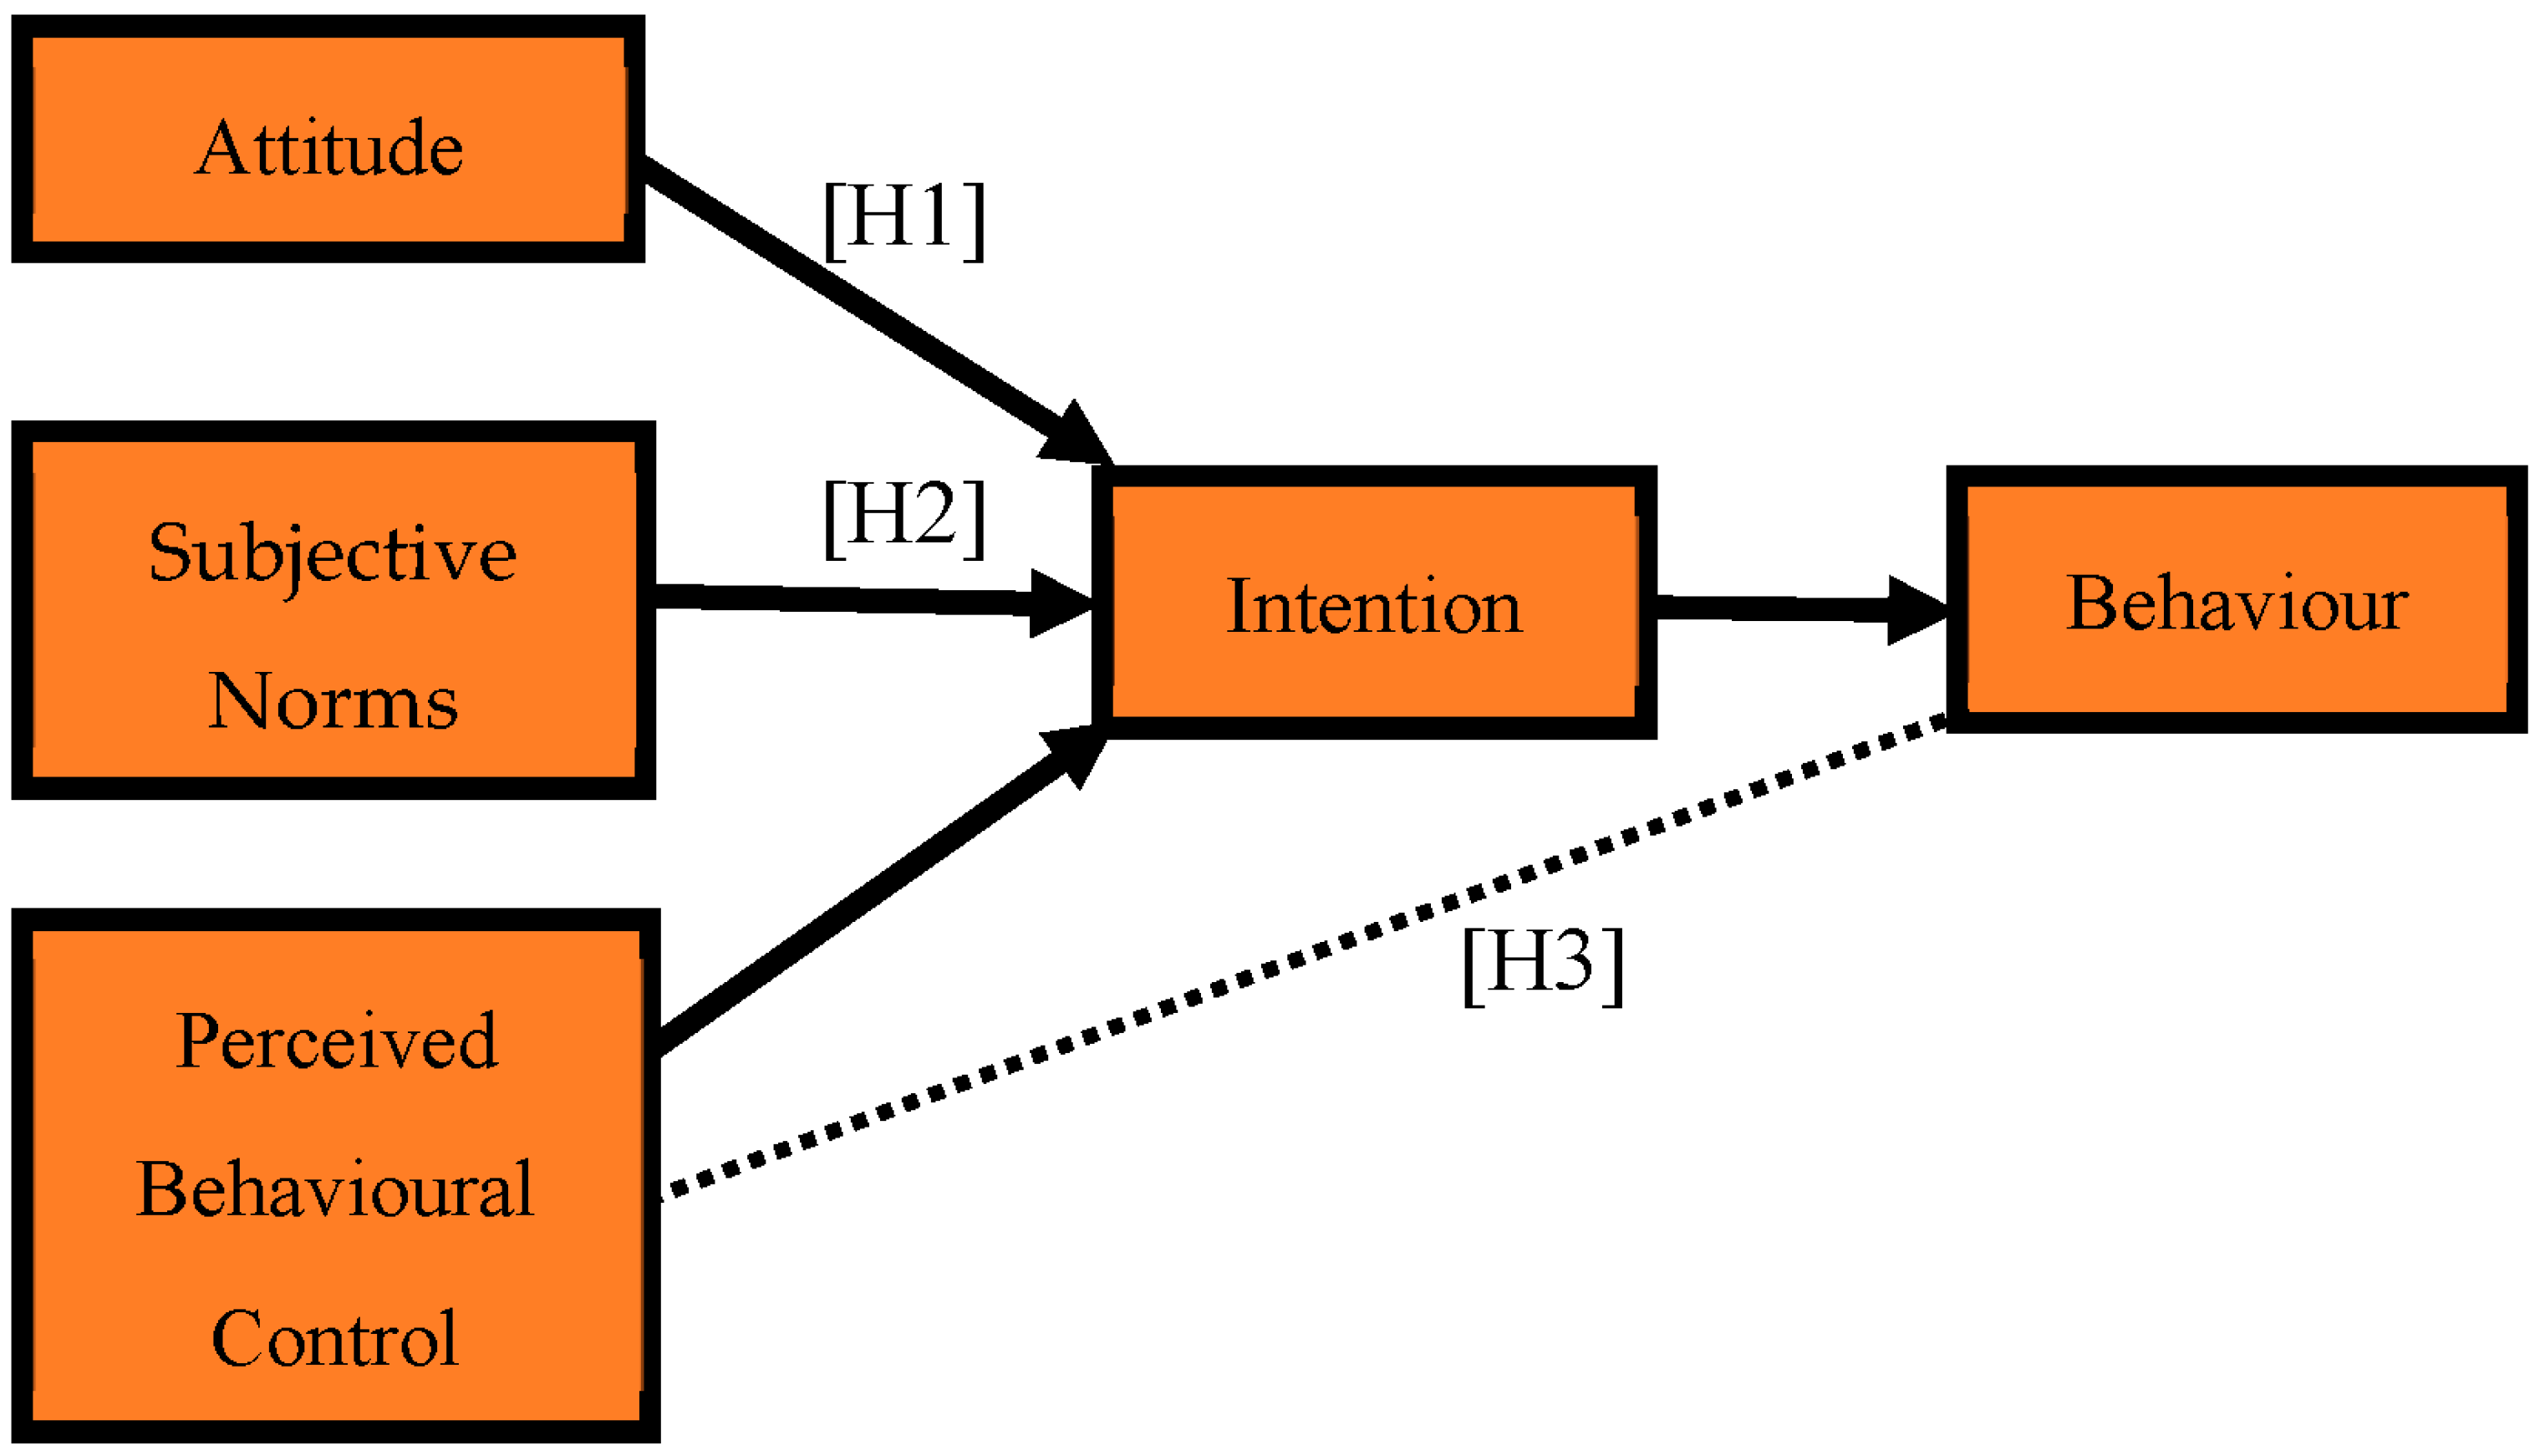
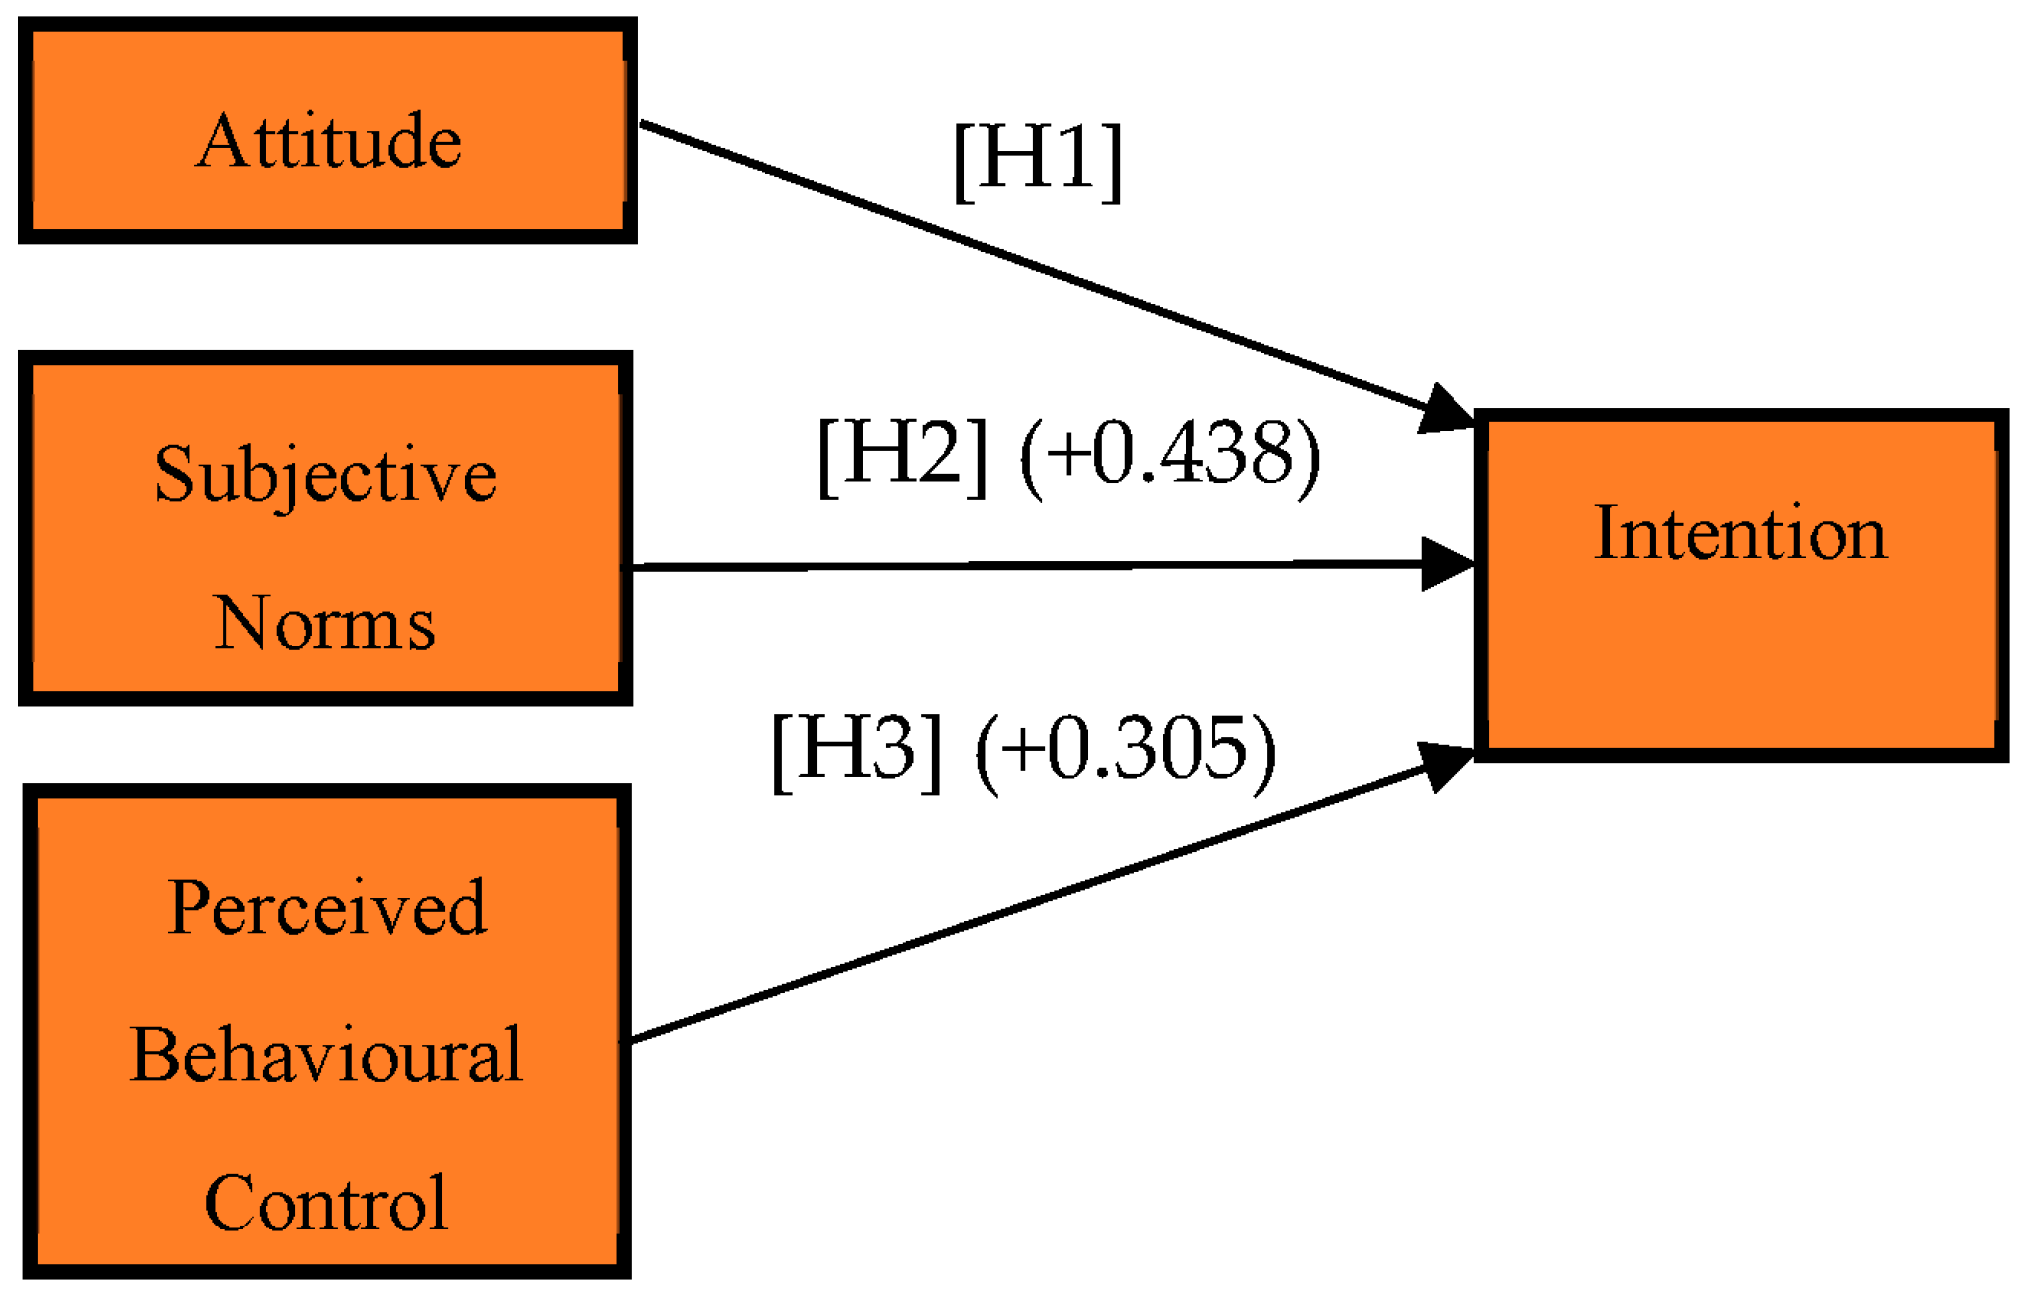
The correlation between attitude, subjective norms, and perceived behavioural control with intention is depicted in Figure 4. The figure also shows the impact of perceived behavioural control and intention on behaviour.
  • Attitude refers to the extent to which a person has an unfavourable or favourable evaluation or assessment of the behaviour in question [49].
  • Subjective norms refer to the perceived social pressure to fulfil or not fulfil the behaviour [49].
  • Perceived behavioural control refers to the perceived difficulty or ease of performing the behaviour. It also reflects previous experiences as well as obstacles and anticipated impediments [49]. It plays an important role due to its ability to directly affect behaviour, but it does not always happen [50]. Perceived behavioural control follows three different paths towards behaviour, which are listed below:
    • Explains behaviour through intention;
    • Directly explaining behaviour without the mediation of intention;
    • Description of both intention and direct behaviour.
  • An individual’s intention to perform a given behaviour is the central factor in TPB [49]. It is considered an antecedent of behaviour [51]. Intentions are indications of how hard people are willing to try and how much effort they are willing to exert. Intentions to perform different kinds of behaviours could be predicted with high reliability from attitudes towards perceived behavioural control, subjective norms, and the behaviour. When combined with perceptions of behavioural control, these intentions account for remarkable alterations in actual behaviour. On the other hand, perceived behavioural control with behavioural intention could also be used to directly find behaviour [49]. It is the most important factor in the emergence and display of human behaviour [50]. It is strongly related to behaviour, and it is considered that if intention can be predicted, behaviour can also be predicted [52]. The possibility of showing actual behaviour will be higher if the behavioural purpose is stronger [47].

3. Methodology

3.1. Study Area and Data Collection

Cyprus is an island situated in the Eastern Basin of the Mediterranean Sea, with an area of 9282 km2. It is located to the south of Turkey, west of Syria, and north of Egypt. It is the third-largest island in the Mediterranean, after Sicily and Sardinia, respectively [53]. Northern Cyprus has an area of 3355 square kilometres, which amounts to around a third of the island, and is divided into six districts: Nicosia (Lefkoşa), Famagusta (Gazimağusa), Kyrenia (Girne), Morphou (Güzelyurt), Trikomo (İskele), and Lefka (Lefke), as shown in Figure 6 [54]. PT operators and managers should develop a user-oriented strategy in order to attract existing PT users. For this reason, passenger behaviour and psychological perception are significant [55]. This research started by using the TPB model developed by Ajzen in 1985 to examine the PT usage intention in Northern Cyprus. It is necessary to better understand the psychological factors to encourage more passengers. For this reason, the authors preferred to use the TPB model. Figure 5 describes the research process for the study.
Problems can be observed more effectively when data collection in research is spread over a large area. Rahman and Kabir [56] mentioned that we should choose a location that we see as ideal and balance it with the reality of the context. Problems will be better seen when data collection in research is spread over a large area. Therefore, the present study was not conducted in a single district, the questionnaire was designed and distributed to people in six districts via the online method. The fact that PT facilities are the same in all districts is another reason why the study was carried out throughout the country. Figure 6 indicates the research area.

3.2. Questionnaire Design

Data collection and analysis comprise one of the most important steps of a scientific research process [57]. Questionnaires help us identify what people know, what they do, what they like, what they believe, and what personal characteristics they have [58]. It was considered to be the most suitable approach to achieve the research objectives, as this approach attempts to determine relationships among specific variables [26]. The data collection was carried out using a quantitative approach, and the questionnaire was chosen as the research tool in the study. The online questionnaire was delivered to respondents via Google Forms. The survey was prepared in English and then translated into Turkish in order to maximise the reliability and accuracy of the answers. The survey was completed and submitted electronically. The survey was designed in such a way that all questions were required to be answered and submission was not completed until all questions were answered. The Google Form link to the survey was shared, and those who wanted to participate could contribute easily. The online questionnaire campaign was held from February 2023 to April 2023. The respondents were chosen randomly from across the country, but the number of higher education students is high in Northern Cyprus. For instance, the number of students registered to higher educational institutions in the 2020–2021 academic year is 106,628 according to official data of Northern Cyprus [39]. For this reason, the research started with university students in the Nicosia region. Afterwards, the study continued by spreading the research throughout Northern Cyprus with individuals from different professional groups. The questionnaire was prepared using the basic TPB model indicators as a guideline and included two parts: demographic characteristics and measures for the TPB. The first part of the survey included seven questions about the demographic characteristics of the respondents. This part gives an overview of the personal information of the participants. In the second part of the survey, a 5-point Likert scale was used to measure the statements of the TPB model (Table 3).
All variables of the TPB, including attitude, subjective norms, and perceived behavioural control, were measured based on the current PT issue questions, which were adopted from the comprehensive literature review. Attitude has 17 questions, subjective norms have 3, perceived behavioural control has 3, and intention has 3. Behaviour can be found when intention is predicted, so no questions were asked about behaviour.

3.3. Target Population

The representative participants of the study were determined according to the population of Northern Cyprus. Hazra and Gogtay [59] stated how a sample size should be determined in their study. The number of participants required for the survey was calculated using these guidelines.
Population of Northern Cyprus: 382,836 (in accordance with last census)
S a m p l e   s i z e = [ R D 1 R D ] M E C L   s c o r e 2
  • RD: Response distribution
  • ME: Margin of error
  • CL score: Confidence level
S a m p l e   s i z e = [ 0.5 1 0.5 ] 0.05 1.96 2 = 384.16
C o r r e c t e d   s a m p l e   s i z e = s a m p l e   s i z e × p o p u l a t i o n s a m p l e   s i z e + p o p u l a t i o n 1
384.16 × 382,836 384.16 + 382,836 1 = 383.78
  • 384 participants required for the questionnaire.

3.4. Research Hypothesis

A hypothesis is a statement in which causal relationships are explained, especially contrary to a theory that is not currently supported by data [60]. The following research hypotheses are adapted to PT in Northern Cyprus, as presented in Figure 4. The intention to use PT with regard to attitude, subjective norms, and perceived behavioural control is examined.
Hypothesis 1:
Attitude may have a positive influence on the intention to use PT.
Hypothesis 2:
Subjective norms may have a positive influence on the intention to use PT.
Hypothesis 3:
Perceived behavioural control may have a positive influence on the intention to use PT.
Statistical tests were conducted using SPSS V27 in the data analysis process. Cronbach’s alpha was performed on each set of questions to test the internal consistency of the scales in order to verify their reliability. The data were analysed using multiple linear regression analysis in SPSS. Regression analysis was preferred because this type of analysis can indicate the extent to which the variables influence the outcome [61].

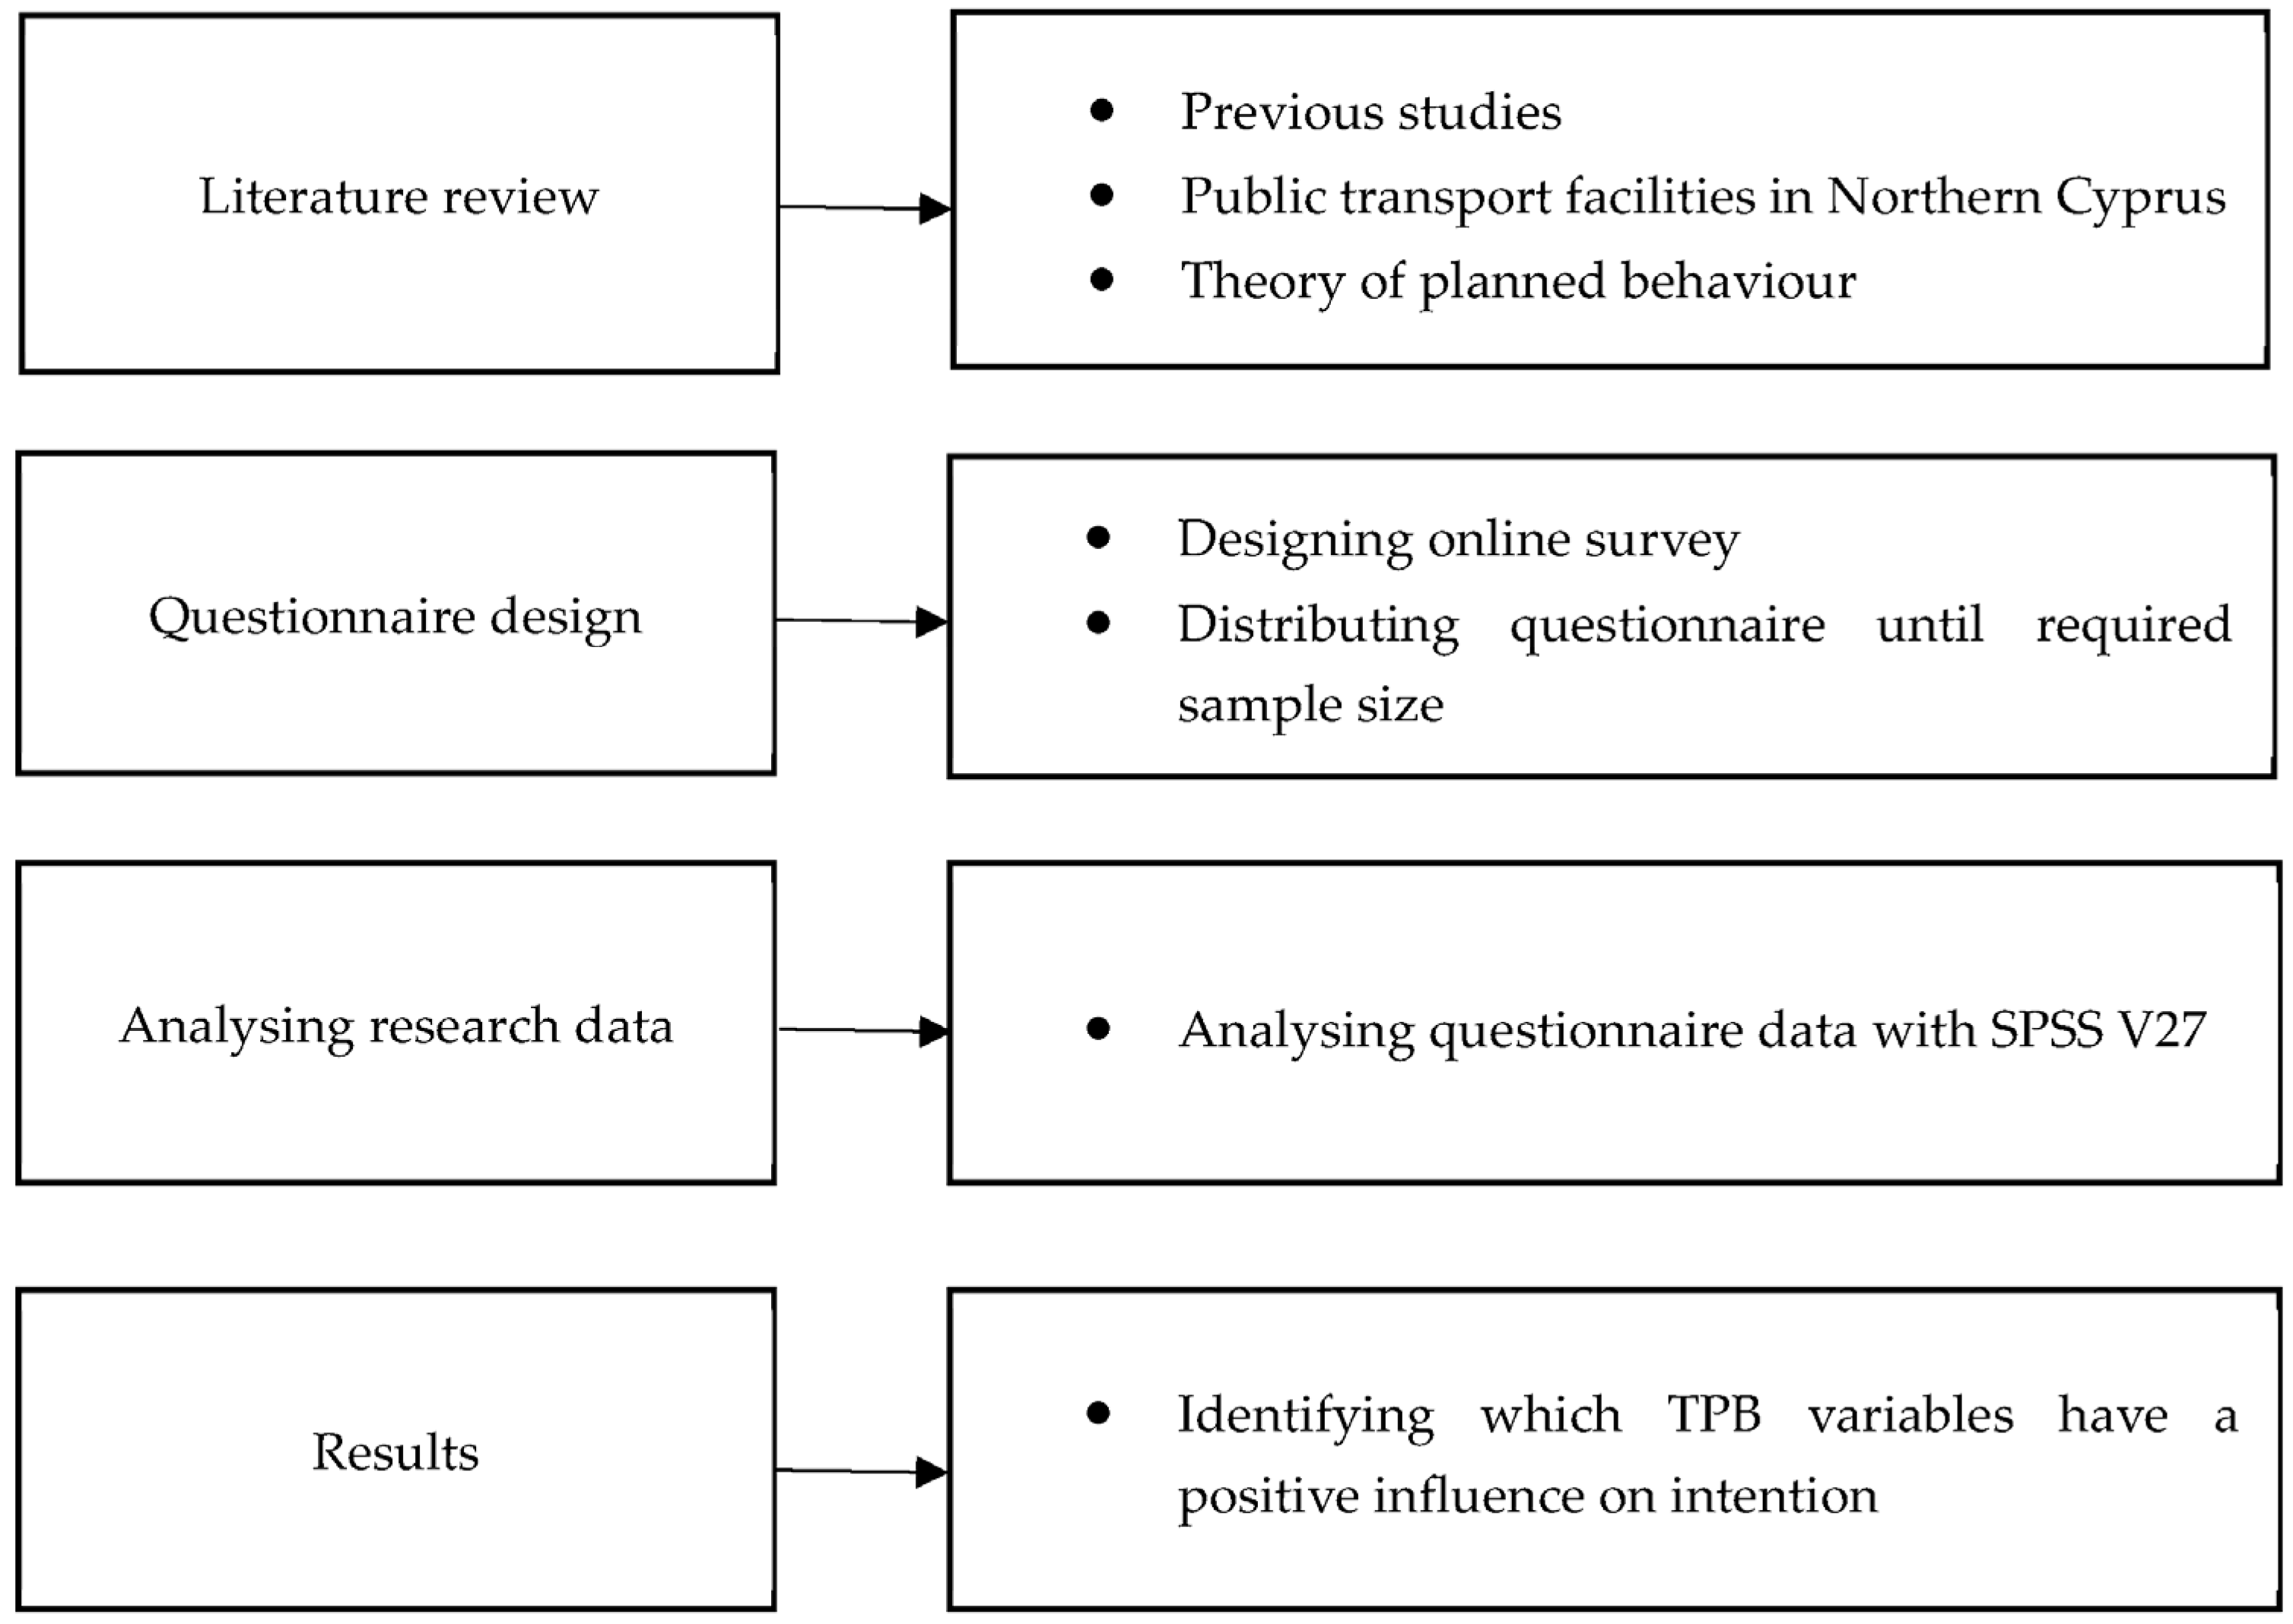
4. Results and Discussion

The model refers to the current process and plan to provide evidence for scientific research or to answer questions. The models used in the research are very important, as they affect the whole process of the research [50]. For this reason, it is aimed at determining the attitude, subjective norms, and perceived behavioural control variables of individuals and to what extent these variables explain the actual behaviour by evaluating them together with the intention. We first evaluated the descriptive statistics of the collected data, as presented in Table 4. Then, we continued analysis with linear regression, including model summary and ANOVA test.
  • In terms of the participants’ gender, the majority of the participants were female, with a rate of 52.47%.
  • Most of the participants were in the 18–29 age group, with a rate of 67.53% when the age distribution of the participants is examined. As young people use the internet more frequently, this could be the reason why the 18–29 age group achieved the highest rate. Moreover, this is followed by the 30–39 age group with 16.88%, the 40–49 age group with 10.91%, the 50–59 age group with 2.34%, and the 60-year-old and above age group with 2.34%.
  • Most of the participants had graduated from university at a rate of 40.26%. High school graduates are followed by university graduates with a rate of 42.08%. There were also several Master’s/PhD graduates with 16.10%.
  • According to the participants’ place of residence, most of the participants lived in Nicosia, with a rate of 73.25%. As Nicosia has the highest population as the capital city of Northern Cyprus, this is an expected result.
  • Another demographic characteristic of the participants is their career information. It is evident that the questionnaire was largely completed by students, with a rate of 55.85%.
  • The purpose of the PT usage section has been divided into five categories: work, daily routine, education, entertainment, and none of them. Some of the participants chose more than one option in this section of the survey. As it can be understood from the fact that students mostly participated in the survey, the results show that PT is mostly used for educational purposes.
  • The frequency of PT usage per week as part of the demographic characteristics has been divided into four categories: 1–5 times, 6–10 times, 11 times and more, and never use. It is evident that the majority of the respondents never used PT. The second most chosen option was 1–5 times with 23.12%, followed by 6–10 times and 11 times, which both had rates of 17.66%, respectively.
Attitude towards behaviour expresses positive or negative feelings about using PT and was measured with the help of a total of 17 statements. Participants answered their beliefs about uncomfortable and unsatisfactory travel conditions in the attitude section of the survey. Expensive bus tickets, long time intervals between bus services, and long distances between bus stops and destinations were also mentioned. The survey suggested that buses were not frequent enough and the time spent travelling on a bus was unsatisfactory. Most users complained about the waiting time between buses and the travel time from their origin to their destination. Table 5 shows the averages of the answers and the standard deviation of each statement. The answers were evaluated with the help of a five-point Likert scale. The mean values of the attitude are in the agreement tendency.
The subjective norm is the passenger’s thoughts about whether others approve of his or her use of PT and is measured with the help of a total of three statements. Table 6 shows the expressions, the mean and standard deviation of the responses to each statement. The mean values of the subjective norms are in the agreement tendency.
Perceived behavioural control refers to the consumer’s perceptions of whether he or she can perform PT usage behaviour. Table 7 shows the mean and standard deviation of the responses to each statement. The mean values of the perceived behavioural control are in the agreement tendency.
Intention shows how passengers are ready to try and how much effort they are willing to put into using PT in Northern Cyprus. Table 8 presents the mean and standard deviation of the intention variables. The mean values of the intention are in the agreement tendency.
Factor analysis is a multivariate statistical approach to a single set of variables when a researcher wants to find out which variables in a set constitute logical subsets that are comparatively independent of one another. It is very helpful in determining the factor that underlines the variables by grouping related variables into a single factor. The Kaiser–Meyer–Olkin (KMO) test is a measure of whether data are suitable for factor analysis [62]. Table 9 describes the KMO and Bartlett’s test results. The KMO measure of sampling adequacy is 0.533. KMO values below 0.6 indicate that the sampling is not adequate [62].
Cronbach’s alpha is used to determine the reliability of quantitative data [63]. It is commonly used to measure reliability in the educational, behavioural, and social sciences [64]. Table 10 describes the reliability according to the different Cronbach’s alpha values.
Table 11 shows the Cronbach’s alpha values of each TPB variable. All TPB factors in the study are considered reliable to work on this study, as can be seen from the values in the table.
  • Attitude has high reliability.
  • Subjective norms have very high reliability.
  • Perceived behavioural control is reliable.
  • Intention has high reliability.
According to the literature review, confirmatory factor analysis and linear regression analysis are commonly used methods related to TPB topics. Since the KMO value is less than 0.6, confirmatory factor analysis is not appropriate for the study. Therefore, linear regression analysis was used in the research. Intention is the dependent variable of the model in linear regression analysis. Attitude, subjective norms, and perceived behavioural control are the predictors of the studied model. Table 12 shows a summary of the model. According to the results, 32.2% of intention is explained by attitude, subjective norms, and perceived behavioural control.
The ANOVA test is another aspect of the regression analysis. Table 13 presents the ANOVA test result of the TPB model. According to the results of the regression analysis, the cause–effect relationship is statistically significant between attitude, subjective norms, perceived behavioural control, and intention.
Table 14 describes the results of linear regression analysis. The following commentaries can be achieved:
  • The predicted path from attitude to intention has a negative influence. The attitude-to-intention path is not statistically significant (β = −0.015, p > 0.001). Therefore, attitude is not a predictor of intention. As a result, hypothesis 1 (H1) is not accepted.
  • The predicted path from subjective norms to intention has a positive influence. The subjective-norms-to-intention path is statistically significant (β = 0.438, p < 0.001). Therefore, subjective norms are predictors of intention. It increases the intention to use PT. As a result, hypothesis 2 (H2) is accepted.
  • The predicted path from perceived behavioural control to intention has a positive influence. The perceived-behavioural-control-to-intention path is statistically significant (β = 0.305, p < 0.001). Therefore, perceived behavioural control is a predictor of intention. It increases the intention to use PT. As a result, hypothesis 3 (H3) is accepted.
Table 15 summarises the decision on each hypothesis, and Figure 7 clarifies the β (regression coefficients) in the TPB model.

5. Limitations and Further Research

This study provides a meaningful understanding of the willingness of passengers to use PT in Northern Cyprus. Although the necessary results have been obtained from the study, there are also some limitations. First, the survey that was used to collect data was conducted via the online method. For this reason, those who do not have internet access cannot contribute to the survey. Secondly, the study was only conducted in Northern Cyprus. Therefore, the results of the study do not reflect the passenger intentions of the whole of Cyprus Island. Future research can work on methods to develop current PT facilities and offer solutions to encourage more people to use PT in Northern Cyprus. This will help us to create more sustainable urban areas.
The lack of funds is a major reason for the lack of development of the transportation system. The authors focused on the funding allocation model for PT development in future research. This model will be based on the number of vehicles entering and leaving the districts per day. The road usage fee between district crossings will be a financial resource for various PT projects based on predefined criteria and goals. The second step of the model will include determining traffic congestion hotspots and traffic flow. This leads to achieving the required budget for projects that improve connectivity. Improved connectivity will reduce pollution concerns and contribute economic benefits to tourism, job creation, and local businesses.

6. Conclusions and Discussion

Sustainable transportation infrastructure is critical because of its significance to most organizations, governments, and residents when cities are growing. The study aims to investigate PT usage intention in Northern Cyprus, highlighting critical problems facing this sector that are fundamentally similar to those faced by many other countries. A questionnaire survey was conducted via the online method, and 385 responses were collected to achieve this purpose. Demographic characteristics were collected initially. First of all, young people use PT more than other age groups. University students and graduates are mostly those who prefer to use PT. Generally, it is preferred for educational purposes. The highest PT usage rate has been observed in Nicosia, according to collected demographic data.
The study explored different hypotheses to determine PT usage intention in Northern Cyprus. Therefore, the authors analysed the online survey data with SPSS V27 to check the influence of attitude, subjective norms, and perceived behavioural control on intention. As a result, subjective norms and perceived behavioural control have a positive influence, while attitude has no influence on the model. Theoretically, this study supports two elements of the TPB in explaining the intention to use PT. Based on the study’s findings, the following conclusions can be drawn:
  • Attitude has been detected as non-predictor of the intention to use PT. This is an expected result because of the undeveloped PT facilities and current PT issues in Northern Cyprus. People’s intention to use PT behaviour decreases when PT issues increase and PT conditions are undeveloped. Uncomfortable travel conditions contributed to the attitude result. Ali et al. [65] said that if the major goal of a PT system is to attract a decent number of car users, it is critical to provide a reasonably good quality of service. On the other hand, Langi et al. [66] emphasised that safety, peer pressure, ease of information, physical and financial condition, and time bound are different factors that should be primarily considered in order to increase the reuse of public transport. More passengers will be encouraged to use PT with better PT facilities.
  • Subjective norms were detected as the strongest predictor of intention to use PT, with the highest β value. Therefore, most people think that participants should use PT, according to respondents.
  • Perceived behavioural control has an influence on intention, but it was found to be the weakest predictor of PT usage intention. This factor proved that the decision to use PT is under the participant’s control.
Contributing to the main policy of PT in Northern Cyprus is another vital objective of the study. This paper brought forward problems and issues accompanying Northern Cyprus. It is easy to see that most of the questionnaire participants found the PT not at a good level. The main finding emphasises that the service should be planned to meet passengers’ expectations for the quality of service for attitude to have a positive impact on PT transport utilisation. In terms of urban transportation, the government usually tries to pursue policies that are geared towards minimising the usage of cars and promoting more environmentally friendly alternatives, such as PT. An easily accessible, high-quality public transit system is essential for sustainable transportation [67]. Therefore, many people will accept a shift to PT if the PT system is improved in terms of safety, reliability, and availability with reasonable fees. It has always been the main policy goal of transportation authorities to explore ways to minimise the use of private vehicles and promote public transit. Dell’Olio et al. [68] said that increasing PT usage is possible by reducing waiting times, offering better comfort while travelling, and describing information campaigns in their research area.
As a conclusion, good-quality, satisfactory, safe, comfortable, punctual PT with affordable prices must be provided by the authorities of the country. This will also change the attitude of the local public and contribute to the sustainability of cities by encouraging more passengers because PT is not sustainable now, according to the conducted study [69].

Author Contributions

Conceptualisation, M.A. and S.I.A.A.; methodology, M.A.; software, M.A.; validation, M.A.; formal analysis, M.A.; investigation, M.A.; resources, M.A.; data curation, M.A.; writing—original draft preparation, M.A.; writing—review and editing, S.I.A.A. and H.A.M.Y.; visualisation, M.A.; supervision, S.I.A.A.; project administration, M.A. All authors have read and agreed to the published version of the manuscript.

Funding

This research received no external funding.

Institutional Review Board Statement

The study was approved by the Scientific Research Ethics Committee, Near East University Protocol Code: NEU/AS/2023/177, Date of approval: 1 February 2023.

Informed Consent Statement

Informed consent was obtained from all subjects involved in the study.

Data Availability Statement

Data available on request.

Acknowledgments

The authors are grateful to everyone who participated in the study survey.

Conflicts of Interest

The authors declare no conflict of interest.

References

  1. Karacasu, M. Eskişehir kentiçi ulaşımında trafik türlerine göre dağılımın belirlenmesi ve ulaşım sorunlarına çözüm önerileri. Süleyman Demirel Üniversitesi Fen Bilim. Enstitüsü Derg. 2019, 10, 409–412. [Google Scholar]
  2. Nasution, A.A.; Erwin, K.; Bartuska, L. Determinant study of conventional transportation and online transportation. Transp. Res. Procedia. 2020, 44, 276–282. [Google Scholar] [CrossRef]
  3. Miller, P.; de Barros, A.G.; Kattan, L.; Wirasinghe, S.C. Public transportation and sustainability: A review. KSCE J. Civ. Eng. 2016, 20, 1076–1083. [Google Scholar] [CrossRef]
  4. Belwal, R.; Belwal, S. Public transportation services in Oman: A study of public perceptions. J. Public Transp. 2010, 13, 1–21. [Google Scholar] [CrossRef]
  5. Aydın, Y.B. Toplu taşımada işletme planlaması ve optimizasyonu: Sakarya Uygulaması. Master’s Dissertation, Sakarya University, Sakarya, Turkey, 2021. [Google Scholar]
  6. Hoel, L.A.; Garber, J.N.; Sadek, A.W. Transportation Infrastructure Engineering: A Multi-Modal Integration SI Edition; Cengage Learning: Stamford, CT, USA, 2011. [Google Scholar]
  7. Hörcher, D.; Tirachini, A. A review of public transport economics. Econ. Transp. 2021, 25, 100196. [Google Scholar] [CrossRef]
  8. Shaaban, K.; Maher, A. Using the theory of planned behavior to predict the use of an upcoming public transportation service in Qatar. Case Stud. Transp. 2020, 8, 484–491. [Google Scholar] [CrossRef]
  9. Lim, J.Y.; Moon, K.K. The implications of political trust for supporting public transport. J. Soc. Policy 2022, 51, 77–95. [Google Scholar] [CrossRef]
  10. Bok, J.; Kwon, Y. Comparable measures of accessibility to public transport using the general transit feed specification. Sustainability 2016, 8, 224. [Google Scholar] [CrossRef]
  11. Saif, M.A.; Zefreh, M.M.; Torok, A. Public transport accessibility: A literature review. Period. Polytech. Transp. Eng. 2019, 47, 36–43. [Google Scholar] [CrossRef]
  12. Cheng, Y.H.; Chen, S.Y. Perceived accessibility, mobility, and connectivity of public transportation systems. Transp. Res. Part A Policy Pract. 2015, 77, 386–403. [Google Scholar] [CrossRef]
  13. Yatskiv, I.; Budilovich, E.; Gromule, V. Accessibility to riga public transport services for transit passengers. Procedia Eng. 2017, 187, 82–88. [Google Scholar] [CrossRef]
  14. Friman, M.; Lättman, K.; Olsson, L.E. Public transport quality, safety, and perceived accessibility. Sustainability 2022, 12, 3563. [Google Scholar] [CrossRef]
  15. Stjernborg, V.; Mattisson, O. The role of public transport in society—A case study of general policy documents in Sweden. Sustainability 2016, 8, 1120. [Google Scholar] [CrossRef]
  16. Beirão, G.; Cabral, J.S. Understanding attitudes towards public transport and private car: A qualitative study. Transp. Policy 2007, 14, 478–489. [Google Scholar] [CrossRef]
  17. Chwiałkowski, C.; Zydroń, A. The impact of urban public transport on residential transaction prices: A case study of Poznań, Poland. ISPRS Int. J. Geo-Inf. 2022, 11, 74. [Google Scholar] [CrossRef]
  18. Rotger, G.P.; Nielsen, T.S. Effects of job accessibility improved by public transport system: Natural experimental evidence from the Copenhagen metro. Eur. J. Transp. Infrastruct. Res. 2015, 15, 3090. [Google Scholar]
  19. Basagaña, X.; Triguero-Mas, M.; Agis, D.; Pérez, N.; Reche, C.; Alastuey, A.; Querol, X. Effect of public transport strikes on air pollution levels in Barcelona (Spain). Sci. Total Environ. 2018, 610, 1076–1082. [Google Scholar] [CrossRef]
  20. Ali, S.I.A.; Reşatoğlu, R.; Tozan, H. Evaluation and analysis of traffic flow at signalized intersections in Nicosia using of SIDRA 5 Software. J. Kejuruter. 2018, 30, 171–178. [Google Scholar] [CrossRef]
  21. Ambak, K.; Kasvar, K.K.; Daniel, B.D.; Prasetijo, J.; Abd Ghani, A.R. Behavioral intention to use public transport based on theory of planned behavior. In MATEC Web of Conferences; EDP Sciences: Ulys, France, 2016; Volume 47, p. 03008. [Google Scholar] [CrossRef]
  22. Yahia, H.A.; Safinia, S.; Al Musharfi, N.K.; Ali, S.S. Car driver attitude towards road safety measures. J. Kejuruter. 2017, 29, 57–61. [Google Scholar] [CrossRef]
  23. Wan, Z.; Wang, X.; Sperling, D. Policy and politics behind the public transportation systems of China’s medium-sized cities: Evidence from the Huizhou reform. Util. Policy. 2013, 27, 1–8. [Google Scholar] [CrossRef]
  24. Saatçioğlu, C.; Yaşarlar, Y. Kentiçi ulaşımda toplu taşımacılık sistemleri: İstanbul örneği. Kafkas Univ. J. Econ. Adm. Sci. Fac. /Kafkas Üniversitesi Iktis. Ve Idari Bilim. Fakültesi Derg. 2012, 3, 117. [Google Scholar]
  25. Deyas, G.T.; Woldeamanuel, M.G. Social and economic impacts of public transportation on adjacent communities: The case of the Addis Ababa light rail transit. Res. Transp. Econ. 2020, 84, 100970. [Google Scholar] [CrossRef]
  26. Thorhauge, M.; Haustein, S.; Cherchi, E. Accounting for the Theory of Planned Behaviour in departure time choice. Transp. Res. F Traffic Psychol. Behav. 2016, 38, 94–105. [Google Scholar] [CrossRef]
  27. Saghapour, T.; Moridpour, S.; Thompson, R.G. Public transport accessibility in metropolitan areas: A new approach incorporating population density. J. Transp. Geogr. 2016, 54, 273–285. [Google Scholar] [CrossRef]
  28. Zhang, C.; Hu, Y.; Lu, W. Evaluating the comprehensive benefit of public transport service–the perspective of three stakeholders. Promet-Traffic Transp. 2022, 34, 179–193. [Google Scholar] [CrossRef]
  29. Redman, L.; Friman, M.; Gärling, T.; Hartig, T. Quality attributes of public transport that attract car users: A research review. Transp. Policy 2013, 25, 119–127. [Google Scholar] [CrossRef]
  30. Brohi, S.; Kalwar, S.; Memon, I.A.; Ghaffar, A. Using the theory of planned behavior to identify the behavioral intention to use public transportation service: The case study of Karachi circular railway. Int. J. Emerg. Technol. 2021, 12, 317–322. [Google Scholar]
  31. Rezaimoghadam, M.R.; Davoodi, S.R.; Dabiri, N. Public Transportation User’s Behavior based on Theory of Planned Behavior. Int. J. Sustain. Trop. Des. Res. Pract. 2022, 15. [Google Scholar] [CrossRef]
  32. Borhan, M.N.; Ibrahim, A.N.H.; Miskeen, M.A.A.; Rahmat, R.A.O.; Alhodairi, A.M. Predicting car drivers’ intention to use low cost airlines for intercity travel in Libya. J. Air Transp. Manag. 2017, 65, 88–98. [Google Scholar] [CrossRef]
  33. TRNC State Planning Organization Statistics and Research Department. Statistical Yearbook 2011; TRNC State Printing Office: Nicosia, Cyprus, 2015. [Google Scholar]
  34. TRNC Prime Ministry State Planning Organization Statistics and Research Department. Statistical Yearbook 2014; TRNC State Printing Office: Nicosia, Cyprus, 2016. [Google Scholar]
  35. TRNC Prime Ministry State Planning Organization Statistics and Research Department. Statistical Yearbook 2015; TRNC State Printing Office: Nicosia, Cyprus, 2017. [Google Scholar]
  36. TRNC Prime Ministry State Planning Organization Statistics and Research Department. Statistical Yearbook 2016; TRNC State Printing Office: Nicosia, Cyprus, 2017. [Google Scholar]
  37. TRNC Prime Ministry State Planning Organization Statistics and Research Department. Statistical Yearbook 2017; TRNC State Printing Office: Nicosia, Cyprus, 2018. [Google Scholar]
  38. TRNC State Planning Organization Statistics and Research Department. Statistical Yearbook 2018; TRNC State Printing Office: Nicosia, Cyprus, 2019. [Google Scholar]
  39. TRNC State Planning Organization Statistics and Research Department. Statistical Yearbook 2020; TRNC State Printing Office: Nicosia, Cyprus, 2021. [Google Scholar]
  40. Pourmand, G.; Doshmangir, L.; Ahmadi, A.; Noori, M.; Rezaeifar, A.; Mashhadi, R.; Gordeev, V.S. An application of the theory of planned behavior to self-care in patients with hypertension. BMC Public Health 2020, 20, 1290. [Google Scholar] [CrossRef]
  41. Yakasai, A.B.M.; Jusoh, W.J.W. Testing the theory of planned behavior in determining intention to use digital coupon among university students. Procedia Econ. Financ. 2015, 31, 186–193. [Google Scholar] [CrossRef]
  42. Conner, M.; Armitage, C.J. Extending the theory of planned behavior: A review and avenues for further research. J. Appl. Soc. Psychol. 1998, 28, 1429–1464. [Google Scholar] [CrossRef]
  43. Kocagöz, E.; Dursun, Y. Algılanan davranışsal kontrol, Ajzen’in teorisinde nasıl konumlanır? Alternatif model analizleri. Karamanoğlu Mehmetbey Üniversitesi Sos. Ve Ekon. Araştırmalar Derg. 2010, 2010, 139–152. [Google Scholar]
  44. Sussman, R.; Gifford, R. Causality in the theory of planned behavior. Pers. Soc. Psychol. Bull. 2019, 45, 920–933. [Google Scholar] [CrossRef]
  45. Acar, S. E-Tüketici davranışını belirleyen etmenleri incelemeye yönelik planlı davranış teorisi (TPB) ile üniversite öğrencileri üzerinde bir araştırma. In Proceedings of the 16th International Conference on Knowledge, Economy & Management, Istanbul, Turkey, 11–13 November 2022. [Google Scholar]
  46. Ali, A.; Ambak, K. Driver Behavioral Intention to Microsleep Episode Based on Theory of Planned Behavior. Recent Trends Civ. Eng. Built Environ. 2022, 3, 1399–1408. [Google Scholar] [CrossRef]
  47. Erten, S. Planlanmış davranış teorisi ile uygulamalı öğretim metodu. Hacet. Üniversitesi Edeb. Fakültesi Derg. 2002, 19, 217–233. [Google Scholar]
  48. Ajzen, I. The theory of planned behavior: Frequently asked questions. Hum. Behav. Emerg. 2022, 2, 314–324. [Google Scholar] [CrossRef]
  49. Ajzen, I. The Ajzen theory of planned behaviour. Organ. Behav. Hum. Decis. Process. 1991, 50, 179–211. [Google Scholar] [CrossRef]
  50. Yüzüak, A.V. Fen Bilimleri Öğretmen Adaylarının Sürdürülebilir Davranışlarının Planlanmış Davranış Teorisi Temelinde Değerlendirilmesi. Doctoral Dissertation, Hacettepe University, Ankara, Türkiye, 2017. [Google Scholar]
  51. Ajzen, I. Constructing a Theory of Planned Behaviour Questionnaire. 2006. Available online: https://www.researchgate.net/publication/235913732_Constructing_a_Theory_of_Planned_Behavior_Questionnaire (accessed on 20 November 2023).
  52. Donald, I.J.; Cooper, S.R.; Conchie, S.M. An extended theory of planned behaviour model of the psychological factors affecting commuters’ transport mode use. J. Environ. Psychol. 2014, 40, 39–48. [Google Scholar] [CrossRef]
  53. Oktay, D. Cyprus: The South and the North. In Urban Issues and Urban Policies in the New EU Countries; Ashgate: Aldershot, UK, 2005; pp. 205–231. Available online: https://www.researchgate.net/publication/235798610_Cyprus_the_South_and_the_North (accessed on 20 November 2023).
  54. Northern Cyprus. 2023. Available online: https://en.wikipedia.org/wiki/Northern_Cyprus (accessed on 20 November 2023).
  55. Bakti, I.G.M.Y.; Rakhmawati, T.; Sumaedi, S.; Widianti, T.; Yarmen, M.; Astrini, N.J. Public transport users’ WOM: An integration model of the theory of planned behavior, customer satisfaction theory, and personal norm theory. Trans. Res. Procedia 2020, 48, 3365–3379. [Google Scholar] [CrossRef]
  56. Rahman, S.T.; Kabir, A. Factors influencing location choice and cluster pattern of manufacturing small and medium enterprises in cities: Evidence from Khulna City of Bangladesh. J. Glob. Entrep. Res. 2019, 9, 61. [Google Scholar] [CrossRef]
  57. Özüsağlam, E.; Atalay, A.; Toprak, S. Web Tabanlı Anket Hazırlama Sistemi; XI. Akademik Bilişim Konferansı; Harran Üniversitesi: Şanlıurfa, Türkiye, 2009. [Google Scholar]
  58. Büyüköztürk, Ş. Anket geliştirme. Türk Eğitim Bilim. Derg. 2005, 3, 133–151. [Google Scholar]
  59. Hazra, A.; Gogtay, N. Biostatistics series module 5: Determining sample size. Indian J. Dermatol. 2016, 61, 496. [Google Scholar] [CrossRef]
  60. Aydın, U. Bilimsel araştırmalarda yapısal etmenler ve evreler. İnönü Üniversitesi Uluslararası Sos. Bilim. Derg. 2012, 1, 98–112. [Google Scholar]
  61. Gadiraju, T. Investigating the Determinants of Recycling Behavior in Youth by Using Theory of Planned Behavior. Master’s Thesis, University of South Florida, Tampa, FL, USA, 2016. [Google Scholar]
  62. Shrestha, N. Factor analysis as a tool for survey analysis. Am. J. Appl. Math. Stat. 2021, 9, 4–11. [Google Scholar] [CrossRef]
  63. Cohen, L.; Manion, L.; Morrison, K. Research Methods in Education, 6th ed.; Routledge, Taylor & Francis Group: New York, NY, USA, 2007. [Google Scholar]
  64. Ravinder, E.B.; Saraswathi, D.A. Literature review of Cronbachalphacoefficient (A) and Mcdonald’s Omega coefficient (Ω). Eur. J. Mol. Clin. Med. 2020, 7, 2943–2949. [Google Scholar]
  65. Ali, N.; Nakayama, S.; Yamaguchi, H. Using the extensions of the theory of planned behavior (TPB) for behavioral intentions to use public transport (PT) in Kanazawa, Japan. Transp. Res. Interdiscip. Perspect. 2023, 17, 100742. [Google Scholar] [CrossRef]
  66. Langi, R.S.; Ramadhan, F.R.; Pelenkahu, L.V.M.; Murwani, I.A. Factors that Influence the Intention to Reuse Public Transport Routes Involving Transfer in the Early Stage of Integrated Transportation System Development: MRT Case in Jakarta. J. Soc. Sci. Res. 2020, 6, 286–292. [Google Scholar] [CrossRef]
  67. Friman, M.; Gärling, T.; Ettema, D. Improvement of public transport services for non-cycling travelers. Travel Behav. Soc. 2019, 16, 235–240. [Google Scholar] [CrossRef]
  68. Dell’Olio, L.; Ibeas, A.; Cecin, P. The quality of service desired by public transport users. Transp. Policy 2011, 18, 217–227. [Google Scholar] [CrossRef]
  69. Irtema, H.I.M.; Ismail, A.; Borhan, M.N.; Abdelsalam, H.M.; Alshetwi, A.B.Z.; Albrka, S.I.; Milad, A.; Mohashhash, B.; Alfakhri, A.Y.Y.; Das, A.M.; et al. Perceptions passengers on Service Quality: Public transport in Kuala Lumpur. Int. J. Eng. Technol. 2018, 7, 865–870. [Google Scholar] [CrossRef]
Figure 1. Number of buses from 2007 to 2020.
Sustainability 16 00804 g001
Figure 2. Number of minibuses from 2007 to 2020.
Sustainability 16 00804 g002
Figure 3. PT lines between districts of Northern Cyprus.
Sustainability 16 00804 g003
Figure 4. The basic model of TPB [48].
Sustainability 16 00804 g004
Figure 5. Research processing.
Sustainability 16 00804 g005
Figure 6. Study area [54].
Sustainability 16 00804 g006
Figure 7. TPB model for created PT usage intention.
Sustainability 16 00804 g007
Table 1. PT impact on daily life.
ReasonImpact
Economic Development
  • Industrial life development and attractivity
  • Improves the labour market
  • Offers better business conditions
Movement
  • Connects regions
  • Offers easier daily life
  • Polycentric urban areas
  • Culture and health
  • Commuting for school and work
Sustainability and Environment
  • Less impact on the environment
Accessibility
  • Provides accessibility for people
Other Factors
  • Improved quality of life
  • Integration/segregation
Table 2. Sustainability effect of PT.
FactorSustainability Effect
Environment
  • Reduce energy usage of passengers
  • Reduce climate change contribution of passengers
  • Reduce land, water, and air pollution
Economic
  • Lower user cost
  • Improve economic efficiency
Social
  • Increase affordability
  • Improve accessibility
  • Minimise health impacts
  • Minimise safety impacts
Table 3. Likert scale of the TPB model.
Likert DescriptionLikert Scale
Strongly disagree1
Disagree2
Neither agree nor disagree3
Agree4
Strongly agree5
Table 4. Demographic characteristics.
Itemn (Sample)Percentage %
Gender
Male18347.53
Female20252.47
Age
18–29 years26067.53
30–39 years6516.88
40–49 years4210.91
50–59 years92.34
60 years and above92.34
Educational level
Primary school20.52
Secondary school41.04
High school15540.26
University graduate16242.08
Post-graduate/PhD6216.1%
Place of residence
Nicosia28273.25
Famagusta328.57
Kyrenia338.31
Morphou318.05
Trikomo31.04
Lefka40.78
Occupation
Private sector10828.05
Government256.49
Self-employed266.75
Student21555.85
Unemployed112.86
Purpose of public transport usage
Work285.49
Daily routine11622.75
Education18235.69
Entertainment448.63
None of them14027.45
Frequency of using public transport per week
1–5 times8923.12
6–10 times6817.66
11 times and more6817.66
Never use16041.56
Table 5. Attitude.
Table 5. Attitude.
ItemnMeanStandard Deviation
I think travelling by public transport is not good.3852.501.352
I think travelling by public transport is unsafe.3852.711.346
I think travelling by public transport is uncomfortable.3853.511.447
I think travelling by public transport is a waste of time.3853.211.482
I think the public transport level is unsatisfactory.3854.011.368
I think I will travel while standing and cramped in public buses.3854.221.180
I think I will travel with old-fashioned public transport vehicles.3853.581.536
I think there is a possibility of a breakdown of engines while travelling. 3853.521.371
I think bus drivers do not obey the speed limit and drive carelessly.3853.281.375
I think public transport services are not punctual.3853.791.306
I think there are long time intervals between bus services.3854.131.162
I think there is a failure to pay attention to hygiene rules in services.3854.131.182
I think bus tickets are expensive.3854.161.212
I think there is a lack of public transport card membership.3853.501.360
I think there is no electronic payment system for tickets.3853.651.385
I think there is a failure to provide information about bus stops.3854.111.224
I think there is a long distance between bus stops and places to go.3854.211.135
Table 6. Subjective norm.
Subjective NormsnMeanStandard Deviation
My friends think that I should use PT.3852.721.371
My family thinks that I should use PT.3852.831.445
Most people think that I should use PT.3852.781.419
Table 7. Perceived behavioural control.
Perceived Behavioural ControlnMeanStandard Deviation
The decision to use PT is under my control.3854.021.247
An improved PT network increases PT usage.3854.241.036
Travelling with PT will decrease private-car dependency.3853.981.347
Table 8. Intention.
Table 8. Intention.
IntentionnMeanStandard Deviation
For sure I will try to use PT services when they are available.3853.951.226
I would try to use PT if there is PT service to my destination.3853.921.203
If my friends travel with PT, I will use PT.3853.811.270
Table 9. KMO and Bartlett’s tests.
KaiserMeyerOlkin Measure of Sampling Adequacy0.533
Approx. Chi-Square182.028
df6
Sig.<0.001
Table 10. Cronbach’s alpha guideline [63].
ValueReliability
>0.90Very Highly Reliable
0.80–0.90Highly Reliable
0.70–0.79Reliable
0.60–0.69Marginally/Minimally Reliable
<0.60Unacceptably Low Reliability
Table 11. Cronbach’s alpha.
FactorCronbach’s Alpha
Attitude0.834
Subjective Norms0.928
Perceived Behavioural Control0.717
Intention0.843
Table 12. Model summary.
R2Significance
0.322<0.001
Table 13. ANOVA test.
FSignificance
60.319<0.001
Table 14. Linear regression analysis coefficients.
βtSignificance
Attitude−0.015−0.3450.730
Subjective Norms0.43810.221<0.001
Perceived Behavioural Control0.3056.934<0.001
Table 15. Decisions of hypotheses.
HypothesisDecision
H1Attitude may have a positive influence on the intention to use PT.Not Supported
H2Subjective norms may have a positive influence on the intention to use PT.Supported
H3Perceived behavioural control may have a positive influence on the intention to use PT.Supported
Disclaimer/Publisher’s Note: The statements, opinions and data contained in all publications are solely those of the individual author(s) and contributor(s) and not of MDPI and/or the editor(s). MDPI and/or the editor(s) disclaim responsibility for any injury to people or property resulting from any ideas, methods, instructions or products referred to in the content.

