Article

Explorative Study into Alkali-Activated Repair Mortars Using Blast Furnace Slag and Glass Waste

1
Magnel-Vandepitte Laboratory, Department of Structural Engineering and Building Materials, Ghent University, Tchnologiepark 60, Zwijnaarde, 9052 Ghent, Belgium
2
Chair of Sustainable Construction, Department of Civil, Environmental and Geomatic Engineering, ETH Zurich, Stefano-Franscini Platz 5, 8093 Zürich, Switzerland
3
Owens Corning, 767 Quai des Allobroges, 73000 Chambéry, France
*
Author to whom correspondence should be addressed.
Sustainability 2024, 16(2), 764; https://doi.org/10.3390/su16020764
Submission received: 8 December 2023 / Revised: 3 January 2024 / Accepted: 5 January 2024 / Published: 16 January 2024
(This article belongs to the Special Issue Sustainable Mineral-Based Materials in Construction)

Abstract

:
The repair of concrete structures is increasing in prevalence. Conventional repair mortars are expensive materials rich in Portland cement (PC) and other organic and inorganic components that question their economic efficiency and carbon footprint. Alkali-activated materials (AAMs) are an eco-friendly alternative to PC that possess properties desirable for repair mortars. The article presents the mix design, mechanical, bond, and shrinkage properties of alkali-activated binary mortars intended for structural concrete repair. Mix optimisation based on mechanical properties of repair mortar and utilisation of glass waste (GW) is presented together with total and restrained shrinkage, pull-off bond tests, and life cycle assessment (LCA) for selected configurations. Results demonstrate good compressive and flexural strength, exceeding 45 N/mm2 and 7 N/mm2, an excellent pull-off bond strength (1.8–2.3 N/mm2) of the alkali-activated mortar to the concrete substrate, in spite of extensive shrinkage, with an order of magnitude of a couple of thousands of microstrains, which is also reported. Shrinkage appears to increase with the increase of the applied GW in the mixture. LCA revealed that alkali-activated mortars have up to 54% lower CO2 eq. emissions compared to PC-based repair mortar.

1. Introduction

The development and usage of concrete as a building material exploded over the last century, changing the landscapes of the planet. Most of today’s infrastructure is made of concrete and designed with a life span of 50 to 100 years. Many of these structures reach the end of service life in a condition suitable for repair or upgrading. Furthermore, structures can experience deterioration due to various environmental attacks, accidental events, lack of maintenance, and other actions, which result in the need for repair during their service life. For this reason, investments in rehabilitation and repair are important for the built environment and play a large part in contemporary construction activities and budgets. The purpose of the repair material is to withstand different harsh conditions after the application, for which a series of tests is presented, indicated in Table 2 of standard EN 1504-3 [1]. Different commercially available repair mortars are already on the market, but new materials are still emerging [2]. The most important parameters when selecting repair mortar are its compatibility with the substrate in terms of adhesive bond strength, shrinkage, water permeability, way of application, and durability of the material.
AAMs are emerging as a future-proof technology in the palette of more eco-friendly concrete production technologies, as they combine the utilisation of industrial by-products and omission of PC, maximizing the environmental benefits of structures [3]. They consist of alumino-silicate materials, called precursors, like slags from metal production (among which blast furnace slag (BFS)), fly ash (FA), or metakaolin (MK) that are activated with high pH solutions like sodium hydroxide, sodium silicate, potassium hydroxide, potassium silicate, carbonates, sulphates, or their mixtures. Since precursors are by-products of different industrial processes, they have lower environmental impacts compared to primary products like cement. Activators’ content usually is in the range of 3 to 10 weight percentage (wt.%) of precursors, but they can contribute up to one-third of the total CO2 emissions of AAM mixes [4]. Overall, CO2 emissions of AAM mortar are 20 to 60% lower than PC mortar [3,5]. In some parts of the world, AAM concrete has been utilised in the last century due to shortages of limestone as the primary raw material for the production of PC, and in the Western world, it has been extensively researched over the last 20 years as an eco-friendly alternative to PC [6]. AAMs, depending on the type of precursors and activators, often have fast setting time, rapid strength development, good bond with PC concrete substrate, and good acid and fire resistance, which makes them also attractive as repair mortars and grouts [2,6]. This, combined with environmental benefits, justifies the recent increase in the development of AAMs for concrete repair [7].
Glass is an inert, durable, and versatile material that neither biodegrades nor burns in combustion, which leads to great amounts of waste. Even though part of GW is reused or recycled, a big portion of it ends up in landfills. In 2018, the quantity of glass waste generated in the European Union was around 16.5 million tons [8] of GW, of which about 12 million tons is recycled [9]. Numbers in the rest of the world are more disappointing [10,11]. Depending on the use, glass has different colour and additives, which can significantly influence its chemical composition. However, the main constituent of glass is amorphous silica, which makes glass waste potentially suitable as a precursor as well as an activator in AAMs [10]. Furthermore, interesting utilisation of GW can be (partial) replacement of aggregates as it utilises more waste glass per cubic meter of concrete and has been investigated in both PC [11,12,13] and AAM concrete mixes [14,15]. Studies of using GW in alkali-activated materials are limited [10,13,14,16,17,18,19,20,21,22,23,24,25,26] and mostly focused on the physical and microstructural properties of alkali-activated material, while studies in view of strengthening and repair are rare [26].
Balaguer Pascual et al. [18] investigated milled glass bottle waste blended with MK and activated with NaOH solution to produce alkali-activated mortars, which reached 28 days of strength of about 30 N/mm2. Radden and Neithalath [25] investigated industrial GW activated with NaOH solution alone and blended with FA, MK, and BFS. They cured GW and FA specimens at elevated temperatures to produce materials with 20–30 N/mm2 strength. These mixes appeared limited in durability properties. They also moist-cured ternary blends of GW, MK, and BFS with a max of 50% of GW, which showed lower strength but slightly better durability properties than GW and FA mixes. Wang et al. [16] studied alkali-activated binary blends of waste liquid-crystal display (LCD) glass and BFS with a maximum of 20 wt.% of GW and reported an increase in flow and both initial and final setting time with the increase of GW. They also reported an increase in 7 and a slight increase in 28-day strength, the latter being around 50 MPa. In the other study, Wang et al. [27] tested various engineering properties of AAM with max 40% LCD waste glass and found out that for the liquid-to-solid ratio of 0.6 and 20% GW replacement, GW actually increases the workability and compressive strength of the BFS mortars. Zhang et al. [14] replaced different amounts of FA with GW from the glass bottle recycling process in AAMs made of BFS and FA activated with NaOH solution and found that GW is better involved in the activation process by having better silica and Ca dissolution rate. Also, in a ternary blend with 30% GW, 20% FA, and 50% BFS, they reported a 35% increase in 28-day compressive strength. In another study, Zhang et al. [15] explored utilization of the coloured soda lime crushed glass from recycling as both precursor and aggregate replacement in BFS AAM and explored shrinkage reduction and fire resistance of those mortars. They concluded that it is feasible to use high amounts of recycled glass in alkali-activated mortars, and the total content of recycled glass can be over 70% by mass of the mortar. Tashima et al. [21] activated a proprietary pozzolanic material produced from waste glass [28] with NaOH and KOH solutions and reached 77 MPa when cured at 65 °C for 3 days. KOH-activated mortars gave slightly lower compressive strengths for lower concentrations of alkali solution and 2% higher total porosity than NaOH-activated mortars.
Existing studies already looked into GW replacement. These studies are done on paste and mortar levels, having alkali-activated concrete development in focus, and do not specifically address repair mortar applications. All these studies are helpful for the process of creating an alkali-activated repair mortar (AARM). However, specific tests should be performed in order to evaluate the appropriateness of the alkali-activated mortar as a repair mortar. The mortar matrix in concrete is, depending on the application, generally designed for long open time; certain compressive strength based on structural needs; limited shrinkage and creep; good durability properties (e.g., low carbonation, chemical resistance); and proper bond to reinforcement [6]. In the specific case of repair mortar, the focus is typically to have a short setting time and rapid strength development so it can accept loads shortly after the application; to have high compressive and especially flexural tensile strength; to be designed for thin applications, sometimes even for a couple of millimetres; to have a good bond with the old concrete substrate; to have low shrinkage to avoid restrained shrinkage cracking; and to have good specific durability properties to withstand attacks that contributed to the deteriorations of the original concrete [7].
The purpose of this research is to develop alkali-activated repair mortar based on GW and BFS starting from a configuration with 100% BFS [29] and to check its potential for usage as a concrete repair mortar in structural applications. The AARM targeting classes R3 and R4 according to EN 1504-3 and PTV 563 [1,30]. The initial focus lies on workability and strength (looking at both compressive and flexural tensile strength). Subsequently, attention shifts to total shrinkage, restrained shrinkage, pull-off bond behaviour, and LCA of selected mixes. Other properties important for the development of the repair mortar, such as adhesion in shear, thermal conductivity, creep, carbonation, fire resistance, modulus of elasticity, and Poisson’s ratio, are not part of this study.
By using by-product (BFS) and waste (GW) in the development of the repair mortar, this research potentially contributes to lowering the amount of waste deposited in the land and, by omitting Portland cement, improves the global warming potential of the repair mortar material. These points, together with the fact that the mortar’s intended purpose is structural repair, all contribute to the sustainability.

2. Materials and Methods

2.1. Precursor Materials, Mortar Compositions and Specimen Preparation

Precursors in this study are locally available: ground granulated BFS (type ECOCEM) and GW (supplied by Owens Corning, Chambéry, France). GW is obtained by milling residue from the manufacturing of glass fibre filaments. Sand (supplied by Sibelco) used in this research is quartz sand dmax = 1 mm. The densities of GW and BFS are 2650 and 2890 kg/m3, respectively. The d50 is 8.2 μm and 43.5 μm for BFS and GW, respectively. The chemical composition is given in Table 1, obtained with X-ray Fluorescence (XRF), and is in line with previous studies [9,14]. The most abundant oxides in GW are Si and Ca, followed by Al and Mg. Scanning electron microscope (SEM) images of GW and BFS are given in Figure 1. It can be seen that both GW and BFS have particles with irregular shapes, where GW particles are somewhat larger than BFS. It is also visible that GW contains fibres almost half a millimetre long. Figure 2 shows X-ray diffraction (XRD) of solid precursors. Both BFS and GW are amorphous materials, showing hump at 25–30° with no observed crystalline phases.
The alkali-activators are sodium silicate supplied by PQ (SiO2 = 30 wt.%, Na2O = 15 wt.%, with molar ratio (MR) of silicate solution 2), sodium hydroxide supplied by Brenntag (purity of ≥98%) and potassium hydroxide supplied by Brenntag (purity of ≥85%). The activator solution is prepared at least 24 h before mixing mortar.
Mortar is mixed in 2 L mixer. Dry components, BFS, GW, and sand, are mixed for 3 min before adding the activator. After adding the activator, the mixing procedure from EN 196-1 [31] was followed. Immediately after the liquid and solid were brought into contact, the mixer was set to a lower speed (140 rotations per minute (rpm)) and mixed for 60 s, then increased speed to 285 rpm and continue the mixing for an additional 30 s then stop the mixer for 90 s. After that, the mixing was continued at a high speed for 60 s, after which slump and flow were checked, and the mortar was poured into moulds. Most of the specimens in this study are prisms 40 × 40 × 160 mm3, except for the restrained shrinkage/bond strength where the mortar is applied on a concrete substrate.
Specimens for testing restrained shrinkage/bond strength of repair mortars are prepared and carried out according to EN 1542 [32]. Selected mix configurations were applied to a concrete substrate type MC (40) according to EN 1766 [33]. The 300 × 300 × 100 mm3 substrates were at least three months old. They were grit blasted to the roughness of 0.45 mm (using the ‘sand patch method’), which qualifies the roughness as sandblasted according to PTV 563 [30]. After sandblasting, the substrates were thoroughly cleaned, and every batch passed quality control in terms of compressive and tensile pull-off strength [30]. Wooden guidance strips were glued to the concrete substrate to ensure the thickness of the overlay of 15 mm. The surface was prewetted 30 min before the application (yet with no free water at the surface), and the mortar was hand-applied. At the end, specimens were covered with a plastic sheet. After 24 h, the wooden strips were removed, and specimens were sealed with a plastic sheet for 6 more days, after which they were stored under laboratory conditions: (21 ± 2) °C and R.H. 60 ± 5%.
As a starting point, a reference mortar mix with 100% BFS is considered 1G0. It has a silicate solution of MR = 1 (combination of commercial sodium silicate and sodium hydroxide), and wt.% of Na2O is 5.9% per weight of precursor, liquid-to-solid ratio of 0.5, and aggregate to precursor ratio of 2.18 [29]. Different AARM configurations have been explored, looking into the amount of GW (0, 25, 50, 75, 100). Firstly, the MR (1 or 1.5) has been achieved by combining sodium silicate with sodium hydroxide. Secondly, this was extended with different activator types, combining sodium silicate with potassium hydroxide. This resulted in a total of twelve mixes, as indicated in Table 2.
The mix optimisation has been done in two steps; the first step is the basic screening of mechanical and workability properties, with a total of 10 mixes (Table 2). In the second step, two mixes are selected and further optimised (which resulted in additional two mixes) and verified in terms of workability, mechanical properties, shrinkage, and pull-off adhesive bond properties (Table 2). Where available, the experimental results are compared with the results of the commercial repair material from the published datasheets.

2.2. Test Methods

The workability (slump, flow, and, for selected configurations, flow retention) of the fresh mortar mixtures was evaluated with the flow table test according to EN 13395-1 [34]. The slump corresponds to the diameter of the mortar mass after removing the mould. The flow refers to the slump diameter after an additional 15 shocks of the flow table. The flow retention is the flow test repeated after, in this case, every ten minutes after the initial flow test. Note that initial slump and flow refer to about 5 min after the activator is added to the mix.
Compressive and flexural strength of the hardened mortars were determined after 1, 7, and 28 days in accordance with EN 12190 [35] and EN 1015-11 [36], respectively. Three specimens were tested directly after demoulding and 24 h after casting. Others were stored under standard laboratory conditions (21 ± 2) °C and (60 ± 5)% RH, and (for the first ten configurations) 6 more were wrapped up in a plastic foil and were stored in plastic bags under sealed conditions at 21 ± 2 °C.
For restrained shrinkage/pull-off specimens, 21 days after AARM application, 5 cylindric cuts were drilled in every specimen up to 15 mm in the substrate, and steel dollies were glued with epoxy. 28 days after the AARM application, every specimen was subjected to a tensile pull-off test according to EN 1542 [32].
Free shrinkage of the mortars was measured at 1, 3, 7,14, 28, and 56 days after demoulding (2 days after AARM application) of the samples of 40 × 40 × 160 mm3 with a digital deformeter (type Demec) with a gauge length of 100 mm, according to EN 12617-4 [37]. During the measurement, specimens are stored under laboratory conditions (21 ± 2) °C and (60 ± 5)% RH.

2.3. Life Cycle Assessment

LCA is performed following ISO 14040 [38] and ISO 14044 [39]. As a functional unit, 1kg of AARM is defined, and within the system boundaries, the production and transportation of mix constituents to the AARM production facility, modules A1 and A2 of EN 15804 [40], respectively, are analysed. The transportation of mix constituents is assumed to be made by truck, and the average distances are based on [4], while for GW a distance of 860 km has been estimated (Table 3). The Ecoinvent database v.3.9.1 [41] was used to identify global warming potential (GWP100) using CML [42] impact assessment method (Table 4). In this study, only emissions attributable to pre-treatment processes of BFS and GW were quantified, and no allocation between primary products and by-products has been applied as emissions are assumed to be fully allocated to the primary product (cut-off approach). According to the glass waste supplier, electricity consumption for the initial grinding of glass fibres is 11 kWh per ton of waste. The subsequent milling process is assumed to consume 124 kWh per ton of waste, following the glass wool milling practices [43]. Finally, the environmental impacts of AARMs were compared to a proprietary cement repair mortar (type MAXREST) [44], described in an environmental product declaration (EPD) [45]. It has to be noted that in the current study, the focus is on the A1 and A2 stages, as the manufacturing of the repair mortar (A3), specifically energy consumption for mixing of mix constituents, is assumed to be similar across the mixes, while packaging, often reported within A3 of EPDs, has not been examined within the current study.

3. Results and Discussion

3.1. Mixtures Activated with Sodium Silicate and Sodium Hydroxide

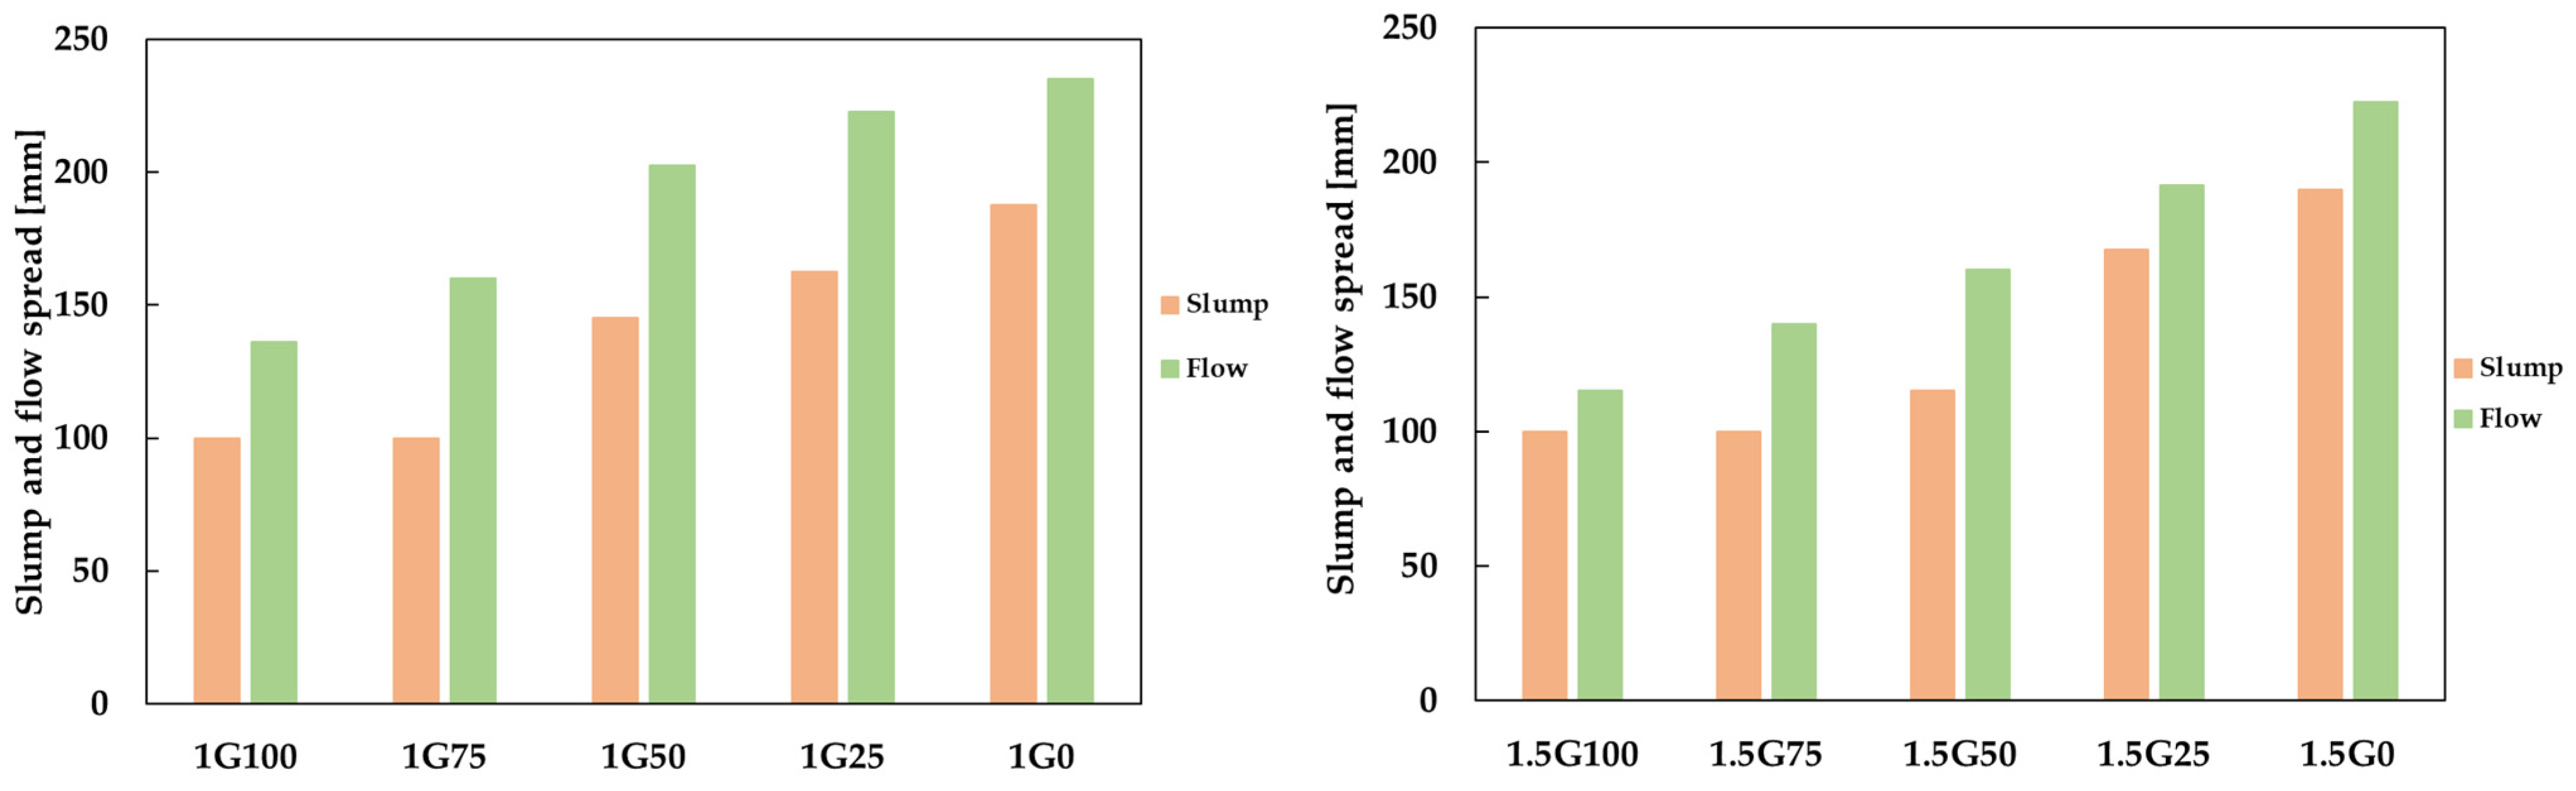
3.1.1. Slump and Flow Properties

Slump and flow spread as a function of MR and glass content are given in Figure 3. This is significant due to the specific fibrous shape of the GW particles (Figure 1) and to understand the workability from these two tests (to have more indications on the mortar’s ability to hold shape once placed versus fresh mortar flowability before application). For higher replacement rates of 75 and 100% of GW, there was no movement of the mortar after lifting the slump mould. With the increase in GW content, there is a clear reduction in the flowability of mixtures. Slump and flow increased by 87% and 72%, respectively, when GW content decreased from 100% to 0% for MR of 1 (from 1G100 to 1G0). For MR = 1.5, the difference in slump and flow equals 90% and 94%, respectively, when GW content decreased from 100% to 0%. These results are in contrast with other studies [15,16] and might be related to the more fibrous shape of the GW particles in this study (Figure 1).
In terms of MR, it can be noted that with an increase of molar ratio from 1 to 1.5, slump values remain mostly constant, while flow decreases from 5% for the configuration with no GW to 26% for the configurations with 50% GW. For the case of hand-applied, trowel grade repair mortar that this study aims for, interesting configurations are the ones with lower slump [44], yet with the biggest difference between slump and flow, as observed for 1G75, 1G50, 1.5G75, and 1.5G50.

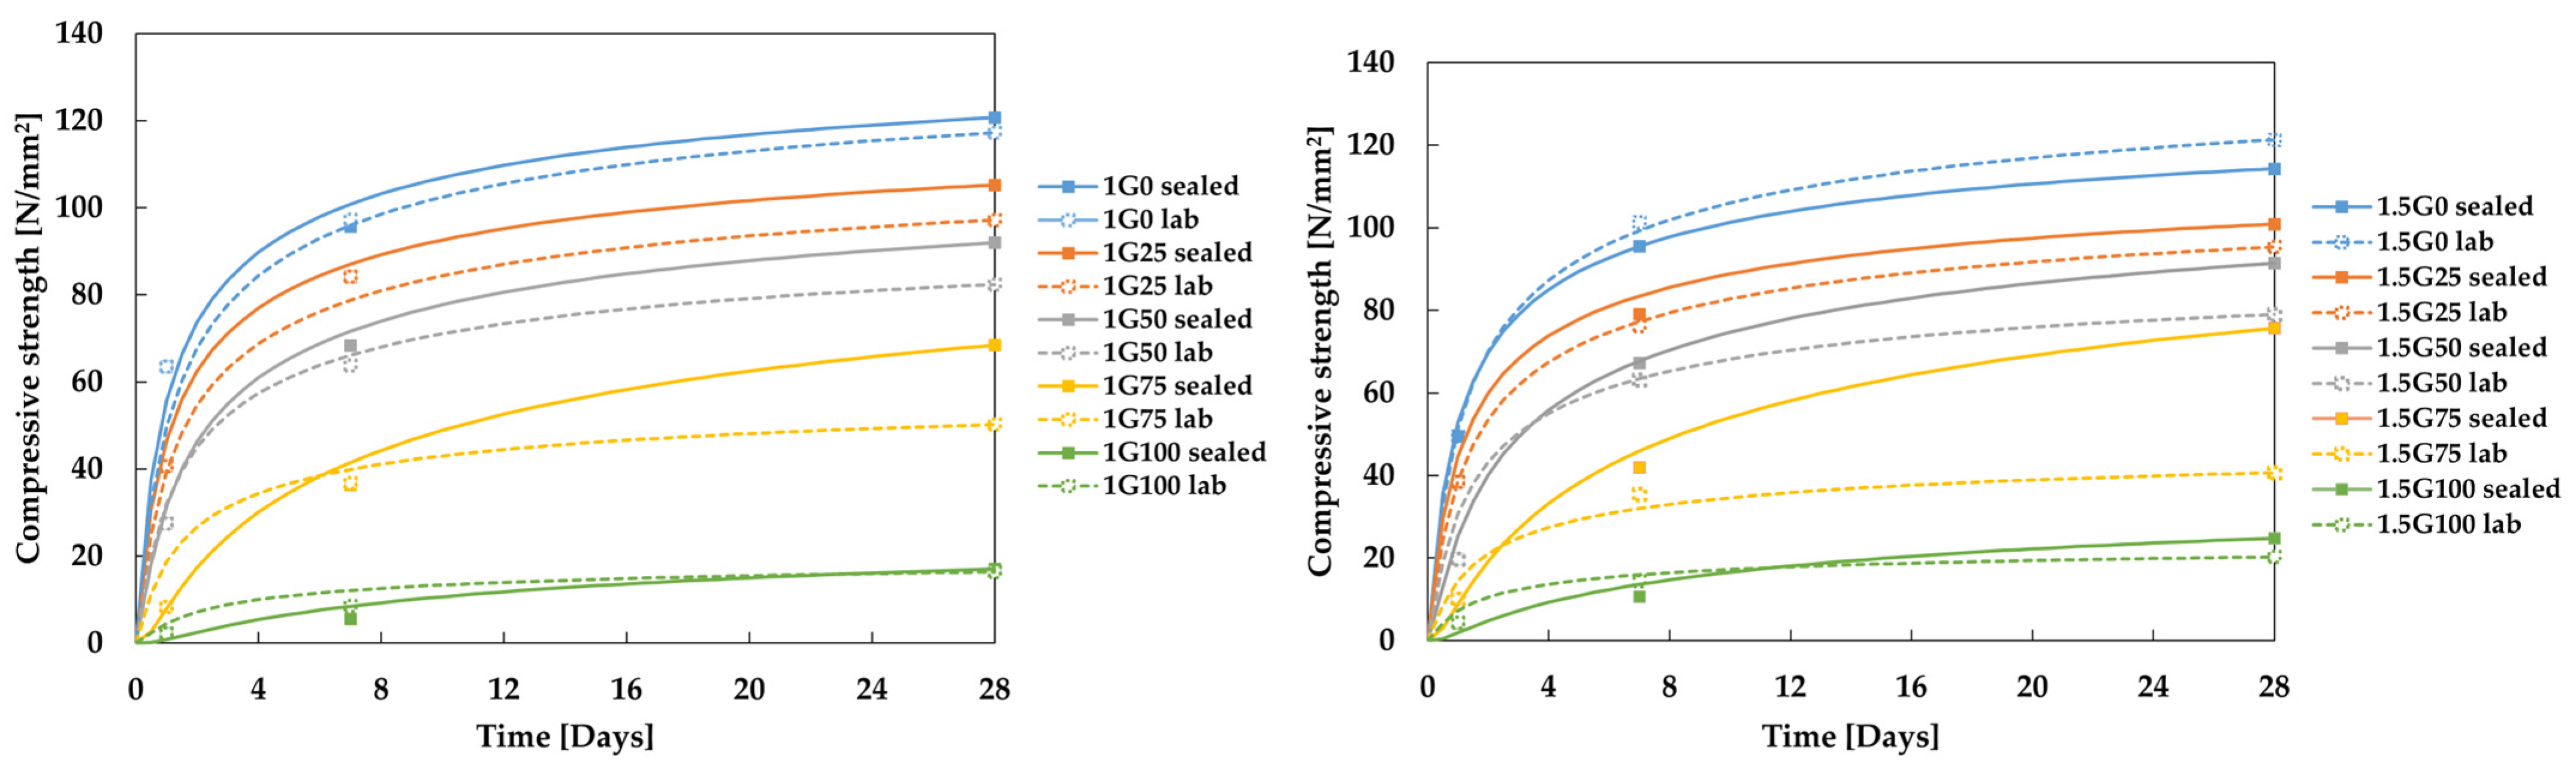
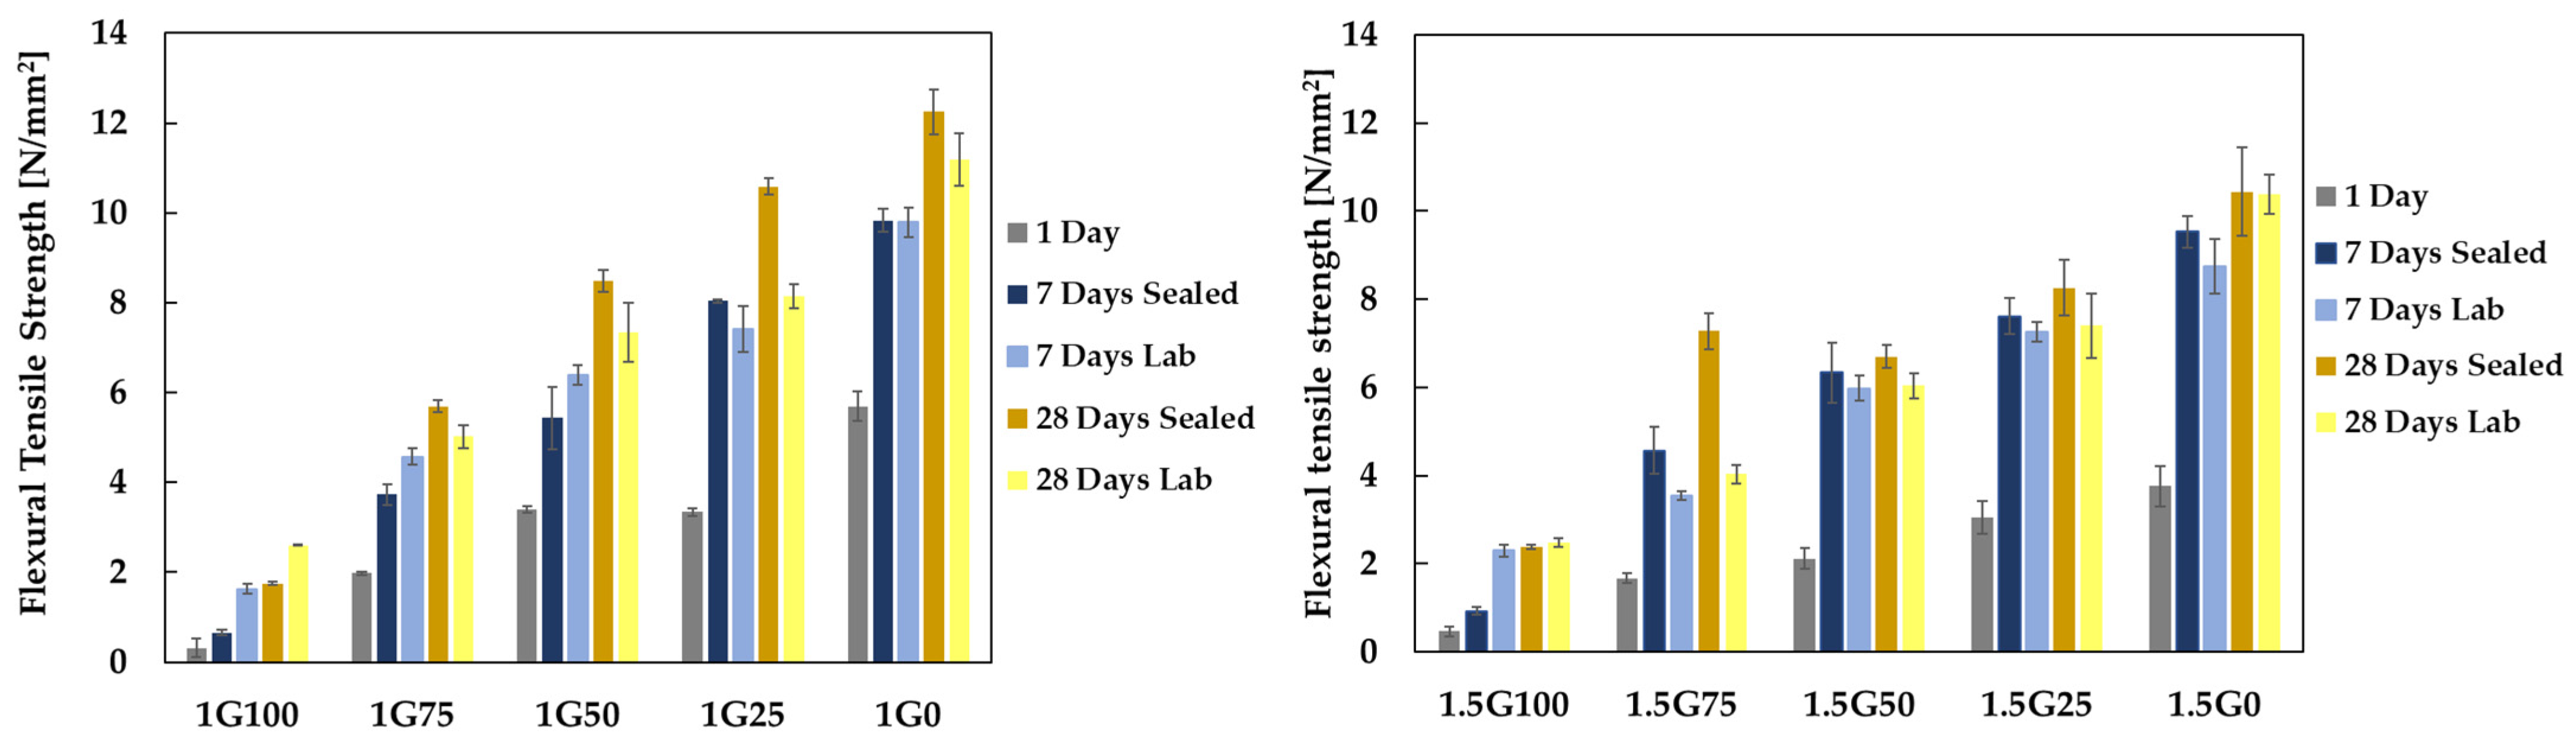
3.1.2. Compressive and Flexural Tensile Strength

Compressive strengths of mortars with different MR and GW content for different ages and different curing regimes are presented in Figure 4. The compressive strength varies from about 2 N/mm2 (for the configuration 1G100) to about 63.5 N/mm2 (1G0) at one day, from about 5.6 (1G100) to 95.7 N/mm2 (1G0) at 7 days sealed conditions, from 8.6 (1G100) to 101.3 N/mm2 (1.5G0) for 7 days laboratory conditions, from 17 (1G100) to 120.7 N/mm2 (1G0) at 28 days for sealed conditions, and from 16.4 (1G100) to 121.3 N/mm2 (1.5G0) at 28 days for laboratory conditions. It is worth mentioning that when sealed, all configurations that contain BFS have compressive strength higher than 45 N/mm2 at 28 days, which qualifies them for class R3 or R4 repair materials according to EN 1504-3 [1].
For configurations with MR = 1, the difference between compressive strength of sealed and lab-cured specimens at 28 days is the smallest for 0 and 100% GW content, 2.8 and 4.1%, respectively, and the biggest for GW content of 75–26.5%. For MR = 1.5, the smallest difference between sealed and lab-cured specimens at the age of 28 days is for GW content of 0–5.7%, and the biggest is for GW content of 75% and 46.7%. When glass content is 100%, for MR = 1 and MR = 1.5, compressive strengths at the age of 28 days are 17 and 24 N/mm2, respectively. Leaching is observed on the surface of the lab-cured specimens when GW content is 100%, which indicates that the amount of activator is too high and that these strengths (16.4 and 20.3 N/mm2 for MR = 1 and MR = 1.5, respectively) could be achieved with less activator. In comparison with other studies of alkali-activated mortars with GW [14,15,16,18,24,27], compressive strength results of this study are superior for almost all levels of replacement, as visible in Figure 5.
Only for both MR = 1 and MR = 1.5 and 100% GW mixes, the compressive strength of all specimens is in the range from about 17 to 24 N/mm2, which is less than in the study of Balaguer Pascal et al. [18]. They activated recycled bottle waste glass with d50 = 13 μm, with NaOH (12 wt.% Na2O per weight of precursor) and had compressive strengths above 30 N/mm2 for 100% GW content. They introduced small doses of metakaolin (up to 8%) in order to introduce Al, which, contrary to expectations, reduced compressive strength. Zhang et al. [15] also created a 100% GW mix by activating soda lime glass with d50 of 38 μm with sodium silicate solution MR = 1.5 and wt.% Na2O per weight of precursor of 5% and reached a compressive strength of about 21 N/mm2. Even though their mix is similar to both mixes in this study, most of their configurations had compressive strengths 30% lower than our MR = 1 and MR = 1.5 mixes (Figure 5). This difference might come from the difference in BFS in these two studies. In another study, Zhang et al. [14] used GW from a bottle recycling process with d50 = 5.07 μm to replace FA in a binary mix of BFS and FA activated with NaOH solution and had a clear trend of increase in compressive strength, which is in line with their observation that this waste glass is actually more reactive than FA. When replacing low-reactive types of FA with high-reactive types of GW, it is possible to obtain mixes with higher strength since FA is, in that case, less reactive than GW. When replacing BFS in the mix, as it is done in this study and elsewhere [15], there is a decrease in strength since BFS is typically more reactive than GW.
Wang et al. [16], and Wang et al. [27] also demonstrated a small increase in compressive strength for levels of replacement of max 20%. They created many different configurations and had quite similar results, suggesting that neither the MR ratio nor the content of alkaline metal oxide of the silicate solution can be the governing factors for compressive strength development. From all of this, it is evident that, in most cases, the compressive strength reduces with the increase of GW. The exceptions are blends of precursors containing FA, where FA is replaced by GW (which appears slightly more reactive than the FA). The compressive strength also depends on d50, the MR ratio of the silicate solution, and wt.% of alkaline metal oxide per weight of the precursor. By means of the compressive strength, testing the repair mortar strength class, when applying GW, can be established, whereby a high-end strength class is targeted compared to earlier work (Figure 5).
The compressive strength of the mortars develops mostly during the first 28 days when the main hydration reactions take place (Figure 6). The compressive strength development of PC concrete (based on fc at 28 days) can be estimated using Equations (1) and (2) from Eurocode 2 [46].
f c ( t ) = β c c ( t ) f c
β c c t = e x p   ( s ( 1 ( 28 t ) 0.5 )
where f c t is the mean compressive strength at an age of t days (N/mm2), f c is the mean compressive strength at the age of 28 days (N/mm2), β c c t is a coefficient that depends on the age of concrete, t is the age of concrete in days and s is a coefficient that depends on the class of cement (lower value indicates faster strength development).
In this study, the available compressive strength development data has been validated against the strength development relationship from Eurocode 2 [46] with s value determined by fitting the Equation (1) to each strength development over time.
The results are shown in Figure 6, where solid lines represent sealed specimens, and dashed lines represent laboratory-cured specimens. For sealed configurations and high GW content (75%, 100%), the s-value is in the range 0.5–0.7, which is roughly double the value indicated for PC mixtures (0.2–0.38) and stipulates that strength develops slowly. Also, R2 (the coefficient of determination) values for these mixes are lower than for the other configurations, indicating lower predictive accuracy in the model for these specific mixtures with lower reactivity (Table 5). Sealed configurations with a higher percent of BFS (50% and less of GW) have s-values in the range of 0.18–0.3, which is more in line with what is given in EC2 for PC mixtures and indicates faster strength development. When cured in lab conditions, the s-value is, in general, more in line with PC values and is in the range of 0.2–0.3. Note that the comparison with PC mixes should be considered with care since, in EC2, it is given for concrete mixtures while these studies are at mortar level.
When it comes to the flexural tensile strength, in general, higher values with similar differences between sealed and lab specimens are achieved for MR = 1 compared to MR = 1.5 (Figure 7). Configurations with more than 50% GW have flexural tensile strength lower than 7 MPa, which means that they do not qualify for class R3 repair mortar [30]. The configuration with MR 1 and GW content of 50% has a flexural strength of about 8 N/mm2 when sealed and above 7 N/mm2 when lab cured, which qualifies this configuration for class R3 class of repair material according to PTV 563 [30] and when sealed even for class R4.
Though configurations with GW content of 25% have higher flexural tensile and compressive strengths for both MR 1 and MR 1.5, in order to maximize waste content, the configuration with MR 1 and GW content of 50% was chosen for further optimization. Configuration 1.5G50 was also further investigated for comparison reasons. By means of the flexural tensile testing, the repair mortar strength class can be further established. A high value of the flexural tensile strength is required [30], and tensile capacity has been rarely reported before for precursor replacement of BFS with GW (though in the study [10], the influence of the flexural tensile strength is reported for different levels of replacement of the sand with glass waste cullet). Combinedly looking to compressive and flexural tensile strength is required in reference to PTV 563 [30] strength classes, but further allows a better understanding of the dependency between compressive and tensile strength for these adapted mix designs, compared to Portland cement-based mix designs.
The relationship between compressive and flexural strength of PC mixtures is usually expressed by Equation (3) in different codes and investigations [46,47,48]. Recently, Ghorbani et al. [49] published this relationship for binary blends (BFS + copper slag and BFS + stainless steel slag) of alkali-activated mortars.
f c t , f l = k ( f c ) n
where f c t ,   f l is flexural tensile strength (N/mm2), f c is compressive strength (N/mm2), k and n are coefficients proposed in different sources as presented in Figure 8 left and Equations (4) from EC2 [46], (5) from ACI 318-19 [47] and (6) from Ghorbani et al. [49]
EC   2 :   f c t , f l = 0.3 ( f c ) 2 / 3
ACI   318 - 19 :   f c t , f l = 0.62 ( f c ) 0.5
Ghorbani   et   al . :   f c t , f l = 0.22 ( f c ) 0.8
Proposed   equation :   f c t , f l = 0.19 ( f c ) 0.832
From Figure 8 (left), it is visible that the results obtained in this research, although in the same order of magnitude with EC 2 [46] (R2 = 0.941) and ACI 318-19 [47] (R2 = 0.923) for PC based materials, are in better agreement with the dependency proposed by Ghorbani et al. [49] (R2 = 0.949) for binary slag AAM, which suggests a somewhat steeper relationship. This signalizes potentially somewhat higher tensile strength for AAMs, especially for higher strengths of mortar. This is also observed in different studies and might be due to a better bond between the inorganic matrix and the aggregates in AAM mortars [49]. In Figure 8 (right) and Equation (7), the dependency of the flexural tensile on compressive strength obtained in this research is presented (R2 = 0.951) and aligns well with what Ghorbani et al. [49] observed in their binary blends of mortar, suggesting that the governing factor for strength is the common main precursor in both studies—BFS. Noteworthy is the fact that the relationships given in codes are for concrete, and the relationship in this research is at a mortar level.

3.2. Optimisation of the Mix Design

3.2.1. Flow and Flow Retention, Compressive and Flexural Strength of Mixes Comprising KOH versus NaOH

As mentioned before, in order to use AAM mortar as a repair material, it has to conform with EN 1504-3 [1] standards in a plethora of different criteria. In this study, the focus is on the short-term mechanical behaviour and mix optimization is concentrated on the following requirements: slump, flow, and flow retention, as well as compressive and flexural strength, total shrinkage, restrained shrinkage, pull-off bond strength, and LCA. These variables are chosen as they represent one of the criteria for a material to be considered as a repair mortar. Mix 1G50 with a slump of 145, flow of 205 mm, compressive strength of 91.4 N/mm2, and flexural strength of 7.33 N/mm2 is chosen for further optimization. Firstly, to increase flow retention, NaOH is replaced with KOH. Due to the significantly higher molar mass of potassium cations, mortars activated with potassium hydroxide are usually more flowable than mortars activated with NaOH [50]. Sodium silicate has been kept as a source of silica cations to keep the mortar more affordable (in comparison to potassium silicate) and to minimize the strength loss [24]. Afterwards, the GW content is reduced to 40% in order to further minimize strength loss and increase the flow of the mixture. The flow retention test is important to evaluate open time and workability loss of the repair mortar, and to the best of the authors’ knowledge, it has not been reported so far for binary blends of BFS and GW.
When it comes to flow and flow retention (Figure 9), combination 1G50 has a flow of 205 mm, which is higher than 1.5G50, and flow retention is much lower for 1.5G50 than for 1G50. When switched to KOH, slump decreases and flow increases, to 127.5 mm, and 207.5 mm, respectively. Mixes with KOH are still workable after 30 min in comparison with 1.5G50, which becomes stiff after 30 min (Figure 9), and mix 1G50, which still has a certain flow but is noticeably stiffer than mixes with KOH. The mix with lower GW content, 1G40 KOH, has a slump of 110 mm and a flow of 205 mm with flow retention comparable to 1G50 KOH, as shown in Figure 9. This is most favourable for trowel grade mortar, which this study aims for.
Compressive strength at 28 days of age is about 19 and 14 N/mm2 lower for configurations 1G50 KOH and 1G40 KOH, respectively, compared to 1G50 NaOH (91.4 N/mm2) (Figure 10). Flexural strength for the configuration (1G40KOH) is 7.17 N/mm2, which is still in the range of the class R3 of repair materials [30]. In comparison to the commercial repair mortar, the achieved compressive strength is 70–90% higher than what is reported for commercial repair mortar, while flexural tensile strength is in the range of commercial (Figure 10).

3.2.2. Shrinkage of the Selected Mixes

The total shrinkage of the 4 selected mixes is presented in Figure 11. In view of the development of a repair mortar with GW in the binder system, it is important to understand if the GW applied in this study can benefit shrinkage behaviour. The highest shrinkage, in configuration 1.5G50 (NaOH), was about 6500 microstrains, which is about 7–10 times higher than regular, shrinkage compensated repair mortars, which is in order of magnitude of about 500 microstrains [51], and about 50% higher than what is reported for BFS based alkali-activated mortars [50,52,53]. Lowering the MR ratio of the silicate solution from 1.5 to 1 marginally decreases shrinkage by about 10%, which is five times lower than what Kumarappa [52], ref. [54] reported for BFS-based mixtures. Switching from NaOH to KOH has no apparent effect as the shrinkage of both 1G50 and 1G50KOH are the same, around 6000 microstrains, in contrast to what Omur et al. [50] reported for BFS-based mixtures. They reported that for every investigated concentration, for all molarities, and all sand contents, NaOH-activated mixes show lower shrinkage than their KOH counterparts. Reducing glass waste to 40% caused a strong decrease in shrinkage, about 35%. Similar trends were reported by Zhao and Li [55]. The reason for this might be in the decrease of mesopores (due to denser gel formation), which decreases capillary pressure when losing water [56].

3.2.3. Restrained Shrinkage and Pull-Off Bond Strength of Mixes Comprising KOH versus NaOH

As repair mortar is typically bonded against an aged concrete substrate, restrained shrinkage between the two materials will occur, which can compromise bond strength or initiate shrinkage cracks. For this reason, repair mortars with low shrinkage are preferred. In commercial PC repair, mortar shrinkage compensating agents are often applied, and their shrinkage is much lower, as shown in Figure 11. In this study, restrained shrinkage is investigated for the binary BFS-GW AARM without the use of shrinkage reducing agent (SRA). These tests are important for the development of the repair mortar to assess the risk for restrained shrinkage cracking and the need for SRA. Restrained shrinkage was evaluated based on the visual inspection of the pull-off bond specimens, presented in Figure 12 and Figure 13, and in terms of pull-off bond strength (Table 6). All restrained shrinkage specimens cracked in the first 48 h after mortar application. The number of cracks increased in the first 7 days, after which they stabilised. This is in line with the study of Rezende et al. [57] and the fact that most of the shrinkage happens in the first 7 days, as visible in Figure 11. The average crack width in all specimens extended 0.1 mm at 48 h after demoulding and was not monitored further.
Even though specimens have comparable crack distribution, there were some differences in the bond strength of the specimens. The highest bond capacity was exhibited by the mix 1G50, as noted in Table 6. The restrained shrinkage effects, being governed by the observed shrinkage cracking and without any observation of debonding, indicate a strong bond, which is in contrast with [2,58] where poor bond of BFS-based mixes with the concrete substrate was observed. Indeed, all specimens in this study failed mainly in the mortar. This indicates that, despite the extensive shrinkage cracks, pull-off bond strength is superior to the tensile strength of the mortar. The specimens with KOH had slightly lower bond strength, which is in line with compressive and flexural strength observations in Figure 10. The configuration showing the lowest bond strength was 1KOH40, which also has the lowest shrinkage. The failure aspect of all configurations is in the mortar layer close to the interface. This is in line with the fact that the substrate’s tensile strength is 3.68 N/mm2 and somewhat higher than the bond strength. The obtained results of proper bond, yet whereby the surface cracking is generally not acceptable, leads to the conclusion that for all these BFS-GW binary AARM systems, the use of shrinkage reducers and shrinkage cracking mitigation agents should be considered (e.g., short fibres and/or different shrinkage reduction/compensation admixtures) subject to future research.

3.2.4. LCA of KOH Compared to NaOH Mixes

The GWP of examined mixes is presented in Figure 14. The lowest GWP of 87 g CO2 eq. per kg of mortar is observed for 1G50 AARM. Results indicate that 1G50 with NaOH has 19% lower GWP compared to 1G50 KOH mix, while the difference between 1.5G50 NaOH and 1G50 NaOH is 3%, and between 1G40 KOH and 1G50 KOH is 2%. Production of activators contributes 5–9% to the GWP of NaOH mixes and 28–30% for KOH mixes, while their transportation has <1% contribution to the total GWP. Transportation of glass waste contributes nearly 25% to the total GWP, while pre-treatment of waste itself has a relatively small contribution of <8%. Further optimization of supply chains can reduce emissions associated with the transportation of waste [59].
According to published EPD [45], 1 kg of the cement-based repair mortar (CEM-RM) [44] is associated with 186 g of CO2 eq., where production of mix constituents (A1) is associated with 169 g and their transportation to mortar manufacturing site (A2) with 17 g CO2 eq. AARMs developed within this study have between 42–54% lower GWP compared to CEM-RM. This analysis is important as it highlights the sustainability of the repair mortars in terms of carbon footprint.

4. Conclusions

This article presents a step-by-step mix design and optimisation of alkali-activated mortar based on blast furnace slag (BFS) and glass waste (GW) in view of its application as a repair mortar. Within the indicated scope of the research, the following conclusions can be made:
  • It is possible to replace BFS with glass waste in alkali-activated repair mortars with limited effects on compressive and flexural strength, a positive impact on workability (increased thixotropy), and workability retention, but with a negative effect on (already high) total shrinkage.
  • The compressive and flexural tensile strength decreased with the increase of the GW content for both MRs and both curing regiments. Configurations with 100% GW content reached a compressive strength of 17 and 24.5 N/mm2 for 1G100 and 1.5G100, respectively, at the age of 28 days, when sealed, and 16.35 and 20.3 N/mm2, respectively, when cured under lab conditions. The compressive strength of all the other sealed specimens exceeded 45 N/mm2, which qualifies them for the R4 class of repair mortar, and almost all (other than 1G100 and 1.5G100) configurations have reached that value when cured under lab conditions.
  • The compressive strength development of lab-cured specimens fits well with what is indicated in EC2 for PC mixes. When sealed and with a high content of GW, they have very slow strength development. This is shown by a relatively high s-value in the range of 0.5 to 0.7, while mixes with high BFS content have an s-value in the range of 0.18 to 0.19, which indicates fast strength development.
  • The relationship between flexural tensile and compressive strength of investigated mixtures is similar to what is observed in the other binary blends of AAM mortars and in the same range, although somewhat steeper than what is observed in PC mixes, and indicated in EC 2.
  • Replacing NaOH with KOH leads to a decrease in slump of about 15% and an increase in flow, and flow retention of about 30%, with almost no effect on the total shrinkage and an acceptable (up to 20%) reduction of compressive and flexural tensile strength.
  • Pull-off strength decreases with the increase of molar ratio and further decreases when KOH replaces NaOH in the mixture. However, it stays above 1.7 N/mm2, which qualifies these mortars for at least class R3 according to EN 1504-3 [1]. Pull-off strength is also lower than the substrate’s tensile strength.
  • LCA revealed that AARMs have up to 54% lower CO2 eq. emissions compared to PC-based repair mortar. Furthermore, NAOH mixes have 19% lower GWP compared to KOH-based mixes. Production of activators contributes up to 30% to the environmental impacts of AARMs. By localising mortar production and by using locally available waste streams, it is possible to reduce emissions of transportation and hence the total impacts of AARMs even further.
In short, the substitution of BFS with GW in AARM demonstrated limitations in preserving the overall balance of the desired mechanical properties. This research suggests a maximum replacement of 40%, although this recommendation may be significantly influenced by the specific type of GW utilized. It is further recommended that for alkali-activated repair mortars (AARM), the use of shrinkage compensating agents is also explored. Lowering the MR of the silicate solution might be another successful strategy for shrinkage reduction of binary blends, as demonstrated for BFS-based mixtures [60,61]. Another important parameter for the future study is the analysis of the ductility and strains at the failure of the mortar configurations as well as their elastic modulus and Poisson’s ratio.

Author Contributions

Conceptualization, I.K. and S.M.; methodology, I.K. and A.K.; software, A.K.; validation, I.K.; formal analysis, I.K.; investigation, I.K.; resources, I.K., B.B., G.T. and L.B.; data curation, I.K., A.K. and S.M.; writing—original draft preparation, I.K. and A.K.; writing—review and editing, S.M., B.B., G.T. and L.B.; visualization, I.K., A.K. and S.M.; supervision, B.B. and S.M.; project administration, S.M.; funding acquisition, S.M. All authors have read and agreed to the published version of the manuscript.

Funding

This project has received funding from the European Union’s Horizon 2020 research and innovation programme under grant agreement No 813596 DuRSAAM.

Institutional Review Board Statement

Not applicable.

Informed Consent Statement

Not applicable.

Data Availability Statement

Data available upon request.

Acknowledgments

The authors wish to express their gratitude towards Sibelco and Owens Corning for providing materials used in this research. Acknowledgements to Dragan Rajnović from The University of Novi Sad for SEM images of the glass waste.

Conflicts of Interest

The authors declare no conflicts of interest.

Abbreviations

The following abbreviations are used in this manuscript.
AAMAlkali-Activated Material
AARMAlkali-Activated Repair Mortar
BFSBlast Furnace Slag
DEGermany
EC2Eurocode 2
EURO6European emission standard for vehicles
FAFly Ash
GWGlass Waste
ISOInternational Standard Organization
LCALife Cycle Assessment
LCDLiquid-Crystal Display
MKMetakaolin
MRMolar Ratio
PCPortland Cement
pHPotential of Hydrogen
REREurope
ROWRest of World
rpmRotations per Minute
SEMScanning Electron Microscope
SRAShrinkage Reducing Agent
Uunit
wt.%Weight Percentage
XRDX-ray Diffraction
XRFX-ray Fluorescence

References

  1. NBN EN 1504-3; Products and Systems for the Protection and Repair of Concrete Structures—Definitions, Requirements, Quality Control and Evaluation of Conformity—Part 3: Structural and Non-Structural Repair. Bureau of Normalization: Brussels, Belgium, 2006.
  2. Kramar, S.; Šajna, A.; Ducman, V. Assessment of alkali activated mortars based on different precursors with regard to their suitability for concrete repair. Constr. Build. Mater. 2016, 124, 937–944. [Google Scholar] [CrossRef]
  3. Habert, G.; Ouellet-Plamondon, C. Recent update on the environmental impact of geopolymers. RILEM Tech. Lett. 2016, 1, 17–23. [Google Scholar] [CrossRef]
  4. Komkova, A.; Habert, G. Environmental impact assessment of alkali-activated materials: Examining impacts of variability in constituent production processes and transportation. Constr. Build. Mater. 2023, 363, 129032. [Google Scholar] [CrossRef]
  5. Ouellet-Plamondon, C.; Habert, G. Life Cycle Assessment (LCA) of Alkali-Activated Cements and Concretes; Woodhead Publishing Limited: Sawston, UK, 2014. [Google Scholar] [CrossRef]
  6. Provis, J.L.; van Deventer, J.S.J. Alkali Activated Materials; Springer: Berlin/Heidelberg, Germany, 2014; Volume 13. [Google Scholar] [CrossRef]
  7. Huseien, G.F.; Mirza, J.; Ismail, M.; Ghoshal, S.; Hussein, A.A. Geopolymer mortars as sustainable repair material: A comprehensive review. Renew. Sustain. Energy Rev. 2017, 80, 54–74. [Google Scholar] [CrossRef]
  8. Eurostat. Statistics. 2022. Available online: https://ec.europa.eu/eurostat/databrowser/bookmark/5ca48143-37c6-45e5-8ffb-2e6a336bb2ee?lang=en (accessed on 15 August 2022).
  9. The European Container Glass Federation. Available online: https://feve.org/glass_recycling_stats_2018/ (accessed on 16 August 2022).
  10. Liu, Y.; Shi, C.; Zhang, Z.; Li, N. An overview on the reuse of waste glasses in alkali-activated materials. Resour. Conserv. Recycl. 2019, 144, 297–309. [Google Scholar] [CrossRef]
  11. Tucker, E.L.; Ferraro, C.C.; Laux, S.J.; Townsend, T.G. Economic and life cycle assessment of recycling municipal glass as a pozzolan in portland cement concrete production. Resour. Conserv. Recycl. 2018, 129, 240–247. [Google Scholar] [CrossRef]
  12. Jani, Y.; Hogland, W. Waste glass in the production of cement and concrete—A review. J. Environ. Chem. Eng. 2014, 2, 1767–1775. [Google Scholar] [CrossRef]
  13. Shi, C.; Zheng, K. A review on the use of waste glasses in the production of cement and concrete. Resour. Conserv. Recycl. 2007, 52, 234–247. [Google Scholar] [CrossRef]
  14. Zhang, S.; Keulen, A.; Arbi, K.; Ye, G. Waste glass as partial mineral precursor in alkali-activated slag/fly ash system. Cem. Concr. Res. 2017, 102, 29–40. [Google Scholar] [CrossRef]
  15. Zhang, B.; He, P.; Poon, C.S. Optimizing the use of recycled glass materials in alkali activated cement (AAC) based mortars. J. Clean. Prod. 2020, 255, 120228. [Google Scholar] [CrossRef]
  16. Wang, W.-C.; Chen, B.-T.; Wang, H.-Y.; Chou, H.-C. A study of the engineering properties of alkali-activated waste glass material (AAWGM). Constr. Build. Mater. 2016, 112, 962–969. [Google Scholar] [CrossRef]
  17. Luhar, S.; Luhar, I. Valorisation of Waste Glasses for the Development of Geopolymer Mortar—Properties and Applications: An Appraisal. J. Compos. Sci. 2022, 6, 30. [Google Scholar] [CrossRef]
  18. Pascual, A.B.; Tognonovi, M.T.; Tagnit-Hamou, A. Waste glass powder-based alkali-activated mortar. Int. J. Res. Eng. Technol. 2014, 3, 32–36. [Google Scholar] [CrossRef]
  19. Wang, H.-Y.; Huang, W.-L. Durability of self-consolidating concrete using waste LCD glass. Constr. Build. Mater. 2010, 24, 1008–1013. [Google Scholar] [CrossRef]
  20. Torres-Carrasco, M.; Puertas, F. Waste glass in the geopolymer preparation. Mechanical and microstructural characterisation. J. Clean. Prod. 2015, 90, 397–408. [Google Scholar] [CrossRef]
  21. Tashima, M.M.; Soriano, L.; Borrachero, M.V.; Monzó, J.; Cheeseman, C.R.; Payá, J. Alkali activation of vitreous calcium aluminosilicate derived from glass fiber waste. J. Sustain. Cem.-Based Mater. 2012, 1, 83–93. [Google Scholar] [CrossRef]
  22. Zhang, S. Waste Glass as Partial Binder Precursor and Fine Aggregate Replacement in Alkali Activated Slag/Fly ash System. Master’s Thesis, TU Delft, Delft, The Netherlands, 2015. [Google Scholar]
  23. Puertas, F.; Torres-Carrasco, M.; Alonso, M.M. Reuse of Urban and Industrial Waste Glass as a Novel Activator for Alkali-Activated Slag Cement Pastes: A Case Study; Woodhead Publishing Limited: Sawston, UK, 2014. [Google Scholar] [CrossRef]
  24. Zhang, Y.; Xiao, R.; Jiang, X.; Li, W.; Zhu, X.; Huang, B. Effect of particle size and curing temperature on mechanical and microstructural properties of waste glass-slag-based and waste glass-fly ash-based geopolymers. J. Clean. Prod. 2020, 273, 122970. [Google Scholar] [CrossRef]
  25. Redden, R.; Neithalath, N. Microstructure, strength, and moisture stability of alkali activated glass powder-based binders. Cem. Concr. Compos. 2014, 45, 46–56. [Google Scholar] [CrossRef]
  26. Yoo, D.-Y.; Lee, S.K.; You, I.; Oh, T.; Lee, Y.; Zi, G. Development of strain-hardening geopolymer mortar based on liquid-crystal display (LCD) glass and blast furnace slag. Constr. Build. Mater. 2022, 331, 127334. [Google Scholar] [CrossRef]
  27. Wang, C.-C.; Wang, H.-Y.; Chen, B.-T.; Peng, Y.-C. Study on the engineering properties and prediction models of an alkali-activated mortar material containing recycled waste glass. Constr. Build. Mater. 2017, 132, 130–141. [Google Scholar] [CrossRef]
  28. Hemmings, R.T.; Nelson, R.D.; Graves, P.L.; Cornelius, B.J. White Pozzolan Composition and Blended Cements Containing Same. US Patent Office Patent No. 6776838, 7 December 2023. [Google Scholar]
  29. Krajnović, I.; Matthys, S. Influence of Curing Conditions on Alkali-Activated Mortars Intended for Concrete Repair. In Proceedings of the 4th International Rilem Conference on Microstructure Related Durability of Cementitious Composites: Microdurability, Delft, The Netherlands, 29 April–25 May 2021; Ye, G., Dong, H., Liu, J., Schlangen, E., Miao, C., Eds.; Delft University of Technology-Southeast University: Delft, The Netherlands, 2021; pp. 859–867. Available online: https://repository.tudelft.nl/islandora/object/uuid:4cc622a6-e31c-4b5b-8d23-ce30138b6bfb?collection=research (accessed on 8 August 2022).
  30. Belgian Construction Certification Association. PTV 563: Technische Voorschriften voor Herstelmortels voor Beton. pp. 1–59, 2007. Available online: https://www.bcca.be/download/B413DBAD-C5FE-4E1A-96DE-94431C0E497E (accessed on 7 December 2023).
  31. NBN EN 196-1; Methods of testing cement—Part 1: Determination of strength. European Committee for Standardization: Brussels, Belgium, 2016.
  32. NBN EN 1542; Products and systems for the protection and repair of concrete structures—Test methods—Measurement of bond strength by pull-off. European Committee for Standardization: Brussels, Belgium, 2003.
  33. NBN EN 1766; Products and systems for the protection and repair of concrete structures—Test methods—Reference concretes for testing. Bureau of Normalization: Brussels, Belgium, 2000.
  34. NBN EN 13395-1; Products and systems for the protection and repair of concrete structures—Test methods—Determination of workability—Part 1: Test for flow of thixotropic mortars. Bureau of Normalization: Brussels, Belgium, 2002.
  35. NBN EN 12190; Products and systems for the protection and repair of concrete structures—Test methods—Determination of compressive strength of repair mortar. Bureau of Normalization: Brussels, Belgium, 1998.
  36. NBN EN 1015-11; Methods of test for mortar for masonry—Part 11: Determination of flexural and compressive strength of hardened mortar. Bureau of Normalization: Brussels, Belgium, 2019.
  37. NBN EN 12617-4; Products and systems for the protection and repair of concrete structures—Test methods—Part 4: Determination of shrinkage and expansion. Bureau of Normalization: Brussels, Belgium, 2002.
  38. ISO 14040; Environmental Management—Life Cycle Assessment—Principles and Framework. International Organization for Standardization: Brussels, Belgium, 2006.
  39. ISO 14044; Environmental Management—Life Cycle Assessment—Re-quirements and Guidelines; 2018. International Organization for Standardization: Brussels, Belgium, 2018.
  40. NBN EN 15804; 2012+ A2: Sustainability of Construction Works—Environmental Product Declarations—Core Rules for the Product Category of Construction Products. Bureau of Normalization: Brussels, Belgium, 2019.
  41. Muller, S.; Lesage, P.; Ciroth, A.; Mutel, C.; Weidema, B.P.; Samson, R. The application of the pedigree approach to the distributions foreseen in ecoinvent v3. Int. J. Life Cycle Assess. 2014, 21, 1327–1337. [Google Scholar] [CrossRef]
  42. Leiden University CML-IA Characterisation Factors—Leiden University. Available online: https://www.universiteitleiden.nl/en/research/research-output/science/cml-ia-characterisation-factors (accessed on 4 December 2022).
  43. Kohvakka, T. Förnamn Efternamn Glass wool as geopolymer raw material Milling process waste with Mil-Tek IC60 screw mill. Bachelor’s Thesis, Materials Processing Technology, Helsinki, Finland, 2020. [Google Scholar]
  44. Technical Data Sheet MAXREST. Available online: https://www.drizoro.com/ingles/documentos/Fichas/maxrest.pdf (accessed on 20 December 2022).
  45. Environmental Product Declaration to Cement Repair Mortar. Available online: https://api.environdec.com/api/v1/EPDLibrary/Files/f53ae826-d94e-4138-a94c-08da599e304a/Data (accessed on 20 December 2022).
  46. NBN EN 1992-1-1/A1; Eurocode 2: Design of Concrete Structures—Part 1-1: General Rules and Rules for Buildings. Bureau of Normalization: Brussels, Belgium, 2015.
  47. American Concrete Institute. ACI 318-19: Building Code Requirements for Structural Concrete and Commentary; American Concrete Institute: Farmington Hills, MI, USA, 2019. [Google Scholar]
  48. Ahmed, M.; El Hadi, K.M.; Hasan, M.A.; Mallick, J.; Ahmed, A. Evaluating the co-relationship between concrete flexural tensile strength and compressive strength. Int. J. Struct. Eng. 2014, 5, 115. [Google Scholar] [CrossRef]
  49. Ghorbani, S.; Sun, Y.; Mohan, M.K.; Matthys, S. Effect of copper and stainless steel slags on fresh, mechanical and pore structure properties of alkali activated ground granulated blast furnace slag. Case Stud. Constr. Mater. 2023, 18, e01981. [Google Scholar] [CrossRef]
  50. Omur, T.; Kabay, N.; Miyan, N.; Özkan, H.; Özkan, Ç. The effect of alkaline activators and sand ratio on the physico-mechanical properties of blast furnace slag based mortars. J. Build. Eng. 2022, 58, 104998. [Google Scholar] [CrossRef]
  51. Sika Monotop 412—Eco. Available online: https://che.sika.com/de/construction/bauwerksschutz-und-sanierung/betonreparatur/reprofiliermoertel/sika-monotop-412eco.html (accessed on 21 April 2022).
  52. Kumarappa, D.B. Quantification of drying shrinkage in alkali activated slag mortars and validating the efficiency of various shrinkage mitigation methods. In Proceedings of the Transportation Research Board 96th Annual MeetingAt: TRB 96th Annual Meeting Compendium of Papers, Washington, DC, USA, 8–12 January 2017; pp. 1–13. [Google Scholar]
  53. Živica, V. Effects of type and dosage of alkaline activator and temperature on the properties of alkali-activated slag mixtures. Constr. Build. Mater. 2007, 21, 1463–1469. [Google Scholar] [CrossRef]
  54. Kumarappa, D.B.; Peethamparan, S.; Ngami, M. Autogenous shrinkage of alkali activated slag mortars: Basic mechanisms and mitigation methods. Cem. Concr. Res. 2018, 109, 1–9. [Google Scholar] [CrossRef]
  55. Zhao, J.; Li, S. Performance study and environmental evaluation of alkali-activated materials based on waste photovoltaic glass. J. Clean. Prod. 2022, 379, 134576. [Google Scholar] [CrossRef]
  56. He, J.; Bai, W.; Zheng, W.; He, J.; Sang, G. Influence of hydrated lime on mechanical and shrinkage properties of alkali-activated slag cement. Constr. Build. Mater. 2021, 289, 123201. [Google Scholar] [CrossRef]
  57. Rezende Schuab, M.; dos Santos, W.J.; Borges, P.H.R. On the development of MK/BFS alkali-activated materials as repair mortars: Performance under free and restrained shrinkage tests. Constr. Build. Mater. 2021, 275, 122109. [Google Scholar] [CrossRef]
  58. Ducman, V.; Kramar, S.; Šajna, A. Alkali activated repair mortars based on different precursors. In Eco-Efficient Repair and Rehabilitation of Concrete Infrastructures; Woodhead Publishing: Sawston, UK, 2018. [Google Scholar] [CrossRef]
  59. Komkova, A.; Habert, G. Optimal supply chain networks for waste materials used in alkali-activated concrete fostering circular economy. Resour. Conserv. Recycl. 2023, 193, 106949. [Google Scholar] [CrossRef]
  60. Aydin, S.; Baradan, B. Effect of activator type and content on properties of alkali-activated slag mortars. Compos. Part B Eng. 2014, 57, 166–172. [Google Scholar] [CrossRef]
  61. Aydin, S.; Baradan, B. Engineering Properties of Reactive Powder Concrete without Portland Cement. ACI Mater. J. 2013, 110, 619–627. [Google Scholar] [CrossRef]
Figure 1. Scanning electron microscope images of glass waste (left and middle) and BFS (right).
Sustainability 16 00764 g001
Figure 2. X-ray diffraction patterns of solid precursors: BFS and GW.
Sustainability 16 00764 g002
Figure 3. Slump and flow spread after 15 shocks; values for different molar ratios and different levels of replacement (left) MR = 1, (right) MR = 1.5.
Sustainability 16 00764 g003
Figure 4. Compressive strengths of NaOH specimens for different ages, different storage conditions, and different MR, (left) MR = 1, (right) MR = 1.5.
Sustainability 16 00764 g004
Figure 5. Compressive strengths of alkali-activated mortars made with waste glass; this study MR = 1 and MR = 1.5, and other recently published studies are also divided by MR. [14,15,16,18,27].
Sustainability 16 00764 g005
Figure 6. Compressive strength development according to EC2 [46] of NaOH mixes for MR = 1 (left) and MR = 1.5 (right).
Sustainability 16 00764 g006
Figure 7. Flexural tensile strengths of NaOH specimens for different ages, different storage conditions, and different MR, (left) MR = 1, (right) MR = 1.5.
Sustainability 16 00764 g007
Figure 8. Flexural tensile strength vs. compressive strength relationship (left) existing formulations [46,47,49] and (right) proposed equation.
Sustainability 16 00764 g008
Figure 9. Flow and flow retention values of NaOH and KOH mixes were selected for optimization.
Sustainability 16 00764 g009
Figure 10. Compressive (left) and flexural (right) strengths of NaOH and KOH mixes selected for optimization compared to the commercial mix [44].
Sustainability 16 00764 g010
Figure 11. Total shrinkage of NaOH and KOH mixes selected for optimization compared to shrinkage compensated commercial configuration [51].
Sustainability 16 00764 g011
Figure 12. Observed restrained shrinkage of the NaOH mixes at 21 days.
Sustainability 16 00764 g012
Figure 13. Observed restrained shrinkage of the KOH at 21 days.
Sustainability 16 00764 g013
Figure 14. GWP of mixes selected for optimization compared to commercial PC mortar mix per 1 kg of mortar.
Sustainability 16 00764 g014
Table 1. Chemical composition of precursors by XRF.
Oxide (wt.%)CaOSiO2Al2O3SO3Fe2O3MgO
BFS40.931.113.72.30.49.2
GW24.458.613.3n.d.0.32.4
Table 2. Mix proportions of the different mortar configurations.
DesignationBFSGWWaterHydroxideSodium SilicateSand 0–1
[g][g][g][g][g][g]
Combination of sodium silicate and sodium hydroxide
1G1000598160.723.31151302
1G75150.2450.7161.523.4115.51308.4
1G50301.9301.9161.523.5116.11314.8
1G25455.1151161.523.5116.11314.8
1G0609.80163.923.8117.21327.8
1.5G1000607.2115.412.4175.81322.1
1.5G75152.5457.6115.912.4176.71328.6
1.5G50306.6306.6115.912.5177.61335.3
1.5G25459.9153.3115.912.5177.61335.5
1.5G0619.40117.712.6179.41348.7
Combination of sodium silicate and potassium hydroxide
1G50KOH301301168.531.494.11312.4
1G40KOH378252180.633.6100.81373.4
Table 3. Transportation distances to AARM production site.
MaterialDistance (km)Source
BFS106Komkova and Habert (2023) [4]
GW860Estimate
Water0Komkova and Habert (2023) [4]
NaOH95Komkova and Habert (2023) [4]
KOH95Komkova and Habert (2023) [4]
Sodium silicate112Komkova and Habert (2023) [4]
Sand50Komkova and Habert (2023) [4]
Table 4. Environmental impacts per unit process.
UnitGWP
(kg CO2 eq.)
Source
Ground granulated blast furnace slag {RoW} | production | Cut-off, Ukg9.7 × 10−2Ecoinvent v3.9.1 [41]
Glass waste kg2.55 × 10−2Estimate
Tap water {RER} | market group for | Cut-off, Ukg3.07 × 10−4Ecoinvent v3.9.1 [41]
Sodium hydroxide, chlor-alkali electrolysis, membrane cell {RER} | production | Cut-off, Ukg7.33 × 10−1Ecoinvent v3.9.1 [41]
Sodium hydroxide, chlor-alkali electrolysis, diaphragm cell {RER} | production | Cut-off, Ukg8.04 × 10−1Ecoinvent v3.9.1 [41]
Potassium hydroxide {RER} | production | Cut-off, Ukg2.14Ecoinvent v3.9.1 [41]
Sodium silicate, without water, 45% solid contentkg2.27 × 10−1Komkova and Habert (2023) [4]
Silica sand {DE} | production | Cut-off, Ukg2.72 × 10−2Ecoinvent v3.9.1 [41]
Electricity, medium voltage {RER} | market group for | Cut-off, Ukwh3.49 × 10−1Ecoinvent v3.9.2 [41]
Transport, freight, lorry 16–32 metric ton, EURO6 {RER}| Cut-off, Ukg·km1.84 × 10−4Ecoinvent v3.9.1 [41]
{RoW}—Rest of the World; {RER}—Europe; {DE}—Germany; EURO6—European emission standard for vehicles; U—unit.
Table 5. Obtained s values for different mix configurations.
Sealed ConditionsLab Conditions
Mix ConfigurationssR2SR2
1G1000.70.9300.30.953
1G750.50.9890.230.999
1G500.250.9990.220.999
1G250.190.9990.210.991
1G00.180.9780.20.996
1.5G1000.60.9500.240.998
1.5G750.50.9940.240.970
1.5G500.30.9990.220.996
1.5G250.190.9980.210.999
1.5G00.180.9990.20.998
Table 6. Pull-off bond strength and failure aspect.
DesignationN/mm2St. Dev% of the Substrate’s Tensile StrengthFailure Aspect
1G502.30.763%In mortar 90% and on the interface between mortar and concrete 10%
1.5G502.00.254%In mortar 100%
1G50KOH1.90.152%In mortar 100%
1G40KOH1.80.149%In mortar 100%
CEM-RM [44]2.3Not testedNot testedNot tested
Disclaimer/Publisher’s Note: The statements, opinions and data contained in all publications are solely those of the individual author(s) and contributor(s) and not of MDPI and/or the editor(s). MDPI and/or the editor(s) disclaim responsibility for any injury to people or property resulting from any ideas, methods, instructions or products referred to in the content.

