
Utilization of Waste Brick Powder as a Partial Replacement of Portland Cement in Mortars


Abstract
:1. Introduction
2. Materials and Methods
2.1. Materials
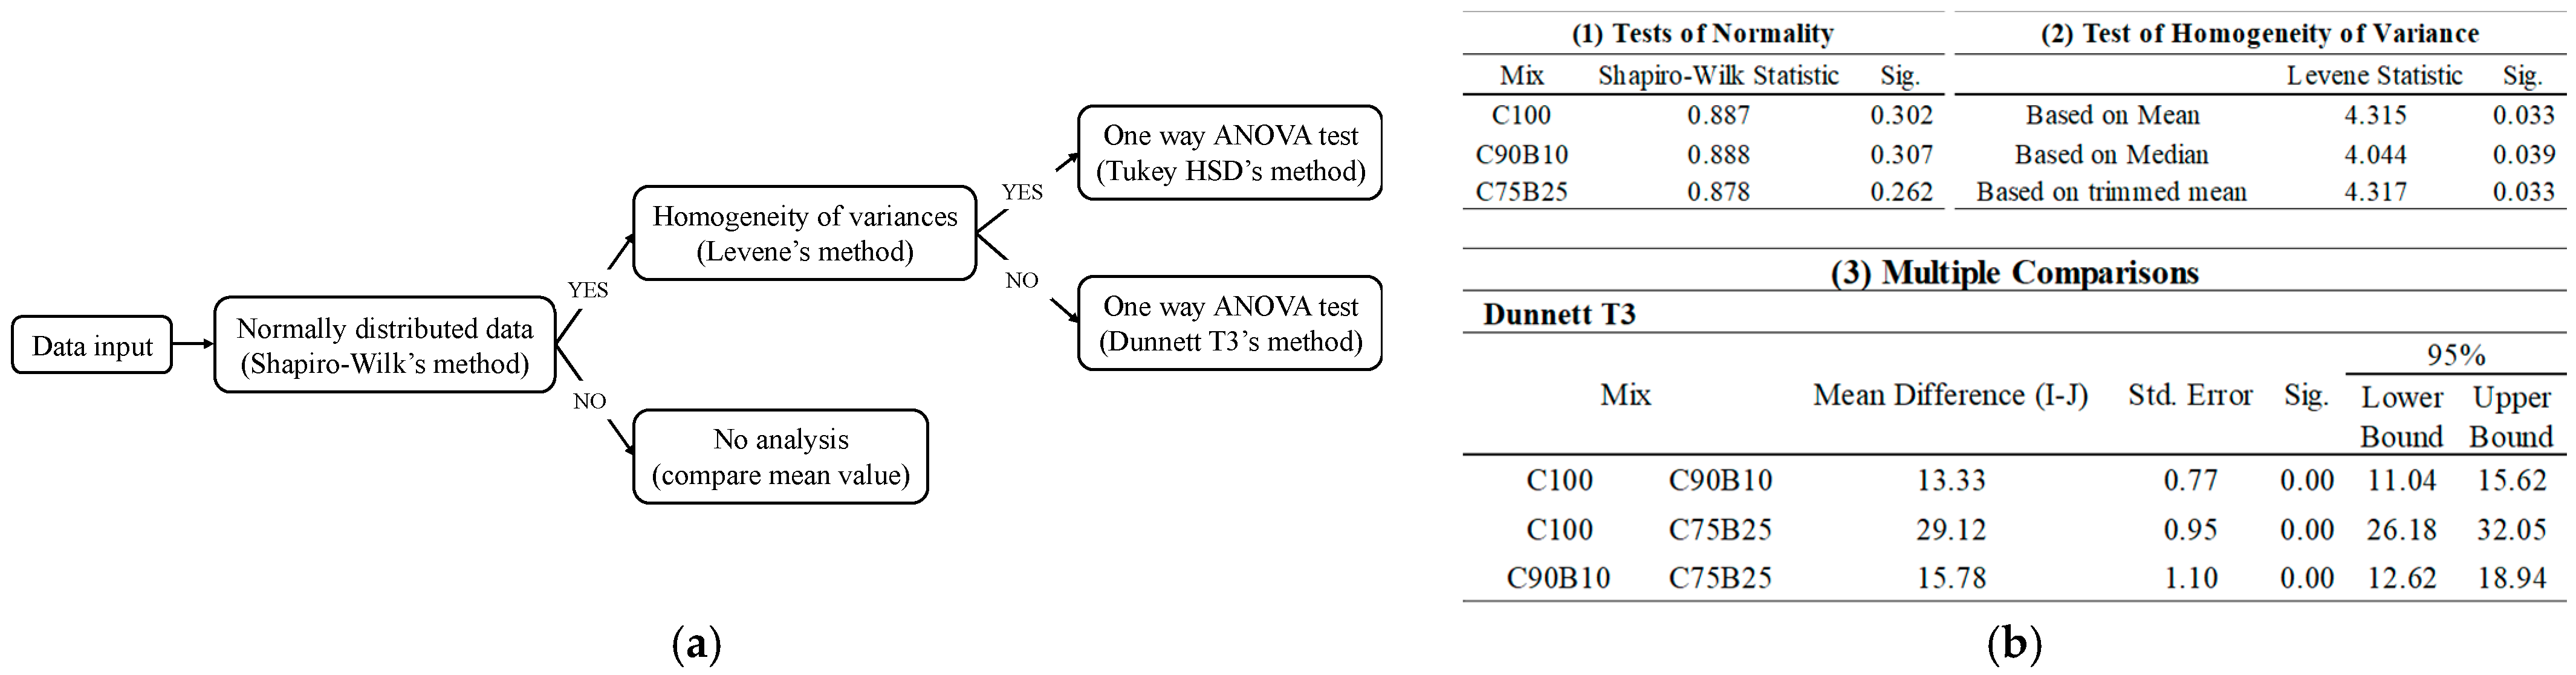
2.2. Test Methods
3. Results and Discussion
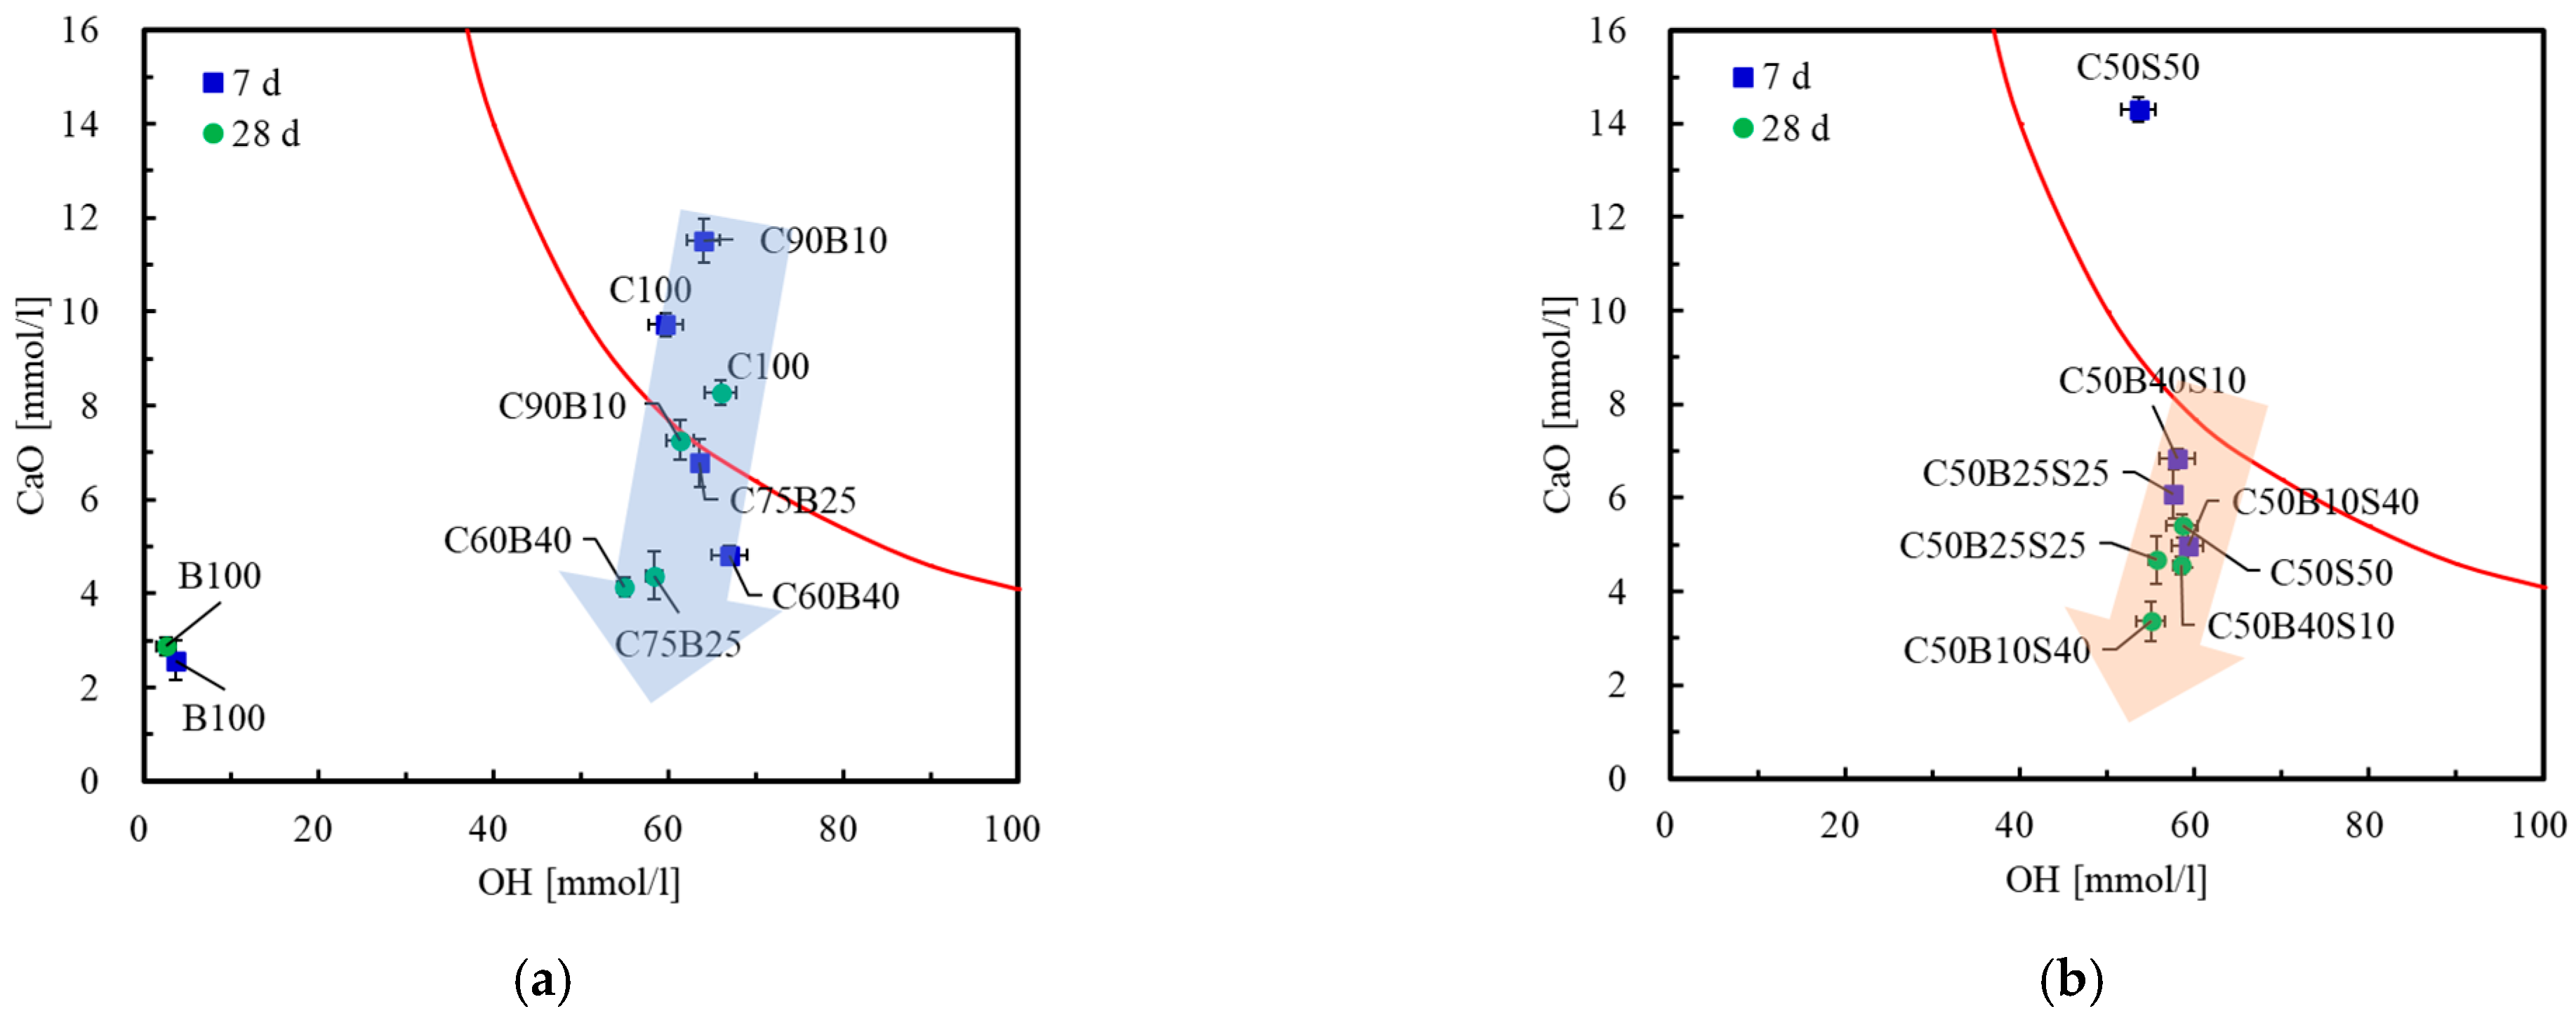
3.1. Pozzolanic Acitivity
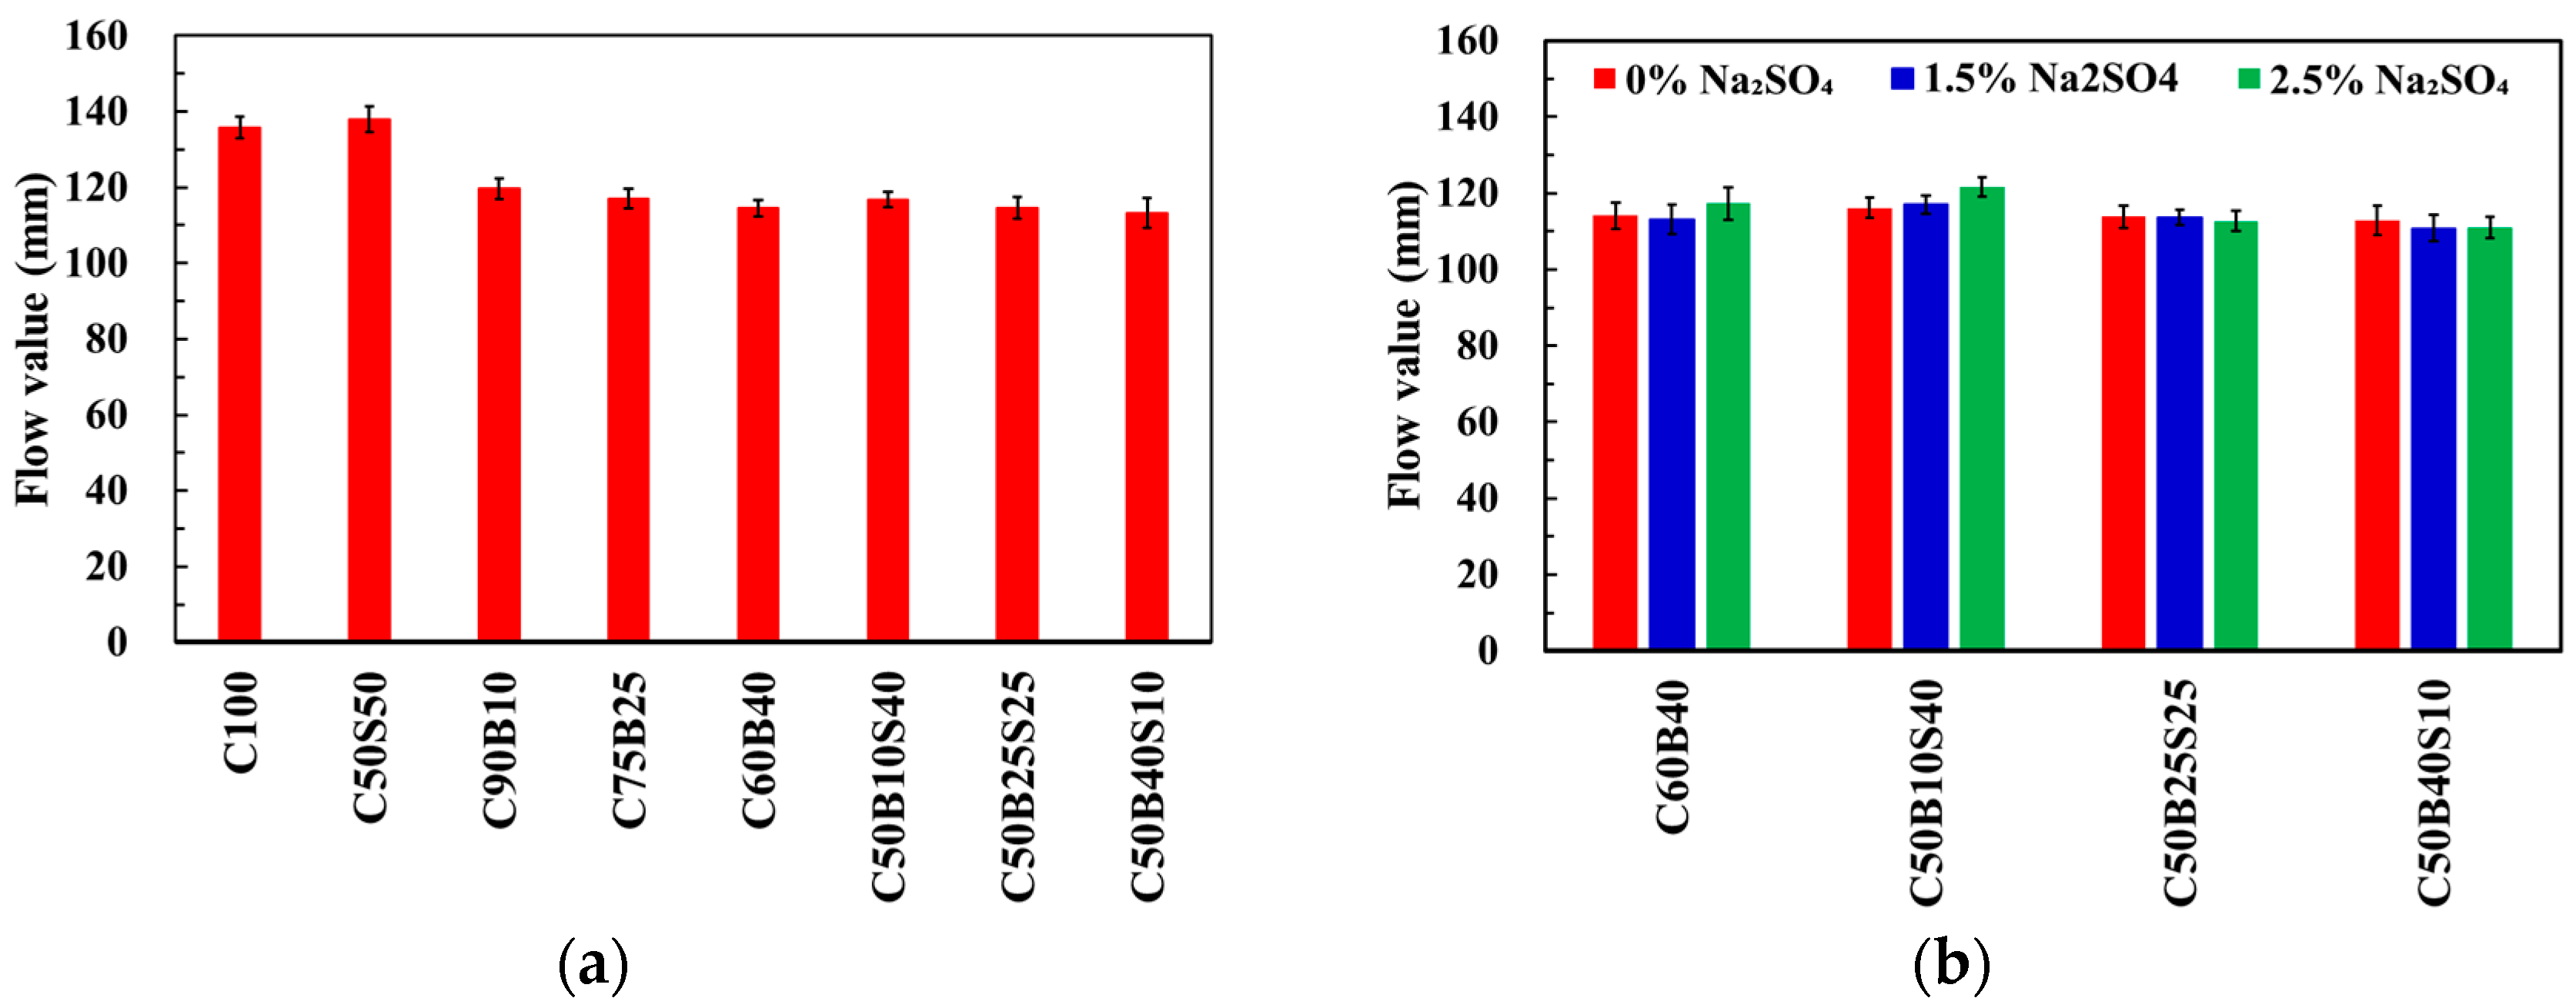
3.2. Flow Table
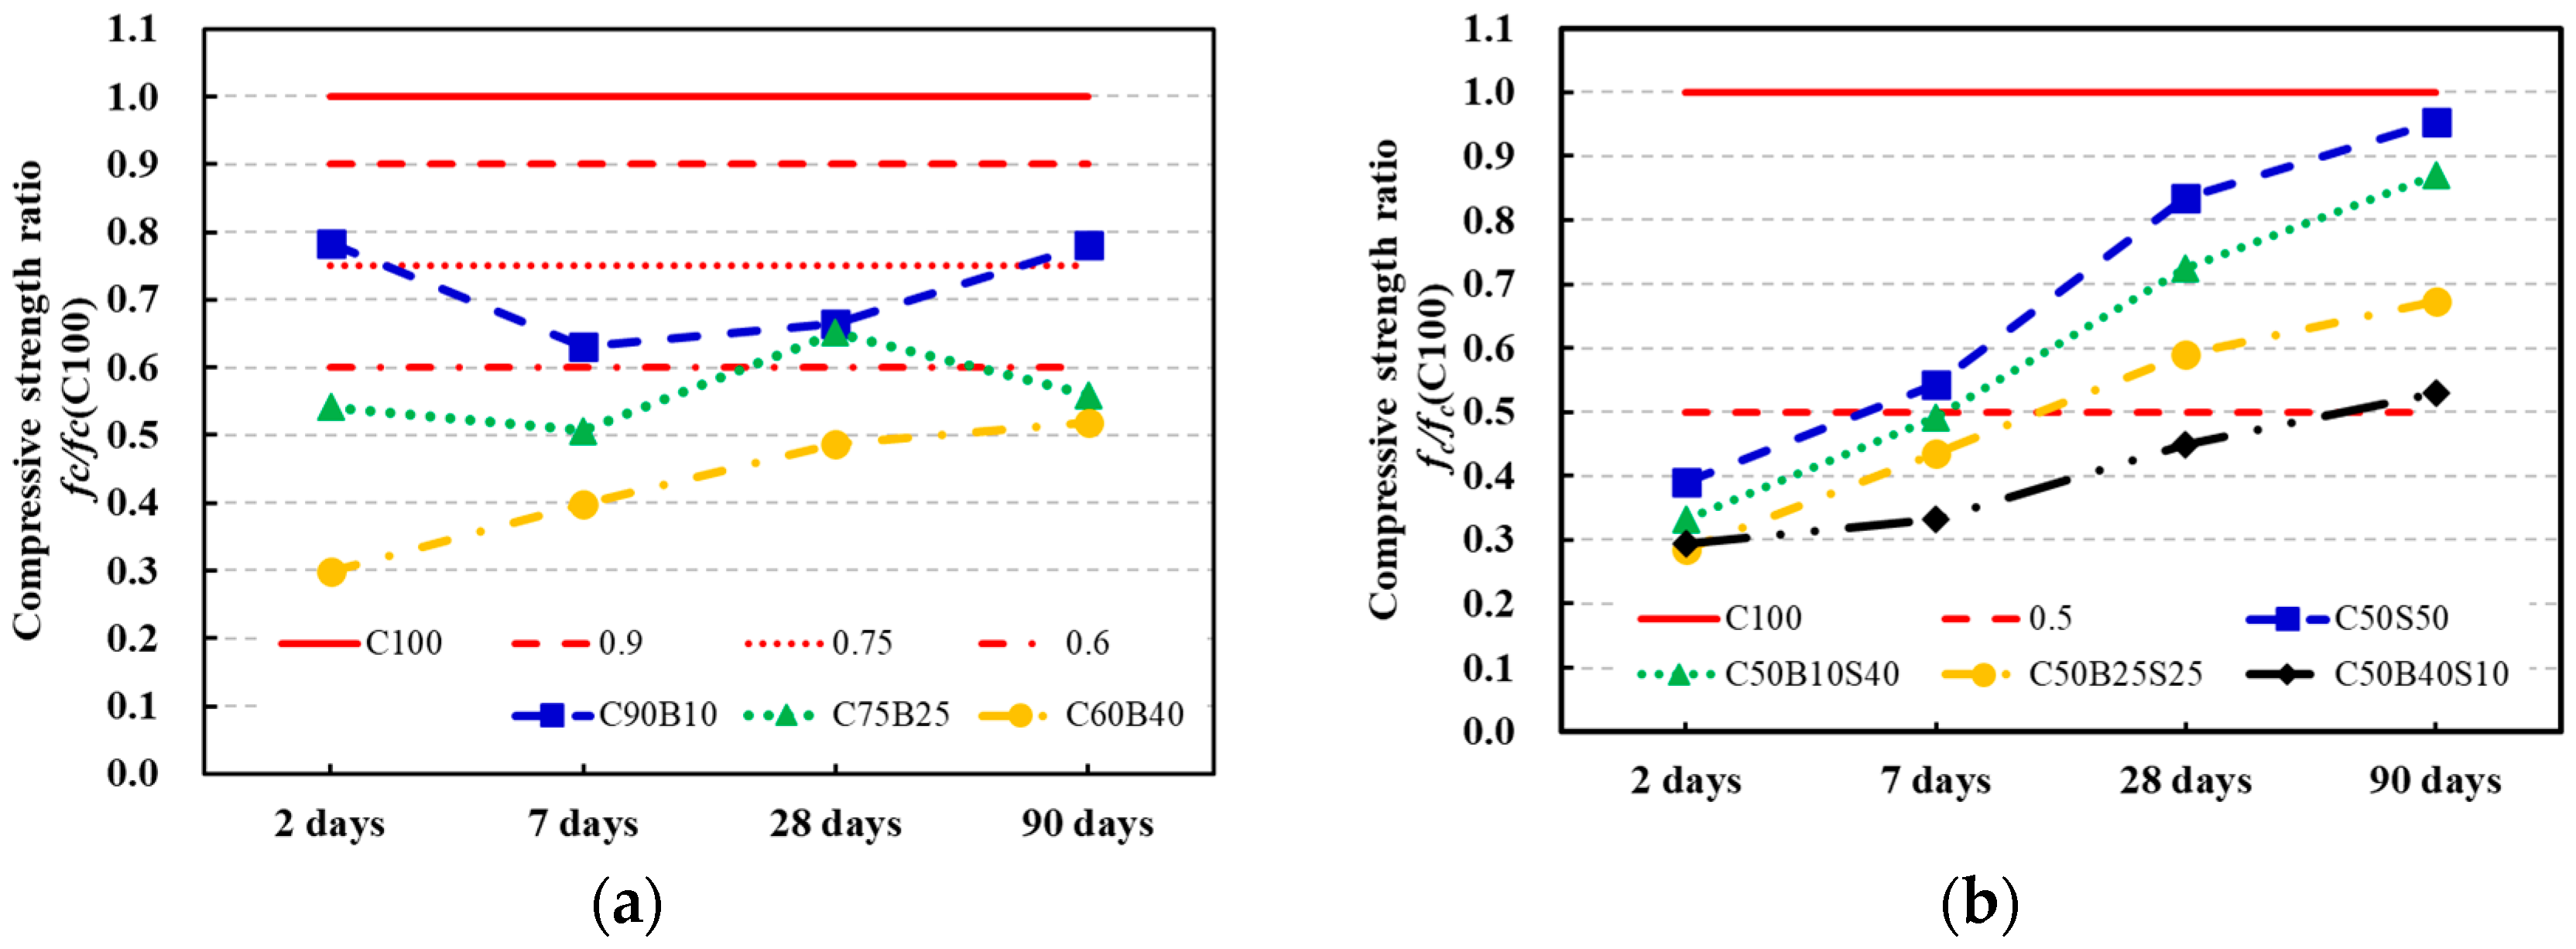
3.3. Flexural and Compressive Strength
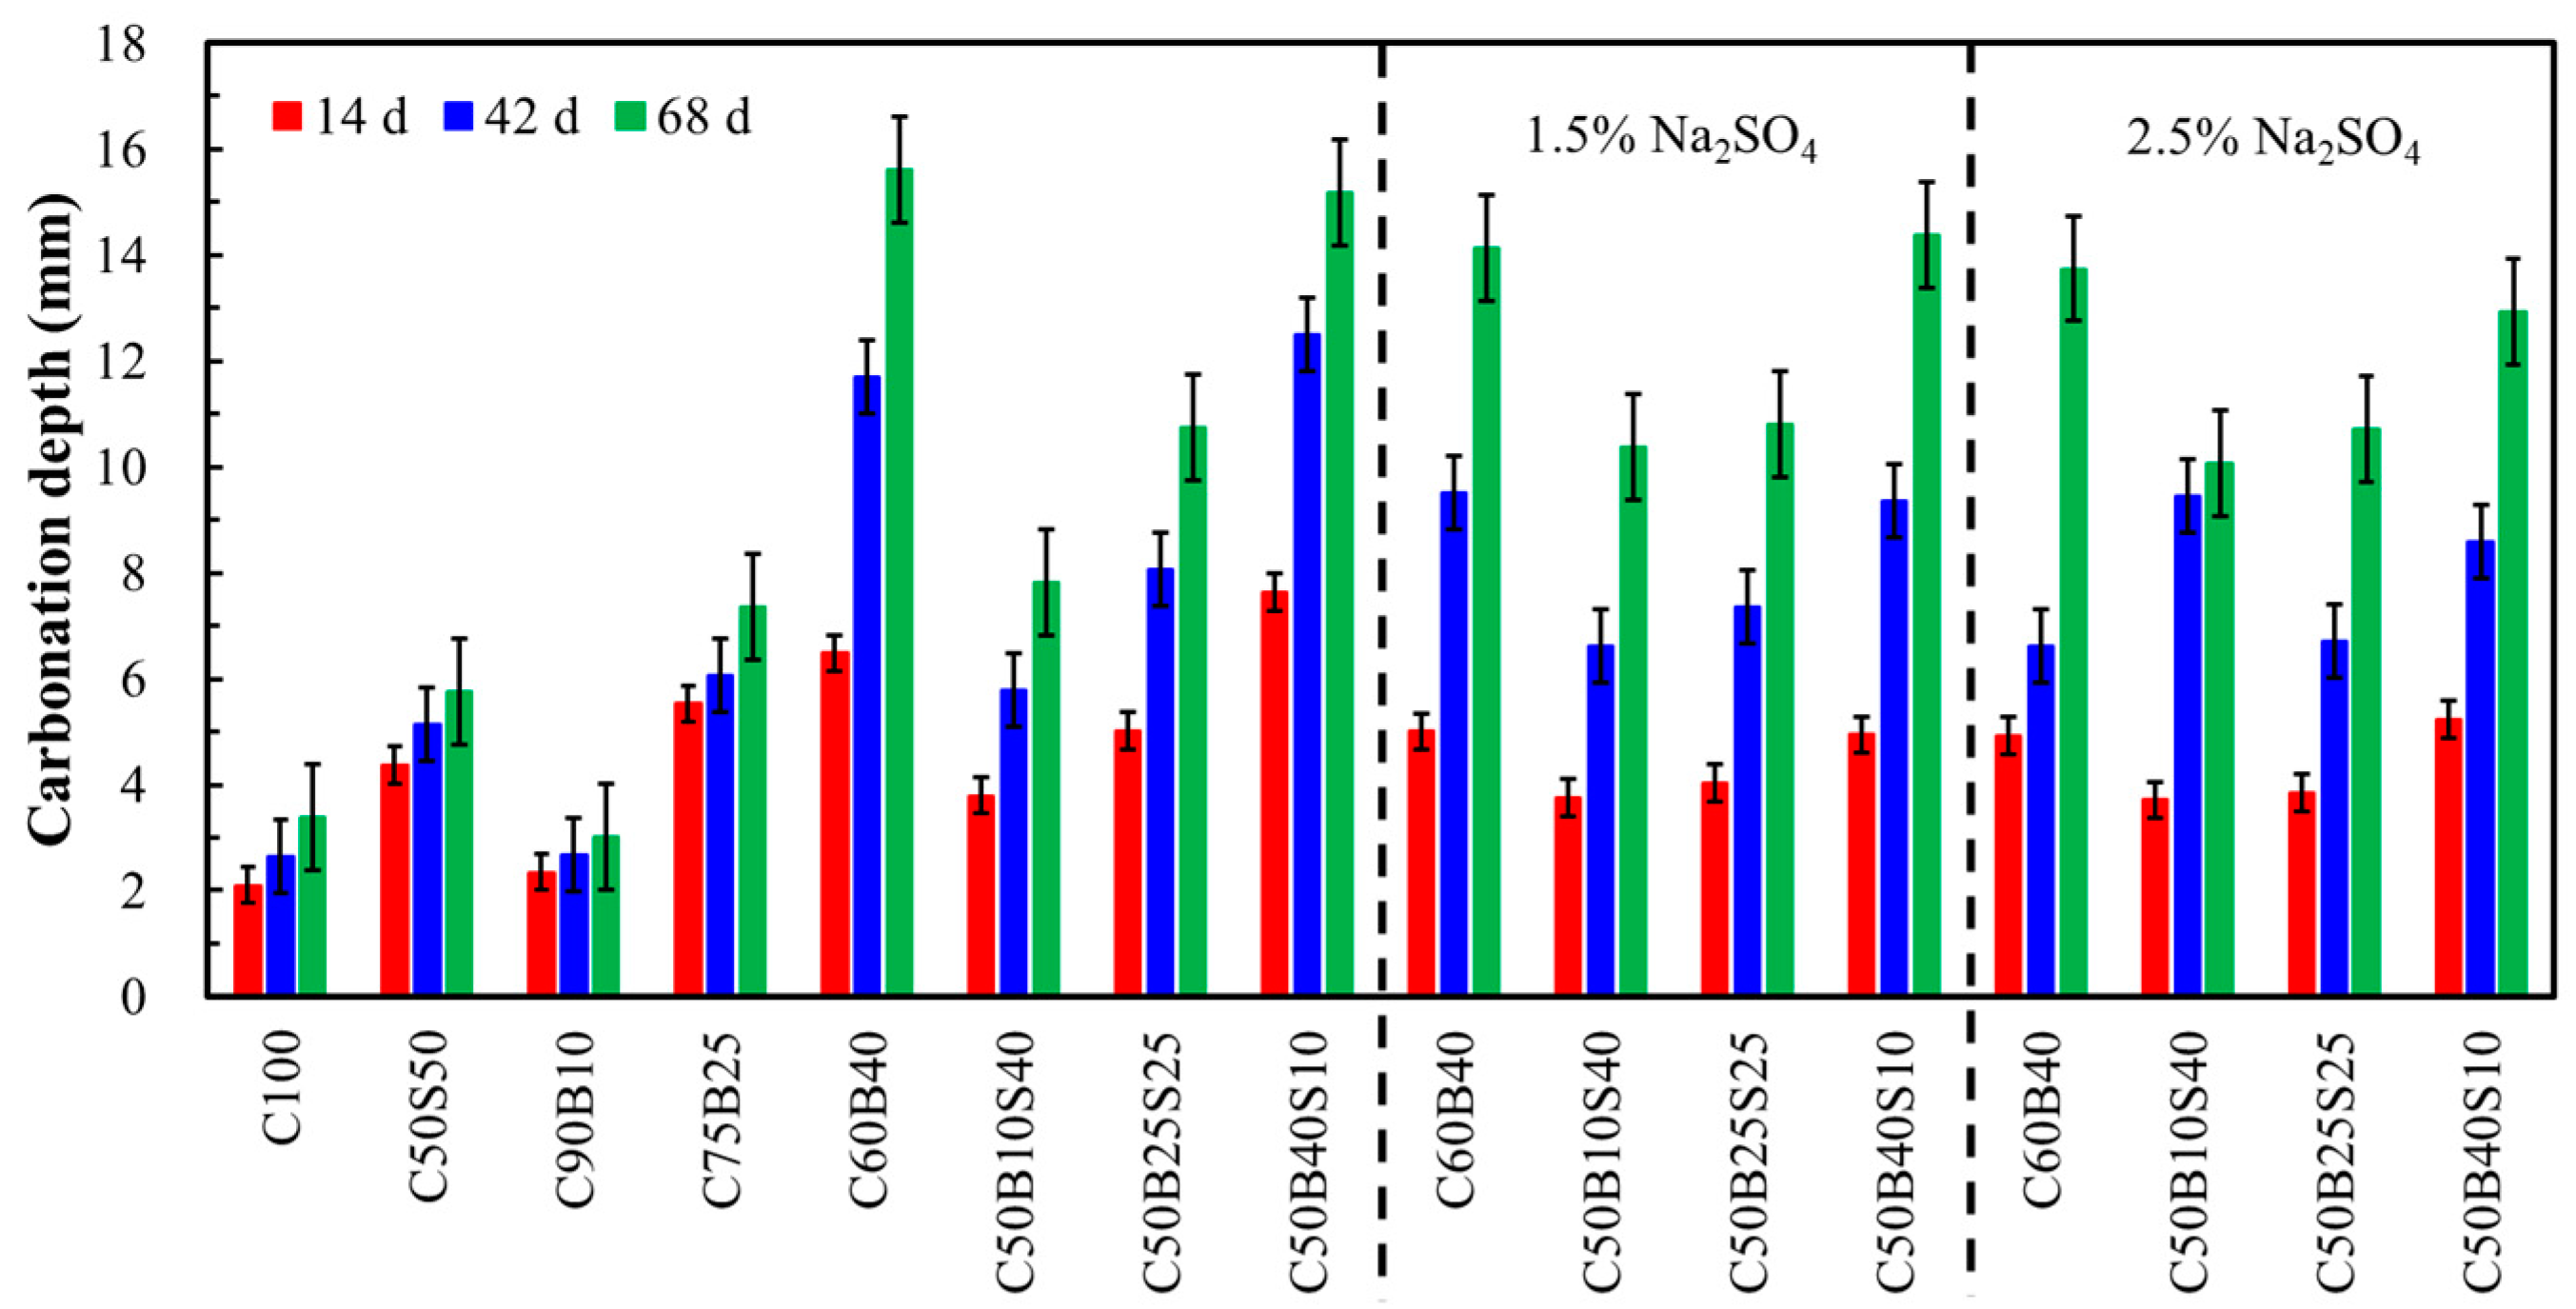
3.4. Carbonation
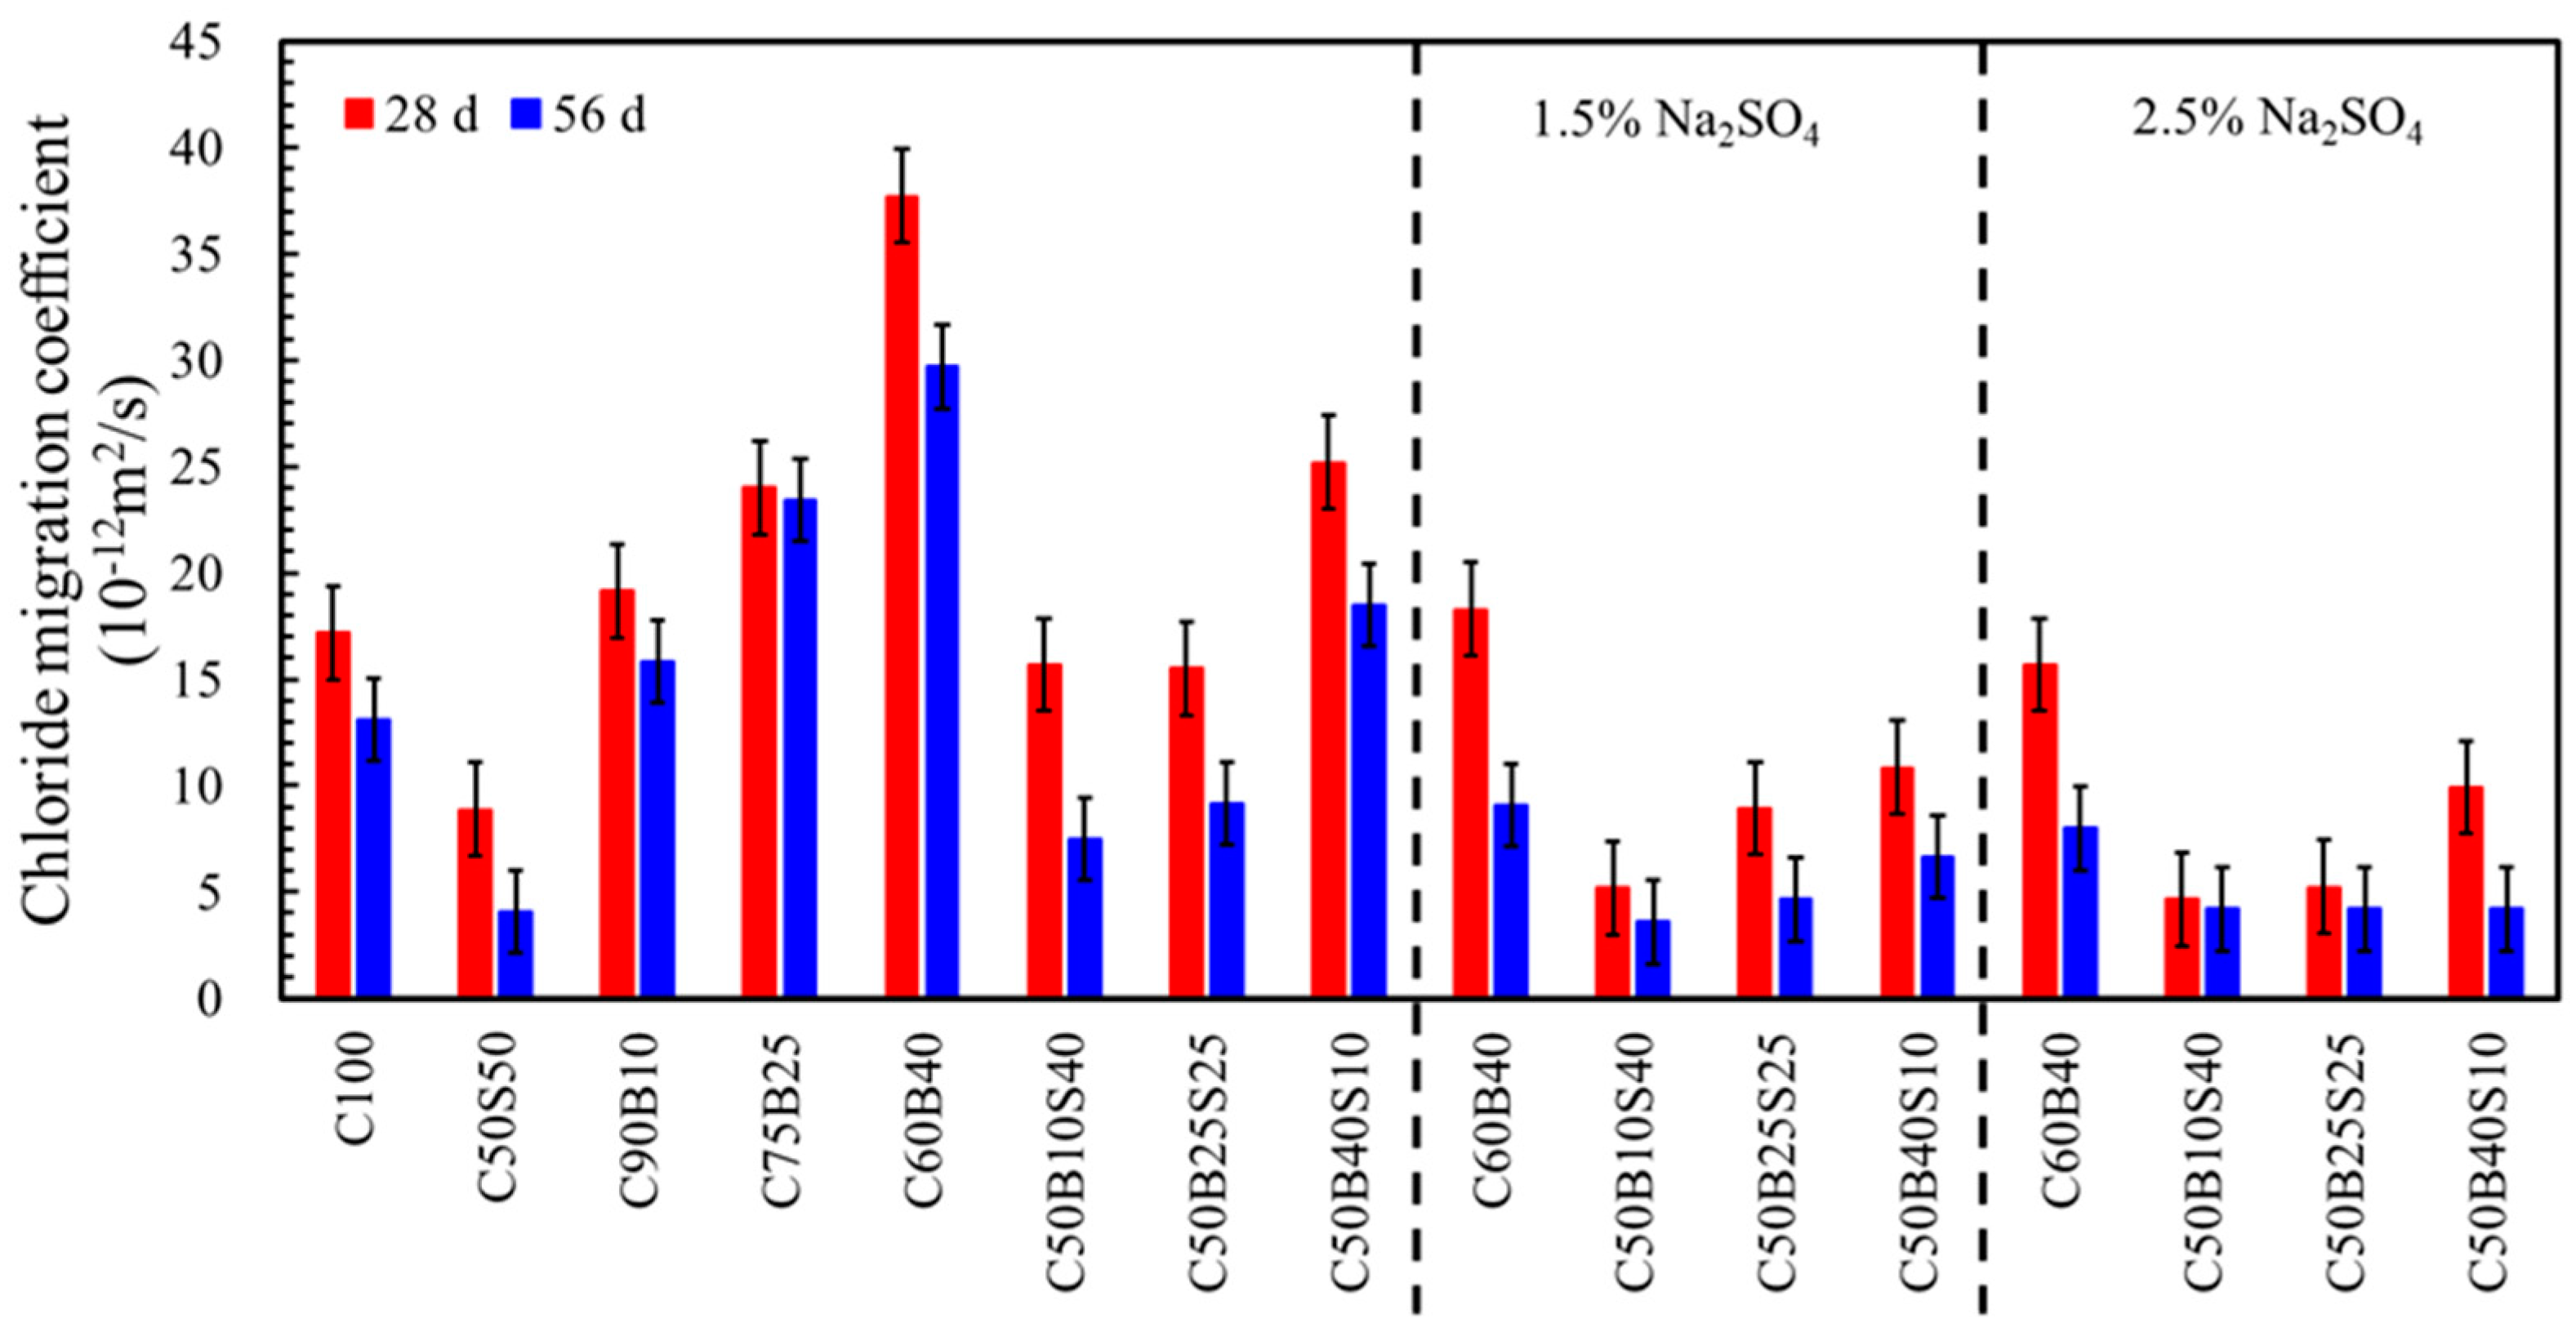
3.5. Non-Steady-State Chloride Migration
4. Conclusions
- The amorphous content and Frattini test indicate that the WBP used in this study has low pozzolanic activity.
- The fresh and hardened properties of both binary and ternary cements are decreased with the increase in WBP content from 10% to 40% since the WBP with low pozzolanic activity mainly contributes to the dilution effect. Compared with C100, C90B10 exhibits a similar carbonation depth after 14, 42 and 68 days of exposure and a slightly higher chloride migration coefficient at the age of 28 and 56 days.
- For ternary cements with 50% PC replaced by WBP+GGBFS, the flexural and compressive strengths are increased while the carbonation depth and chloride migration coefficient are decreased with the increase in GGBFS content. Compared with C100, C50S50 and C50B10S40 exhibit approximately 3% and 13% lower compressive strengths at 90 days and an obviously lower chloride migration coefficient at 28 and 56 days.
- The addition of 1.5 and 2.5% SS solution increases the compressive strength of binary cement with 40% WBP and ternary cement with 10–40% WBP and 40–10% GGBFS at 2 days, while the compressive strength at 28 and 90 days is decreased since the presence of SS probably destabilizes the C-(A)-S-H structure. The carbonation depth of mortars at 14, 42 and 68 days is decreased with the addition of 1.5 and 2.5% SS solution. However, the C50B10S40 with 1.5 and 2.5% SS exhibits a higher carbonation depth at 42 and 68 days than that without SS. In addition, mortars with 1.5 and 2.5% SS show a lower chloride migration coefficient at 28 and 56 days than mortars without SS.
Author Contributions
Funding
Data Availability Statement
Conflicts of Interest
References
- NBN EN 197-1; Cement-Composition, Specifications and Conformity Criteria for Common Cements. NBN (Bureau for Standardisation): Brussel, Belgium, 2011; pp. 1–41.
- EN 197-5:2021; Cement-Part 5: Portland-Composite Cement CEM II/C-M and Composite Cement CEM VI Cement. European Committee for Standardisation: London, UK, 2021; Volume 1, pp. 2–5.
- Karen, L.S.; John, V.M.; Gartner, E.M. Eco-Efficient Cements: Potential, Economically Viable Solutions for a Low-CO2, Cement-Based Materials Industry. World Bus. Counc. Sustain. Dev. 2016, 42, 8–21. Available online: https://spiral.imperial.ac.uk/bitstream/10044/1/51016/2/2016-UNEP%20Report-Complete6.pdf (accessed on 23 October 2023).
- Fatta, D.; Papadopoulos, A.; Avramikos, E.; Sgourou, E.; Moustakas, K.; Kourmoussis, F.; Mentzis, A.; Loizidou, M. Generation and Management of Construction and Demolition Waste in Greece—An Existing Challenge. Resour. Conserv. Recycl. 2003, 40, 81–91. [Google Scholar] [CrossRef]
- Reig, L.; Tashima, M.M.; Borrachero, M.V.; Monzó, J.; Cheeseman, C.R.; Payá, J. Properties and Microstructure of Alkali-Activated Red Clay Brick Waste. Constr. Build. Mater. 2013, 43, 98–106. [Google Scholar] [CrossRef]
- Shao, J.; Gao, J.; Zhao, Y.; Chen, X. Study on the Pozzolanic Reaction of Clay Brick Powder in Blended Cement Pastes. Constr. Build. Mater. 2019, 213, 209–215. [Google Scholar] [CrossRef]
- Navrátilová, E.; Rovnaníková, P. Pozzolanic Properties of Brick Powders and Their Effect on the Properties of Modified Lime Mortars. Constr. Build. Mater. 2016, 120, 530–539. [Google Scholar] [CrossRef]
- Pacheco-Torgal, F.; Jalali, S. Reusing Ceramic Wastes in Concrete. Constr. Build. Mater. 2010, 24, 832–838. [Google Scholar] [CrossRef]
- Katzer, J. Strength Performance Comparison of Mortars Made with Waste Fine Aggregate and Ceramic Fume. Constr. Build. Mater. 2013, 47, 1–6. [Google Scholar] [CrossRef]
- Schackow, A.; Stringari, D.; Senff, L.; Correia, S.L.; Segadães, A.M. Influence of Fired Clay Brick Waste Additions on the Durability of Mortars. Cem. Concr. Compos. 2015, 62, 82–89. [Google Scholar] [CrossRef]
- Li, H.; Dong, L.; Jiang, Z.; Yang, X.; Yang, Z. Study on Utilization of Red Brick Waste Powder in the Production of Cement-Based Red Decorative Plaster for Walls. J. Clean. Prod. 2016, 133, 1017–1026. [Google Scholar] [CrossRef]
- Ortega, J.M.; Letelier, V.; Solas, C.; Moriconi, G.; Climent, M.Á.; Sánchez, I. Long-Term Effects of Waste Brick Powder Addition in the Microstructure and Service Properties of Mortars. Constr. Build. Mater. 2018, 182, 691–702. [Google Scholar] [CrossRef]
- Rakhimova, N.R.; Rakhimov, R.Z. Alkali-Activated Cements and Mortars Based on Blast Furnace Slag and Red Clay Brick Waste. Mater. Des. 2015, 85, 324–331. [Google Scholar] [CrossRef]
- Fořt, J.; Vejmelková, E.; Koňáková, D.; Alblová, N.; Čáchová, M.; Keppert, M.; Rovnaníková, P.; Černý, R. Application of Waste Brick Powder in Alkali Activated Aluminosilicates: Functional and Environmental Aspects. J. Clean. Prod. 2018, 194, 714–725. [Google Scholar] [CrossRef]
- Zhao, Y.; Gao, J.; Liu, C.; Chen, X.; Xu, Z. The Particle-Size Effect of Waste Clay Brick Powder on Its Pozzolanic Activity and Properties of Blended Cement. J. Clean. Prod. 2020, 242, 118521. [Google Scholar] [CrossRef]
- Bilim, C.; Ati, C.D. Alkali Activation of Mortars Containing Different Replacement Levels of Ground Granulated Blast Furnace Slag. Constr. Build. Mater. 2012, 28, 708–712. [Google Scholar] [CrossRef]
- Angulo-Ramírez, D.E.; Mejía de Gutiérrez, R.; Puertas, F. Alkali-Activated Portland Blast-Furnace Slag Cement: Mechanical Properties and Hydration. Constr. Build. Mater. 2017, 140, 119–128. [Google Scholar] [CrossRef]
- Kaja, A.M.; Lazaro, A.; Yu, Q.L. Effects of Portland Cement on Activation Mechanism of Class F Fly Ash Geopolymer Cured under Ambient Conditions. Constr. Build. Mater. 2018, 189, 1113–1123. [Google Scholar] [CrossRef]
- Farasat, S.; Shah, A.; Chen, B.; Yousefi, S.; Haque, M.A.; Riaz, M. Improvement of Early Strength of Fly Ash-Slag Based One-Part Alkali Activated Mortar. Constr. Build. Mater. 2020, 246, 118533. [Google Scholar] [CrossRef]
- Reig, L.; Tashima, M.M.; Soriano, L.; Borrachero, M.V.; Monzó, J.; Payá, J. Alkaline Activation of Ceramic Waste Materials. Waste Biomass Valoriz. 2013, 4, 729–736. [Google Scholar] [CrossRef]
- Robayo, R.A.; Mulford, A.; Munera, J.; Mejía de Gutiérrez, R. Alternative Cements Based on Alkali-Activated Red Clay Brick Waste. Constr. Build. Mater. 2016, 128, 163–169. [Google Scholar] [CrossRef]
- Komnitsas, K.; Zaharaki, D.; Vlachou, A.; Bartzas, G.; Galetakis, M. Effect of Synthesis Parameters on the Quality of Construction and Demolition Wastes (CDW) Geopolymers. Adv. Powder Technol. 2015, 26, 368–376. [Google Scholar] [CrossRef]
- Luukkonen, T.; Abdollahnejad, Z.; Yliniemi, J.; Kinnunen, P.; Illikainen, M. Cement and Concrete Research One-Part Alkali-Activated Materials: A Review. Cem. Concr. Res. 2018, 103, 21–34. [Google Scholar] [CrossRef]
- Rashad, A.M.; Bai, Y.; Basheer, P.A.M.; Milestone, N.B.; Collier, N.C. Hydration and Properties of Sodium Sulfate Activated Slag. Cem. Concr. Compos. 2013, 37, 20–29. [Google Scholar] [CrossRef]
- Xue, L.; Zhang, Z.; Wang, H. Hydration Mechanisms and Durability of Hybrid Alkaline Cements (HACs): A Review. Constr. Build. Mater. Manuscr. 2021, 266, 121039. [Google Scholar] [CrossRef]
- Fernández-Jiménez, A.; Garcia-Lodeiro, I.; Maltseva, O.; Palomo, A. Hydration Mechanisms of Hybrid Cements as a Function of the Way of Addition of Chemicals. J. Am. Ceram. Soc. 2019, 102, 427–436. [Google Scholar] [CrossRef]
- Zhang, J.; Tan, H.; Bao, M.; Liu, X.; Luo, Z.; Wang, P. Low Carbon Cementitious Materials: Sodium Sulfate Activated Ultra-Fine Slag/Fly Ash Blends at Ambient Temperature. J. Clean. Prod. 2021, 280, 124363. [Google Scholar] [CrossRef]
- NBN EN 196-1; Method of Testing Cement-Part 1: Determination of Strength. NBN (Bureau for Standardisation): Brussels, Belgium, 2005; pp. 1–35.
- NBN EN 196-5; Methods of Testing Cement-Part 5: Pozzolanicity Test for Pozzolanic Cement. NBN (Bureau for Standardisation): Brussels, Belgium, 2005; pp. 1–15.
- NBN EN 1015-3; Methods of Test for Mortar for Masonry—Part 3: Determination of Consistence of Fresh Mortar by Flow Table. NBN (Bureau for Standardisation): Brussels, Belgium, 1999; pp. 1–12.
- NBN EN 13295:2004; Products and Systems for the Protection and Repair of Concrete Structures-Test Methods-Determination of Resistance to Carbonation. NBN (Bureau for Standardisation): Brussels, Belgium, 2004; pp. 1–15.
- NT Build 492 Concrete, Mortar and Cement-Based Repair Materials: Chloride Migration Coefficient from Non-Steady-State Migration Experiments. Measurement 1999, 1–8. Available online: https://www.nordtest.info/wp/1999/11/21/concrete-mortar-and-cement-based-repair-materials-chloride-migration-coefficient-from-non-steady-state-migration-experiments-nt-build-492/ (accessed on 23 October 2023).
- Pustovgar, E.; Mishra, R.K.; Palacios, M.; d’Espinose de Lacaillerie, J.B.; Matschei, T.; Andreev, A.S.; Heinz, H.; Verel, R.; Flatt, R.J. Influence of Aluminates on the Hydration Kinetics of Tricalcium Silicate. Cem. Concr. Res. 2017, 100, 245–262. [Google Scholar] [CrossRef]
- Joseph, S.; Skibsted, J.; Cizer, Ö. A Quantitative Study of the C3A Hydration. Cem. Concr. Res. 2019, 115, 145–159. [Google Scholar] [CrossRef]
- Scrivener, K.; Ouzia, A.; Juilland, P.; Kunhi Mohamed, A. Advances in Understanding Cement Hydration Mechanisms. Cem. Concr. Res. 2019, 124, 105823. [Google Scholar] [CrossRef]
- Bentur, A. Effect of Gypsum on the Hydration and Strength of C3S Pastes. J. Am. Ceram. Soc. 1976, 59, 210–213. [Google Scholar] [CrossRef]
- Mota, B.; Matschei, T.; Scrivener, K. Impact of NaOH and Na2SO4 on the Kinetics and Microstructural Development of White Cement Hydration. Cem. Concr. Res. 2018, 108, 172–185. [Google Scholar] [CrossRef]
- Mota, B.; Matschei, T.; Scrivener, K. Impact of Sodium Gluconate on White Cement-Slag Systems with Na2SO4. Cem. Concr. Res. 2019, 122, 59–71. [Google Scholar] [CrossRef]
- Fu, J.; Jones, A.M.; Bligh, M.W.; Holt, C.; Keyte, L.M.; Moghaddam, F.; Foster, S.J.; Waite, T.D. Mechanisms of Enhancement in Early Hydration by Sodium Sulfate in a Slag-Cement Blend–Insights from Pore Solution ChemistryMechanisms of Enhancement in Early Hydration by Sodium Sulfate in a Slag-Cement Blend–Insights from Pore Solution Chemistry. Cem. Concr. Res. 2020, 135, 106110. [Google Scholar] [CrossRef]
- Tan, H.; Deng, X.; He, X.; Zhang, J.; Zhang, X.; Su, Y.; Yang, J. Compressive Strength and Hydration Process of Wet-Grinded Granulated Blast-Furnace Slag Activated by Sodium Sulfate and Sodium Carbonate. Cem. Concr. Compos. 2019, 97, 387–398. [Google Scholar] [CrossRef]
- Termkhajornkit, P.; Vu, Q.H.; Barbarulo, R.; Daronnat, S.; Chanvillard, G. Dependence of Compressive Strength on Phase Assemblage in Cement Pastes: Beyond Gel-Space Ratio-Experimental Evidence and Micromechanical Modeling. Cem. Concr. Res. 2014, 56, 1–11. [Google Scholar] [CrossRef]
- Zajac, M.; Rossberg, A.; Le Saout, G.; Lothenbach, B. Influence of Limestone and Anhydrite on the Hydration of Portland Cements. Cem. Concr. Compos. 2014, 46, 99–108. [Google Scholar] [CrossRef]
- Bernal, S.A.; Provis, J.L.; Brice, D.G.; Kilcullen, A.; Duxson, P.; Van Deventer, J.S.J. Accelerated Carbonation Testing of Alkali-Activated Binders Significantly Underestimates Service Life: The Role of Pore Solution Chemistry. Cem. Concr. Res. 2012, 42, 1317–1326. [Google Scholar] [CrossRef]
- Rashad, A.M. Influence of Different Additives on the Properties of Sodium Sulfate Activated Slag. Constr. Build. Mater. 2015, 79, 379–389. [Google Scholar] [CrossRef]
- Berodier, E.; Scrivener, K. Evolution of Pore Structure in Blended Systems. Cem. Concr. Res. 2015, 73, 25–35. [Google Scholar] [CrossRef]
- Divsholi, B.S.; Lim, T.Y.D.; Teng, S. Durability Properties and Microstructure of Ground Granulated Blast Furnace Slag Cement Concrete. Int. J. Concr. Struct. Mater. 2014, 8, 157–164. [Google Scholar] [CrossRef]
- Choi, Y.C.; Kim, J.; Choi, S. Mercury Intrusion Porosimetry Characterization of Micropore Structures of High-Strength Cement Pastes Incorporating High Volume Ground Granulated Blast-Furnace Slag. Constr. Build. Mater. 2017, 137, 96–103. [Google Scholar] [CrossRef]


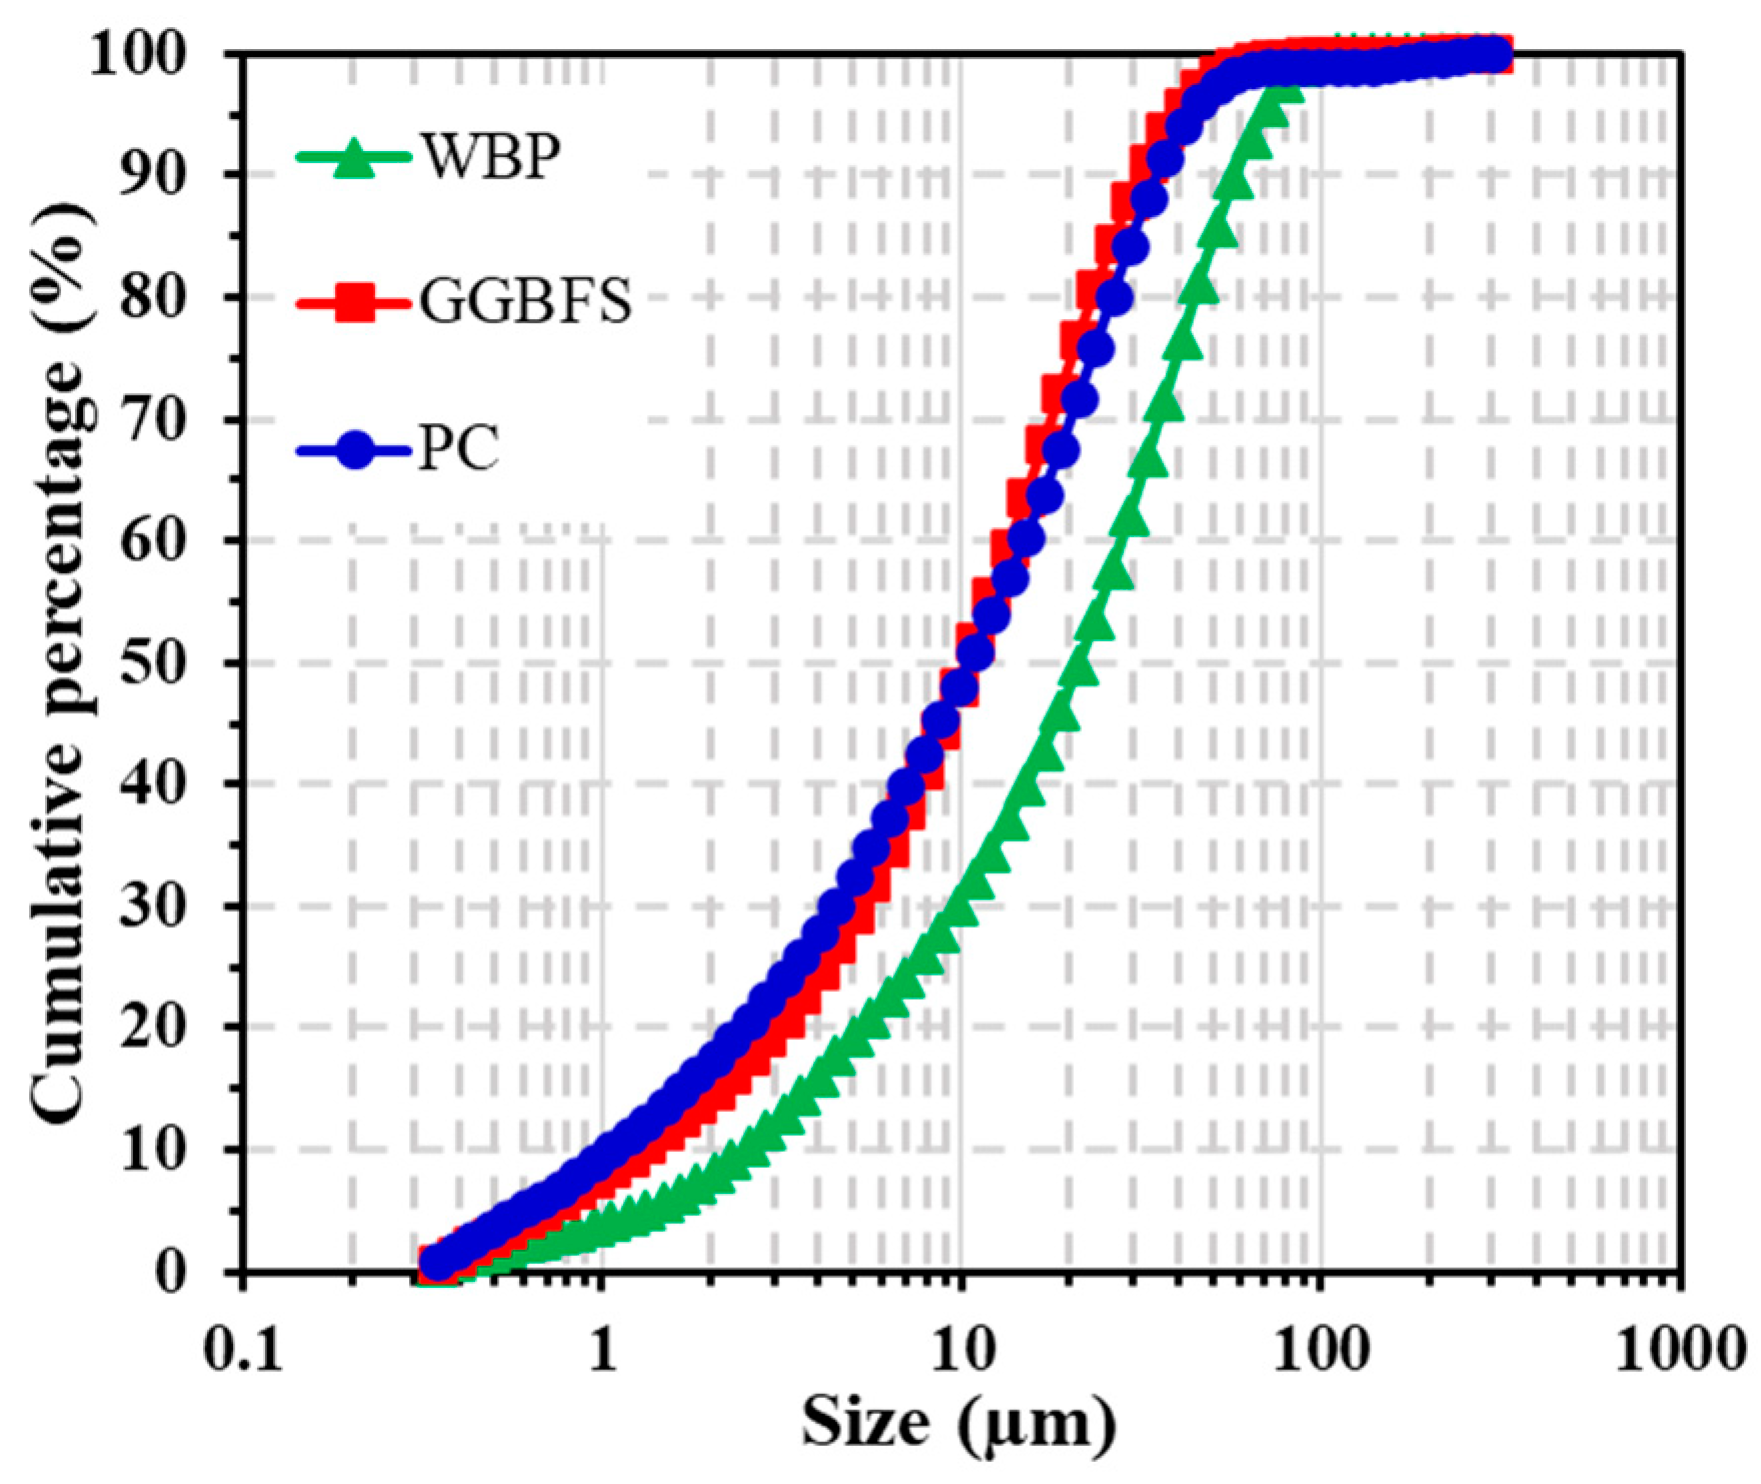
| D10 (µm) | D50 (µm) | D90 (µm) | |
|---|---|---|---|
| PC | 1.1 | 10.4 | 35.0 |
| GGBFS | 1.2 | 10.3 | 31.6 |
| WBP | 2.7 | 21.1 | 57.2 |
| Chemical Composition (wt.%) | ||||||||||||||
|---|---|---|---|---|---|---|---|---|---|---|---|---|---|---|
| CaO | SiO2 | Al2O3 | Fe2O3 | K2O | MgO | Mn2O3 | Na2O | Cr2O3 | TiO2 | SO3 | P2O5 | Cl− | S2− | |
| PC | 65.5 | 18.1 | 4.4 | 3.64 | 0.72 | 1.81 | - | 0.25 | - | 0.48 | 4.29 | 0.35 | - | - |
| GGBFS | 41.1 | 34.3 | 10.2 | 0.6 | 0.47 | 6.8 | - | 0.93 | - | 0.7 | 0.1 | - | 0.02 | 0.7 |
| WBP | 9.51 | 71.13 | 10.14 | 3.82 | 2.25 | 1.31 | 0.06 | 0.68 | 0.03 | 1.09 | - | - | - | - |
| Mineralogical Phases and Amorphous Content (wt.%) | |||||||
|---|---|---|---|---|---|---|---|
| Quartz | Albite | Alkali Feldspar | Melilite Group | Clinopyroxene | Hematite | Amorphous | |
| WBP | 38.3 | 14.9 | 9.1 | 2.3 | 8.5 | 2.1 | 24.7 |
| Series | Code | Na2SO4 (g) | Binder (g) | Water (g) | Sand (g) | ||
|---|---|---|---|---|---|---|---|
| PC (g) | WBP (g) | GGBFS (g) | |||||
| Reference | C100 | - | 450 | - | - | 225 | 1350 |
| C50S50 | - | 225 | - | 225 | 225 | 1350 | |
| C90B10 | - | 405 | 45 | - | 225 | 1350 | |
| C75B25 | - | 337.5 | 112.5 | - | 225 | 1350 | |
| C60B40 | - | 270 | 180 | - | 225 | 1350 | |
| C50B10S40 | - | 225 | 45 | 180 | 225 | 1350 | |
| C50B25S25 | - | 225 | 112.5 | 112.5 | 225 | 1350 | |
| C50B40S10 | - | 225 | 180 | 45 | 225 | 1350 | |
| 1.5% | C60B40 | 6.75 | 270 | 180 | - | 225 | 1350 |
| SS | C50B10S40 | 6.75 | 225 | 45 | 180 | 225 | 1350 |
| C50B25S25 | 6.75 | 225 | 112.5 | 112.5 | 225 | 1350 | |
| C50B40S10 | 6.75 | 225 | 180 | 45 | 225 | 1350 | |
| 2.5% | C60B40 | 11.25 | 270 | 180 | - | 225 | 1350 |
| SS | C50B10S40 | 11.25 | 225 | 45 | 180 | 225 | 1350 |
| C50B25S25 | 11.25 | 225 | 112.5 | 112.5 | 225 | 1350 | |
| C50B40S10 | 11.25 | 225 | 180 | 45 | 225 | 1350 | |
| Materials | Pozzolanic Activity (mg Ca(OH)2/1 g Pozzolan) after 1 Day | Amorphous (%) | CaO (%) | Al2O3 (%) | SiO2 (%) | D10 (μm) | D50 (μm) | D90 (μm) |
|---|---|---|---|---|---|---|---|---|
| WBP | - | 24.7 | 9.51 | 10.13 | 71.13 | 1.3 | 15.1 | 41.0 |
| Brick 1 | 460 | 72.1 | 13.79 | 15.61 | 58.50 | 1.8 | 16.6 | 95.6 |
| Brick 2 | 455 | 71.3 | 14.10 | 15.14 | 58.34 | 1.6 | 10.6 | 48.3 |
| Brick 3 | 408 | 65.2 | 15.10 | 15.25 | 58.12 | 1.6 | 12.3 | 70.6 |
| Brick 4 | 345 | 65.4 | 10.15 | 15.19 | 59.12 | 1.6 | 15.2 | 222.3 |
| Brick 5 | 326 | 64.3 | 10.24 | 15.10 | 58.87 | 1.7 | 13.5 | 94.6 |
| Brick 6 | 296 | 63.7 | 10.57 | 15.24 | 58.13 | 1.8 | 13.4 | 154.1 |
| Brick 7 | - | 20.1 | 1.9 | 18.4 | 64.5 | 5.0 | 27.1 | 91.2 |
| Brick 8 | - | 20.1 | 1.9 | 18.4 | 64.5 | 1.6 | 15.8 | 55.3 |
| Brick 9 | - | 20.1 | 1.9 | 18.4 | 64.5 | 1.0 | 10.5 | 33.3 |
| Brick 10 | - | 20.1 | 1.9 | 18.4 | 64.5 | 0.6 | 3.4 | 24.1 |
| Mixture | 2 Days | 7 Days | 28 Days | 90 Days | |||||
|---|---|---|---|---|---|---|---|---|---|
| Mean | Std | Mean | Std | Mean | Std | Mean | Std | ||
| 0% SS | C100 | 5.0 | 0.4 | 8.2 | 0.4 | 9.7 | 0.3 | 9.8 | 0.3 |
| C50S50 | 2.5 | 0.1 | 4.7 | 0.3 | 7.6 | 0.2 | 8.4 | 0.5 | |
| C90B10 | 4.4 | 0.2 | 5.6 | 0.1 | 6.7 | 0.2 | 8.4 | 0.2 | |
| C75B25 | 3.5 | 0.1 | 4.6 | 0.2 | 6.7 | 0.3 | 7.3 | 0.1 | |
| C60B40 | 2.2 | 0.3 | 4.2 | 0.3 | 5.5 | 0.1 | 6.7 | 0.5 | |
| C50B10S40 | 2.2 | 0.1 | 4.7 | 0.3 | 7.4 | 0.3 | 8.2 | 0.3 | |
| C50B25S25 | 2.1 | 0.1 | 4.1 | 0.1 | 6.1 | 0.2 | 7.1 | 0.5 | |
| C50B40S10 | 2.0 | 0.1 | 3.5 | 0.2 | 5.4 | 0.1 | 6.1 | 0.4 | |
| 1.5% SS | C60B40 | 3.7 | 0.3 | 5.4 | 0.3 | 5.2 | 0.2 | 7.1 | 0.1 |
| C50B10S40 | 3.6 | 0.2 | 5.9 | 0.3 | 7.4 | 0.2 | 9.3 | 0.1 | |
| C50B25S25 | 3.4 | 0.1 | 5.1 | 0.1 | 7.0 | 0.3 | 9.3 | 0.1 | |
| C50B40S10 | 2.9 | 0.2 | 5.1 | 0.1 | 6.0 | 0.4 | 8.6 | 0.1 | |
| 2.5% SS | C60B40 | 3.6 | 0.4 | 4.0 | 0.3 | 4.8 | 0.3 | 7.9 | 0.2 |
| C50B10S40 | 3.7 | 0.1 | 3.8 | 0.1 | 5.4 | 0.2 | 9.1 | 0.2 | |
| C50B25S25 | 3.4 | 0.2 | 6.0 | 0.2 | 8.4 | 0.6 | 10.6 | 0.1 | |
| C50B40S10 | 3.0 | 0.2 | 4.8 | 0.1 | 6.6 | 0.1 | 9.5 | 0.1 | |
| Mixture | 2 Days | 7 Days | 28 Days | 90 Days | |||||
|---|---|---|---|---|---|---|---|---|---|
| Mean | Std | Mean | Std | Mean | Std | Mean | Std | ||
| 0% SS | C100 | 25.2 | 1.2 | 45.5 | 0.8 | 56.4 | 2.1 | 66.1 | 0.8 |
| C50S50 | 9.8 | 0.2 | 24.7 | 1.5 | 47.1 | 1.5 | 62.1 | 2.7 | |
| C90B10 | 19.7 | 0.1 | 28.7 | 1.3 | 37.5 | 0.6 | 51.6 | 1.5 | |
| C75B25 | 13.6 | 0.2 | 23.0 | 1.5 | 36.8 | 1.2 | 36.9 | 2.0 | |
| C60B40 | 7.5 | 0.3 | 18.1 | 0.7 | 27.4 | 0.6 | 34.3 | 0.9 | |
| C50B10S40 | 8.4 | 0.2 | 22.3 | 0.4 | 40.8 | 0.9 | 57.5 | 1.2 | |
| C50B25S25 | 7.2 | 0.1 | 19.8 | 0.7 | 33.2 | 1.1 | 44.4 | 1.4 | |
| C50B40S10 | 7.4 | 0.1 | 15.1 | 0.8 | 25.3 | 1.1 | 35.0 | 0.7 | |
| 1.5% SS | C60B40 | 13.4 | 0.5 | 17.8 | 0.9 | 25.0 | 0.4 | 26.6 | 0.7 |
| C50B10S40 | 11.6 | 0.6 | 21.3 | 0.6 | 36.5 | 0.9 | 38.3 | 0.9 | |
| C50B25S25 | 12.2 | 0.1 | 20.7 | 0.6 | 31.6 | 0.8 | 36.3 | 0.2 | |
| C50B40S10 | 11.5 | 0.4 | 19.1 | 2.3 | 20.9 | 1.5 | 29.1 | 0.2 | |
| 2.5% SS | C60B40 | 12.5 | 0.8 | 15.7 | 0.6 | 20.5 | 0.7 | 30.4 | 0.7 |
| C50B10S40 | 11.8 | 0.6 | 15.5 | 0.3 | 21.0 | 0.8 | 42.2 | 1.7 | |
| C50B25S25 | 10.8 | 0.5 | 20.5 | 1.3 | 29.4 | 1.4 | 43.1 | 0.4 | |
| C50B40S10 | 9.3 | 0.4 | 15.5 | 0.7 | 22.4 | 1.3 | 33.5 | 0.4 | |
Disclaimer/Publisher’s Note: The statements, opinions and data contained in all publications are solely those of the individual author(s) and contributor(s) and not of MDPI and/or the editor(s). MDPI and/or the editor(s) disclaim responsibility for any injury to people or property resulting from any ideas, methods, instructions or products referred to in the content. |
© 2024 by the authors. Licensee MDPI, Basel, Switzerland. This article is an open access article distributed under the terms and conditions of the Creative Commons Attribution (CC BY) license (https://creativecommons.org/licenses/by/4.0/).
Share and Cite
Zou, Z.; Provoost, S.; Gruyaert, E. Utilization of Waste Brick Powder as a Partial Replacement of Portland Cement in Mortars. Sustainability 2024, 16, 624. https://doi.org/10.3390/su16020624
Zou Z, Provoost S, Gruyaert E. Utilization of Waste Brick Powder as a Partial Replacement of Portland Cement in Mortars. Sustainability. 2024; 16(2):624. https://doi.org/10.3390/su16020624
Chicago/Turabian StyleZou, Zhuomin, Samuel Provoost, and Elke Gruyaert. 2024. "Utilization of Waste Brick Powder as a Partial Replacement of Portland Cement in Mortars" Sustainability 16, no. 2: 624. https://doi.org/10.3390/su16020624