
A Desktop Assessment of Ozone Micro-Nanobubble Technology for Algae and PFAS Removal from Surface Water Bodies Using Open-Source Water Quality Data
 , , , , and
Abstract
:
1. Introduction
2. Methodology
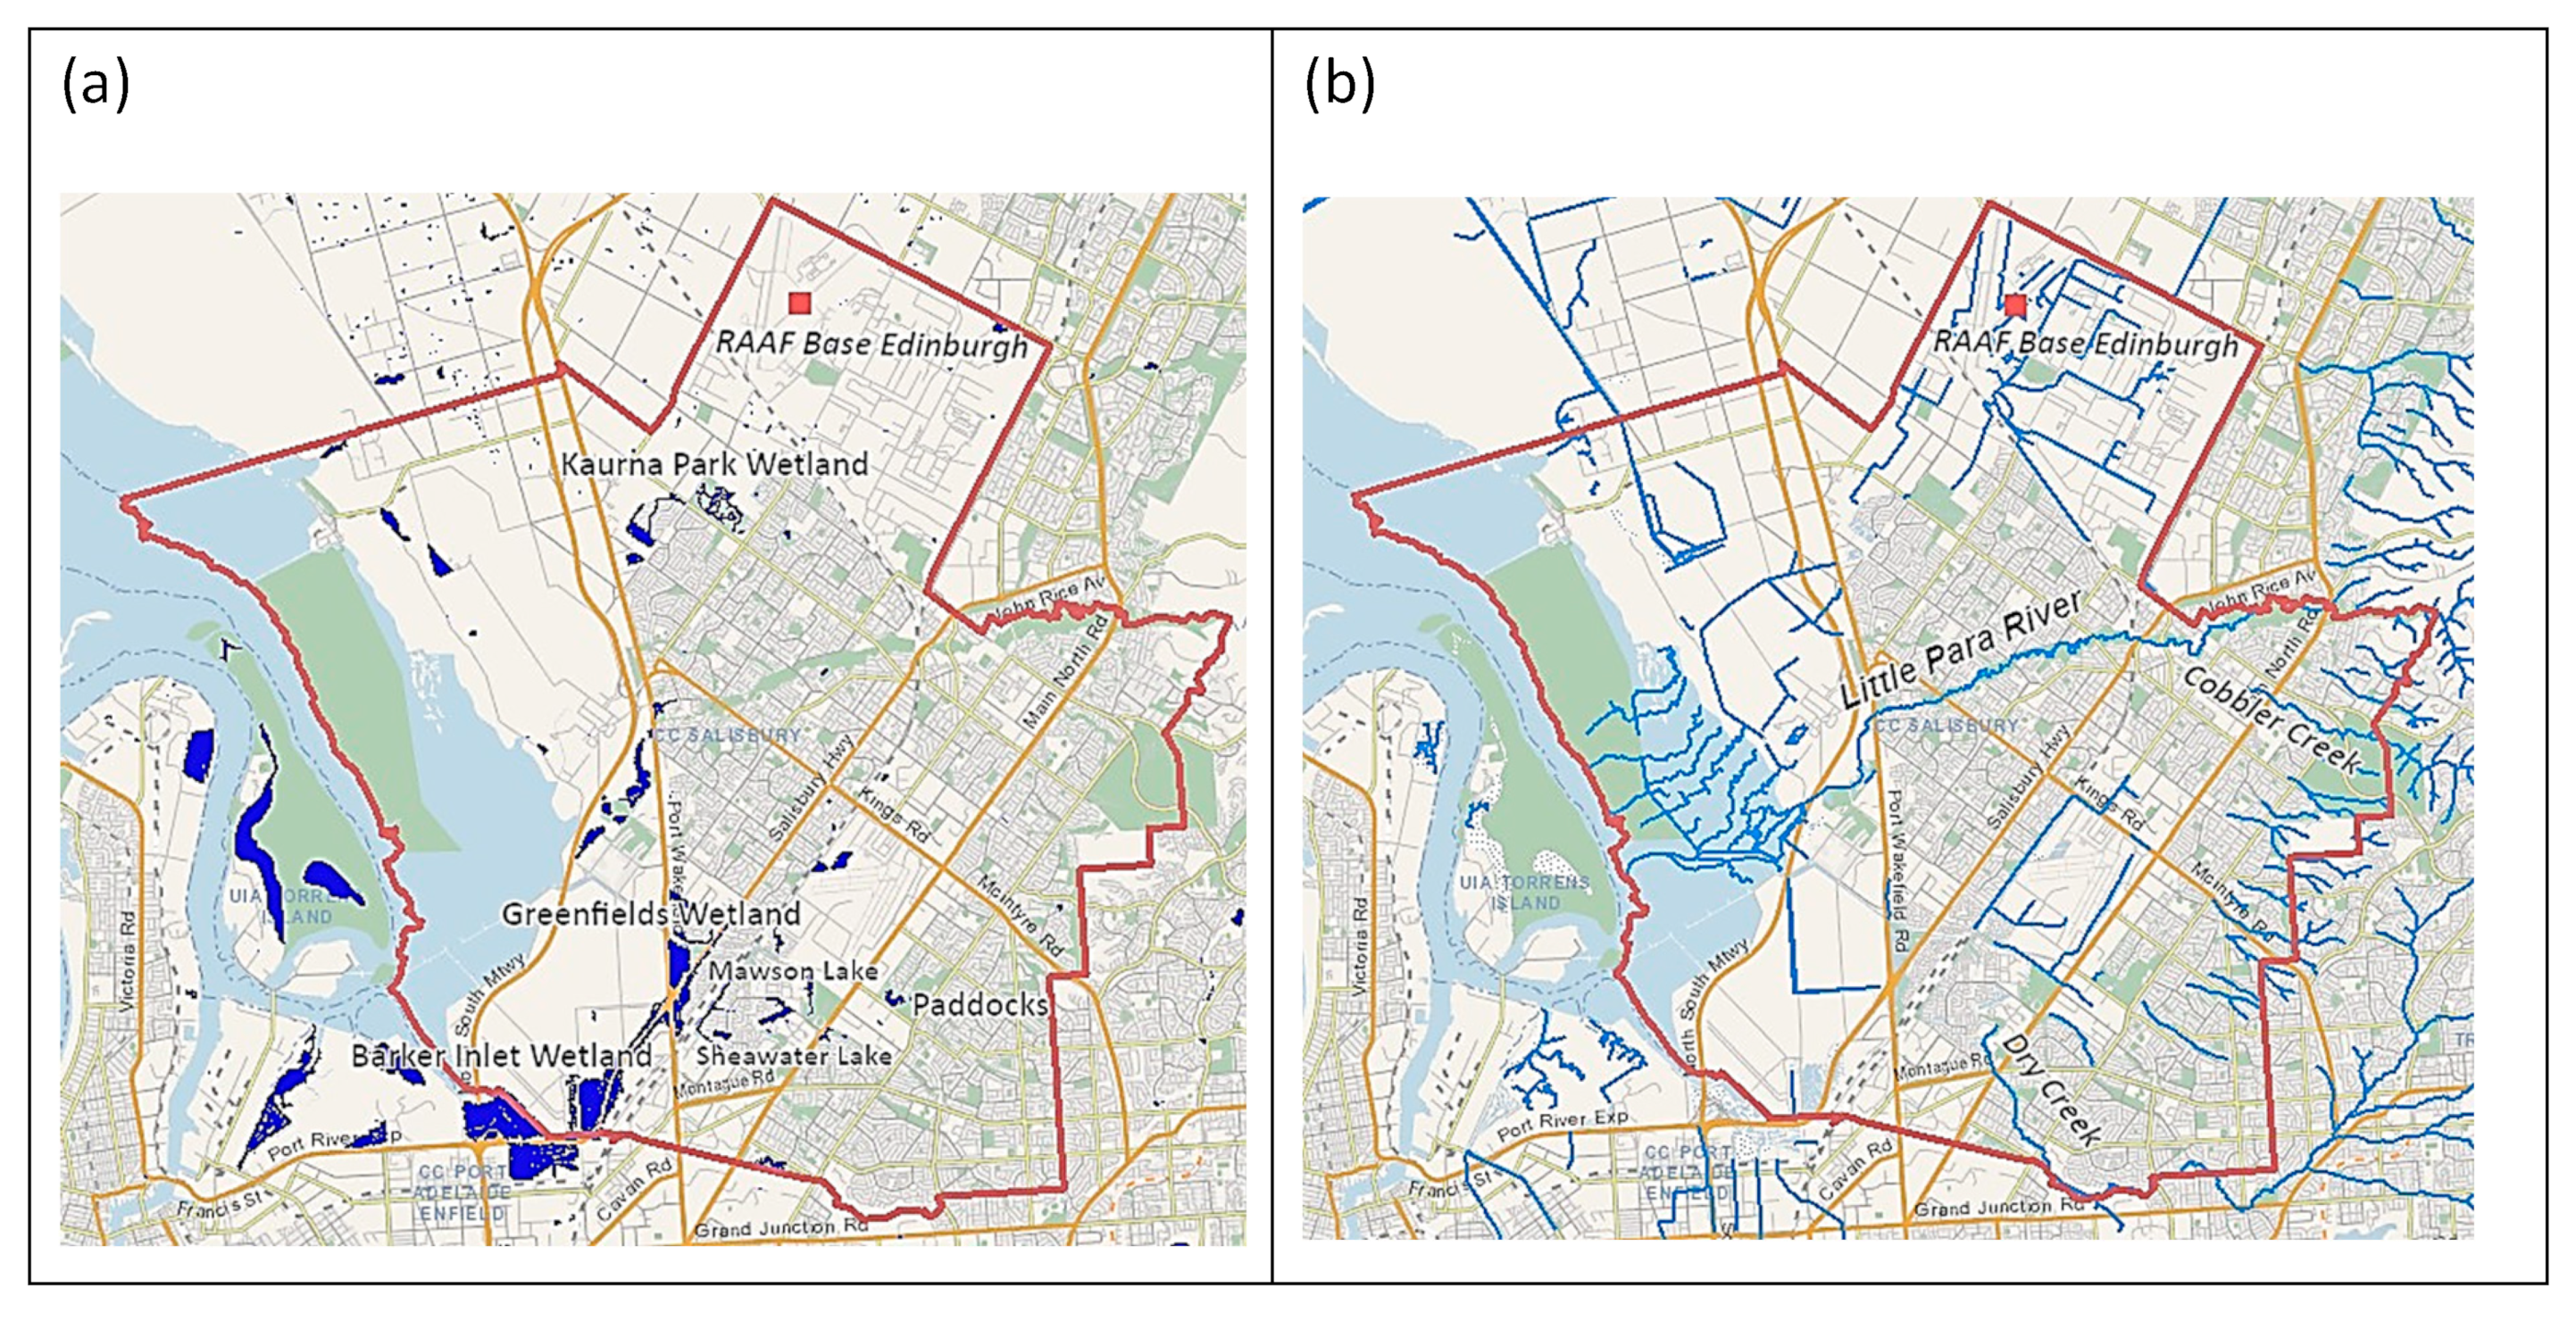
2.1. Case Study Site
2.2. Data Collection
- Step 1—Identifying surface water bodies.
- City of Salisbury.
- Google Maps and Google Earth.
- Nature Maps—Department of Environment and Water.
- Geoscience Australia.
- Step 2—Obtaining water quality parameters.
- Goyder Institute.
- Water Connect.
- Water Data SA.
- Nature Maps—Department for Environment and Water.
- Green Adelaide.
- EPA Aquatic Ecosystem Condition Reports.
- Reports on the Parafield Airport and Edinburgh RAAF Base.
- Step 3—Literature review of PFAS and algae control.
- University of South Australia Online Library.
- Google Scholar.
- Goyder Institute.
- Water Connect.
- Case studies conducted by commercially available micro-nanobubble generators.
- Literature Review.
- Step 4—Identifying comparable parameters.
- DO in mg/L.
- pH.
- Temperature in °C.
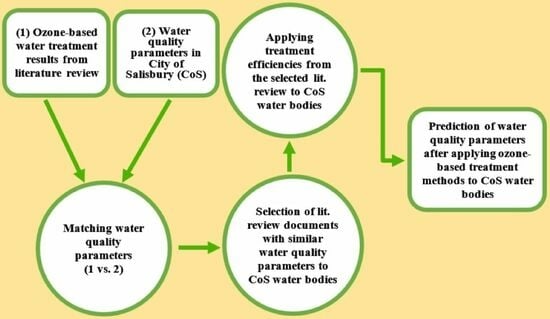
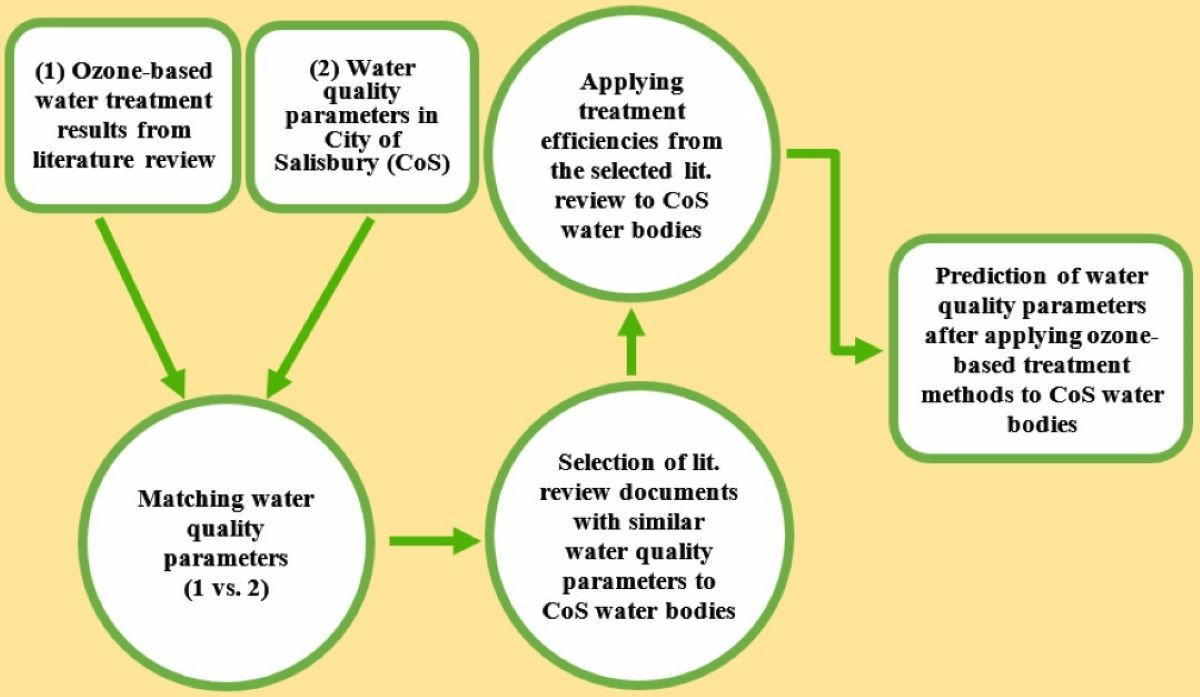
2.3. Data Analysis
3. Results and Discussion
3.1. Overview of Water Bodies in the City of Salisbury
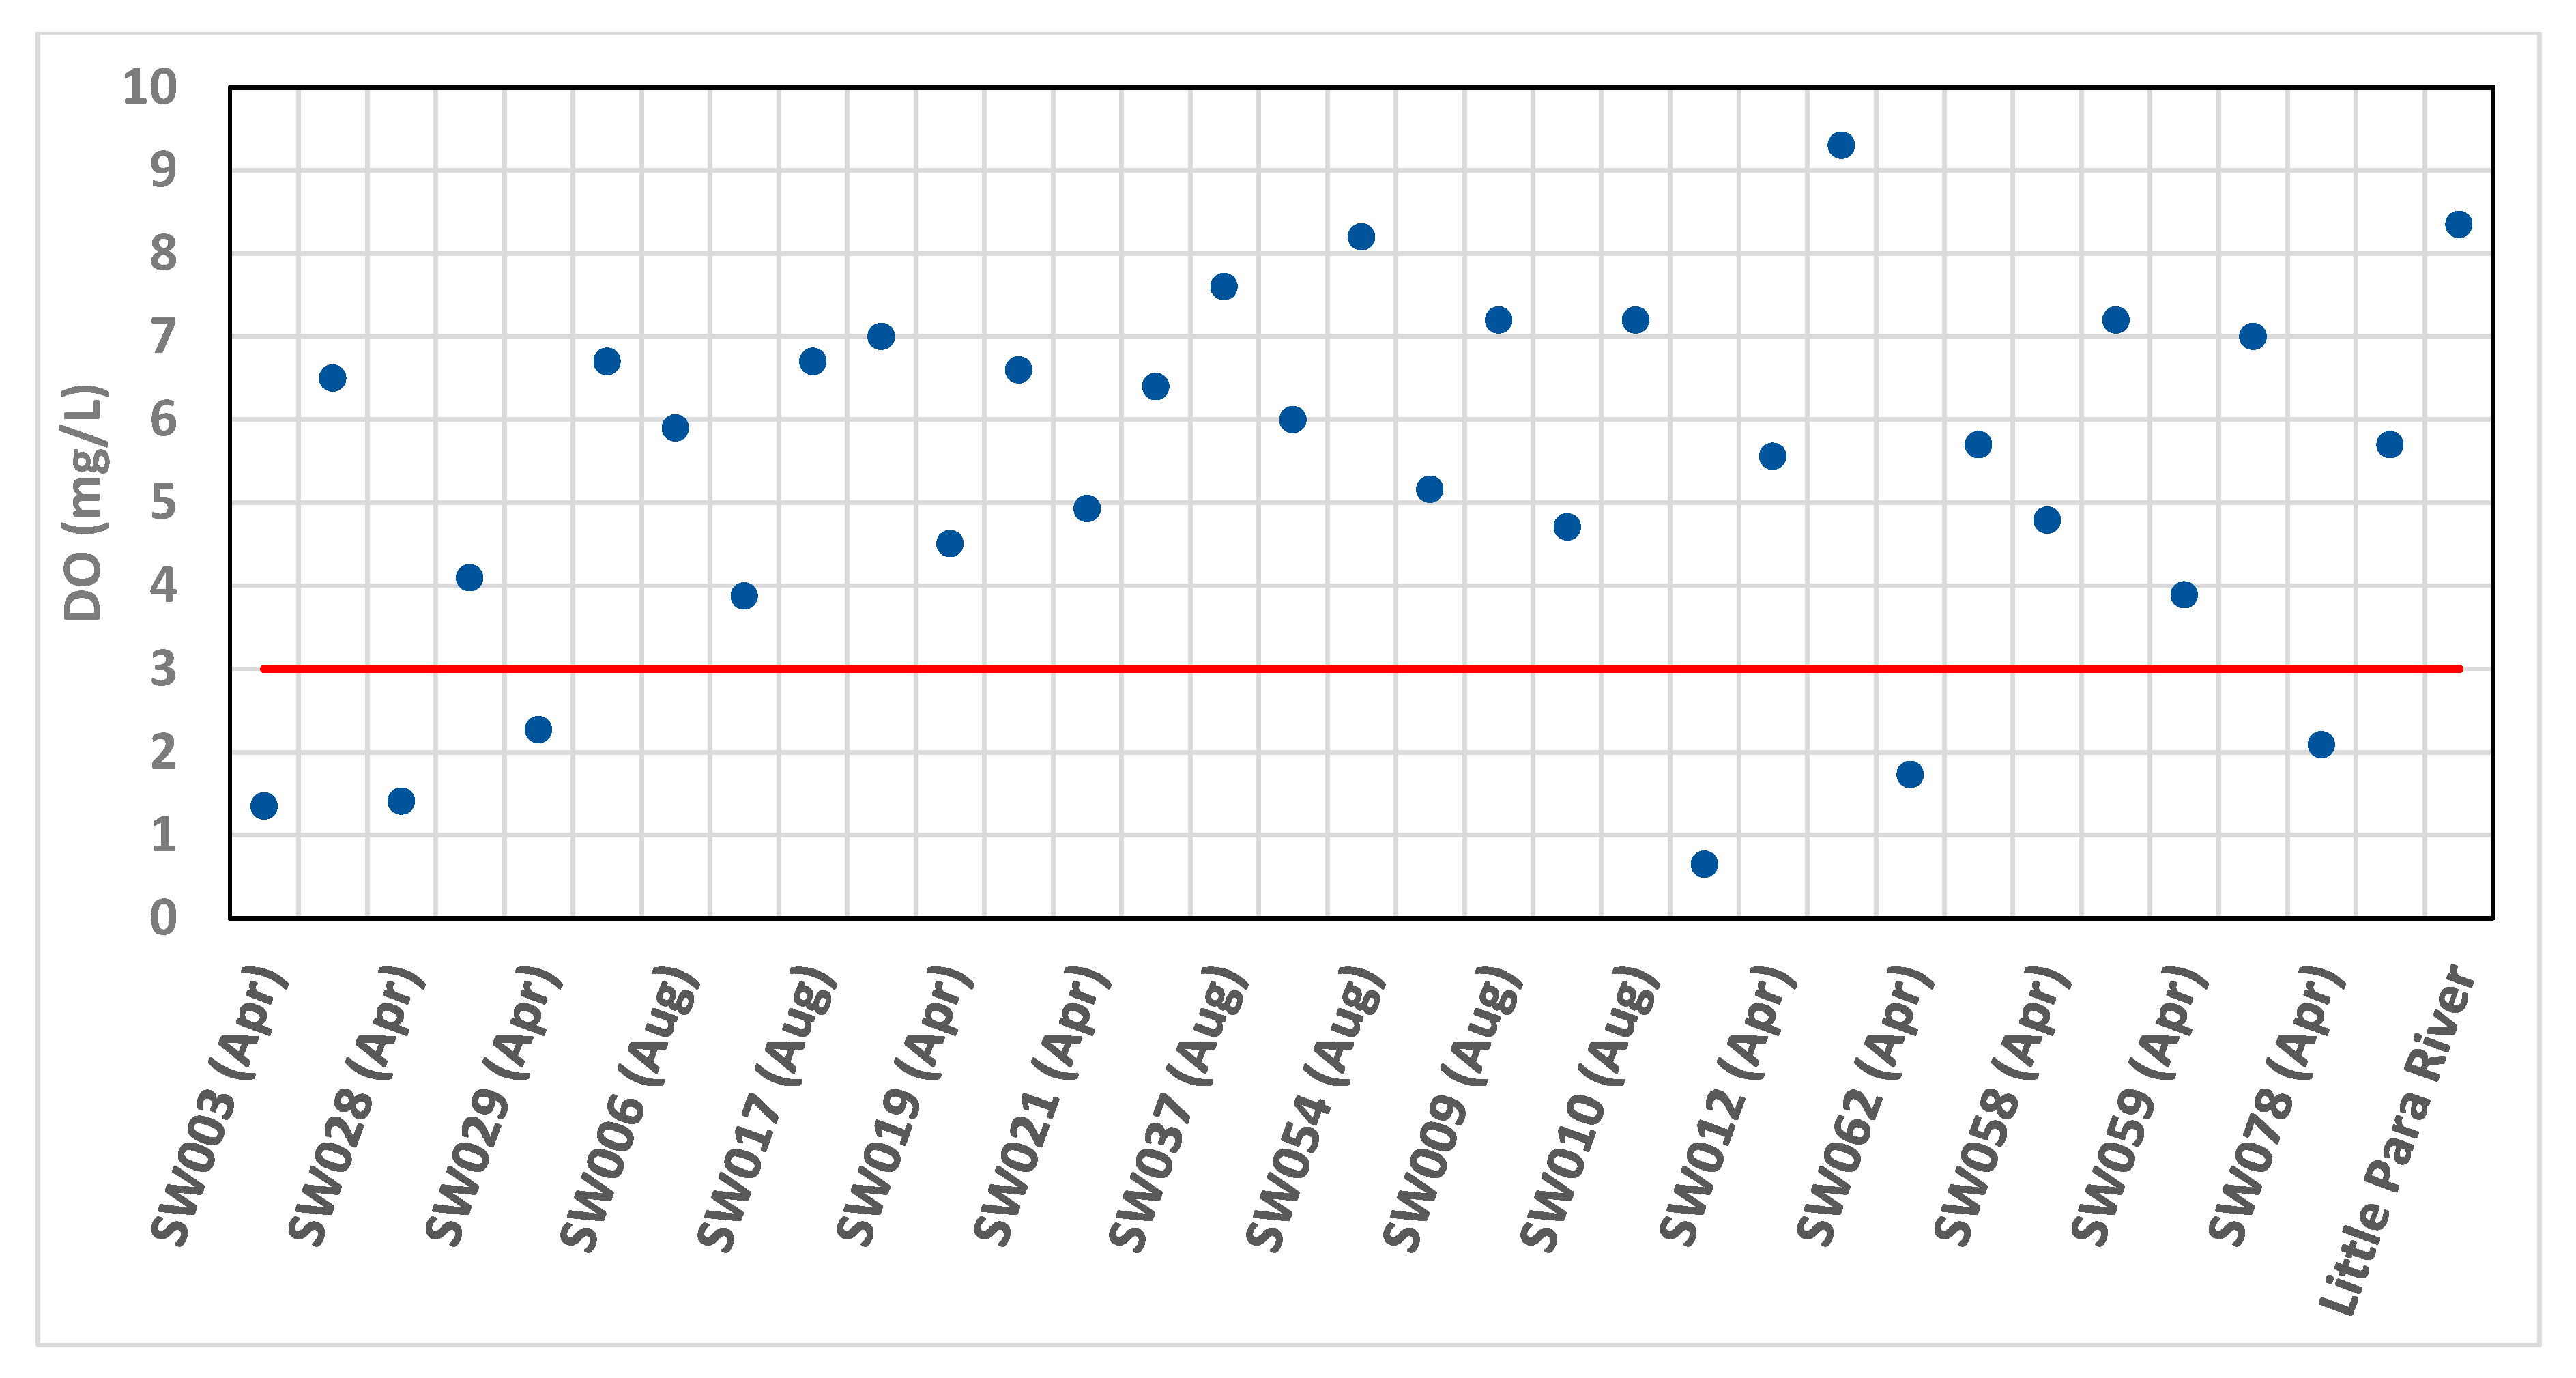
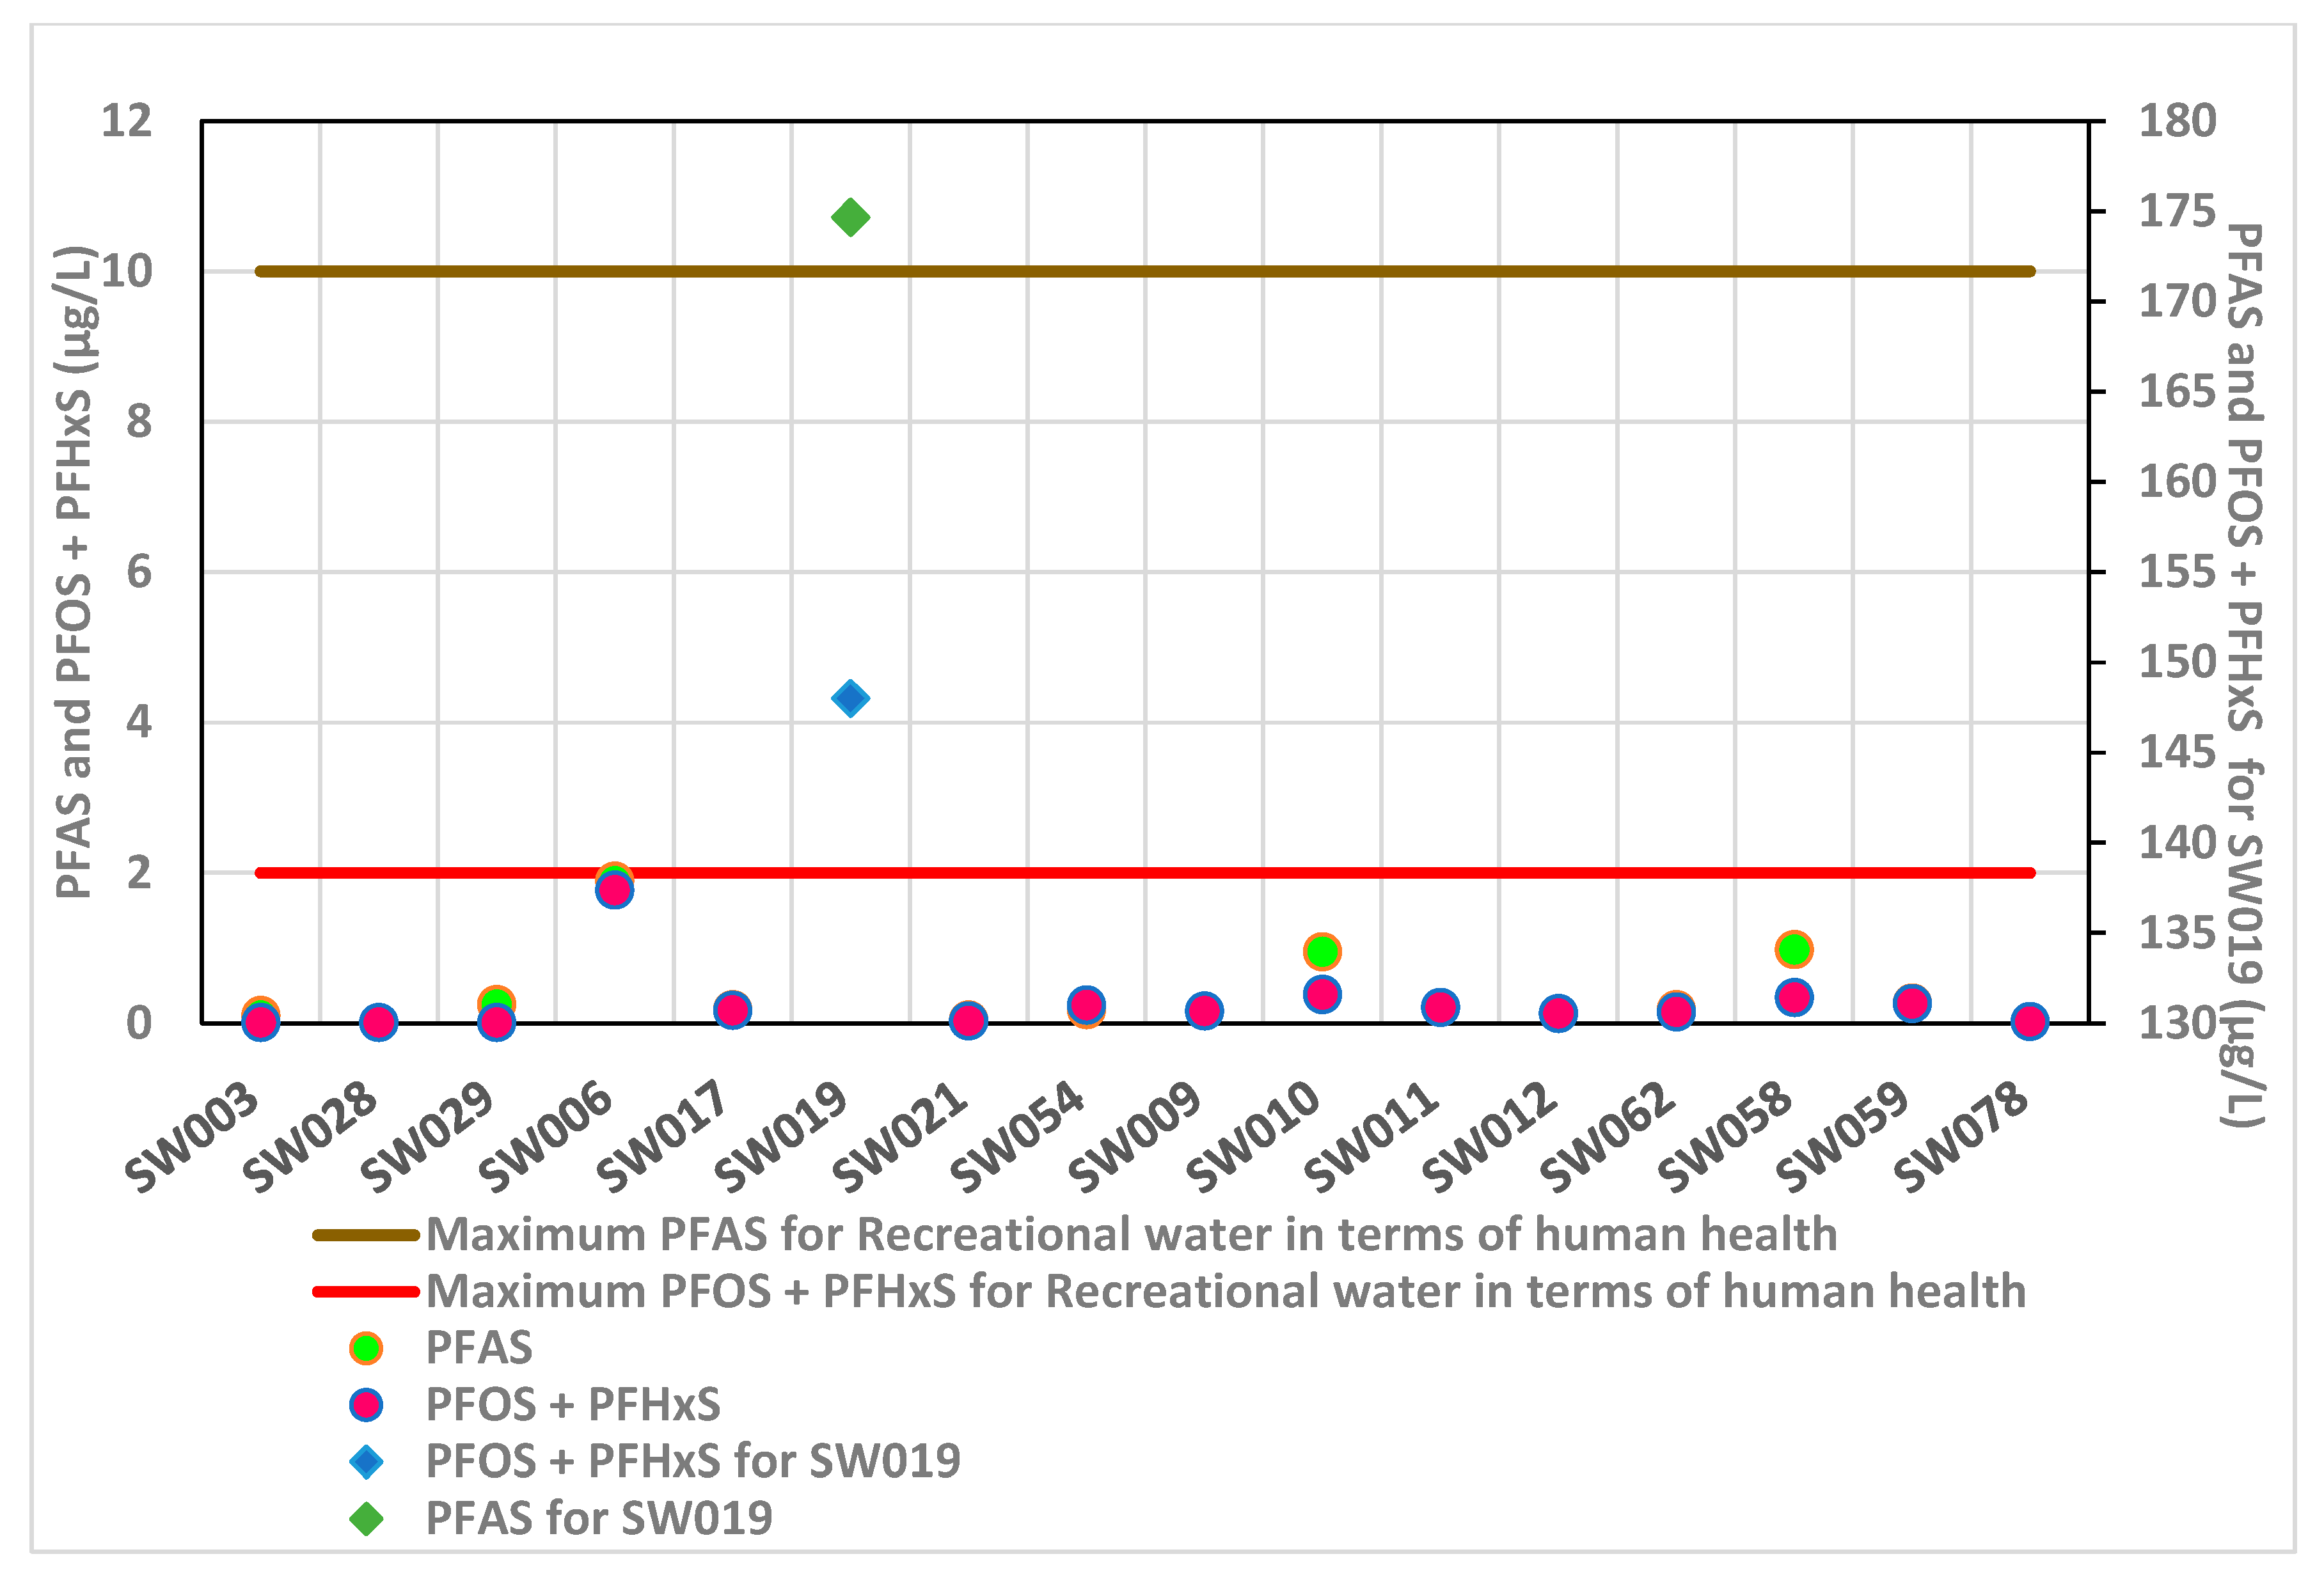
3.2. Overview of Surface Water Quality and Other Parameters
3.3. Utilisation of Literature Case Study Results
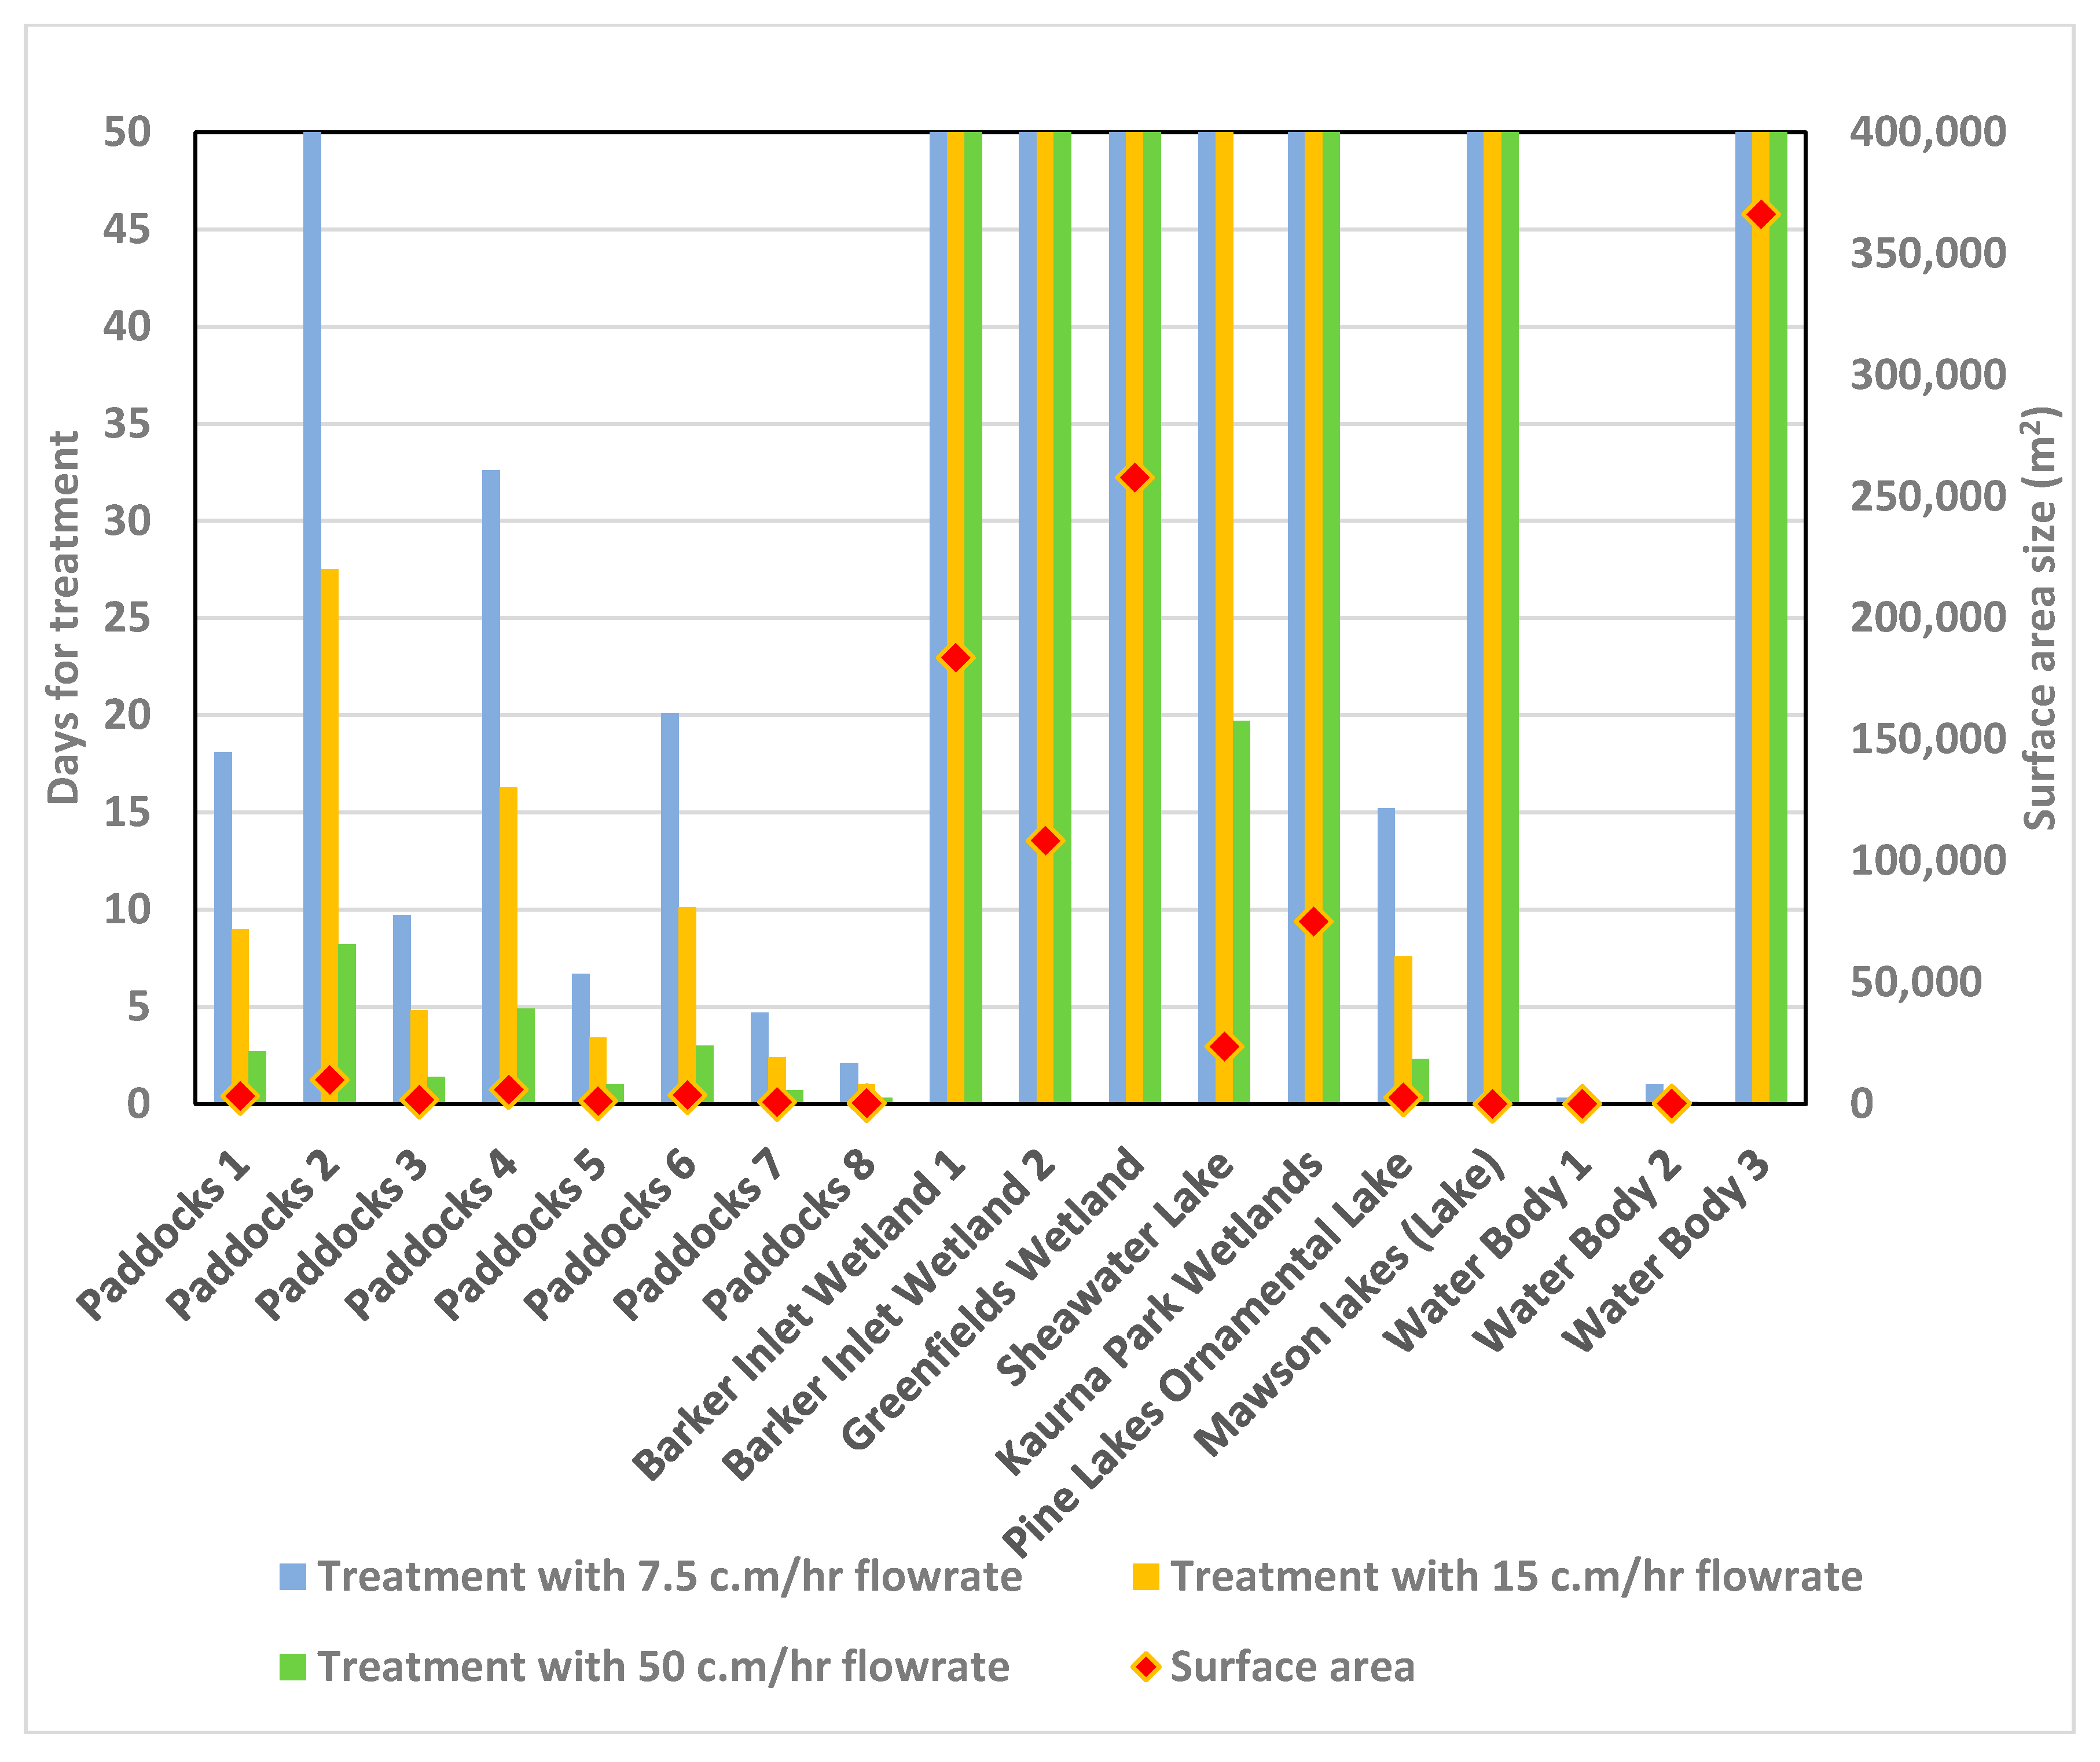
3.4. Scalability of the Proposed Treatment
4. Conclusions
Supplementary Materials
Author Contributions
Funding
Institutional Review Board Statement
Informed Consent Statement
Data Availability Statement
Acknowledgments
Conflicts of Interest
References
- Petersen, L.; Heynen, M.; Pellicciotti, F. Freshwater Resources: Past, Present, Future. In International Encyclopedia of Geography: People, the Earth, Environment and Technology; Richardson, D., Castree, N., Goodchild, M.F., Kobayashi, A., Liu, W., Marston, R.A., Eds.; John Wiley & Sons, Ltd.: Hoboken, NJ, USA, 2017. [Google Scholar]
- Radcliffe, J.C.; Page, D. Water Reuse and Recycling in Australia—History, Current Situation and Future Perspectives. Water Cycle 2020, 1, 19–40. [Google Scholar] [CrossRef]
- Crini, G.; Lichtfouse, E. Advantages and disadvantages of techniques used for wastewater treatment. Environ. Chem. Lett. 2019, 17, 145–155. [Google Scholar] [CrossRef]
- World Health Organization. Sanitation. 2023. Available online: https://www.who.int/news-room/fact-sheets/detail/sanitation (accessed on 10 January 2024).
- Osińska, A.; Korzeniewska, E.; Harnisz, M.; Felis, E.; Bajkacz, S.; Jachimowicz, P.; Niestępski, S.; Konopka, I. Small-scale wastewater treatment plants as a source of the dissemination of antibiotic resistance genes in the aquatic environment. J. Hazard. Mater. 2020, 381, 121221. [Google Scholar] [CrossRef] [PubMed]
- Nagarajan, D.; Lee, D.-J.; Varjani, S.; Lam, S.S.; Allakhverdiev, S.I.; Chang, J.-S. Microalgae-Based Wastewater Treatment—Microalgae-Bacteria Consortia, Multi-Omics Approaches and Algal Stress Response. Sci. Total Environ. 2022, 845, 157110. [Google Scholar] [CrossRef] [PubMed]
- Sydney Water. Wastewater Treatment. 2023. Available online: https://www.sydneywater.com.au/education/wastewater-recycling/wastewater-treatment.html (accessed on 13 June 2023).
- What Is a Harmful Algal Bloom? | National Oceanic and Atmospheric Administration. Available online: https://www.noaa.gov/what-is-harmful-algal-bloom (accessed on 22 December 2023).
- Bell, E.M.; De Guise, S.; McCutcheon, J.R.; Lei, Y.; Levin, M.; Li, B.; Rusling, J.F.; Lawrence, D.A.; Cavallari, J.M.; O’Connell, C.; et al. Exposure, Health Effects, Sensing, and Remediation of the Emerging PFAS Contaminants—Scientific Challenges and Potential Research Directions. Sci. Total Environ. 2021, 780, 146399. [Google Scholar] [CrossRef] [PubMed]
- Wanninayake, D.M. Comparison of currently available PFAS remediation technologies in water: A review. J. Environ. Manag. 2021, 283, 111977. [Google Scholar] [CrossRef]
- Naidu, R.; Nadebaum, P.; Fang, C.; Cousins, I.; Pennell, K.; Conder, J.; Newell, C.J.; Longpré, D.; Warner, S.; Crosbie, N.D.; et al. Per- and Poly-Fluoroalkyl Substances (PFAS): Current Status and Research Needs. Environ. Technol. Innov. 2020, 19, 100915. [Google Scholar] [CrossRef]
- Wietor, J.-L. The Universal PFAS Restriction; European Environmental Bureau: Brussels, Belgium, 2023. [Google Scholar]
- OECD. OECD/UNEP Global PFC Group, Synthesis Paper on Per- and Polyfluorinated Chemicals (PFCs), Environment, Health and Safety, Environment Directorate. 2013. Available online: https://web-archive.oecd.org/2017-08-02/250024-synthesis-paper-on-per-and-polyfluorinated-chemicals.htm (accessed on 25 November 2023).
- Banzhaf, S.; Filipovic, M.; Lewis, J.; Sparrenbom, C.J.; Barthel, R. A Review of Contamination of Surface-, Ground-, and Drinking Water in Sweden by Perfluoroalkyl and Polyfluoroalkyl Substances (PFASs). Ambio 2017, 46, 335–346. [Google Scholar] [CrossRef]
- Appleman, T.D.; Higgins, C.P.; Quiñones, O.; Vanderford, B.J.; Kolstad, C.; Zeigler-Holady, J.C.; Dickenson, E.R.V. Treatment of Poly- and Perfluoroalkyl Substances in U.S. Full-Scale Water Treatment Systems. Water Res. 2014, 51, 246–255. [Google Scholar] [CrossRef]
- Mukhopadhyay, R.; Sarkar, B.; Palansooriya, K.N.; Dar, J.Y.; Bolan, N.S.; Parikh, S.J.; Sonne, C.; Ok, Y.S. Natural and Engineered Clays and Clay Minerals for the Removal of Poly- and Perfluoroalkyl Substances from Water: State-of-the-Art and Future Perspectives. Adv. Colloid Interface Sci. 2021, 297, 102537. [Google Scholar] [CrossRef]
- Xu, P.; Chen, Y.; Gui, B.; Guo, X.; Zhang, J. Pilot Study on the Treatment of Lake Water with Algae by Ultrafiltration–Ozone–Biologically Activated Carbon. AQUA Water Infrastruct. Ecosyst. Soc. 2021, 70, 1192–1203. [Google Scholar] [CrossRef]
- City of Salisbury. Available online: https://www.salisbury.sa.gov.au/council/about-our-city-of-salisbury/quick-facts (accessed on 4 April 2023).
- JBS&G Australia Pty Ltd. Department of Defence RAAF Base Edinburgh Environmental Investigation of PFAS: Human Health Risk Assessment (HHRA) and Preliminary Ecological Risk Assessment (PERA)—Executive Summary; July 2019, 52234_120517 (Rev 0); JBS&G: Adelaide, SA, Australia, 2019. [Google Scholar]
- Parafield Airport Ltd. PFAS at Parafield Airport; Parafield Airport Ltd.: Adelaide, SA, Australia, 2018. [Google Scholar]
- El-taliawy, H.; Ekblad, M.; Nilsson, F.; Hagman, M.; Paxeus, N.; Jönsson, K.; Cimbritz, M.; la Cour Jansen, J.; Bester, K. Ozonation Efficiency in Removing Organic Micro Pollutants from Wastewater with Respect to Hydraulic Loading Rates and Different Wastewaters. Chem. Eng. J. 2017, 325, 310–321. [Google Scholar] [CrossRef]
- Selihin, N.M.; Tay, M.G. A Review on Future Wastewater Treatment Technologies: Micro-Nanobubbles, Hybrid Electro-Fenton Processes, Photocatalytic Fuel Cells, and Microbial Fuel Cells. Water Sci. Technol. 2022, 85, 319–341. [Google Scholar] [CrossRef] [PubMed]
- Wu, Q.-Y.; Yang, Z.-W.; Du, Y.; Ouyang, W.-Y.; Wang, W.-L. The Promotions on Radical Formation and Micropollutant Degradation by the Synergies between Ozone and Chemical Reagents (Synergistic Ozonation): A Review. J. Hazard. Mater. 2021, 418, 126327. [Google Scholar] [CrossRef] [PubMed]
- Department for Environment and Water South Australia. NatureMaps, Enviro Data SA. 2023. Available online: https://data.environment.sa.gov.au/NatureMaps/Pages/default.aspx (accessed on 5 May 2023).
- AECOM. Interpretive Report 2020: PFAS OMP—RAAF Base Edinburgh; AECOM: Adelaide, SA, Australia, 2021. [Google Scholar]
- EPA SA. EPA Aquatic Ecosystem Condition Report for Little Para River; Environmental Protection Agency: Adelaide, SA, Australia, 2011. [Google Scholar]
- Water Data Services. Available online: https://greenadelaide.waterdata.com.au/LatestData.aspx?sno=A5051022&Report=trOtherGraph (accessed on 29 November 2023).
- EPA US. Quality Criteria for Water; United States Environmental Protection Agency: Washington, DC, USA, 1976. [Google Scholar]
- EPA Victoria. Technical Information for the Victorian Guideline for Water Recycling. Victoria State Government. 2021. Available online: https://www.epa.vic.gov.au/about-epa/publications/1911-2 (accessed on 8 June 2023).
- NHMRC. Guidance on PFAS in Recreational Water; National Health and Medical Research Council: Canberra, Australia, 2019. [Google Scholar]
- HEPA. PFAS National Environmental Plan Version 2.0 (PFAS NEMP 2.0); Heads of EPAs Australia and New Zealand (HEPA): Melbourne, Australia, 2020. [Google Scholar]
- Chen, J.-J.; Yeh, H.-H.; Tseng, I.C. Effect of Ozone and Permanganate on Algae Coagulation Removal—Pilot and Bench Scale Tests. Chemosphere 2009, 74, 840–846. [Google Scholar] [CrossRef]
- Ng, P.H.; Huang, Q.; Huang, L.; Cheng, T.H.; Man, K.Y.; Cheng, K.P.; Rita, P.M.A.; Zhang, J.; St-Hilaire, S. Assessment of Ozone Nanobubble Technology to Reduce Freshwater Algae. Aquac. Res. 2023, 2023, 9539102. [Google Scholar] [CrossRef]
- Anders, O.; Beesley, K.; Fanberg, L.; Frie, A.; Markee, T.; Schaefer, H.; Polkinghorne, C.; Prihoda, K.; Saillard, H.; TenEyck, M. Tests of the Nano Bubble Ozone Technology (2.5 Hp Unit); University of Wisconsin-Superior: Superior, WI, USA, 2020. [Google Scholar]
- Kalogerakis, N.; Kalogerakis, G.C.; Botha, Q.P. Environmental Applications of Nanobubble Technology: Field Testing at Industrial Scale. Can. J. Chem. Eng. 2021, 99, 2345–2354. [Google Scholar] [CrossRef]
- Moleaer. Nanobubbles Naturally Oxygenate and Oxidize Algae Blooms at Private Golf Club. 2018. Available online: https://www.moleaer.com/resources/case-study-private-golf-club-florida (accessed on 5 May 2023).
- Dai, X.; Xie, Z.; Dorian, B.; Gray, S.; Zhang, J. Comparative Study of PFAS Treatment by UV, UV/Ozone, and Fractionations with Air and Ozonated Air. Environ. Sci. Water Res. Technol. 2019, 5, 1897–1907. [Google Scholar] [CrossRef]
- Franke, V.; Schäfers, M.D.; Lindberg, J.J.; Ahrens, L. Removal of Per- and Polyfluoroalkyl Substances (PFASs) from Tap Water Using Heterogeneously Catalyzed Ozonation. Environ. Sci. Water Res. Technol. 2019, 5, 1887–1896. [Google Scholar] [CrossRef]
- Rositano, J.; Newcombe, G.; Nicholson, B.; Sztajnbok, P. Ozonation of Nom and Algal Toxins in Four Treated Waters. Water Res. 2001, 35, 23–32. [Google Scholar] [CrossRef]
- Zanacic, E.; Stavrinides, J.; McMartin, D.W. Field-Analysis of Potable Water Quality and Ozone Efficiency in Ozone-Assisted Biological Filtration Systems for Surface Water Treatment. Water Res. 2016, 104, 397–407. [Google Scholar] [CrossRef]
- Linder, K.; Meyer, K. Algae Removal Strategies. In Algae: Source to Treatment—Manual of Water Supply Practices, M57; American Water Works Association (AWWA): Washington, DC, USA, 2010; pp. 395–414. [Google Scholar]
- Moleaer. Solitude Lake Management for a 1.3 Acre Pond, Naples, Florida. 2018. Available online: https://www.solitudelakemanagement.com/case-study-nanobubble-aeration-florida-lake/ (accessed on 5 May 2023).
- Khan, P.; Zhu, W.; Huang, F.; Gao, W.; Khan, N.A. Micro-Nanobubble Technology and Water-Related Application. Water Supply 2020, 20, 2021–2035. [Google Scholar] [CrossRef]
- John, A.; Brookes, A.; Carra, I.; Jefferson, B.; Jarvis, P. Microbubbles and Their Application to Ozonation in Water Treatment: A Critical Review Exploring Their Benefit and Future Application. Crit. Rev. Environ. Sci. Technol. 2022, 52, 1561–1603. [Google Scholar] [CrossRef]
- Hu, L.; Xia, Z. Application of Ozone Micro-Nano-Bubbles to Groundwater Remediation. J. Hazard. Mater. 2018, 342, 446–453. [Google Scholar] [CrossRef]
- Zhao, Z.; Sun, W.; Ray, M.B.; Ray, A.K.; Huang, T.; Chen, J. Optimization and Modeling of Coagulation-Flocculation to Remove Algae and Organic Matter from Surface Water by Response Surface Methodology. Front. Environ. Sci. Eng. 2019, 13, 75. [Google Scholar] [CrossRef]
- Thompson, J.; Eaglesham, G.; Reungoat, J.; Poussade, Y.; Bartkow, M.; Lawrence, M.; Mueller, J.F. Removal of PFOS, PFOA and Other Perfluoroalkyl Acids at Water Reclamation Plants in South East Queensland Australia. Chemosphere 2011, 82, 9–17. [Google Scholar] [CrossRef]
- Mousavi, S.M.S.; Dehghanzadeh, R.; Ebrahimi, S.M. Comparative Analysis of Ozonation (O3) and Activated Carbon Catalyzed Ozonation (ACCO) for Destroying Chlorophyll a and Reducing Dissolved Organic Carbon from a Eutrophic Water Reservoir. Chem. Eng. J. 2017, 314, 396–405. [Google Scholar] [CrossRef]
- Lin, A.Y.C.; Panchangam, S.C.; Chang, C.H.; Hong, P.K.A.; Hsueh, H.F. Removal of Perluorooctanoic Acid and Perfluooctance Sulfonate via Ozonation under Alkaline Condition. J. Hazard. Mater. 2012, 243, 272–277. [Google Scholar] [CrossRef]
- Nam, G.; Mohamed, M.M.; Jung, J. Novel Treatment of Microcystis Aeruginosa Using Chitosan-Modified Nanobubbles. Environ. Pollut. 2022, 292, 118458. [Google Scholar] [CrossRef]
- Pan, G.; Miao, X.; Bi, L.; Zhang, H.; Wang, L.; Wang, L.; Wang, Z.; Chen, J.; Ali, J.; Pan, M.; et al. Modified Local Soil (MLS) Technology for Harmful Algal Bloom Control, Sediment Remediation, and Ecological Restoration. Water 2019, 11, 1123. [Google Scholar] [CrossRef]
- Zhang, M.; Wang, Y.; Wu, X.; Kang, Z.; Zhang, D.; Pan, X. Potential of Ozone Micro-Bombs in Simultaneously Fast Removing Bloom-Forming Cyanobacteria and in Situ Degrading Microcystins. Chem. Eng. J. 2021, 407, 127186. [Google Scholar] [CrossRef]


| Location | DO (mg/L) | EC (µS/cm) | pH | Temp (°C) | Reference |
|---|---|---|---|---|---|
| North of (off-base) Edinburgh RAAF Base | 1.35–6.5 | 155–301.4 | 6.21–7.44 | 11.2–18.9 | [25] |
| Edinburgh RAAF Base | 3.88–8.2 | 113–318.6 | 6.34–8.36 | 11.1–20.8 | |
| South of (off-base) Edinburgh RAAF Base | 0.35–9.3 | 103.3–454.2 | 6.73–8.15 | 13.0–22.2 | |
| Kaurna Park Wetland | 2.09–7.2 | 82.5–586 | 6.65–8.07 | 13.8–22.1 | |
| Little Para River, Burton | 8.35 | 781 | 7.61 | 18.7 | [26] |
| Little Para River, Salisbury Downs | 6.05–7.49 | 285–340 | 7.05–7.45 | 11.45–24.0 | [26] |
| A5051022—Adams Creek d/s | - | - | - | 6–46 | [27] |
| Range | 0.35–9.3 | 82.5–781 | 6.21–8.36 | 6–46 | |
| Required Standard | >3 | 150–500 | 6.5–9.5 | - | [28] |
| Algae Reduction Using Ozonation | Temperature (°C) | pH | DO (mg/L) | Reference |
|---|---|---|---|---|
| 93% | 16.6–31.3 | - | - | [32] |
| 95.9% | - | 7.9 | - | [17] |
| Algae Reduction Using Ozonation + MNBT | Temperature (°C) | pH | DO (mg/L) | Reference |
| 96% | 18.5–24.1 | - | - | [33] |
| 100% | 15–28 | 6.5–9 | 4–12 | [34] |
| DO increase from 4 to 6.1 mg/L | - | - | 4 | [35] |
| DO increase from 1 to 8 mg/L | 26–32 | - | 1 | [36] |
| PFAS Reduction Using Ozonation | Temperature (°C) | pH | DO (mg/L) | Reference |
| 95% | 22.5 | - | - | [37] |
| 77% | 22 | 7.5 | - | [38] |
Disclaimer/Publisher’s Note: The statements, opinions and data contained in all publications are solely those of the individual author(s) and contributor(s) and not of MDPI and/or the editor(s). MDPI and/or the editor(s) disclaim responsibility for any injury to people or property resulting from any ideas, methods, instructions or products referred to in the content. |
© 2024 by the authors. Licensee MDPI, Basel, Switzerland. This article is an open access article distributed under the terms and conditions of the Creative Commons Attribution (CC BY) license (https://creativecommons.org/licenses/by/4.0/).
Share and Cite
Aber, S.; Aguada, R.; Marasinghe, R.; Chow, C.W.K.; Rameezdeen, R.; Xing, K. A Desktop Assessment of Ozone Micro-Nanobubble Technology for Algae and PFAS Removal from Surface Water Bodies Using Open-Source Water Quality Data. Sustainability 2024, 16, 668. https://doi.org/10.3390/su16020668
Aber S, Aguada R, Marasinghe R, Chow CWK, Rameezdeen R, Xing K. A Desktop Assessment of Ozone Micro-Nanobubble Technology for Algae and PFAS Removal from Surface Water Bodies Using Open-Source Water Quality Data. Sustainability. 2024; 16(2):668. https://doi.org/10.3390/su16020668
Chicago/Turabian StyleAber, Soheil, Rachelle Aguada, Randimal Marasinghe, Christopher W. K. Chow, Raufdeen Rameezdeen, and Ke Xing. 2024. "A Desktop Assessment of Ozone Micro-Nanobubble Technology for Algae and PFAS Removal from Surface Water Bodies Using Open-Source Water Quality Data" Sustainability 16, no. 2: 668. https://doi.org/10.3390/su16020668