1. Introduction
The world faces various problems, such as energy crisis, ecological damage, and climate warming. The energy used in the building industry accounts for about 40% of the global energy consumption, and improving the energy efficiency of buildings has positively impacted the environment and the economy. The IPCC suggests the reduction in the demand for end-of-build energy use from 8% to 14% by 2030 [
1], and based on the importance of this goal, China has proposed a “dual-carbon” strategy and made adjustments to the energy structure of buildings, in which the energy consumption level of residential buildings accounts for 21% of the national total energy consumption level. According to the “China Building Energy Consumption and Carbon Emission Research Report (2022)”, in 2022, rural buildings consumed 230 million tons of standard coal, accounting for approximately 21% of the total energy consumption of civil buildings in the nation [
2]. Due to the lack of scientific guidance and outdated construction models, energy consumption in rural buildings remains high. The optimization of energy saving in existing rural dwellings is a critical aspect for achieving carbon neutrality and peak carbon in the building industry [
3].
As China’s economy continues to develop and the national standard of living continues to improve, the changes associated with it are the production and lifestyles of rural residents and their behavioral patterns. The focus of most family life functions changes to living. This change has increased demand for rural residents’ living environment and housing functions. Nowadays, most newly built farmhouses only focus on appearance and neglect function, resulting in the conflict between the residential building space and the occupants’ lifestyle and between the architectural appearance and the aesthetic norms [
4]. On the one hand, this cannot meet the residents’ demand for the use of residential space, and on the other hand, it also makes the residents increasingly dependent on the indoor air-conditioning system. Therefore, it is crucial to accelerate the scientific development of rural residential architecture by scientific renewal and the construction of rural residences.
1.1. Performance Problems of Rural Residential Buildings
Most of China’s rural residential buildings use the millennia-old “Qin brick and Han tile” construction method, with more than 90% of them consisting of fired clay bricks or concrete hollow blocks as the main structure [
5]. The traditional form of village enclosure structure has no thermal insulation materials. The thermal insulation performance is poor, resulting in a high energy consumption in the use phase of the building, and the energy cost correspondingly increases. Generally speaking, the energy consumption of rural residential buildings is mainly due to the energy used in daily life, such as cooling, heating, lighting, cooking, and other energy-intensive electrical equipment [
6].
In addition, space heating and cooling are significant contributors to energy-related carbon emissions [
7,
8], and heating is the leading cause of energy consumption in rural buildings in Northern China [
9]. To reduce the energy consumption of rural residential buildings, many scholars have provided some adjustment suggestions for building planning and design, enclosure structure, renewable energy utilization, and the analysis of occupancy behavior [
10]. In contrast, people continue paying attention to the indoor thermal environment of rural buildings. For example, Jermyn D. et al. [
11] conducted comprehensive optimization designs on typical residential models, achieving the most significant optimization effects in the building envelope and heating equipment, with the highest energy savings reaching up to 80%. Zhang Yi et al. [
12] analyzed the thermal environment of the traditional farmhouse and the modern farmhouse in the northern part of Jiangsu Province by comparing and contrasting the traditional farmhouse with the modern farmhouse and found that the traditional farmhouse enclosure structure has better thermal stability and has a more significant advantage in terms of thermal insulation in the summer. Asadi E. et al. [
13] proposed that the optimization of building envelope structures should pursue the best economic efficiency and a lower energy consumption while fulfilling the residents’ living requirements. The studies mentioned above demonstrate that, owing to a deficiency in scientific design, numerous rural buildings manifest elevated levels of energy consumption (EC); however, the indoor thermal environment needs to attain the anticipated condition.
Due to the large per capita building area in the northern rural areas, residents have a high degree of freedom to use a particular room or outdoor patio, terrace, and other spaces. The research found that the residents use the farmhouse space for periods [
14]. The renewal design of rural residential buildings should fully consider the behavioral habits of residents and incorporate the comfort of the courtyard into the overall consideration. Relevant studies have shown that when it is necessary to turn on the air-conditioning indoors to improve the thermal environment, there are some periods when the thermal environment of the external space is still more pleasant, and residents may choose to stay outdoors [
15,
16,
17]. Therefore, improving the comfort of courtyards has an inextricable impact on reducing the energy consumption of rural residential buildings. This study aims to understand the current situation of rural residential buildings, provide solutions and suggestions for improving the comfort of rural residential building complexes, reduce environmental pollution caused by heating and cooling energy consumption, and provide the sustainable development of rural residential buildings.
1.2. Application of Optimization Methods
There are many influencing factors for building energy consumption, including building form parameters, envelope parameters, and shading measures, which have a nonlinear coupling effect on building energy consumption. The main task of the energy-saving retrofit of buildings is to find the best combination of energy-saving measures among many strategies. At the same time, energy-saving retrofit measures interact, meaning that a particular measure may significantly affect another measure or even achieve the opposite effect. Thus, simply and linearly adding up the effects of individual measures is not adequately accurate; hence, the decision-maker will face a multi-objective optimization problem, which describes multiple competing objective functions to evaluate feasible alternatives [
18].
With the continuous development of computer technology, an increasing number of scholars have investigated the application of multi-objective optimization algorithms in building energy efficiency. Some researchers focus on studying the optimization problem regarding computational and building design parameters. For example, Gao Yuan et al. [
19] combined the SPEA-2 optimization algorithm in Rhino-Grasshopper with Energy Plus to carry out multi-objective optimization design for multiple parameters such as orientation, depth, window-to-wall ratio, etc., for country houses. Vukadinović et al. [
20] used Design Builder software (2014) to optimize the window-to-wall ratio of passive houses and glass type, and other parameters were optimized and iterated using Latin hypercube sampling to determine the heating and cooling energy consumption of the two design scenarios. In addition, numerous studies on parameters such as building envelope and equipment systems exist. For example, Fabrizio et al. [
21] optimized thermal performance parameters such as wall thermal inertness, insulation thickness, and external window transmittance for a Mediterranean residential building envelope with the objectives of primary energy consumption and thermal discomfort hours. Carlucci et al. [
22] combined the GenOpt optimization engine with the Energy Plus simulation engine to perform a multi-objective optimization of a net-zero-energy Southern Italian residence for the multi-objective optimization of thermal discomfort in winter and summer and visual discomfort from glare and the amount of daylight.
1.3. Introduction of Machine Learning
However, traditional methods for the multi-objective optimization of building performance often require lengthy computation times and repeated adjustments of each physical building parameter. Various machine learning algorithms have been used in architecture recently, including support vector machines (SVM), random forests, artificial neural networks (ANN), and many others. In building performance optimization, machine learning algorithms, as a powerful tool, have been widely used in building design, energy consumption prediction, and comfort assessment. For example, Yan HA et al. [
23] integrated indoor and outdoor environmental data of an office building and used genetic algorithms and XG Boost algorithm for optimization and prediction in the early design phase of the office building. Marijana Zekic [
24] et al. compared an artificial neural network with two types of tree-structured regression models and tested three strategies based on the combination of these three models used to predict the effects, confirming the potential of hybrid machine learning methods. Guo J et al. [
25] used a GANN optimization process to complete the performance optimization of village houses in the cold regions of China using building energy consumption, UID, comfort time ratio, and energy saving cost as optimization objectives.
The paper of Chen-Liang Liu [
26] mentions that when training the relationship between power load and weather data, the hyperparameter c of auxiliary weights is introduced to fit the auxiliary regression, which turns the single-task regression into a multi-task one. The regression effect of the model is optimized by 21% compared with the single regression. This suggests that in the regression process of MLP, multiple objectives interact with each other and improve the regression fitting effect.
Through the compilation of related literature reviews, there are many studies on optimizing energy savings, thermal environment, and daylighting through building design. However, there need to be more studies on the optimization of the design of village residential buildings by comprehensively considering indoor and outdoor environments and performance. Thus, taking a rural residence in the Jinan area as a case study, this paper investigates the impact of architectural design parameters and envelope structure parameters on the residence’s energy efficiency, comfort, and economic viability. It proposes a method for the rapid prediction of building performance. By integrating MOO (multi-objective optimization) and ML (machine learning), this method establishes a predictive model for forecasting multiple objectives. It helps architects predict the performance of rural homes during retrofits and upgrades, provides decision support in the early stages of building design, and reduces decision costs. By enhancing the economic benefits of energy-efficient design as well as the living experience of residents, the goal of sustainable development is achieved in both economic and social dimensions.
1.4. Purpose of the Study
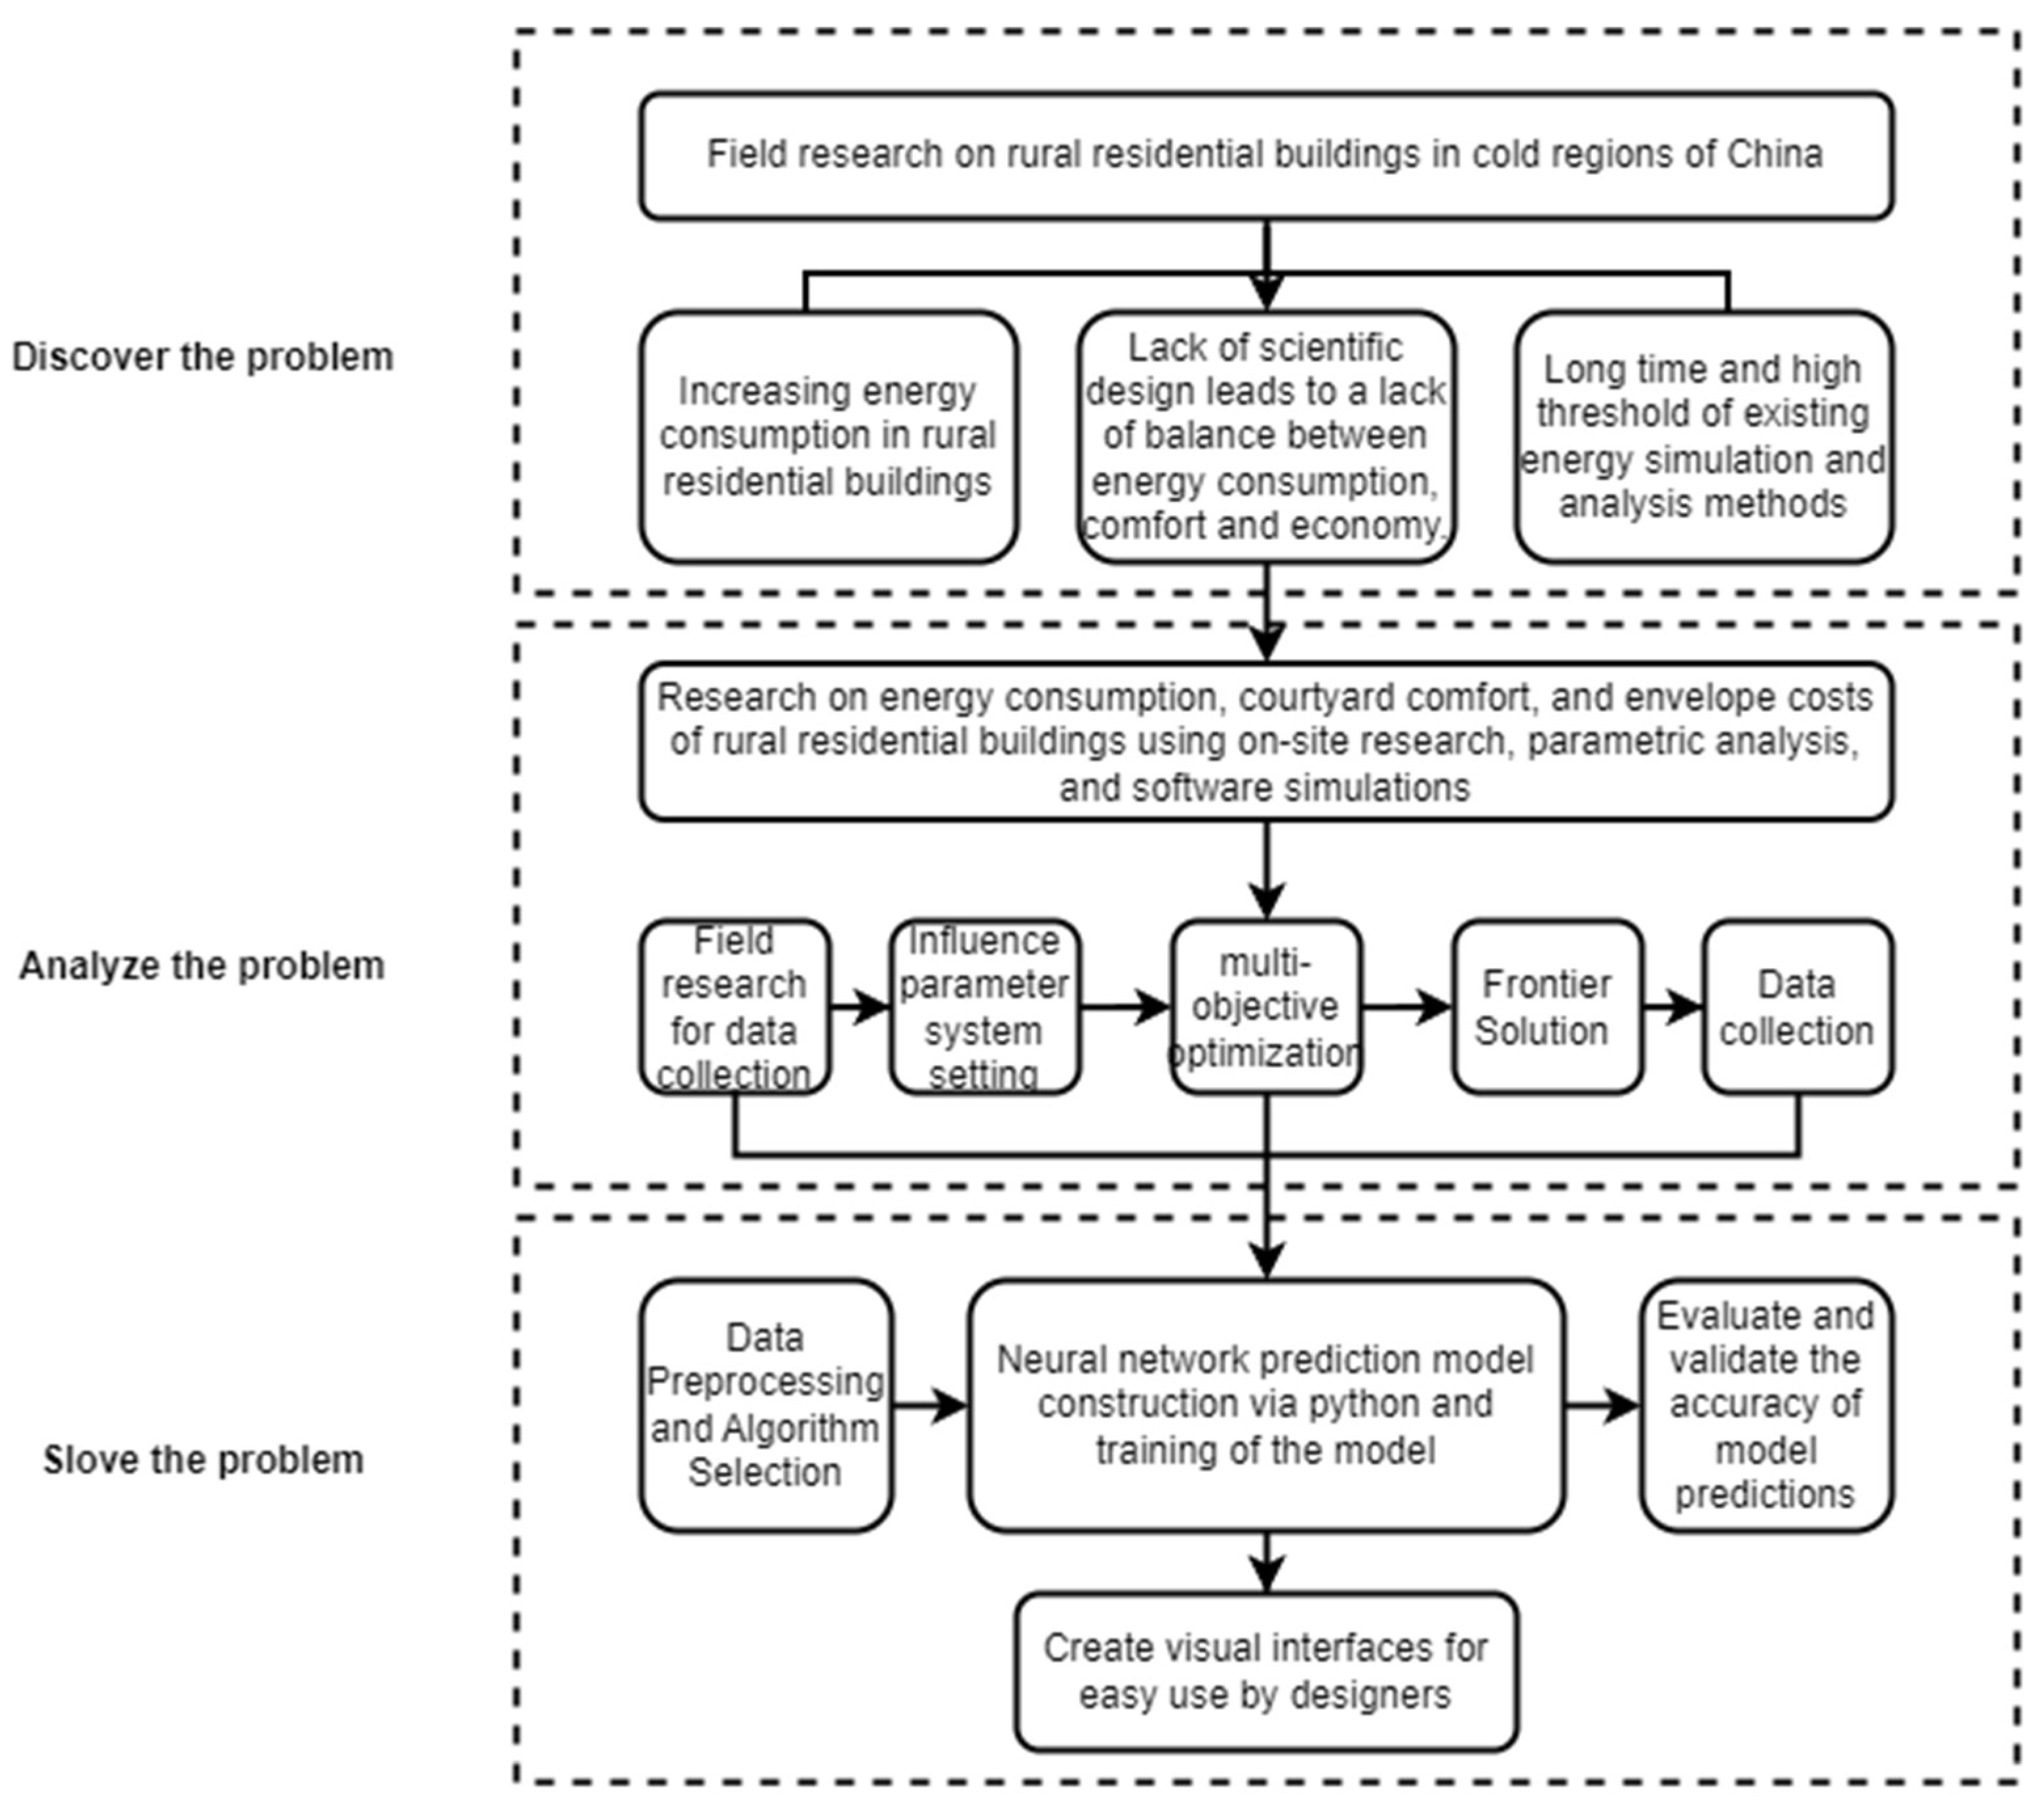
In general, as the economy grows, rural production and lifestyle, as well as the behavioral patterns of the residents, change. The demand for comfortable indoor and outdoor environments in rural residential buildings also increases energy consumption. In addition, the pursuit of energy-saving measures without considering the cost also leads to measures that are not possible to implement. Therefore, this study aims to understand the current situation of rural residential buildings in cold regions, to promote the scientific design and renewal of rural residential buildings, to improve the performance of rural residential buildings in terms of energy consumption, comfort, and economy, and to provide solutions and effective renewal strategies to guide the design of future rural residential buildings in cold regions (
Figure 1).
2. Research Methodology and Modeling
2.1. Field Study of Rural Residential Buildings
2.1.1. Cold Regions of China
Most of the cold regions in China are located in the north, necessitating the consideration of both winter and summer insulation objectives. The area of focus for this study is Jinan City in Shandong Province, situated in the mid-latitude zone and characterized by a temperate monsoon climate. This climate is distinguished by clear monsoons and distinct seasons: a dry and rain-scarce spring, a warm and rainy summer, a cool and dry autumn, and a cold winter with little snow.
2.1.2. Field Research and Measurement
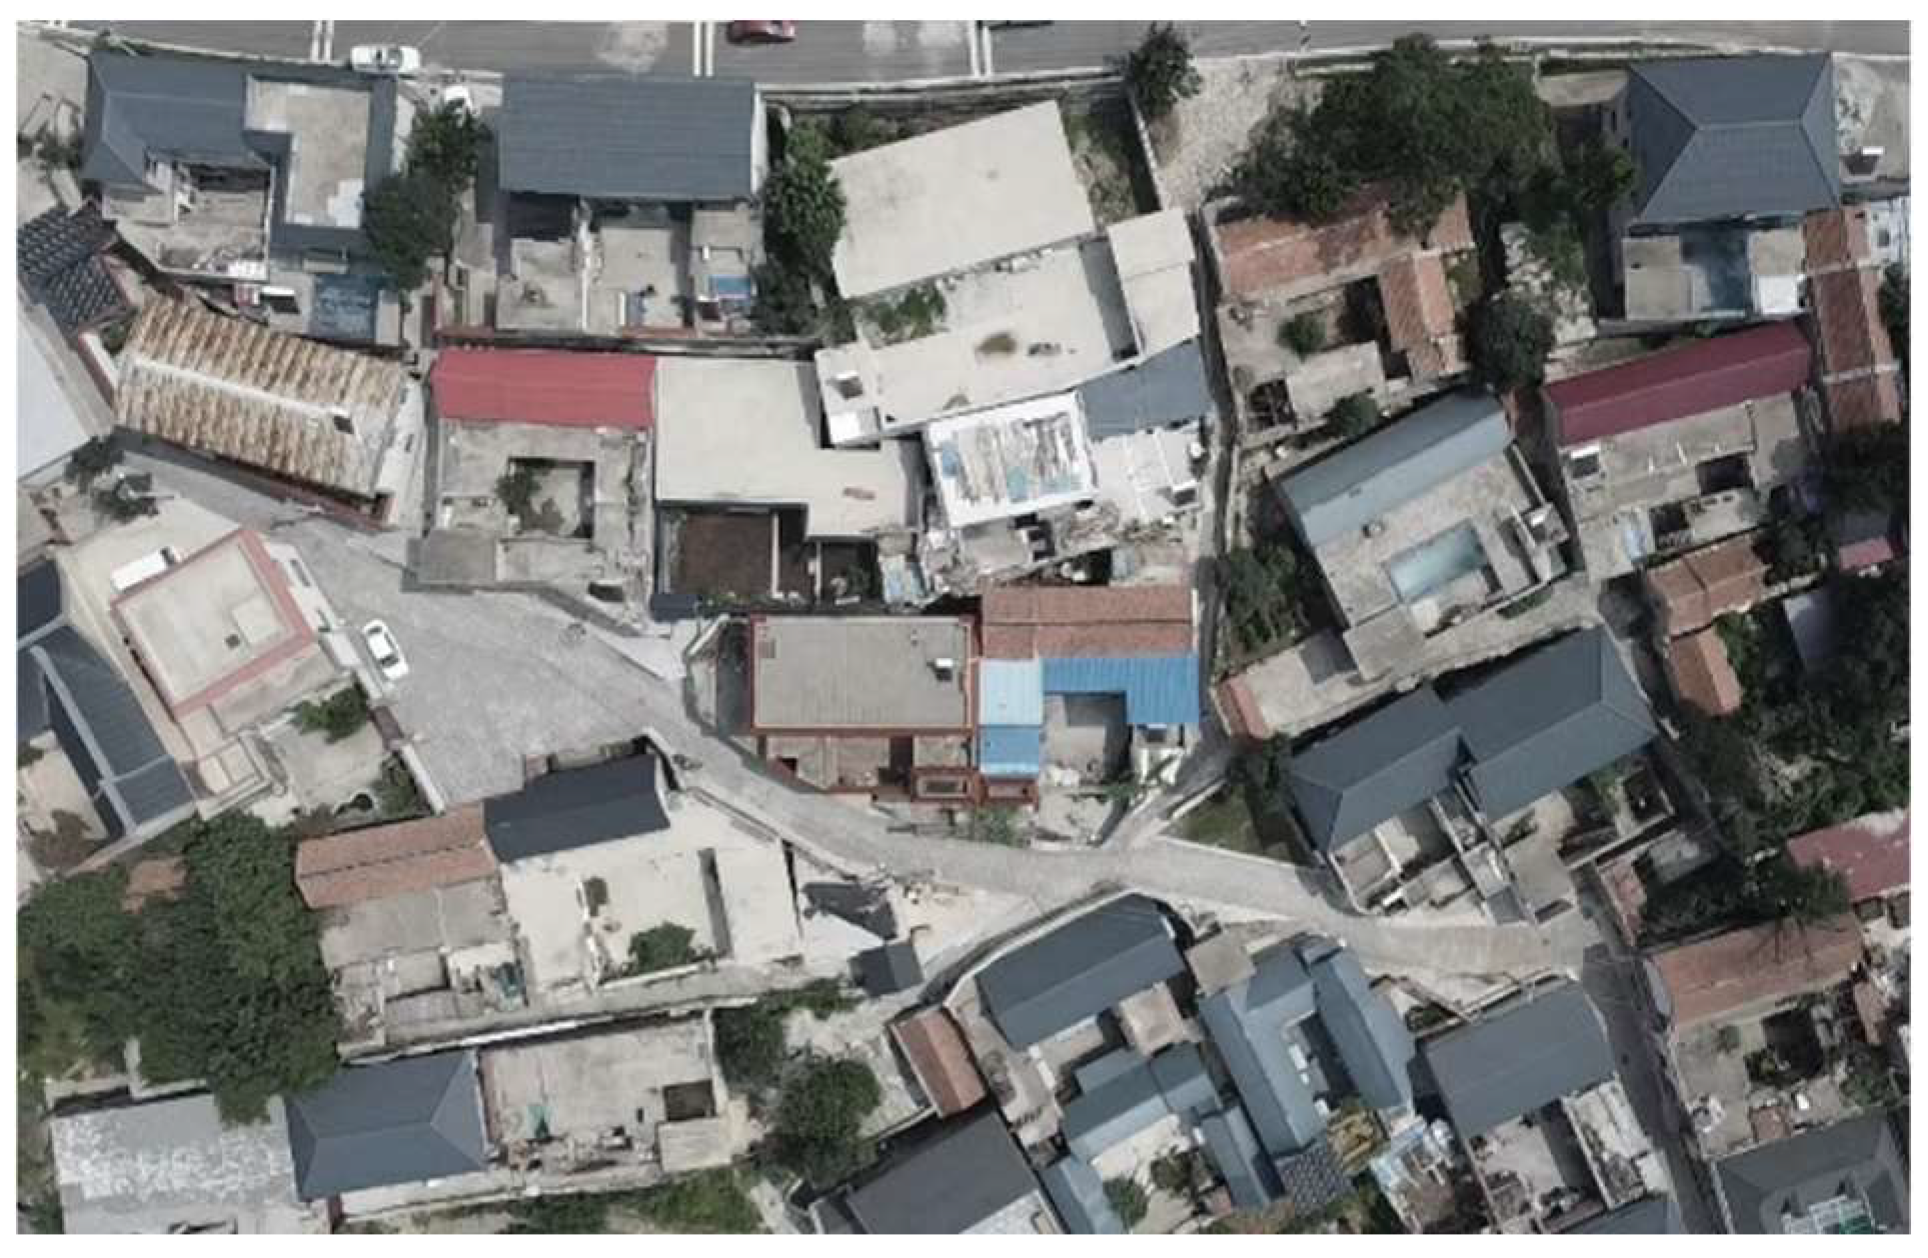
In this paper, we chose as the object of study the courtyard-style residential buildings in Dongquan Village (
Figure 2), which are situated on Caishi Street, Lixia District, Jinan City, and have more than 700 years of history and culture. Most of the houses in the village are in the form of a compound, with the houses facing south, and the south direction is used chiefly for planting, placing agricultural tools, or as a drying ground. The courtyard walls are generally tall and thick, effectively dividing the space between inside and outside the courtyard, which is peaceful, quiet, closed, and safe. Most of the courtyards have east and west compartments, and people can use the roofs of these compartments for drying and other purposes. In terms of morphological features, due to historical and geographical factors, most of the buildings in Dongquan Village adopt the “one house, one courtyard” model, with the houses in the courtyard adopting the layout of the main house sitting north to south and constructing compartments according to the needs of the family. The middle of the courtyard is generally spacious, reflecting the centripetal nature of the courtyard and strengthening the sense of privacy and belonging.
In order to improve the efficiency and accuracy of the field survey, the village layout and the form of building layout were first analyzed based on the current status of the village plan. In the village houses, the main house mainly has the primary function of living as the main functional space; its architectural form is a regular rectangle; the compartments and inverted houses mainly have storage and other auxiliary functional spaces. By integrating the existing village layout plans and conducting actual surveying in Dongquan Village, we collected dimensional and structural data for various types of building courtyards. After assessing the research data of 183 farmhouses in the village, we know that the houses in the village are mainly categorized into “—”, “L”, “U”, and “□” shapes. The four types of houses in the village are “—”, “L”, “U”, and “□”, as shown in
Figure 3. The number of “U”-shaped and “Mouth”-shaped dwellings is the highest, accounting for 36.1% and 34.4%, respectively, followed by “L”-shaped dwellings at 23%. The “—”-shaped dwellings are the least, only 6.6%. Therefore, the objectives of this study are mainly the following:
- (1)
Type 2: “L”-shaped courtyard house.
- (2)
Type 3: “U”-shaped courtyard house.
- (3)
Type 4: “□”-shaped courtyard house.
An analysis of survey data has revealed that the scale of courtyards is primarily determined by the dimensions of the main house and the wing rooms, which, together with the surrounding walls, form the courtyard. The variation in width primarily reflects differences in the internal functional layout. With the rise in economic levels and increasing usage demands, enhancing the building’s width to increase its floor area allows for additional functionalities, such as the provision of garages or the layout of primary and secondary bedrooms. Similarly, the differences in depth also reflect variations in the internal functional layout of the house. Buildings with lower economic status and earlier construction dates typically have more singular functions, merely catering to cooking and living needs, resulting in relatively more minor overall depths. As economic levels improve and the era of house construction changes, the functions within houses gradually become more numerous and diverse, leading to an increase in the depth of the buildings.
To create the surveyed cohort types of the representatives of most rural residential buildings in the village, the range of values taken from six perspectives, “Principal House Width” (PHW), “Principal House Depth” (PHD), “Wing House Width” (WHW), “Wing House Depth” (WHD), “Length of the Courtyard” (LIC), and “Width of the Courtyard” (WIC), were used to understand the characteristics of the rural residential buildings. As shown in
Figure 4, Type 2 PHW is mainly in the range of 10–15. Type 4 has a more even yard size distribution than the other types. The performance of WHD for all three types of compounds is more dispersed, indicating that this indicator is subject to more significant variation depending on the type of compound. The above information on PHW, PHD, WHW, WHD, LIC, and WIC for the different compound types was obtained by compiling the data from the building research in the village.
3. The Research Process
3.1. Performance Simulation
3.1.1. Optimization Objective Selection
This study focuses on improving the building energy consumption, the thermal comfort of the compound, and the building envelope cost. In order to assess the performance of the building, this study selects Total Load Intensity (TLI), Cost of Envelope Structure (CES), and Universal Thermal Climate Index (UTCI) as performance evaluation metrics.
Total Load Intensity (TLI) is valuable for evaluating a building’s annual energy efficiency [
27]. This metric is determined by dividing the building’s yearly energy consumption by its floor area. A reduced TLI indicates greater energy efficiency and diminished carbon emissions. During the initial design phases, this metric evaluates a building’s energy efficiency or compares various buildings, providing essential guidance for architects.
In the design of rural residential buildings, while considering the energy efficiency and the carbon reduction of buildings, it is also necessary to consider the cost factors of building design to promote and ensure the practical feasibility of the buildings on the ground. Since this study focuses on the impact of geometric parameters of rural residential buildings on the objectives, in the current Chinese market cost calculations, only the insulation costs of the envelope structures (external walls and roofs) affected by these parameters and the costs of different types of windows are considered. The specific formula for the cost calculation is as follows:
The meaning of terms present in Equation (1):
= the total cost of the envelope;
= the cost of building envelope insulation;
= the cost of building roof insulation;
= the cost of windows.
For the thermal environment of the courtyard space, this paper usually adopts the Universal Thermal Climate Index (UTCI) for calculation, which describes the human perception of ambient temperature and humidity. It provides a more comprehensive and accurate measure of human comfort and responds to the human body’s ability to adapt to the environment than traditional temperature indices [
28]. In this study, we use the Universal Thermal Climate Index to assess the comfort level of the external environment of a building and the impact of the environment on the building. The Universal Thermal Climate Index can cope with changes in the building’s outdoor thermal environment due to changes in yard space and building form.
3.1.2. Parameterization
The parametric model created with Rhino and Ladybug Tools was able to simulate the performance of the building based on the local climate and the site environment. HB Energy is used to simulate the energy consumption of the building by using Ladybug from
https://www.ladybug.tools/epwmap/ (accessed on 23 October 2023) to download the Jinan City weather file as the weather file for this simulation study.
The parameters for the energy simulation were set as follows: the simulation period was the whole year, the heat transfer coefficient of the facade was taken as K = 0.959 (W·m−2·K−1), the heat transfer coefficient of the roof was taken as K = 1.167 (W·m−2·K−1), and the type of windows was taken as Type1. The personnel presence rate, lighting power, and electrical equipment power are set according to national and local standards.
3.1.3. Parameterized Model Construction
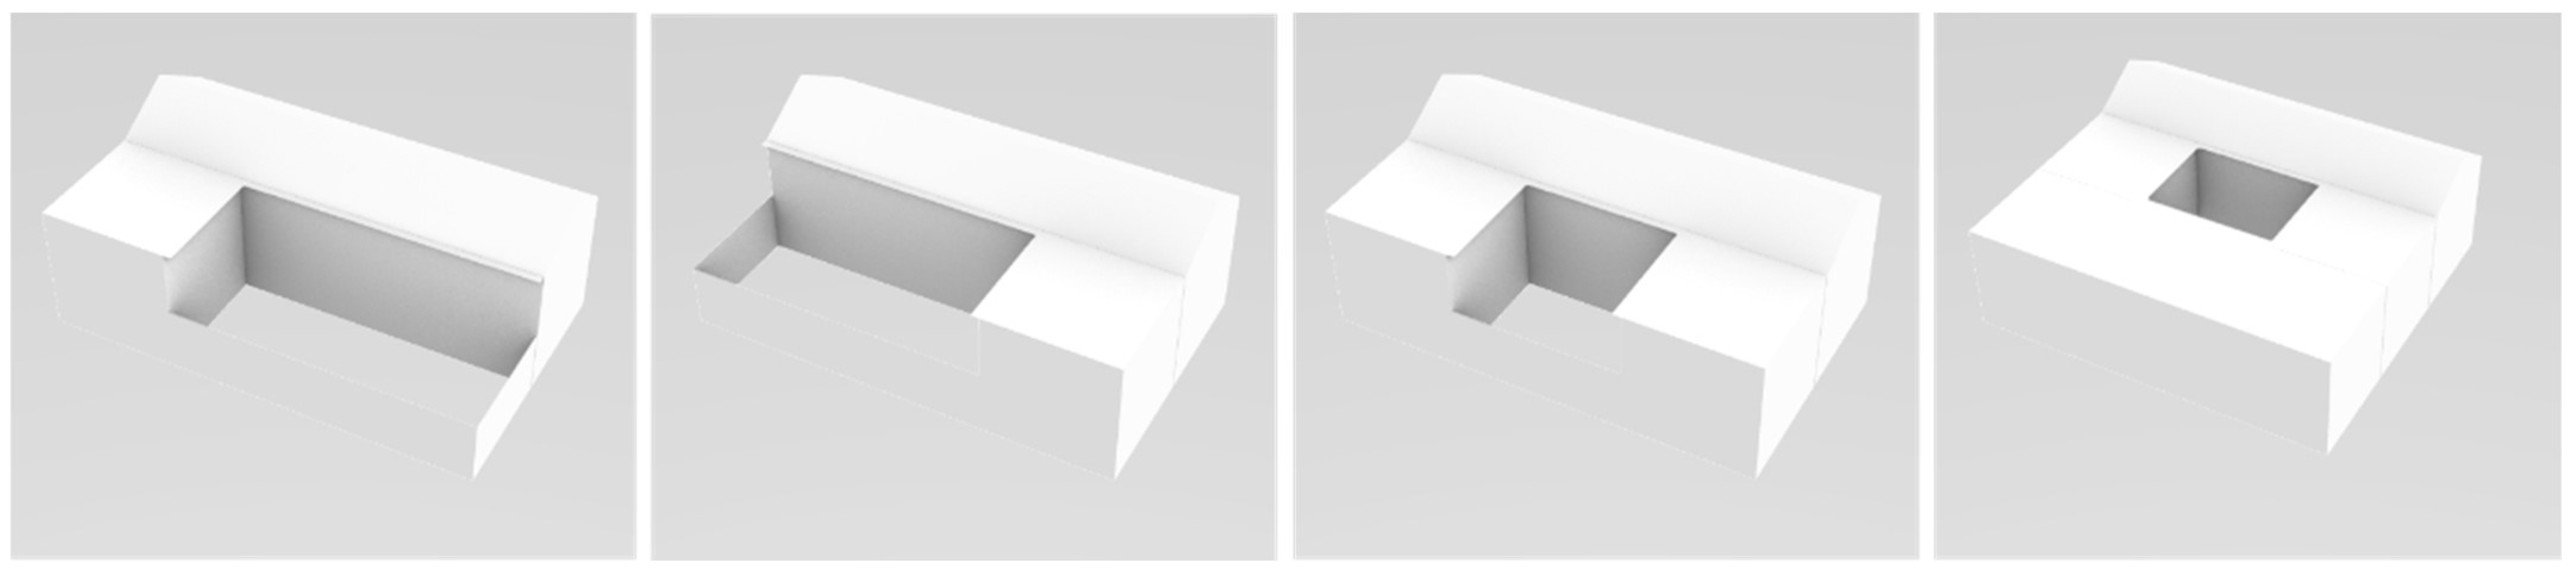
In this study, the Walleci plug-in in Grasshopper was used to carry out optimization iterations through the NSGA-II multi-objective genetic algorithm it carries, to obtain the dataset containing the values of design variables and optimization objectives, and to derive the Pareto frontier solution and the non-frontier solution. In this way, more design solution data are generated and integrated to improve the applicability and accuracy of the machine learning model. Based on the previous research data for residential buildings within Dongquan Village, Type 2, Type 3, and Type 4, which account for a high percentage of the total number of buildings, are taken as the objects of research, of which Type 2 has two forms of arrangement.
Table 1 shows the variable system, and
Figure 5 shows the schematic diagram of the four-parameter models.
3.2. Correlation Analysis
This section discusses the architectural parameter variables and simulates the relevant parameter variables of the main house and compartments, respectively. Subsequently, a Pearson correlation analysis of the data was conducted using the “scipy.stats” library in Python. If the
p-value is less than 0.05, it indicates a significant correlation between the two variables. A correlation coefficient close to 1 implies a strong positive correlation between the variables, while a coefficient close to −1 indicates a strong negative correlation. Typical reference models have the main house with a width of 16 m, a depth of 6 m, and a roof slope of 30°, and the compartments with a width of 3 m and a depth of 6 m. Each parameter study controls a single variable for simulation, and the specific simulation process and results are as follows (
Figure 6).
From the line graph, PHW, PHD, WHW, WHD, and BH have a significant correlation with TLI, COST, and UTCI, and RS has a significant correlation with TLI, and there is no significant correlation with COST and UTCI.
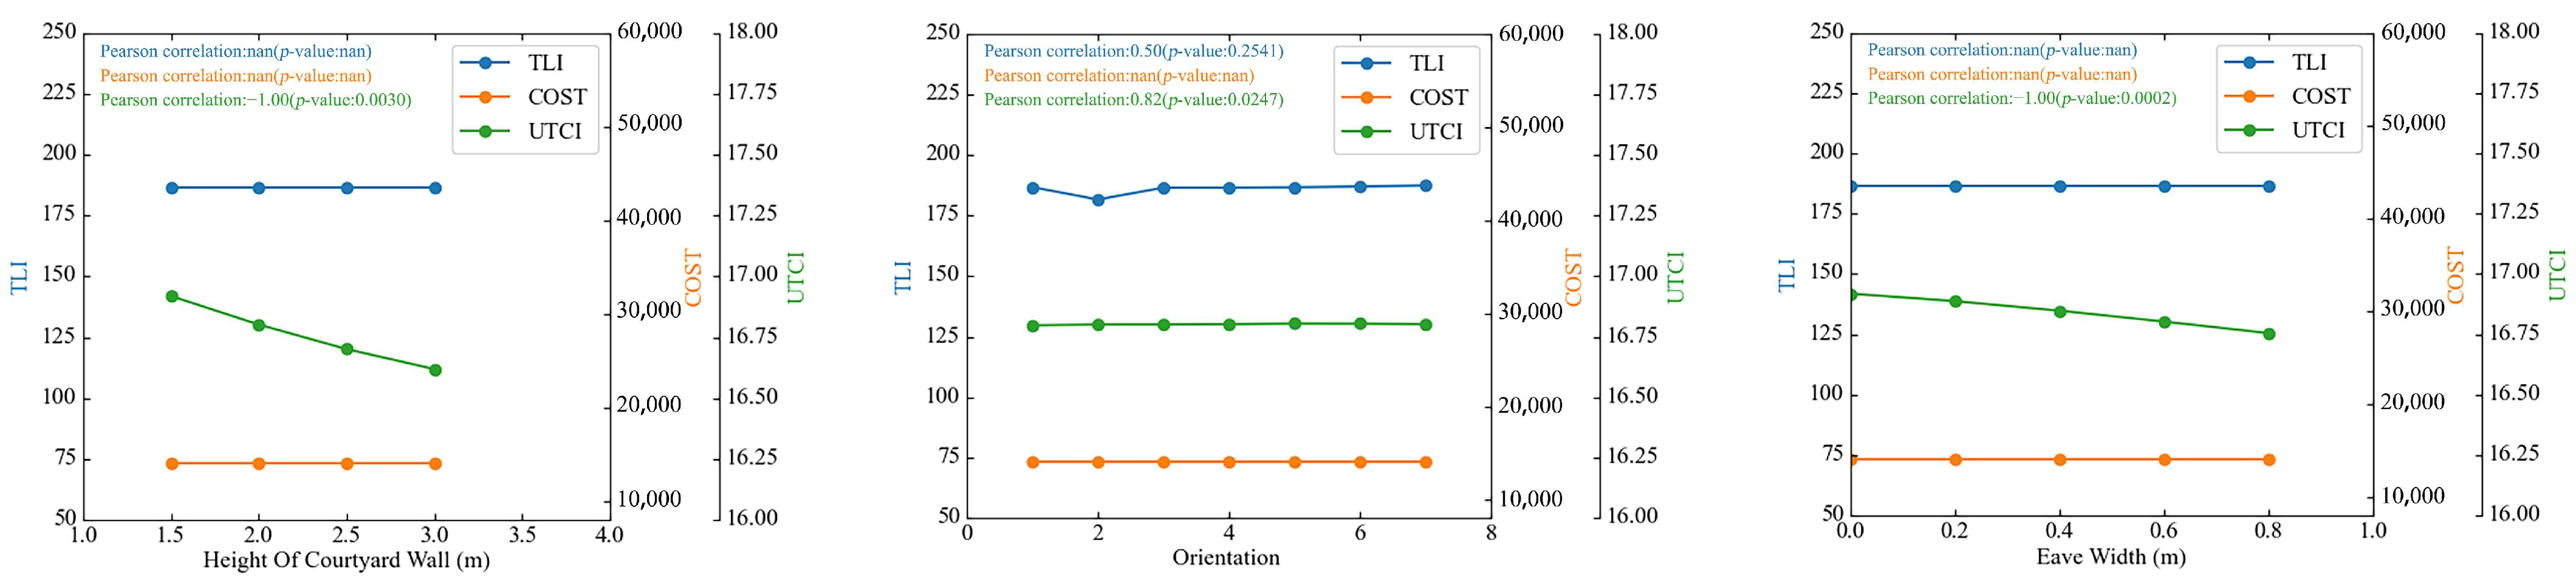
3.2.1. Simulation Analysis of Courtyard Parameters
In this section, the courtyard parameter variables are explored and simulated separately for the height of the courtyard wall, orientation, and the width of the eaves. Among them, the orientation is represented by 1–7 for values of −15°–15° change (in 5° intervals). Each parameter study was simulated by controlling only a single variable, and the specific simulation process and results are as follows (
Figure 7).
The line graph shows that BO, EW, and HCW were significantly correlated with UTCI and not significantly correlated with TLI and COST.
3.2.2. Simulation and Analysis of Building Envelope Parameters
This section investigates the building envelope insulation, roof insulation thickness, and window type, and then simulates the values of the target variables under the control of the three parameters. Typical reference models for the envelope insulation, roof insulation thickness, and exterior window type are set to 0.03, 0.02, and 1, respectively, with each parameter controlling only one variable for the study (
Figure 8).
As shown in the line graphs, EPS and XPS have a significant correlation with TLI and COST but no significant correlation with UTCI. WT has no significant correlation with all three but has a varying degree of influence on TLI and COST.
3.2.3. Factor Correlation Analysis
Based on the above factor correlation analysis, building parameters have the most significant influence on TLI. Changes in the design values of the building parameters can directly affect the TLI of the building. Noteworthily, the correlation between COST and the building parameters is also crucial. People must consider design, TLI, and COST in the building process. Too large or too small building parameters will increase the energy consumption of the building. From the analysis, some building parameters also correlate highly with the UTCI of the courtyard space, such as WHW. It mainly shades part of the sunlight projected into the courtyard, which makes the solar radiation received in the courtyard lower, resulting in a lower UTCI.
The courtyard parameters all significantly affect the UTCI, while they do not significantly affect TLI and COST because they are not a part of the building. However, it is worth noting that the BO has no significant effect on the TLI, but it does influence the TLI to a certain extent due to its change in orientation, which affects the light and heat gain from the windows of the building.
The envelope parameters have a direct impact on TLI and COST. With the increase in the thickness of the insulation layer of the envelope, the TLI gradually decreases. However, its decreasing trend gradually slows down, which indicates that the increase in the thickness of the insulation layer does not achieve the same effect, while the COST is steadily increasing. TLI and COST should be taken into account when selecting envelope parameters. Otherwise, there will be wasted performance.
3.3. Multi-Objective Optimization Results
Multi-Objective Optimization
The research utilized Wallacei [
28] as its primary tool for the multi-objective optimization. This tool facilitates evolutionary simulations within Grasshopper, leveraging genetic algorithms alongside the Pareto frontier theory. It aids designers in comprehending the nuances of the evolutionary selection process by offering intricate analytical tools and cohesive selection strategies. Optimization is crucial at every phase of the evolutionary simulation process, ensuring thorough and efficient analysis.
Total Load Intensity (TLI), Envelope Cost, and Universal Thermal Climate Index (UTCI) were entered into the target port as optimization objectives, where UTCI calculates the mean. There may be slight deviations in the evaluation results, but they have little effect on the trend of the optimization results. Then, the variables of building parameters, as well as the initial investment in
Table 3 and
Table 4, are input into the gene port to optimize Type2, Type 3, and Type 4, respectively. The number of iterations is 40 generations, the subset of each generation is 50, and the number of populations is 2000.
Table 3 shows the genetic algorithm parameters.
Figure 9 shows the solution set of the multi-objective optimization as a scatter plot on the Wallacei coordinate system. TLI, Cost, and UTCI correspond to the x, y, and z axes. The PCP image in
Figure 10 shows the analysis of the optimization process to achieve minimum TLI, minimum COST, and maximum UTCI.
By analyzing the results of the multi-objective optimization and the standard deviation plots of the process, the overall evolutionary direction of the algorithm tends to be stable, and all of them converge to the optimal trend. Among the 194 Pareto frontier solutions of Type 2, the objective range of COST is from 8000 to 28,000, the objective range of TLI is from 70 kWh/m
2 to 148 kWh/m
2, and the mean value of UTCI is between 16.7 °C and 17.3 °C; among the 229 Pareto frontier solutions of Type 3, the objective range of cost is from 9000 to 32,000, the target range of TLI is 70 kWh/m
2 to 160 kWh/m
2, and the mean value of UTCI is between 16.2 °C and 17.2 °C. For the 326 Pareto frontier solutions of Type 4, the target range of cost is 13,000 to 48,000, the target range of TLI is 63 kWh/m
2 to 138 kWh/m
2, and the mean value of UTCI ranges between 16 °C and 17 °C. The average value of the UTCI is between 16 °C and 17 °C. The average value of the UTCI is between 16 °C and 17 °C (
Figure 11).
The above data were exported from Grasshopper to Excel via the TT Toolbox tool for the following machine learning model training.
3.4. Predictive Model Construction
This study employs the feedforward neural network algorithm and commonly used machine learning libraries for model construction. Scikit-learn is the premier Python library for machine learning, constructed upon foundational data science packages like numpy and matplotlib. It encompasses various machine learning functionalities, including data sampling, preprocessing, model validation, classification, and regression [
29]. In this study, a regression prediction model is employed. Neural networks, which are artificial neural networks inspired by biological neural systems, are applicable in various machine learning applications, including regression prediction. Furthermore, this method is noted for its comprehensive efficiency and accuracy as a machine learning technique.
Neural network fitting for regression prediction is a technique for making predictions on a given dataset by training a neural network. In a neural network, nodes are organized into a hierarchy. The input layer receives raw data, the intermediate layer processes the input data and extracts features, and the output layer generates predictions. Each node has an associated weight and bias, and these values can be trained and adjusted by backpropagation algorithms to minimize the error between the predicted and actual results. The fitting process is usually divided into two phases: training and testing. In the training phase, the dataset is divided into training and validation sets. The training set is then used to train the neural network to find the optimal weights and biases for minimizing the prediction error. During training, optimization algorithms such as stochastic gradient descent can help optimize the weights and biases of the neural network.
3.4.1. Data Preprocessing
Data preprocessing involves identifying, rectifying, or eliminating flawed, inaccurate, or irrelevant data within a dataset. This process aims to convert raw data into a format suitable for training, ensuring that the refined data aligns well with the specifications and needs of the model [
30].
To eliminate the differences in the data range between variables and to avoid the objective function being unable to learn accurately from the data due to significant differences in feature sizes in the dataset, we process the data in the dataset using the Z-score normalization method, transforming it into data with a mean of 0 and a standard deviation of 1. The standardized value of each parameter is calculated as (X − mean)/std, where “mean” represents the average value, and “std” denotes the standard deviation.
3.4.2. Building and Training Model
This study established a machine learning model using the PyTorch(1.7.0) framework. The model was trained with parameters from existing design schemes and simulated target values, aiming to effectively predict the performance levels of RRB and assist designers in decision-making. A multilayer feedforward neural network (MLP) based on the backpropagation algorithm (LM) can be used to perform the regression of multiple response variables. The predictive model, as shown in
Figure 12, comprises an input layer, two hidden layers, and an output layer. Each node corresponds to a response variable and possesses its unique weights and biases, employing the “relu” activation function. During the training phase, the network optimizes these weights and biases through the backpropagation algorithm to minimize the error between predicted and actual outputs. This neural network is capable of handling complex datasets, including those with multiple response variables.
In MLP, the data are input as a matrix, and neurons are activated in the implicit layer for weight response. The model can consider the effect of each performance feature during backpropagation. The relationship between the effects of the three performance parameters impacts the fitting process. The data in this paper are fitted to a neural network using an array of 6000 observations with 14 features as predictor variables and observations with three features as response variables. The “Batch Size” was set to 128, and the model’s regression performance was evaluated using the “MSE” (Mean Squared Error) loss function and R2 (R-Square) metrics.
The dataset is divided into a training set for training the machine learning model and a test set for validating the model. In this study, 70% of the data was randomly selected as the training set, 20% as the test set, and 10% as the validation set.
3.4.3. Model Evaluation
The training regression was conducted by modeling the neural network through Python for a total of 300 rounds and converged after the 100th round. Cross-validation was used to select and evaluate simulations, culminating in choosing the best-performing model. The specific model effect is shown in
Figure 13 and
Figure 14. From the fitting effect graph, the model has R2 = 0.988 for the training set, R2 = 0.986 for the testing set, R2 = 0.985 for the validation set, and R2 = 0.988 for all data. The prediction model converged in all three parts, thus avoiding the issue of overfitting.
3.4.4. Code Encapsulation
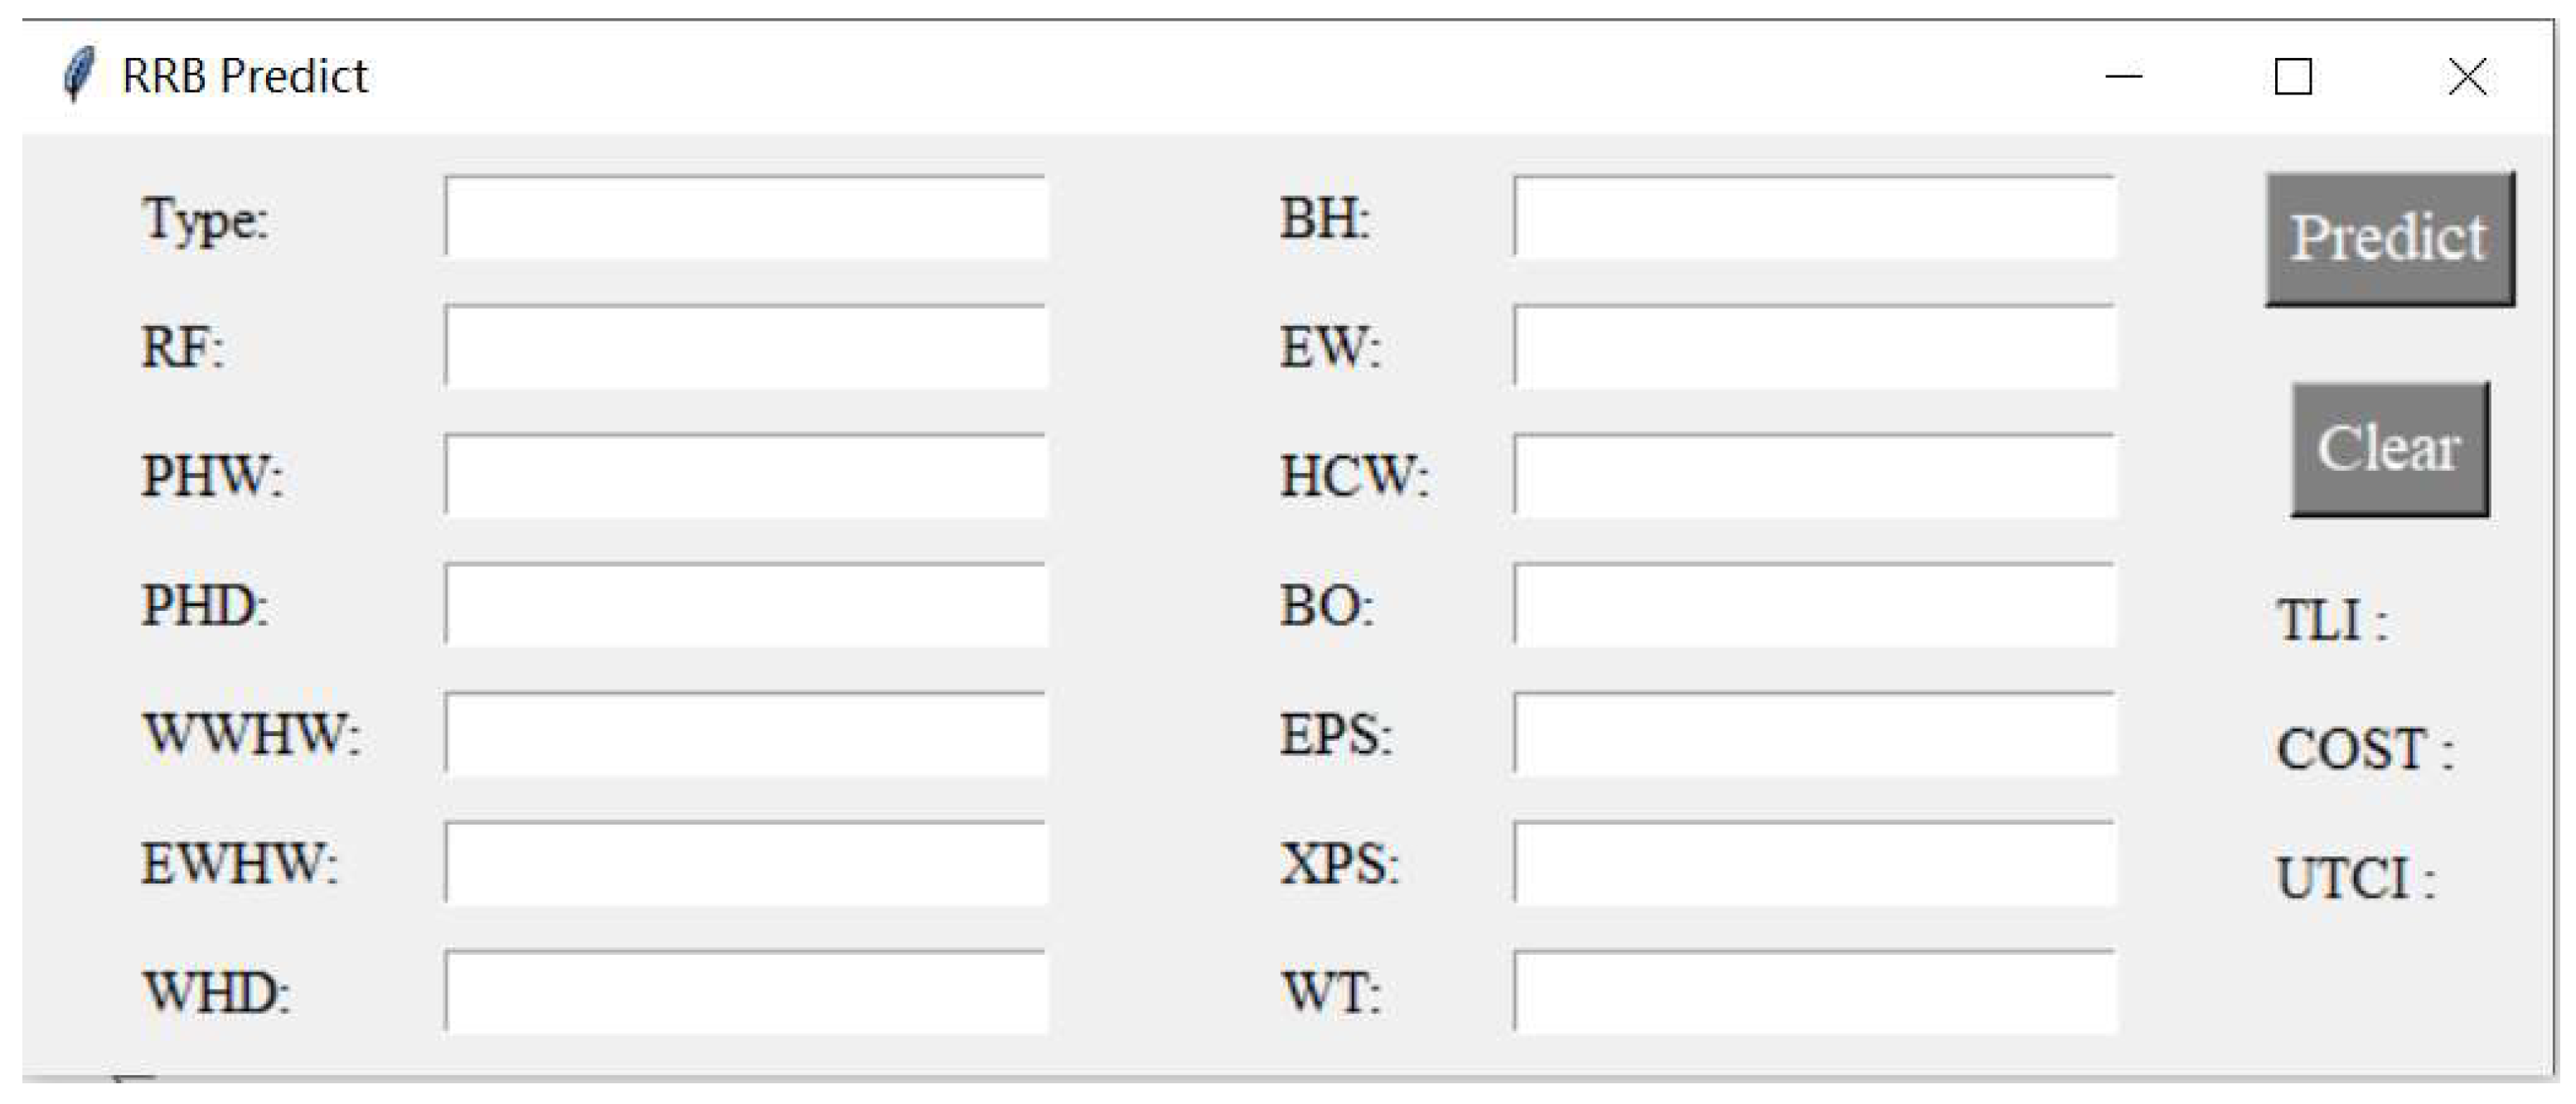
After validating the feedforward neural network prediction model constructed based on the multi-objective dataset of rural residential buildings in cold regions, the system code was encapsulated to enhance its usefulness for designers. The software was built with Tkinter, a standard GUI library for Python, and mainly predicted the three target variables. The interface of the software is shown in
Figure 15.
4. Results and Discussion
After the model training is completed, we save the trained model. By plotting the comparison line graphs of the actual values versus the predicted values for the three types of prediction targets in the test and validation sets(
Figure 16), the predictive model demonstrates a relatively good level of prediction for all three targets. Notably, the model’s performance in predicting COST is better than the other two indicators.
Then, to test the saved model’s accuracy, the saved regression prediction model is imported, and three groups of variables are randomly selected as cases in each type of RRB for prediction. The differences between the prediction results and the actual performance levels are compared. The case parameter variables are shown in
Table 4. A comparison of actual and predicted target values is shown in
Table 5.
As shown in
Table 5, the model shows a good prediction performance for both TLI and UTCI, and the prediction for COST sometimes produces large fluctuations. However, overall, the model predictions are still accurate, and the prediction accuracy should be higher if more samples are provided in the multi-objective optimization stage, and more case data are generated.
In conclusion, the machine learning model has high accuracy in predicting and evaluating the economic and energy efficiency performance of courtyard buildings, among others. Compared with the traditional performance simulation, which takes 3–5 min to simulate three targets at a time (depending on the performance of the computer, it may be reduced or increased), the prediction model can obtain the prediction results immediately by inputting the parameters, which significantly improves the efficiency at the early stage of design. However, when specific datasets are not large enough, the prediction accuracy is relatively low, suggesting the need for further improvements, such as better model tuning or the enhancement of the data collection and processing process.
5. Conclusions
In this study, a neural network model that can accurately predict the energy efficiency, as well as the economy of rural residential buildings, in the cold regions of China, was developed by focusing on the energy consumption and envelope spending of rural residential buildings in China, using examples from the rural Jinan area. The model is developed based on multi-objective optimization and machine learning and broadly applies to equivalent building types.
The research methodology can be applied in rural planning as well as building renewal. Given the unbalanced nature of rural construction, the machine learning model in this method can help designers quickly assess the performance of buildings at the early stage of updating and evaluating buildings, avoiding irrational renovations and additions and maximizing low-carbon updating. Research and data collection of existing residential buildings in Dongquan Village established a performance simulation parameter model. Then, using a genetic algorithm for multi-objective optimization, a total of 6000 datasets containing spatial parameters and target performance were generated for three residential buildings. The neural network model was then constructed and trained to evaluate and predict the changes in energy consumption, cost, and thermal comfort of the courtyard due to changes in building and courtyard parameters. According to the model validation results, R2 = 0.988 and MSE = 0.0148, indicating that the model can correctly predict the target variables of the design solution. The code was also encapsulated into a more user-friendly interface presentation for designers.
This study’s innovation is combining the neural Network with MOO and presenting it in a designer-friendly interface that shortens the simulation time and improves the evaluation efficiency compared with the traditional method using building performance simulation software. The model allows the fast prediction of the same type of building under the same area, and the method is also generalizable. Theoretically, the method can be applied to buildings of ensemble type in various regions, but modeling based on different meteorological data in different regions is still needed for accurate prediction. In addition, in the next step of the study, other indicators and variables can be incorporated into the evaluation system, and through a complete prediction and evaluation methodology, it is hoped that it will provide references and ideas for the future renewal of the vast number of rural residential buildings, which will help achieve the broader goal of sustainable development.
Author Contributions
Conceptualization, Y.X. and M.S.; Methodology, Y.X. and M.S.; Software, M.S.; Validation, M.S.; Formal analysis, M.S.; Investigation, M.S. and L.W.; Resources, M.S.; Writing—original draft, M.S.; Writing—review and editing, M.S.; Visualization, M.S.; Supervision, Y.X.; Project administration, Y.X. All authors have read and agreed to the published version of the manuscript.
Funding
This research received no external funding.
Institutional Review Board Statement
Not applicable.
Informed Consent Statement
Not applicable.
Data Availability Statement
At this time, the data and source code for the machine learning models produced in this study are not available as they are required for the subsequent phase of the research.
Conflicts of Interest
The authors declare that they have no known competing financial interests or personal relationships that could have appeared to influence the work reported in this paper.
Nomenclature
| RRB | rural residential buildings | EC | energy consumption |
| IPCC | intergovernmental panel on climate change | CES | cost of the enclosure structure |
| MOO | multi-objective optimization | RF | roof slope |
| PHW | principal house width | BO | building orientation |
| PHD | principal house depth | HCW | height of the courtyard’s wall |
| WHW | wing house width | EPS | EPS thickness |
| WHD | wing house depth | XPS | XPS thickness |
| BH | building height | WD | window type |
| EW | eave width | TLI | total loads intensity |
| ML | machine learning | UTCI | Universal Thermal Climate Index |
| WIC | width of the courtyard | LIC | “length of the courtyard” |
References
- Merlet, Y.; Rouchier, S.; Jay, A.; Cellier, N.; Woloszyn, M. Integration of phasing on multi-objective optimization of building stock energy retrofit. Energy Build. 2022, 257, 111776. [Google Scholar] [CrossRef]
- China Building Energy Efficiency Association Building Energy Consumption and Carbon Emission Data Specialized Committee. Efficiency, Research Report on Building Energy Consumption in China; Chinese Construction Industry Chubns: Beijing, China, 2022; Available online: https://www.cabee.org/ (accessed on 23 June 2023).
- Building Energy Efficiency Research Center, Tsinghua University. China Building Energy Efficiency Development Research Report 2023; China Building Industry Press: Beijing, China, 2023. [Google Scholar]
- Wu, Y. Research on Low Carbon Adaptive Construction Methods and Practices of Rural Community Spatial Form. Ph.D. Thesis, Zhejiang University, Zhejiang, China, 2016. [Google Scholar]
- He, H.; Xiong, K.; Li, Y. Status and outlook of the quality of concrete residential projects in villages and towns in China. Concrete 2010, 247, 129–131. [Google Scholar]
- Liang, L.; Wu, W.L.; Lal, R.; Guo, Y.B. Structural change and carbon emission of rural household energy consumption in Huantai, northern China. Renew. Sustain. Energy Rev. 2013, 28, 767–776. [Google Scholar] [CrossRef]
- Wang, R.; Jiang, Z. Energy consumption in China’s rural areas: A study based on the village energy survey. Clean. Prod. 2017, 143, 452–461. [Google Scholar] [CrossRef]
- Fan, J.L.; Yu, H.; Wei, Y.M. Residential energy-related carbon emissions in urban and rural China during 1996–2012: From the perspective of five end-use activities. Energy Build. 2015, 96, 201–209. [Google Scholar] [CrossRef]
- Xu, J.; Gao, W.J.; Huo, X. Analysis on energy consumption of rural building based on survey in northern China. Energy Sustain. Dev. 2018, 47, 34–38. [Google Scholar]
- He, B.-J.; Yang, L.; Ye, M. Buildings energy efficiency in China rural areas: Situation, drawbacks, challenges, corresponding measures and policies. Sustain. Cities Soc. 2014, 11, 7–15. [Google Scholar] [CrossRef]
- Jermyn, D.; Richman, R. A process for developing deep energy retrofit strategies for single-family housing typologies: Three Toronto case studies. Energy Build. 2016, 116, 522–534. [Google Scholar] [CrossRef]
- Zhang, Y.; Yang, L. Comparative study on the indoor thermal environment of traditional and modern residential houses in northern Jiangsu Province. Archit. Technol. 2017, 48, 707–710. [Google Scholar]
- Asadi, E.; Da Silva, M.G.; Antunes, C.H.; Dias, L. Multi-objective optimization for building retrofit strategies: A model and an application. Energy Build. 2012, 44, 81–87. [Google Scholar] [CrossRef]
- Liu, Y.; Huang, Z.; Wang, Y. Energy-efficient design of a farmhouse based on seasonal differences in indoor and outdoor multi-space thermal environment quality and user space utilization. Build. Sci. 2022, 38, 216–222. [Google Scholar]
- Al-Masri, N.; Abu-Hijleh, B. Courtyard housing in midrise buildings: An environmental assessment in hot-arid climate. Renew. Sustain. Energy Rev. 2012, 16, 1892–1898. [Google Scholar] [CrossRef]
- Taleghani, M. Outdoor thermal comfort by different heat mitigation strategies—A review. Renew. Sustain. Energy Rev. 2018, 81, 2011–2018. [Google Scholar] [CrossRef]
- Zamani, Z.; Heidari, S.; Hanachi, P. Reviewing the thermal and microclimatic function of courtyards. Renew. Sustain. Energy Rev. 2018, 93, 580–595. [Google Scholar] [CrossRef]
- Tavakolan, M.; Mostafazadeh, F.; Eirdmousa, S.J.; Safari, A.; Mirzaei, K. Parallel computing simulation-based multi-objective optimization framework for economic analysis of building energy retrofit: A case study in Iran. J. Build. Eng. 2022, 45, 103485. [Google Scholar] [CrossRef]
- Gao, Y.; Hu, K.; Yue, X.; Yuan, J. Multi—Objective optimization design of form parameters for energy saving and thermal comfort in northern country houses. Overseas Chin. Univ. Sci. (Nat. Sci. Ed.) 2021, 42, 619–627. [Google Scholar]
- Vukadinović, A.; Radosavljević, J.; Đorđević, A.; Protić, M.; Petrović, N. Multi—Objective optimization of energy performance for a detached residential building with a sunspace using the NSGA-II genetic algorithm. Sol. Energy 2021, 224, 1426–1444. [Google Scholar] [CrossRef]
- Ascione, F.; Bianco, N.; De Masi, R.F.; Mauro, G.M.; Vanoli, G.P. Design of the building envelope: A novel multi-objective approach for the optimization of energy performance and thermal comfort. Sustainability 2015, 7, 10809–10836. [Google Scholar] [CrossRef]
- Carlucci, S.; Cattarin, G.; Causone, F.; Pagliano, L. Multi—Objective optimization of a nearly zero-energy building based on thermal and visual discomfort minimization using a non-dominated sorting genetic algorithm (NSGA-II). Energy Build. 2015, 104, 378–394. [Google Scholar] [CrossRef]
- Yan, H.; Yan, K.; Ji, G. Optimization and prediction in the early design stage of office buildings using genetic and XG Boost algorithms. Build. Environ. 2022, 218, 109081. [Google Scholar] [CrossRef]
- Zekić-Sušac, M.; Has, A.; Knežević, M. Predicting energy cost of public buildings by artificial neural networks, CART, and random forest. Neurocomputing 2021, 439, 223–233. [Google Scholar] [CrossRef]
- Guo, J.; Zhou, J.; Li, M.; Lu, S. Based on ANN and many-objective optimization to improve the performance and economy of village houses in Chinese cold regions. J. Build. Perform. Simul. 2023, 16, 526–536. [Google Scholar] [CrossRef]
- Liu, C.L.; Tseng, C.J.; Huang, T.H.; Yang, J.S.; Huang, K.B. A multi-task learning model for building electrical load prediction. Energy Build. 2023, 278, 112601. [Google Scholar] [CrossRef]
- Lagios, K.; Niemasz, J.; Reinhart, C.F. Animated building performance simulation (ABPS)–linking Rhinoceros/Grasshopper with Radiance/Daysim. Proc. SimBuild 2010, 4, 321–327. [Google Scholar]
- Tian, Y.; Huang, Q. Multi-objective optimization design method for building performance and its application—An example of genetic algorithm. New Archit. 2021, 198, 84–89. [Google Scholar]
- Jiang, J. Research on the Optimization of High-Density Neighborhood Morphology Design Based on Genetic Algorithm. Master’s Thesis, Shenzhen University, Shenzhen, China, 2020. [Google Scholar]
- Nelli, F. Machine Learning with sci-kit-learn. In Python Data Analytics; Apress: Berkeley, CA, USA, 2018. [Google Scholar]
Figure 1.
Overall workflow.
Figure 1.
Overall workflow.
Figure 2.
Aerial view of the layout of Dongquan Village.
Figure 2.
Aerial view of the layout of Dongquan Village.
Figure 3.
Schematic diagram of rural residential building forms.
Figure 3.
Schematic diagram of rural residential building forms.
Figure 4.
Range of values of critical variables for different types of buildings.
Figure 4.
Range of values of critical variables for different types of buildings.
Figure 5.
Four types of parameterized models.
Figure 5.
Four types of parameterized models.
Figure 6.
Simulation results of building parameters.
Figure 6.
Simulation results of building parameters.
Figure 7.
Simulation results of courtyard parameters.
Figure 7.
Simulation results of courtyard parameters.
Figure 8.
Simulation results of enclosure structure parameters.
Figure 8.
Simulation results of enclosure structure parameters.
Figure 9.
Distribution of Pareto frontier solutions for three types of RRB.
Figure 9.
Distribution of Pareto frontier solutions for three types of RRB.
Figure 10.
Distribution of parallel coordinate plot for three types of RRB.
Figure 10.
Distribution of parallel coordinate plot for three types of RRB.
Figure 11.
Box diagram of Pareto frontier solution distribution.
Figure 11.
Box diagram of Pareto frontier solution distribution.
Figure 12.
Structure diagram of MLP neural network.
Figure 12.
Structure diagram of MLP neural network.
Figure 13.
Training and validation loss over time.
Figure 13.
Training and validation loss over time.
Figure 14.
Neural network model regression graph.
Figure 14.
Neural network model regression graph.
Figure 15.
Software user interface.
Figure 15.
Software user interface.
Figure 16.
Comparison of the true value of the forecasted target with the forecasted value.
Figure 16.
Comparison of the true value of the forecasted target with the forecasted value.
Table 1.
Variable setting and initial investment (definition of abbreviations: PHW = principal house width; PHD = principal house depth; WHW (W, E) = wing house width (western, east); WHD = wing house depth; RS = roof slope; EW = eave width; HCW = height of the courtyard’s wall; BH = building height; BO = building orientation; WT = window type; and EPS, XPS = insulation material type).
| Building Parameters | Range of Values | Unit | Initial Investment |
|---|
| PHW | 10–20 | m | / |
| PHD | 3–12 | m | / |
| WHW (W, E) | 3–8 | m | / |
| WHD | 3–10 | m | / |
| RS | 0, 15, 30, 45 | ° | / |
| EW | 0–0.8 | m | / |
| HCW | 1.5–3 | m | / |
| BH | 3.0–4.5 | m | / |
| BO | −15–15 | ° | / |
| WT (Table 2) | 1; 2; 3; 4; 5; 6; 7 | / | / |
| EPS | 0.03; 0.05; 0.07; 0.09; 0.11; 0.13 | m | 240 (CNY/m−3) |
| XPS | 0.02; 0.04; 0.06; 0.08; 0.1; 0.12 | m | 260 (CNY/m−3) |
Table 2.
Types of exterior windows (definition of abbreviations: Low-E = low emissivity coated glass; T = transmission; and number = thickness (mm)).
Table 2.
Types of exterior windows (definition of abbreviations: Low-E = low emissivity coated glass; T = transmission; and number = thickness (mm)).
| Type | Tectonic Level | SHGC | K (W·m−2·K−1) | Initial Investment (CNY/m−2) |
|---|
| 1 | 6clear glass + 9Air + 6clear glass | 0.752 | 3.12 | 192 |
| 2 | 6clear glass + 12Air + 6clear glass | 0.725 | 2.93 | 241 |
| 3 | 6Low-E + 9Air + 6clear glass + 200Air + 6Low-E | 0.421 | 2.35 | 290 |
| 4 | 6Low-E + 9Air + 6Low-E (High T) | 0.477 | 2.40 | 265 |
| 5 | 6Low-E + 9Air + 6Low-E (Low T) | 0.453 | 2.11 | 282 |
| 6 | 6clear glass + 9Air + 6clear glass + 200Air + 6clear glass | 0.532 | 2.34 | 260 |
| 7 | 3Low-E + 0.1Air + 3Low-E | 0.656 | 2.22 | 240 |
Table 3.
Genetic algorithm parameter settings.
Table 3.
Genetic algorithm parameter settings.
| Setting Parameters | Numerical Value | Type |
|---|
| Crossover Probability | 0.9 | Ratio |
| Mutation Probability | 1/r | Ratio |
| Crossover Distribution Index | 20 | Number |
| Mutation Distribution Index | 20 | Number |
| Random Seed | 1 | Number |
Table 4.
Random case parameter variables.
Table 4.
Random case parameter variables.
| | Type | RF
(m) | PHW
(m) | PHD
(m) | WWHW
(m) | EWHW
(m) | WHD
(m) | BH
(m) | EW
(m) | HCW
(m) | BO
(°) | EPS
(m) | XPS
(m) | WT |
|---|
| 1 | 2 | 1 | 17 | 4 | 6 | 4 | 10 | 3.1 | 0 | 1.5 | −11 | 0.07 | 0.07 | 0 |
| 2 | 2 | 1 | 14 | 3 | 5 | 7 | 7 | 3 | 0.1 | 1.5 | −7 | 0.1 | 0.1 | 1 |
| 3 | 2 | 0 | 14 | 8 | 5 | 8 | 7 | 3 | 0.2 | 1.6 | −9 | 0.11 | 0.12 | 0 |
| 4 | 3 | 3 | 18 | 8 | 6 | 4 | 6 | 3.5 | 0.5 | 2.2 | −9 | 0.1 | 0.12 | 1 |
| 5 | 3 | 2 | 14 | 5 | 3 | 7 | 6 | 3 | 0.2 | 2.5 | 4 | 0.11 | 0.12 | 0 |
| 6 | 3 | 1 | 19 | 5 | 3 | 3 | 3 | 3 | 0 | 1.5 | −7 | 0.1 | 0.11 | 0 |
| 7 | 4 | 1 | 15 | 5 | 7 | 4 | 4 | 3.8 | 0.6 | 2.8 | −5 | 0.06 | 0.07 | 5 |
| 8 | 4 | 0 | 19 | 5 | 7 | 4 | 8 | 3 | 0.2 | 2.6 | −3 | 0.13 | 0.09 | 0 |
| 9 | 4 | 2 | 18 | 10 | 5 | 8 | 7 | 3 | 0.4 | 2.6 | 1 | 0.12 | 0.12 | 6 |
Table 5.
Random case target value.
Table 5.
Random case target value.
| | Real Value | Predicted Value | Variation Percentages |
|---|
| | TLI | COST | UTCI | TLI | COST | UTCI | TLI | COST | UTCI |
|---|
| 1 | 99.588 | 15,975.544 | 17.2356 | 100.945 | 17,254.183 | 17.232 | 0.013 | 0.080 | 0.0002 |
| 2 | 94.141 | 15,672.962 | 17.2003 | 93.556 | 14,721.819 | 17.175 | 0.006 | 0.061 | 0.0014 |
| 3 | 73.972 | 18,869.712 | 17.0575 | 76.573 | 18,588.224 | 17.017 | 0.035 | 0.014 | 0.0023 |
| 4 | 107.564 | 34,047.649 | 16.6412 | 103.649 | 35,139.878 | 16.603 | 0.036 | 0.032 | 0.0022 |
| 5 | 96.054 | 19,117.673 | 16.4816 | 96.596 | 19,841.098 | 16.504 | 0.005 | 0.037 | 0.0013 |
| 6 | 104.105 | 17,278.576 | 17.0768 | 105.630 | 17,330.527 | 17.083 | 0.014 | 0.003 | 0.0003 |
| 7 | 118.379 | 26,361.811 | 16.0661 | 121.534 | 27,027.687 | 16.042 | 0.026 | 0.025 | 0.0015 |
| 8 | 82.548 | 29,951.88 | 16.7105 | 80.286 | 30,869.421 | 16.689 | 0.027 | 0.031 | 0.0012 |
| 9 | 76.796 | 40,781.825 | 16.4246 | 79.623 | 42,006.448 | 16.430 | 0.036 | 0.030 | 0.0003 |
| Disclaimer/Publisher’s Note: The statements, opinions and data contained in all publications are solely those of the individual author(s) and contributor(s) and not of MDPI and/or the editor(s). MDPI and/or the editor(s) disclaim responsibility for any injury to people or property resulting from any ideas, methods, instructions or products referred to in the content. |
© 2024 by the authors. Licensee MDPI, Basel, Switzerland. This article is an open access article distributed under the terms and conditions of the Creative Commons Attribution (CC BY) license (https://creativecommons.org/licenses/by/4.0/).


