
Evaluating Cleaning Services in Civil Environments: Microbiological and Life Cycle Analysis Comparing Conventional and Sustainable Methods

 , , , ,

Abstract
:1. Introduction
2. Materials and Methods
2.1. Cleaning Plan
2.2. Microbiological Assessment: Sampling Plan
2.3. Isolation and Characterization of Microorganisms
2.4. Cleaning Modus Operandi and Protocol Selection
- The use of microfiber mop with fringes and cloths both in the “Traditional” and in the “GREEN” protocol; the fringes used differed in weight (heavier for TT fringes), while the cloths differed in both weight (heavier for TT clothes) and the eco-label (present only for clothes used in TG). In both protocols, the textile reconditioning cycles took place at 60 °C;
- The use of eco-labeled detergents for the cleaning of floors and surfaces with dosages in tanks ranging from 2 to 100% for the “Traditional” protocol, while for the “GREEN” protocol, more diluted dosages were used than “Traditional” protocol products. In the “GREEN” protocol, the dosages ranged from 0.08% to 100% [13,14].
2.4.1. Formula Servizi “Traditional” (TT) and “GREEN” (TG) Protocols
2.4.2. Standard/GREEN Protocol Active Ingredients
Phenylphenol
Sodium Hypochlorite
Hydrogen Peroxide
Peracetic Acid
Surfactants
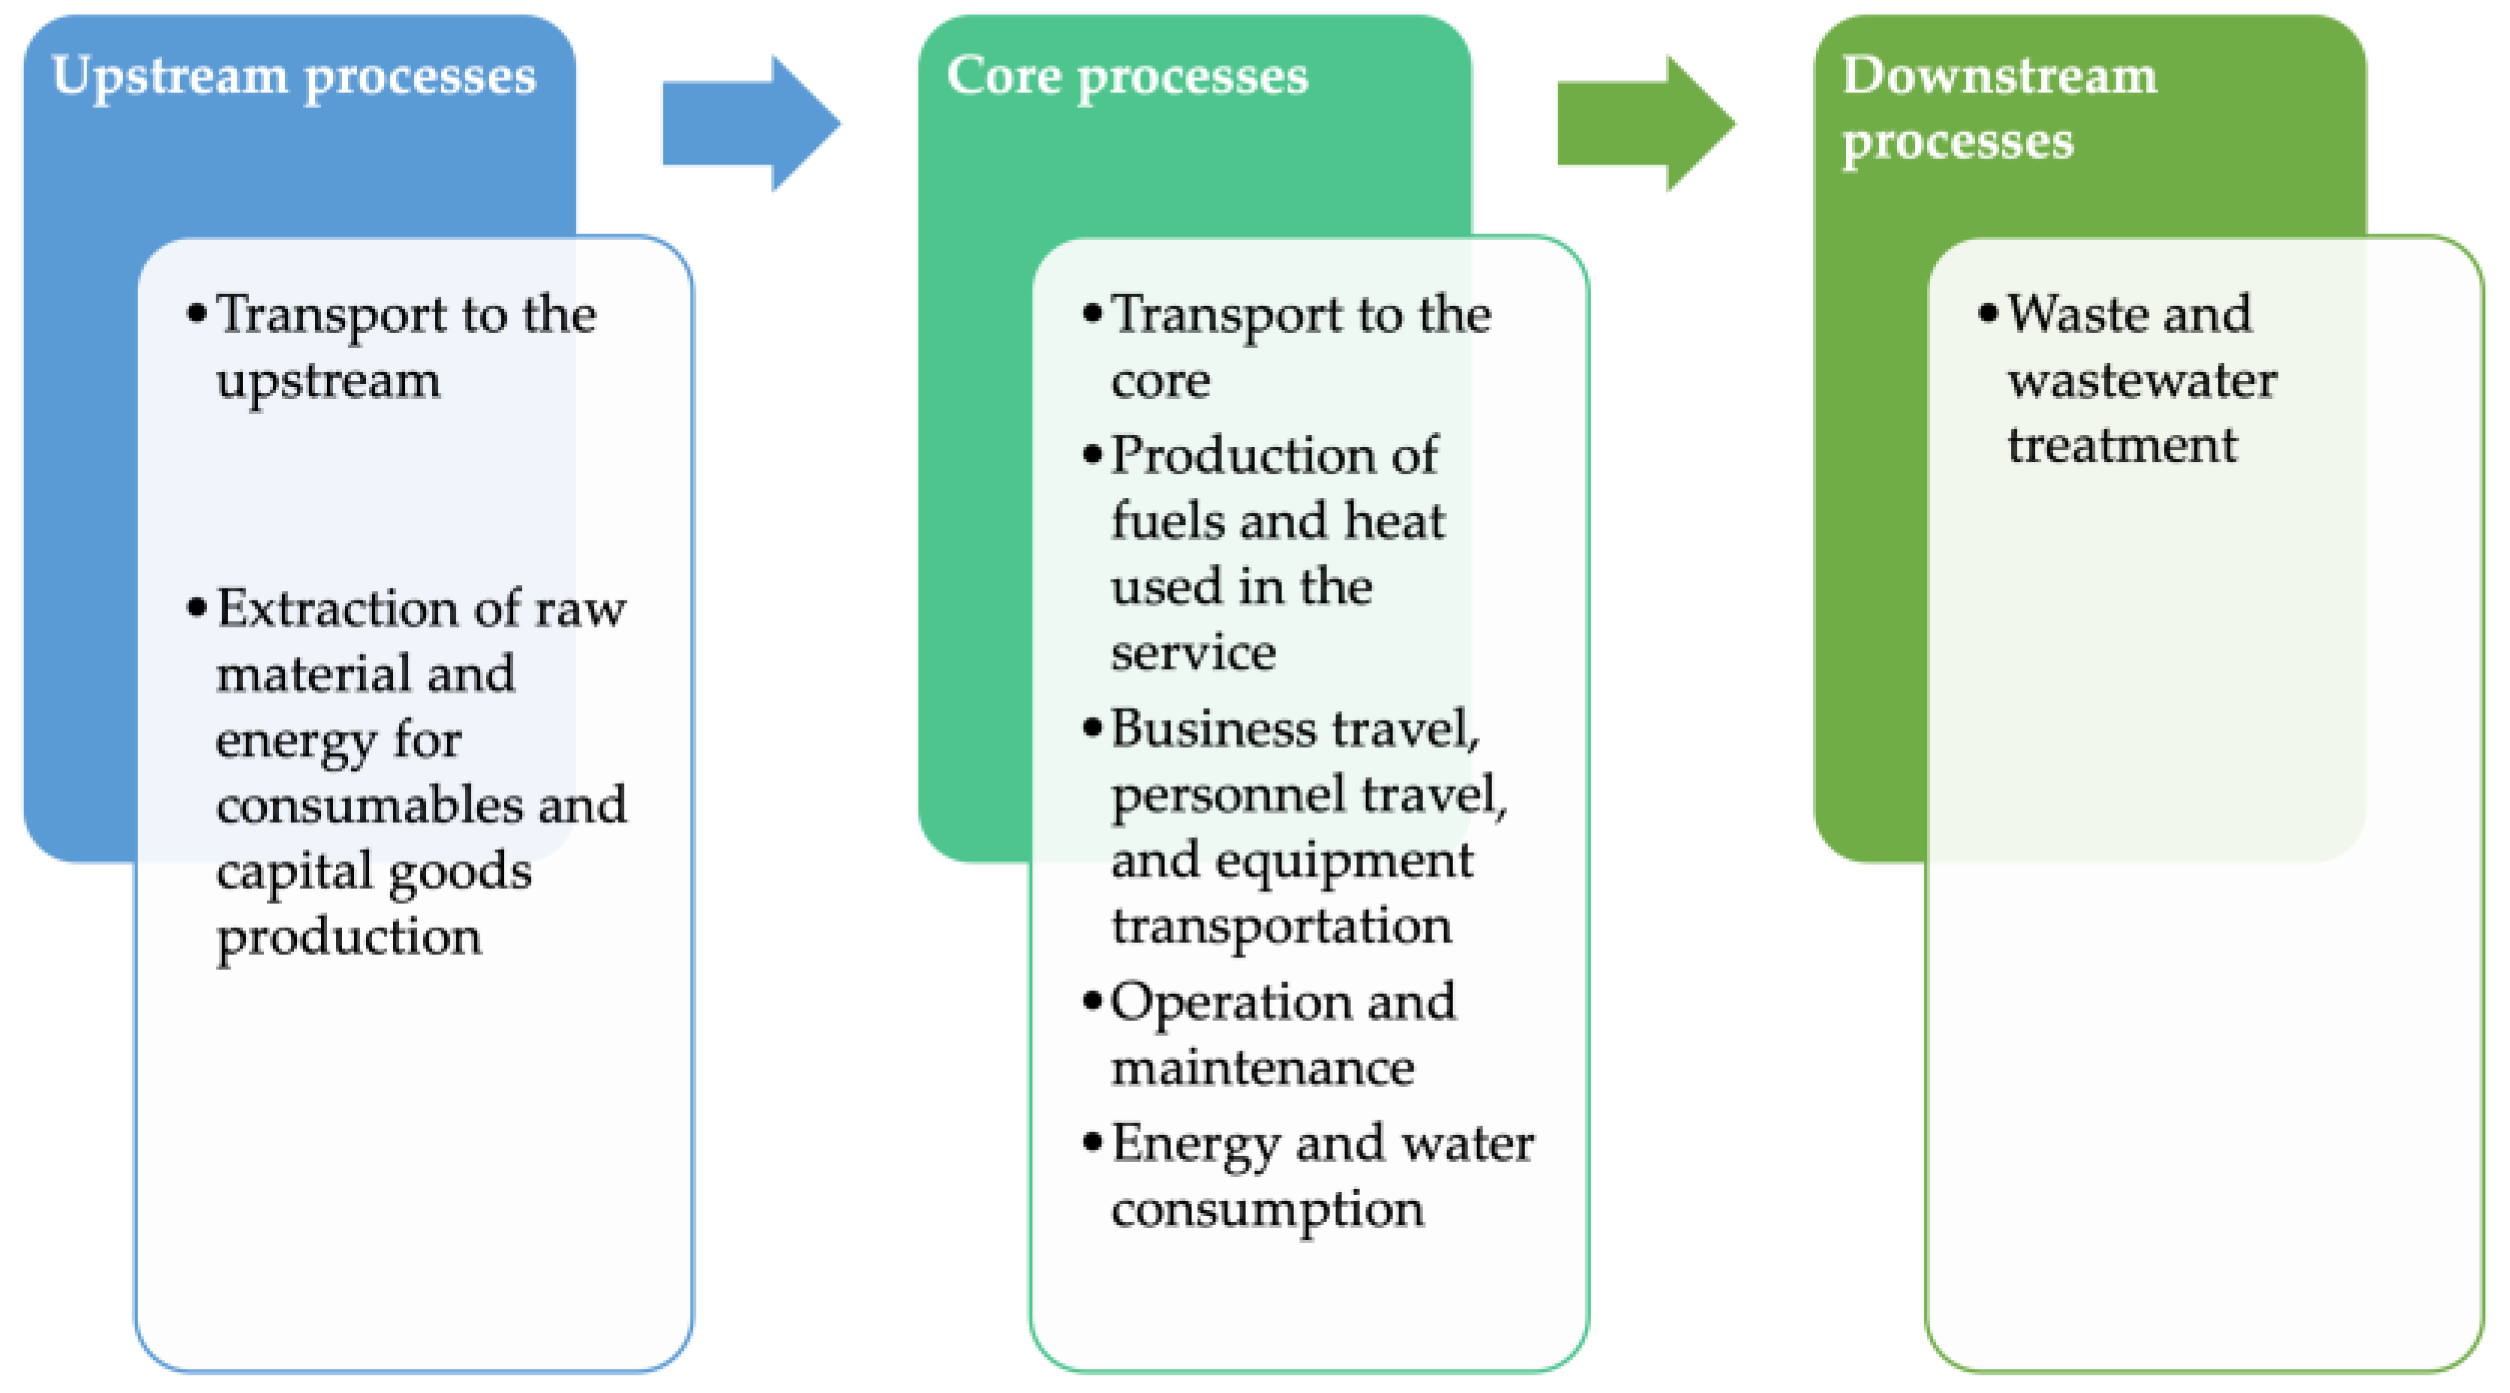
2.5. LCA
- The extraction and processing of raw materials;
- The transportation of raw materials and semi-finished products to suppliers;
- The manufacturing of consumer goods, specifically chemicals (such as detergents and disinfectants) and textiles (fringes and cloths), along with their primary (plastic) and secondary (cardboard) packaging;
- The production of cleaning trolleys;
- The manufacturing of machinery, such as washers, dryers, and washing machines.
- The oversight of the supply chain for consumer goods, ensuring their smooth journey from manufacturers to the service site;
- The execution of services utilizing chemicals, textiles, cleaning equipment, and machinery;
- The production of transportation fuels;
- The generation of electricity used on-site for service execution;
- Water consumption is required for diluting chemicals and operating washing machines.
- Both systems under comparison share an identical functional unit, possessing equivalent spatial characteristics and requiring similar interventions;
- Due to the nature of this comparative analysis, we have not taken into account equivalent processes. For instance, the transportation of personnel on-site, which is consistent in both protocols, has not been individually considered;
- The areas under investigation are consistent and remain unchanged;
- The criteria for including inputs and outputs are uniform;
- The quality requirements for the data are the same;
- The Life Cycle inventory units are uniform;
- The calculation procedures closely resemble each other;
- The allocation rules are comparable;
- The selected impact categories and characterization factors are identical, with reference to ISO:14067 and GWP100. This is the only impact category taken into consideration because global warming is the environmental theme of highest concern;
- The types of interventions and the frequency of operations are indistinguishable between the two cases;
- The surfaces are comparable in terms of floor type, property usage, and overall dimensions;
- The extent of usage in the sampled areas and the level of dirt are similar;
- Regarding electricity consumption, a precautionary approach has been taken due to the absence of specific data for the site-specific supply contract. Therefore, the national energy mix has been used as an approximation;
- The total property area measures 3561.74 square meters.
2.6. Statistical Analysis
3. Results and Discussion
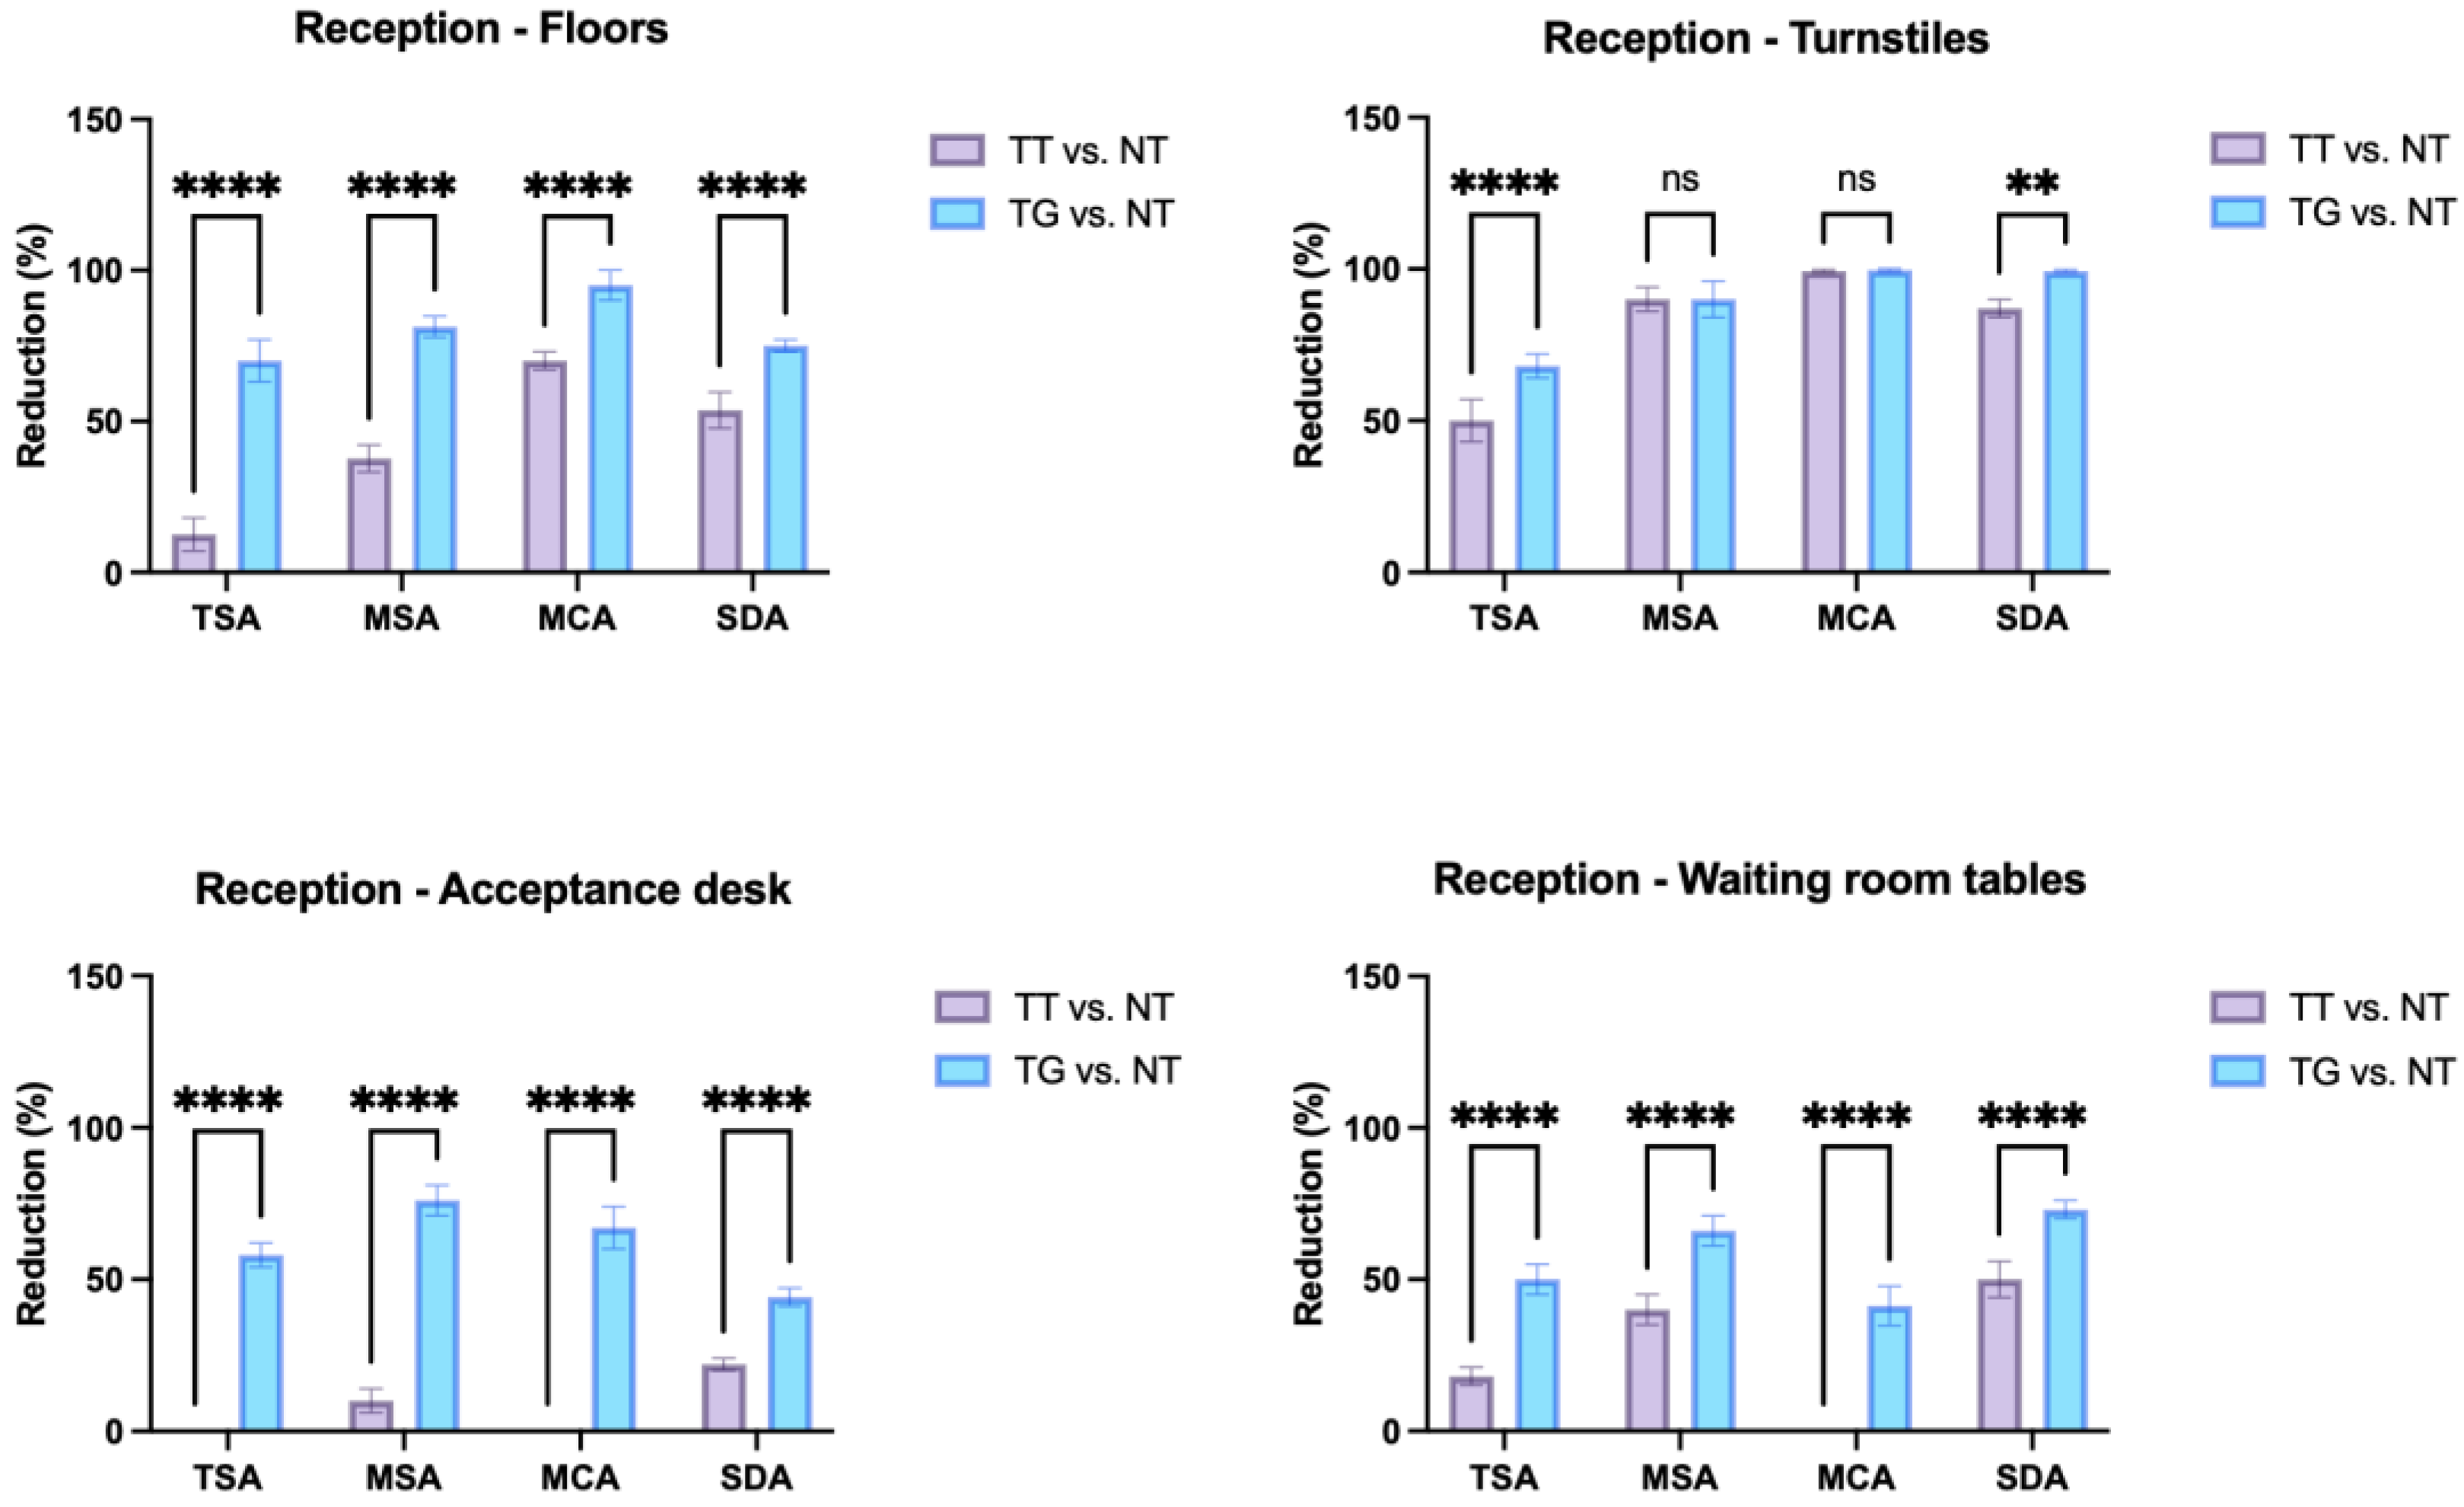
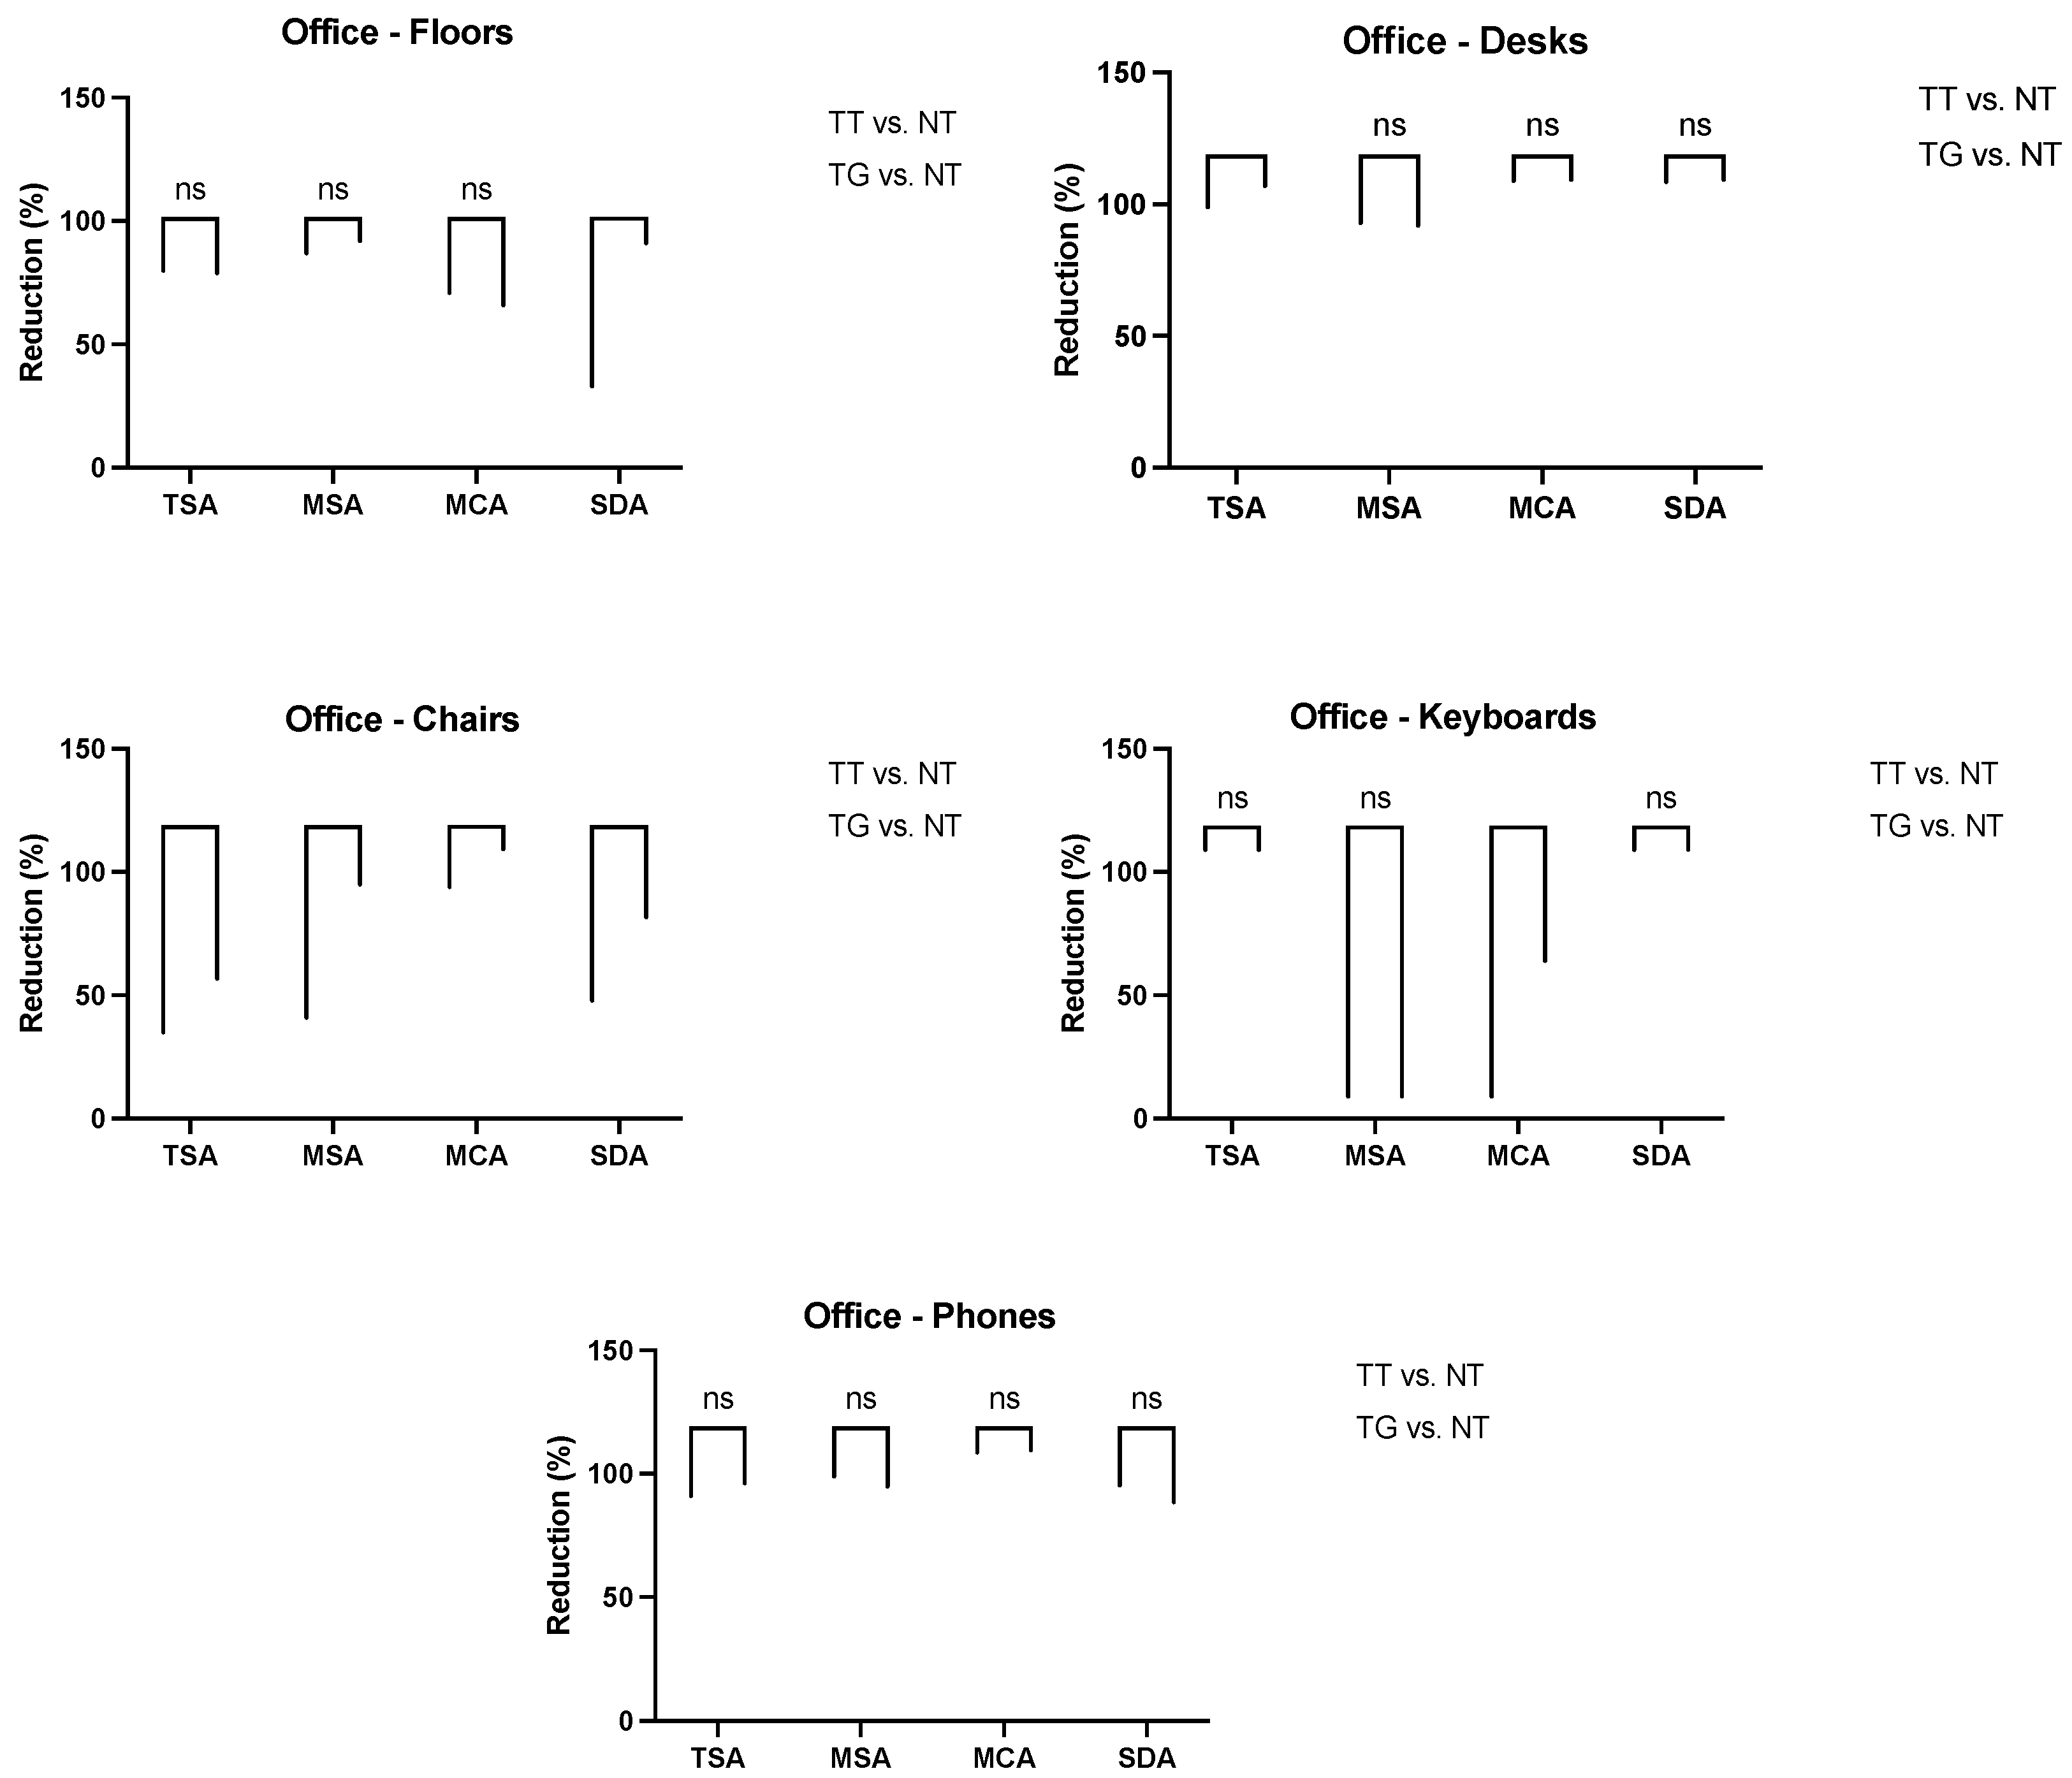
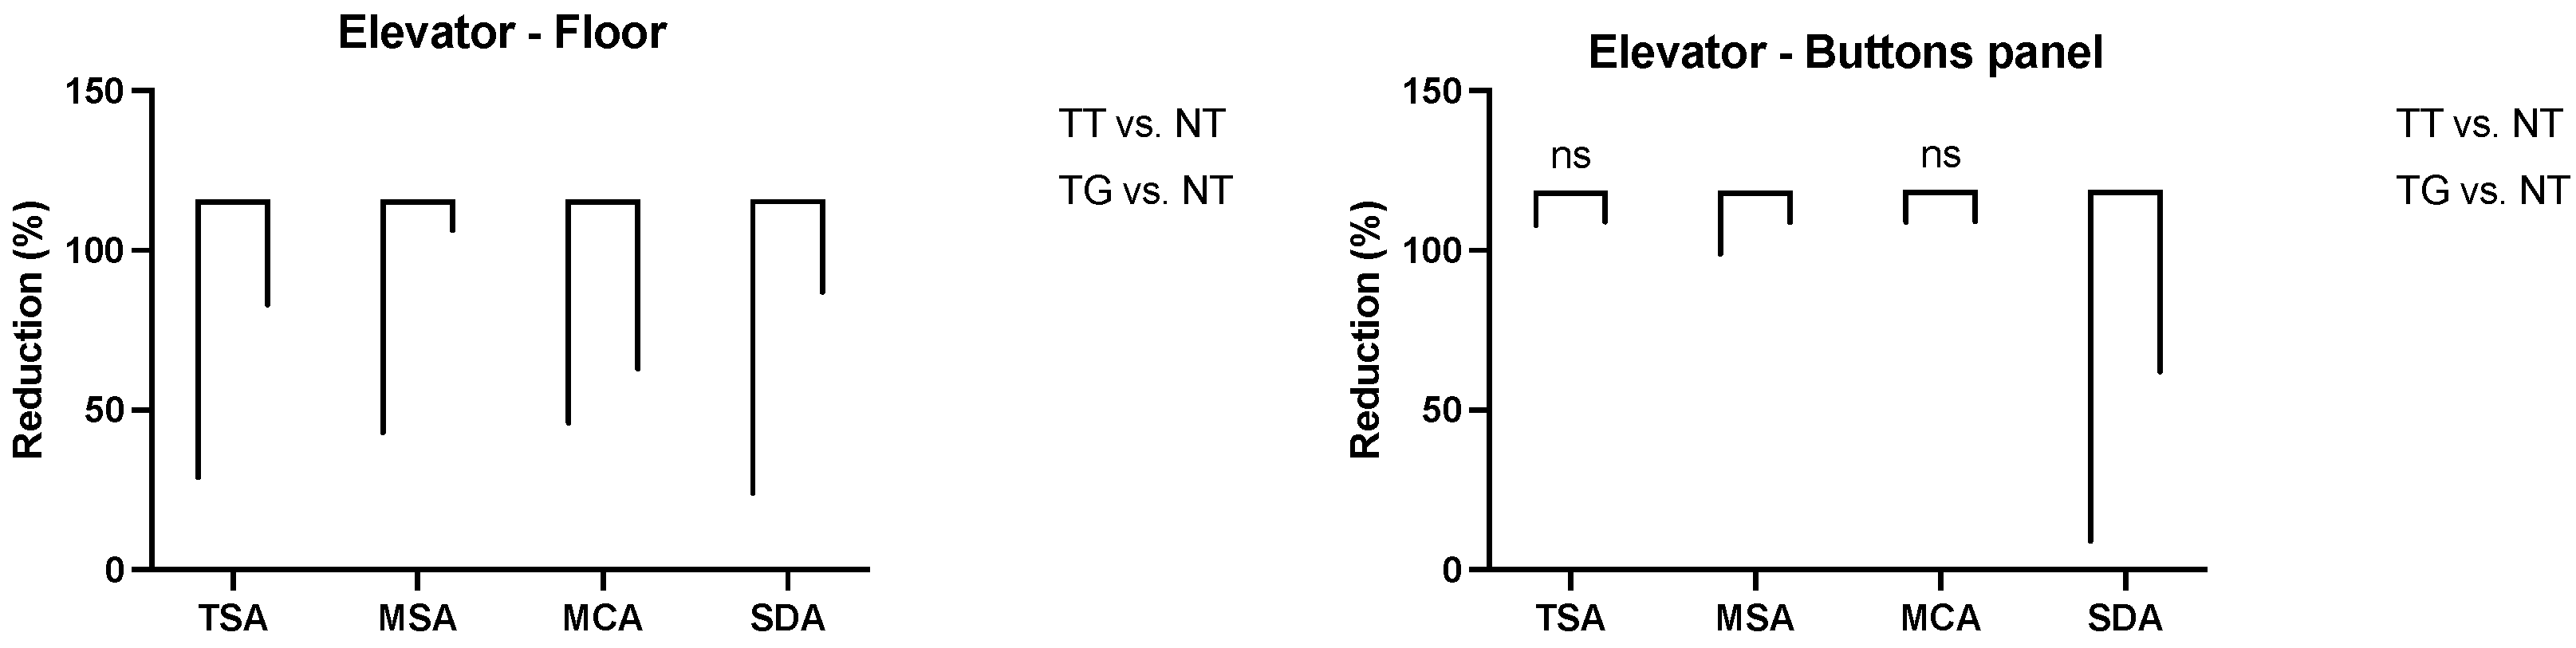
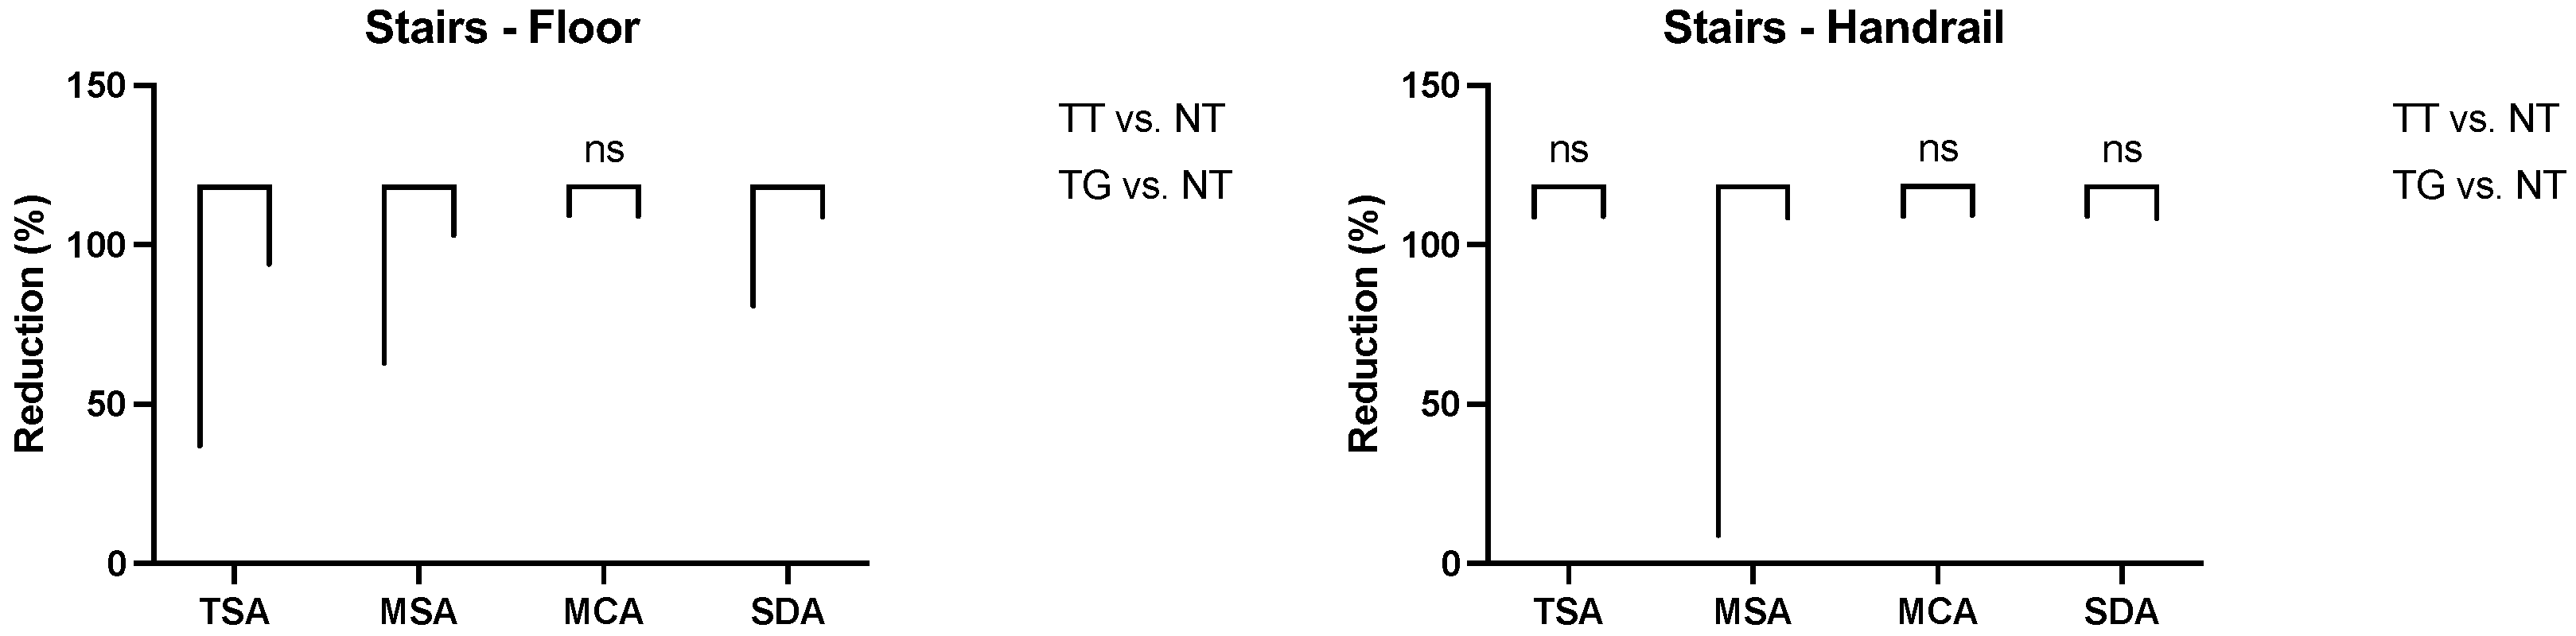
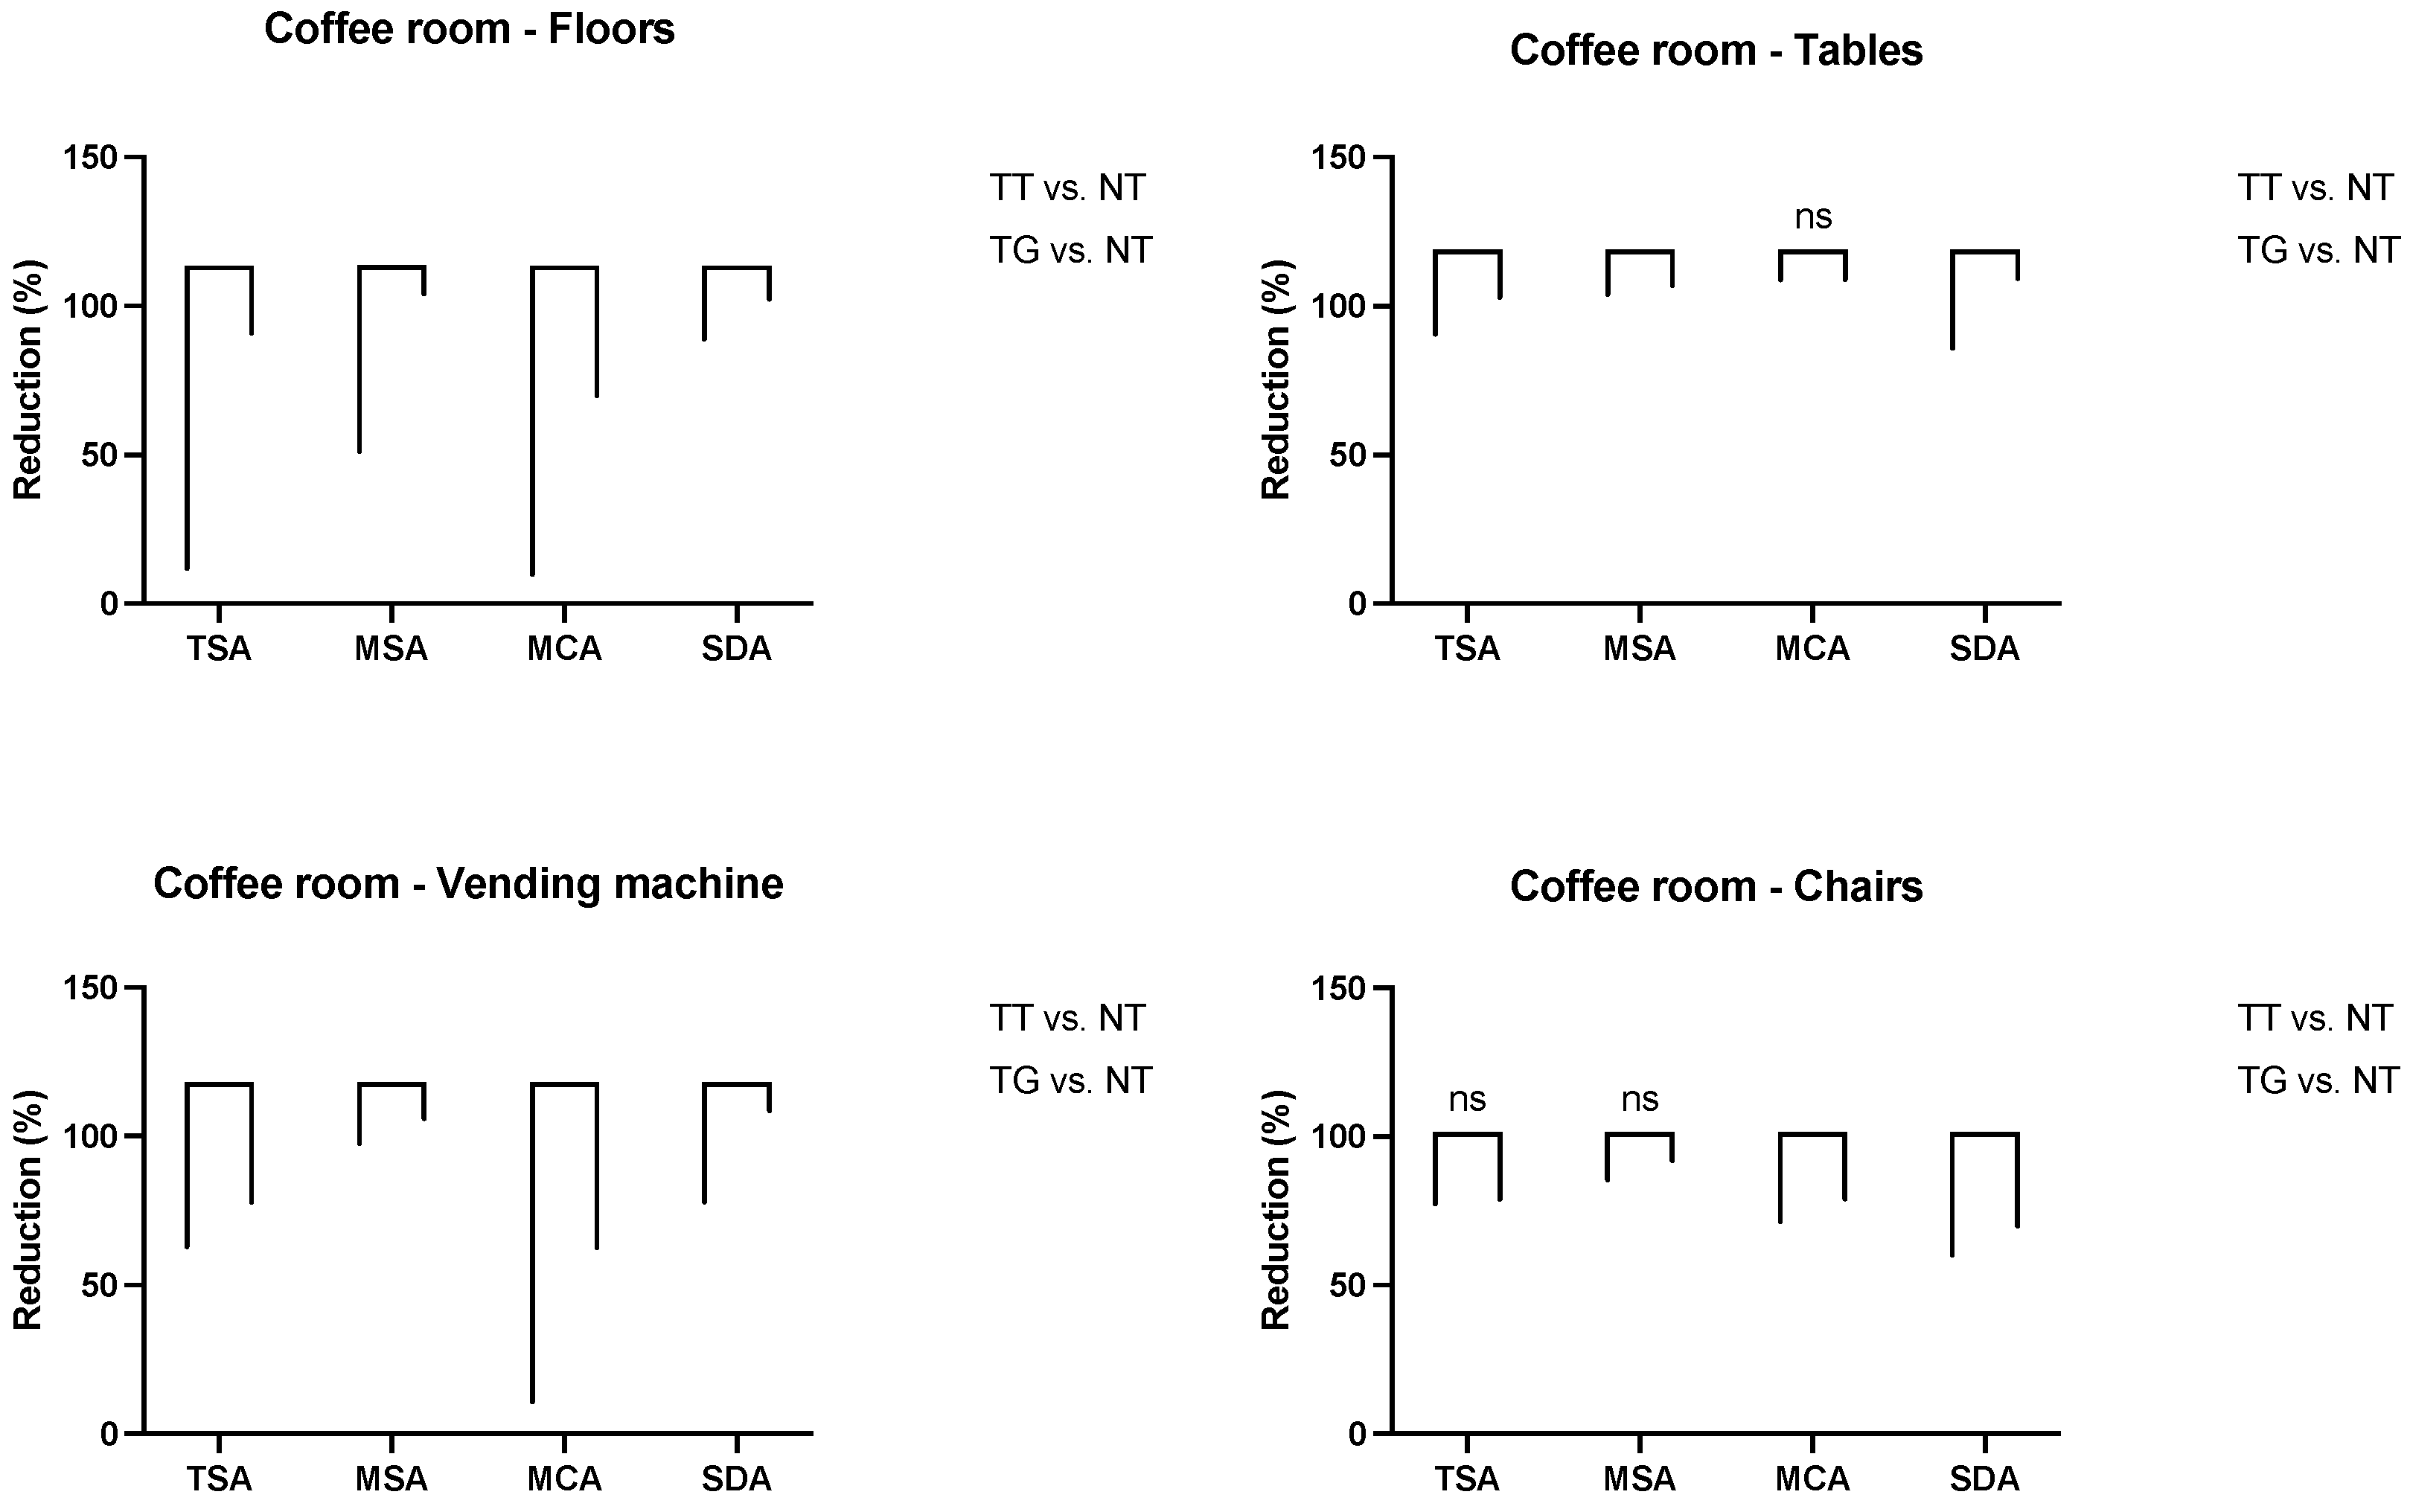
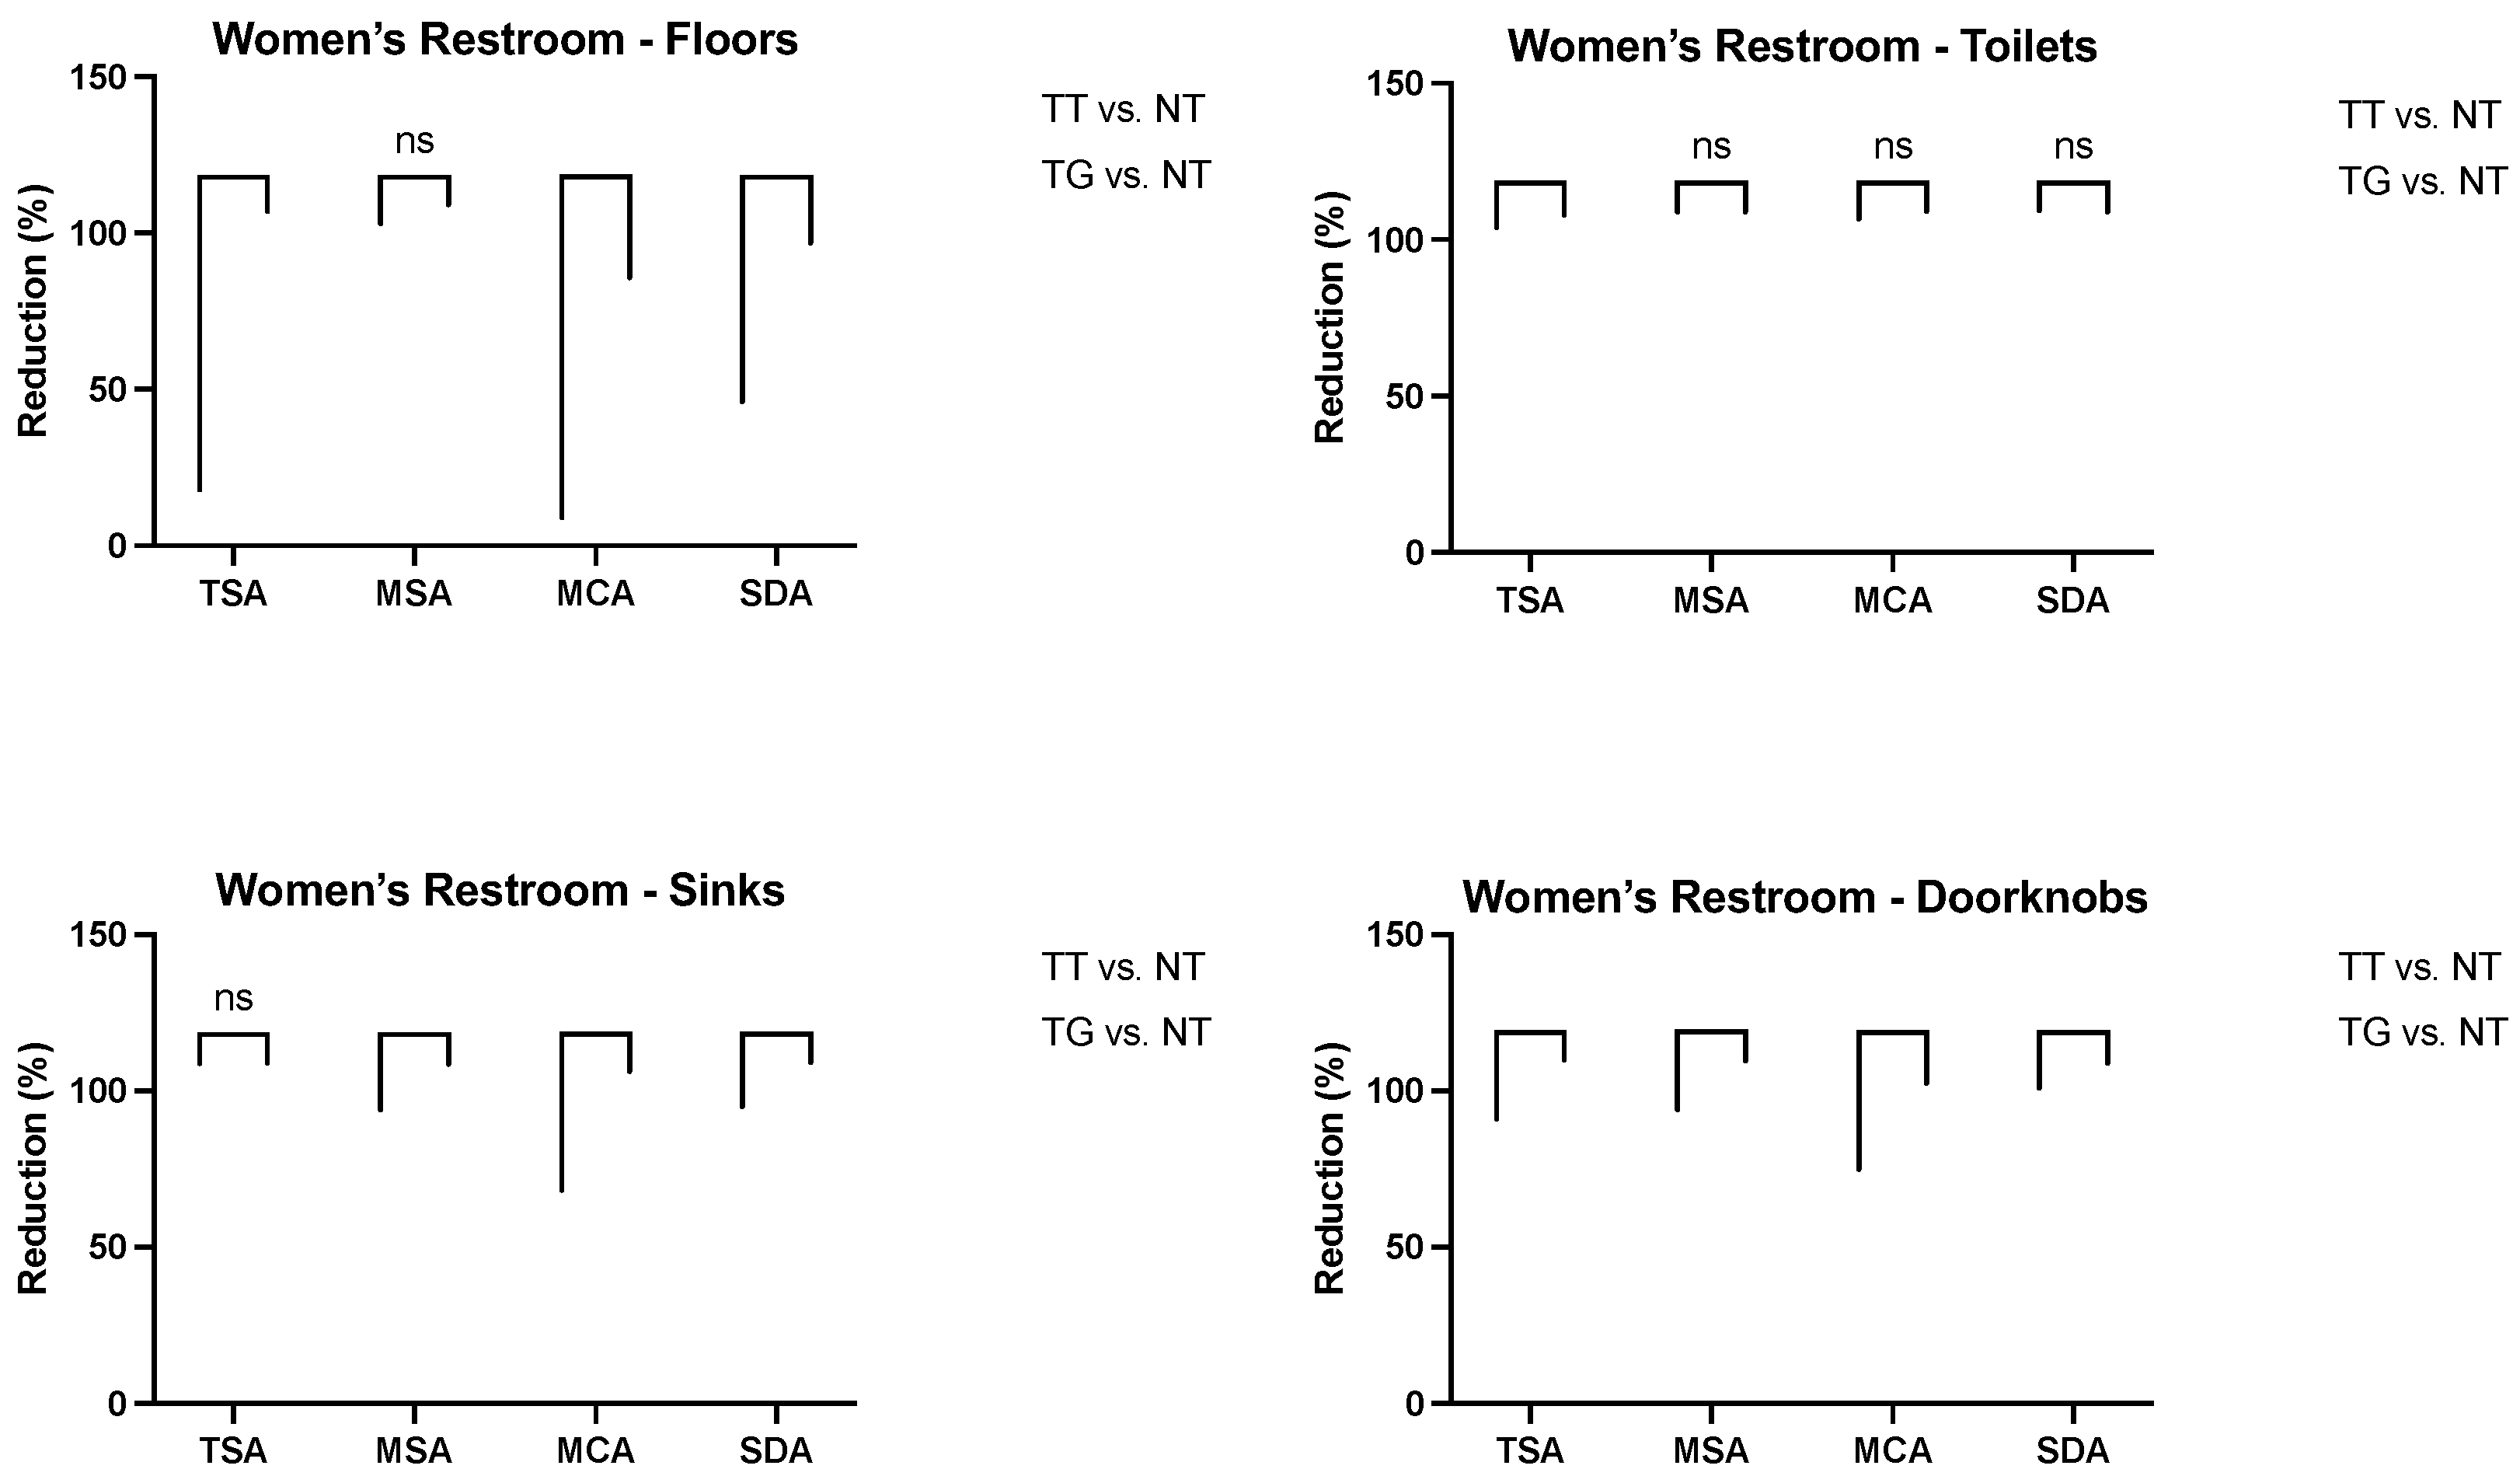
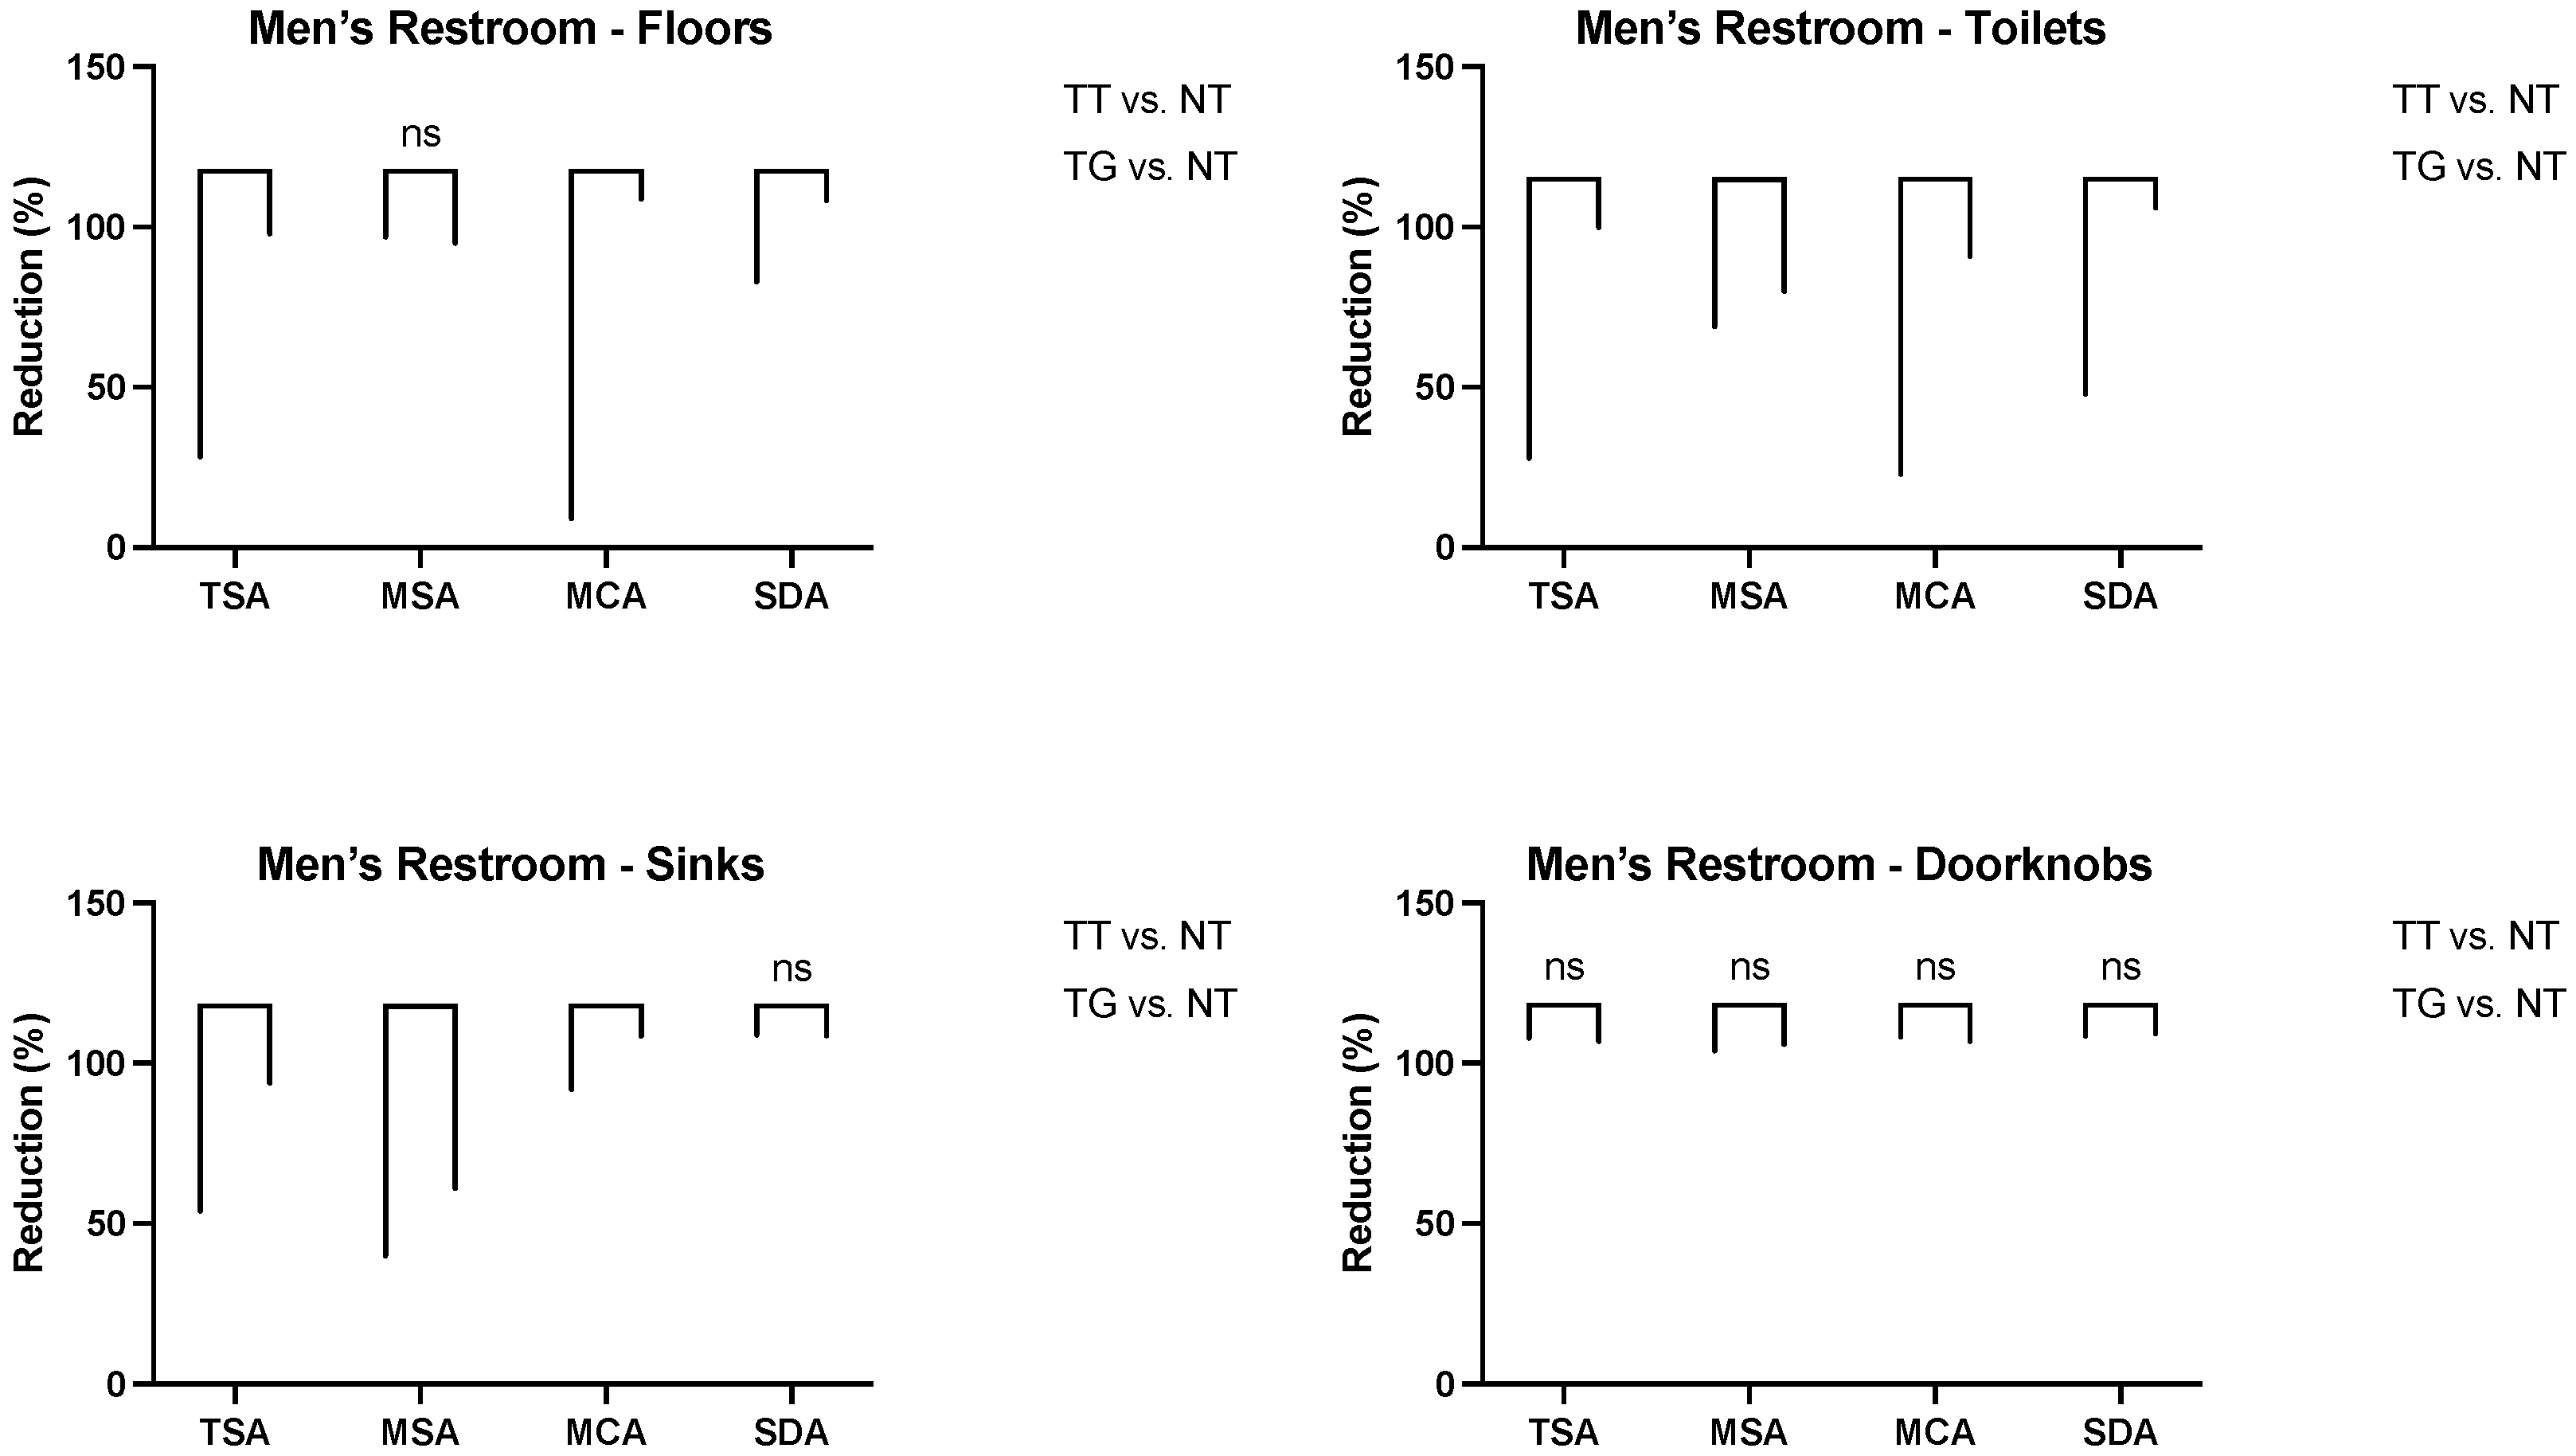
3.1. Microbiological Assessment
3.2. LCA
- For the “GREEN” protocol: laundry chemical production (29% of the total GWP100 score), laundry energy consumption (25%), and cleaning trolley production (20%);
- For the “Traditional” protocol: laundry chemical production (54% of the total GWP100 score), laundry energy consumption (23%), and cleaning trolley production (8%).
4. Conclusions
Author Contributions
Funding
Institutional Review Board Statement
Data Availability Statement
Acknowledgments
Conflicts of Interest
Correction Statement
References
- Mensah, J. Sustainable development: Meaning, history, principles, pillars, and implications for human action: Literature review. Cogent Soc. Sci. 2018, 5, 1653531. [Google Scholar] [CrossRef]
- Mahmud, R.; Moni, S.M.; High, K.; Carbajales-Dale, M. Integration of techno-economic analysis and life cycle assessment for sustainable process design—A review. J. Clean. Prod. 2021, 317, 128247. [Google Scholar] [CrossRef]
- Final Communication from the Commission to the Council and the European Parliament Integrated Product Policy Building on Environmental Life-Cycle Thinking. Available online: http://europa.eu.int/comm/environment/ipp/ippsum.pdf (accessed on 10 August 2022).
- Friedrich, A.W. Control of hospital acquired infections and antimicrobial resistance in Europe: The way to go. Wien. Med. Wochenschr. 2019, 169, 25–30. [Google Scholar] [CrossRef]
- Boyce, J.M. Modern technologies for improving cleaning and disinfection of environmental surfaces in hospitals. Antimicrob. Resist. Infect. Control 2016, 5, 10. [Google Scholar] [CrossRef]
- Griffith, C.; Cooper, R.; Gilmore, J.; Davies, C.; Lewis, M. An evaluation of hospital cleaning regimes and standards. J. Hosp. Infect. 2000, 45, 19–28. [Google Scholar] [CrossRef]
- Dancer, S. How do we assess hospital cleaning? A proposal for microbiological standards for surface hygiene in hospitals. J. Hosp. Infect. 2004, 56, 10–15. [Google Scholar] [CrossRef]
- Linee Guida Sugli Standard di Sicurezza e di Igiene del Lavoro Nel Reparto Operatorio Istituto Superiore per la Prevenzione e la Sicurezza del Lavoro Dipartimento Igiene del Lavoro. Available online: http://www.ispesl.it (accessed on 10 August 2022).
- La Contaminazione Microbiologica delle Superfici Negli Ambienti Lavorativi. 2017. Available online: www.inail.it (accessed on 10 August 2022).
- Galvin, S.; Dolan, A.; Cahill, O.; Daniels, S.; Humphreys, H. Microbial monitoring of the hospital environment: Why and how? J. Hosp. Infect. 2012, 82, 143–151. [Google Scholar] [CrossRef]
- Flouchi, R.; Elmniai, A.; El Far, M.; Touzani, I.; El Hachlafi, N.; Fikri-Benbrahim, K. Microbiological Monitoring of the Environment Using the “Association Rules” Approach and Disinfection Procedure Evaluation in a Hospital Center in Morocco. J. Environ. Public Health 2021, 2021, 7682042. [Google Scholar] [CrossRef]
- Bielawska-Drózd, A.; Cieślik, P.; Wlizło-Skowronek, B.; Winnicka, I.; Kubiak, L.; Jaroszuk-Ściseł, J.; Depczyńska, D.; Bohacz, J.; Korniłłowicz-Kowalska, T.; Skopińska-Różewska, E.; et al. Identification and characteristics of biological agents in work environment of medical emergency services in selected ambulances. Int. J. Occup. Med. Environ. Health 2017, 30, 617–627. [Google Scholar] [CrossRef]
- Nilsen, S.K.; Dahl, I.; Jhrgensen, O.; Schneider, T. Micro-Ÿbre and Ultra-Micro-Ÿbre Cloths, Their Physical Characteristics, Cleaning Eeect, Abrasion on Surfaces, Friction, and Wear Resistance. 2002. Available online: www.elsevier.com/locate/buildenv (accessed on 10 October 2023).
- Smith, D.; Gillanders, S.; Holah, J.; Gush, C. Assessing the efficacy of different microfibre cloths at removing surface micro-organisms associated with healthcare-associated infections. J. Hosp. Infect. 2011, 78, 182–186. [Google Scholar] [CrossRef]
- Bomhard, E.; Brendler-Schwaab, S.; Freyberger, A.; Herbold, B.; Leser, K.; Richter, M. O-Phenylphenol and its Sodium and Potassium Salts: A Toxicological Assessment. Crit. Rev. Toxicol. 2002, 32, 551–626. [Google Scholar] [CrossRef]
- Fukuzaki, S. Mechanisms of Actions of Sodium Hypochlorite in Cleaning and Disinfection Processes. Biocontrol Sci. 2006, 11, 147–157. [Google Scholar] [CrossRef]
- Cabassud, A.C.; Aptel, P. Bactericidal Properties of Peracetic Acid and Hydrogen Peroxide, Alone and in Combination, and Chlorine and Formaldehyde against Bacterial Water Strains. Available online: www.nrcresearchpress.com (accessed on 13 October 2023).
- Hart, P.W.; Manager, S.T.; Operations, M.M.; Rudie, A. Hydrogen peroxide: An environmentally friendly but dangerous bleaching chemical. In Proceedings of the TAPPI Engineering, Pulping and Environmental Conference, Jacksonville, FL, USA, 21–23 October 2007; TAPPI Press: Atlanta, GA, USA, 2007; pp. 1–44. Available online: https://www.fs.usda.gov/research/treesearch/34782 (accessed on 16 December 2022).
- Falk, N.A. Surfactants as Antimicrobials: A Brief Overview of Microbial Interfacial Chemistry and Surfactant Antimicrobial Activity. J. Surfactants Deterg. 2019, 22, 1119–1127. [Google Scholar] [CrossRef]
- Glover, R.E.; Smith, R.R.; Jones, M.V.; Jackson, S.K.; Rowlands, C.C. An EPR investigation of surfactant action on bacterial membranes. FEMS Microbiol. Lett. 1999, 177, 57–62. [Google Scholar] [CrossRef]
- SO 14044:2006; Environmental Management-Life Cycle Assessment-Requirements and Guidelines. ISO: Geneva, Switzerland, 2006. Available online: https://www.iso.org/standard/38498.html (accessed on 10 August 2019).
- ISO 14040:2006; Environmental Management–Life Cycle 596 Assessment–Principles and Framework. ISO: Geneva, Switzerland, 2006. Available online: https://www.iso.org/standard/37456.html (accessed on 10 August 2019).
- ISO 14067:2018; Greenhouse Gases—Carbon Footprint of Products—Requirements and Guidelines for Quantification. 2018. Available online: https://www.iso.org/standard/71206.html (accessed on 10 August 2023).
- Product Category Rules Construction Products and Construction Services 2012:01 Version 2.2. 2017. Available online: www.environdec.com (accessed on 10 August 2023).
- Voss, A.; Loeffen, F.; Bakker, J.; Klaassen, C.; Wulf, M. Methicillin-resistant Staphylococcus aureus in Pig Farming. Emerg. Infect. Dis. 2005, 11, 1965–1966. [Google Scholar] [CrossRef]
- Garcia-Graells, C.; van Cleef, B.A.G.L.; Larsen, J.; Denis, O.; Skov, R.; Voss, A. Dynamic of Livestock-Associated Methicillin-Resistant Staphylococcus aureus CC398 in Pig Farm Households: A Pilot Study. PLoS ONE 2013, 8, e65512. [Google Scholar] [CrossRef]
- Gołofit-Szymczak, M.; Górny, R.; Ławniczek-Wałczyk, A.; Cyprowski, M.; Stobnicka, A. Bacterial and fungal aerosols in the work environment of cleaners. Med. Pr. 2015, 66, 779–791. [Google Scholar] [CrossRef]
- Nigam, Y.; Cutter, J. A preliminary investigation into bacterial contamination of Welsh emergency ambulances. Emerg. Med. J. 2003, 20, 479–482. [Google Scholar] [CrossRef]
- Alvarez-Aldana, A.; Henao-Benavidez, M.J.; Laverde-Hurtado, S.C.; Muñoz, D.M.; López-Villegas, M.E.; León, S.C.S.-D.; Trujillo, O.M.H. ¿Emergency ambulances potential source of infections? An assessment of cleaning and disinfection procedures. Interdiscip. J. Epidemiol. Public Health 2018, 1, e-014. [Google Scholar] [CrossRef]
- Fijan, S.; Cencic, A.; Sostar-Turk, S. Implementing hygiene monitoring systems in hospital laundries in order to reduce microbial contamination of hospital textiles. J. Hosp. Infect. 2005, 61, 30–38. [Google Scholar] [CrossRef]
- Boyetchko, S.M.; Svircev, A.M. A novel approach for developing microbial biopesticides. In Biological Control Programmes in Canada 2001–2012; CABI: Wallingford, UK, 2013; Available online: https://books.google.com/books?hl=it&lr=&id=txb4AgAAQBAJ&oi=fnd&pg=PA37&ots=x12zC8HRS_&sig=vhyGDWs8FpqeTmqUeHF8qrFtdB8 (accessed on 22 November 2022).
- Madsen, A.M.; Rasmussen, P.U.; Frederiksen, M.W. Accumulation of microorganisms on work clothes of workers collecting different types of waste—A feasibility study. Waste Manag. 2022, 139, 250–257. [Google Scholar] [CrossRef] [PubMed]
- Fujii, J.; Yoshida, S.-I. Legionella Infection and Control in Occupational and Environmental Health. Rev. Environ. Health 1998, 13, 179–203. [Google Scholar] [CrossRef] [PubMed]
- Simon, X.; Duquenne, P. Assessment of Workers’ Exposure to Bioaerosols in a French Cheese Factory. Ann. Occup. Hyg. 2014, 58, 677–692. [Google Scholar] [CrossRef] [PubMed]
- Reynolds, K.A.; Watt, P.M.; Boone, S.A.; Gerba, C.P. Occurrence of bacteria and biochemical markers on public surfaces. Int. J. Environ. Health Res. 2005, 15, 225–234. [Google Scholar] [CrossRef]
- Elsergany, M.; Moussa, M.; Ahsan, A.; Khalfan, A.; Eissa, A. Exploratory Study of Bacterial Contamination of Different Surfaces in Four Shopping Malls in Sharjah, UAE. J. Environ. Occup. Sci. 2015, 4, 101–105. [Google Scholar] [CrossRef]
- Andersen, J.B.; Elborne, S.A. Moulds and Indoor Climate in Denmark; Lone, R., Ed.; IRGWP: Stockholm, Sweden, 2005. [Google Scholar]
- Adams, R.I.; Miletto, M.; Taylor, J.W.; Bruns, T.D. The Diversity and Distribution of Fungi on Residential Surfaces. PLoS ONE 2013, 8, e78866. [Google Scholar] [CrossRef]


| Reception | Floor |
| Desk | |
| Turnstiles | |
| Waiting room table | |
| Office area | Floor |
| Desk | |
| Chair | |
| Keyboard | |
| Phone | |
| Elevators (E)/Stairs (S) | Floor (E) |
| Floor (S) | |
| Keyboard (E) | |
| Handrail (S) | |
| Coffee Room | Floor |
| Table | |
| Chairs | |
| Vending machines | |
| Women’s Restroom | Floor |
| Toilet | |
| Doorknob | |
| Sink | |
| Men’s Restroom | Floor |
| Toilet | |
| Doorknob | |
| Sink |
| Cleaning Operation | Frequency | Working Modality |
|---|---|---|
| Dusting desks and office furniture, meeting rooms, and entrance desks; removing fingerprints from glass surfaces with more frequent contact | Daily: 5/7 | Cloth and cleaning spray |
| Cleaning and sanitizing of the refreshment and relaxation areas, with a second cleaning step in the afternoon; entrance turnstiles with the elimination of footprints; internal elevators with the sanitization of contact points | Daily: 5/7 | Cloth and cleaning spray |
| Wet trash from office floors and meeting rooms, including those in common areas | Daily: 5/7 | Sweeping with a disposable cloth |
| Manual cleaning of office floors and meeting rooms, including those in public areas | Every other day: 3/7 | Flat fringe-mop wash |
| Mechanized floor washing using a scrubbing machine | Weekly: 1/7 | Scrubbing |
| Cleaning and sanitizing of sanitary ware, with an afternoon review | Daily: 5/7 | Cloth and bottle with drip guard |
| Sanitary descaling | Weekly: 1/7 | Cloth and cleaning spray |
| Afternoon restroom refresher | Daily: 5/7 | Cloth and cleaning spray |
| Textile reconditioning—Deterging | Daily: 5/7 | |
| Textile reconditioning—Alkalizing | Daily: 5/7 | |
| Textile reconditioning—Bleaching | Daily: 5/7 | |
| Textile reconditioning—Disinfecting | Daily: 5/7 |
| Staphylococcus cohnii | Buttiauxella agrestis | Enterobacter aerogenes | Pectobacterium carotovorum |
| Staph. hominis | Candida albicans | Enterobacter gergoviae | Providencia rustigianii |
| Staph. gallinarum | Candida ciferrii | Enterococcus gallinarum | Raoultella spp. |
| Staph. epidermidis | Candida dattila | Enterococcus hirae | Firmicutes spp. |
| Staph. auricularis | Trichosporon spp. | Escherichia fergusonii | Stenotrophomonas spp. |
| Staph. xylosus | Scolecobasidium humicola | Escherichia hermannii | Curtobacterium sp. |
| Staph. simulans | Cyphellophora olivacea | Escherichia coli | Dyadobacter sp. |
| Staph. sciuri | Exophiala oligosperma | Penicillium spp. | |
| Staph. capitis | |||
| Staph. aureus |
Disclaimer/Publisher’s Note: The statements, opinions and data contained in all publications are solely those of the individual author(s) and contributor(s) and not of MDPI and/or the editor(s). MDPI and/or the editor(s) disclaim responsibility for any injury to people or property resulting from any ideas, methods, instructions or products referred to in the content. |
© 2024 by the authors. Licensee MDPI, Basel, Switzerland. This article is an open access article distributed under the terms and conditions of the Creative Commons Attribution (CC BY) license (https://creativecommons.org/licenses/by/4.0/).
Share and Cite
Fontana, R.; Buratto, M.; Caproni, A.; Nordi, C.; Pappadà, M.; Bandera, B.; Vogli, L.; Buffone, C.; Marconi, P. Evaluating Cleaning Services in Civil Environments: Microbiological and Life Cycle Analysis Comparing Conventional and Sustainable Methods. Sustainability 2024, 16, 487. https://doi.org/10.3390/su16020487
Fontana R, Buratto M, Caproni A, Nordi C, Pappadà M, Bandera B, Vogli L, Buffone C, Marconi P. Evaluating Cleaning Services in Civil Environments: Microbiological and Life Cycle Analysis Comparing Conventional and Sustainable Methods. Sustainability. 2024; 16(2):487. https://doi.org/10.3390/su16020487
Chicago/Turabian StyleFontana, Riccardo, Mattia Buratto, Anna Caproni, Chiara Nordi, Mariangela Pappadà, Beatrice Bandera, Luciano Vogli, Cesare Buffone, and Peggy Marconi. 2024. "Evaluating Cleaning Services in Civil Environments: Microbiological and Life Cycle Analysis Comparing Conventional and Sustainable Methods" Sustainability 16, no. 2: 487. https://doi.org/10.3390/su16020487