Article

Analysing the Effects of Scenario-Based Explanations on Automated Vehicle HMIs from Objective and Subjective Perspectives

1
School of Automotive Studies, Tongji University, Shanghai 201804, China
2
College of Design and Innovation, Tongji University, Shanghai 200092, China
*
Author to whom correspondence should be addressed.
Sustainability 2024, 16(1), 63; https://doi.org/10.3390/su16010063
Submission received: 8 November 2023 / Revised: 7 December 2023 / Accepted: 18 December 2023 / Published: 20 December 2023

Abstract

:
Automated vehicles (AVs) are recognized as one of the most effective measures to realize sustainable transport. These vehicles can reduce emissions and environmental pollution, enhance accessibility, improve safety, and produce economic benefits through congestion reduction and cost savings. However, the consumer acceptance of and trust in these vehicles are not ideal, which affects the diffusion speed of AVs on the market. Providing transparent explanations of AV behaviour is a method for building confidence and trust in AV technologies. In this study, we investigated the explainability of user interface information in an Automated Valet Parking (AVP) system—one of the first L4 automated driving systems with a large commercial landing. Specifically, we proposed a scenario-based explanation framework based on explainable AI and examined the effects of these explanations on drivers’ objective and subjective performance. The results of Experiment 1 indicated that the scenario-based explanations effectively improved drivers’ situational trust and user experience (UX), thereby enhancing the perception and understanding that drivers had of the system’s intelligence capabilities. These explanations significantly reduced the mental workload and elevated the user performance in objective evaluations. In Experiment 2, we uncovered distinct explainability preferences among new and frequent users. New users sought increased trust and transparency, benefiting from guided explanations. In contrast, frequent users emphasised efficiency and driving safety. The final experimental results confirmed that solutions customised for different segments of the population are significantly more effective, satisfying, and trustworthy than generic solutions. These findings demonstrate that the explanations for individual differences, based on our proposed scenario-based framework, have significant implications for the adoption and sustainability of AVs.

1. Introduction

Fully automated or driverless driving is a major innovation that represents a significant step forward in terms of sustainable development [1]. The rapid evolution of autonomous driving already allows the realization of automated valet parking (AVP) [2], enabling a vehicle to drive out of the parking lot to a user’s gate without human intervention [3]. This automation not only reduces urban travel time but also lowers emissions and decreases the need for parking spaces [4]. AVP, as a highly automated driving system [5], enables drivers to remotely summon automated vehicles (AVs) equipped with road sensing, communication, and pre-installed LIDAR technology in parking facilities. When a passenger’s phone signals the AV, the vehicle autonomously travels to the pickup location, such as in front of an office building. The vehicle then autonomously handles the parking task after dropping off passengers [2].
Despite the convenience that autonomous driving offers, there are limited data suggesting that drivers want to extensively use AVs [6,7]. According to a recent report, drivers in the US are “stuck in neutral” regarding self-driving cars, with only 12% trusting such vehicles and 28% remaining unsure of the technology [8]. With autonomous driving, drivers may become nervous and lack sufficient confidence due to concerns of being excluded from driving control and becoming unable to respond to emergency situations based on their own judgment [7,9]. In addition, automotive companies now employ black-box AI models to enable vehicles to perceive their environment and make driving decisions with little or no input from a human [10]. Consequently, AVs are likely to make strange and confusing decisions for end-users, resulting in a less positive user experience (UX) [11].
Explanation information plays a key role in intelligent decision-making for autonomous driving [12,13]. Previous studies have indicated that artificial intelligence (AI) with explanatory capabilities leads to higher user confidence, as explaining the behaviour of an automated system can increase the user’s understanding of its behaviour and the overall system transparency [14,15]. However, AV explanations do not always translate into greater trust in the AVs or positive emotional experiences. Koo et al. [16] examined the impact of AV explanations and separated the types of explanations into “why the AV acts a certain way” and “how the AV acts a certain way”. The authors found that the “why-only” explanation led to the highest level of positive emotional valence. On the other hand, the “how and why” explanation produced the safest driving performance but also resulted in the highest cognitive workload, which increased negative feelings among drivers. The cognitive workload is also essential, as explanations of AVs may affect users’ mental workload while engaging in autonomous driving and, consequently, impact usability [17].
While recent research has significantly advanced technologies such as explainable AI, numerous key challenges in understanding the unique requirements for deploying explainable AI systems into complex contexts remain unsolved [18,19]. De Craen et al. [20] conducted a study to understand how AV decision-making should account for individual user preferences. The authors found that the alignment of individual preferences with AV decisions yielded more positive changes than the unaligned decisions in vehicle impressions. In driving scenarios, significant differences in subjective perception, risk perception, and risk response exist among diverse user groups [21,22]. These differences suggest that the explainability needs of different user groups are different. To improve the explainability of autonomous driving, in this study, we propose a scenario-based framework that not only focuses on human needs but also predicts and explores possible scenarios from the early stages of system development. This framework has been a well-known method in fields like software engineering and human-computer interaction (HCI) for a number of years [23,24,25]. Such scenarios bridge the cognitive or psychological focus of traditional HCI methods with the organizational focus placed on information systems development, creating a hybrid view into the ways in which these concerns are co-constituted in practice [25]. The four main components of each scenario are (1) the participants, (2) the background information and assumptions regarding the participants and their environments, (3) the participant’s goals or objectives, and (4) the sequence of actions and events [23,24]. This method helps determine if users require explanations and the types of explanation requirements when using an intelligent autonomous driving system by considering different usage scenarios. In this study, we considered key decision scenarios for AVP and analysed the user requirements for an explainable design.
Using the AVP system of AVs as a case study, this research dissects user tasks under various usage scenarios and offers explanatory strategies for system decision-making, considering the user group and contextual situation that the system is intended for. This study seeks to answer the following research questions:
RQ1: How do scenario-based explanations impact drivers’ subjective metrics such as their trust, UX, and mental workload for AVs, as well as their objective task performance in terms of reaction time and return times?
RQ2: How do scenario-based explanations customised for different user groups affect the quality of AV explanations? More specifically, do these tailored explanations enhance the quality of explanations, increase the drivers’ trust, and reduce their mental workload, as well as improve their objective task performance in terms of reaction time and return times?
The paper is structured as follows: Section 2 outlines a preliminary study of the AVP system. Section 3 outlines our first experiment, focusing on exploring the impact of scenario-based explanations on drivers’ subjective and objective performance. Section 4 presents the results. Section 5 details the second experiment, focusing on how scenario-based explanations tailored for different user groups affect the quality of AV explanations, with Section 6 presenting the research results. After detailing both experiments, we provide a comprehensive discussion that interprets the results, explores implications, highlights limitations, and suggests future research. Finally, we conclude with key findings.

2. Preliminary Study of an Automated Valet Parking System

Valet parking, a term derived from the French “valet” meaning “surrogate”, describes a service where a management agent parks on behalf of the vehicle owner [26]. An autonomous valet parking (AVP) system, which combines valet services with autonomous vehicles, allows users to leave the AV at a designated point, prompting it to move autonomously toward a parking spot [27,28]. Extending AVP to more general cases, the process flow includes the following [29]: On departure, users can be picked up by the AV at their specified time and pick-up spot, and then the car can move from the parking spot to the pick-up spot, all while using a fully autonomous mode [30]. When the AV picks up the users, they can leave the car in their desired place. Then, the car can drive to the parking spot autonomously through path planning and coordinated operation management [30]. In general, the system controls a vehicle in the driving and parking tasks without human intervention.
In this study, we conducted expert interviews with eight professionals from automotive companies to thoroughly understand the AVP system. Expert selection criteria emphasised practical experience in autonomous driving. We also used non-probability convenience sampling, reaching out to experts via LinkedIn messages. These participants, had diverse expertise, ranging from product design to AV development. Table 1 outlines the key characteristics of the sample, offering participants’ profiles. Face-to-face interviews, lasting approximately 90 min each, were conducted in an office environment.
In the interview, we invited experts to adopt a scenario-based design method to explore the AVP system. During our study, this method established a common language among project participants, anticipated the potential future tasks of system users, and facilitated the development of instructional materials. This method served as an effective brainstorming tool for planning, enabling stakeholders to consider alternative choices in decision-making [31]. The scenario-based design method focused on four key aspects: (1) the participants, (2) the background information and assumptions, (3) the participants’ goals, and (4) the sequences of actions and events [23,24]. Based on this method, we further proposed explanatory strategies, as shown in Figure 1, which includes photos depicting real scenes from the AVP system’s development and experience.
  • Participants:
  • In the AVP system of a highly automated vehicle, the vehicle autonomously controls the lateral and longitudinal behaviours, transforming the driver into a passenger free to engage in activities like reading or working. If the system reaches a limit, the driver is prompted to take control for a specific duration of time.
2.
Background information and assumptions regarding the participants and their environment:
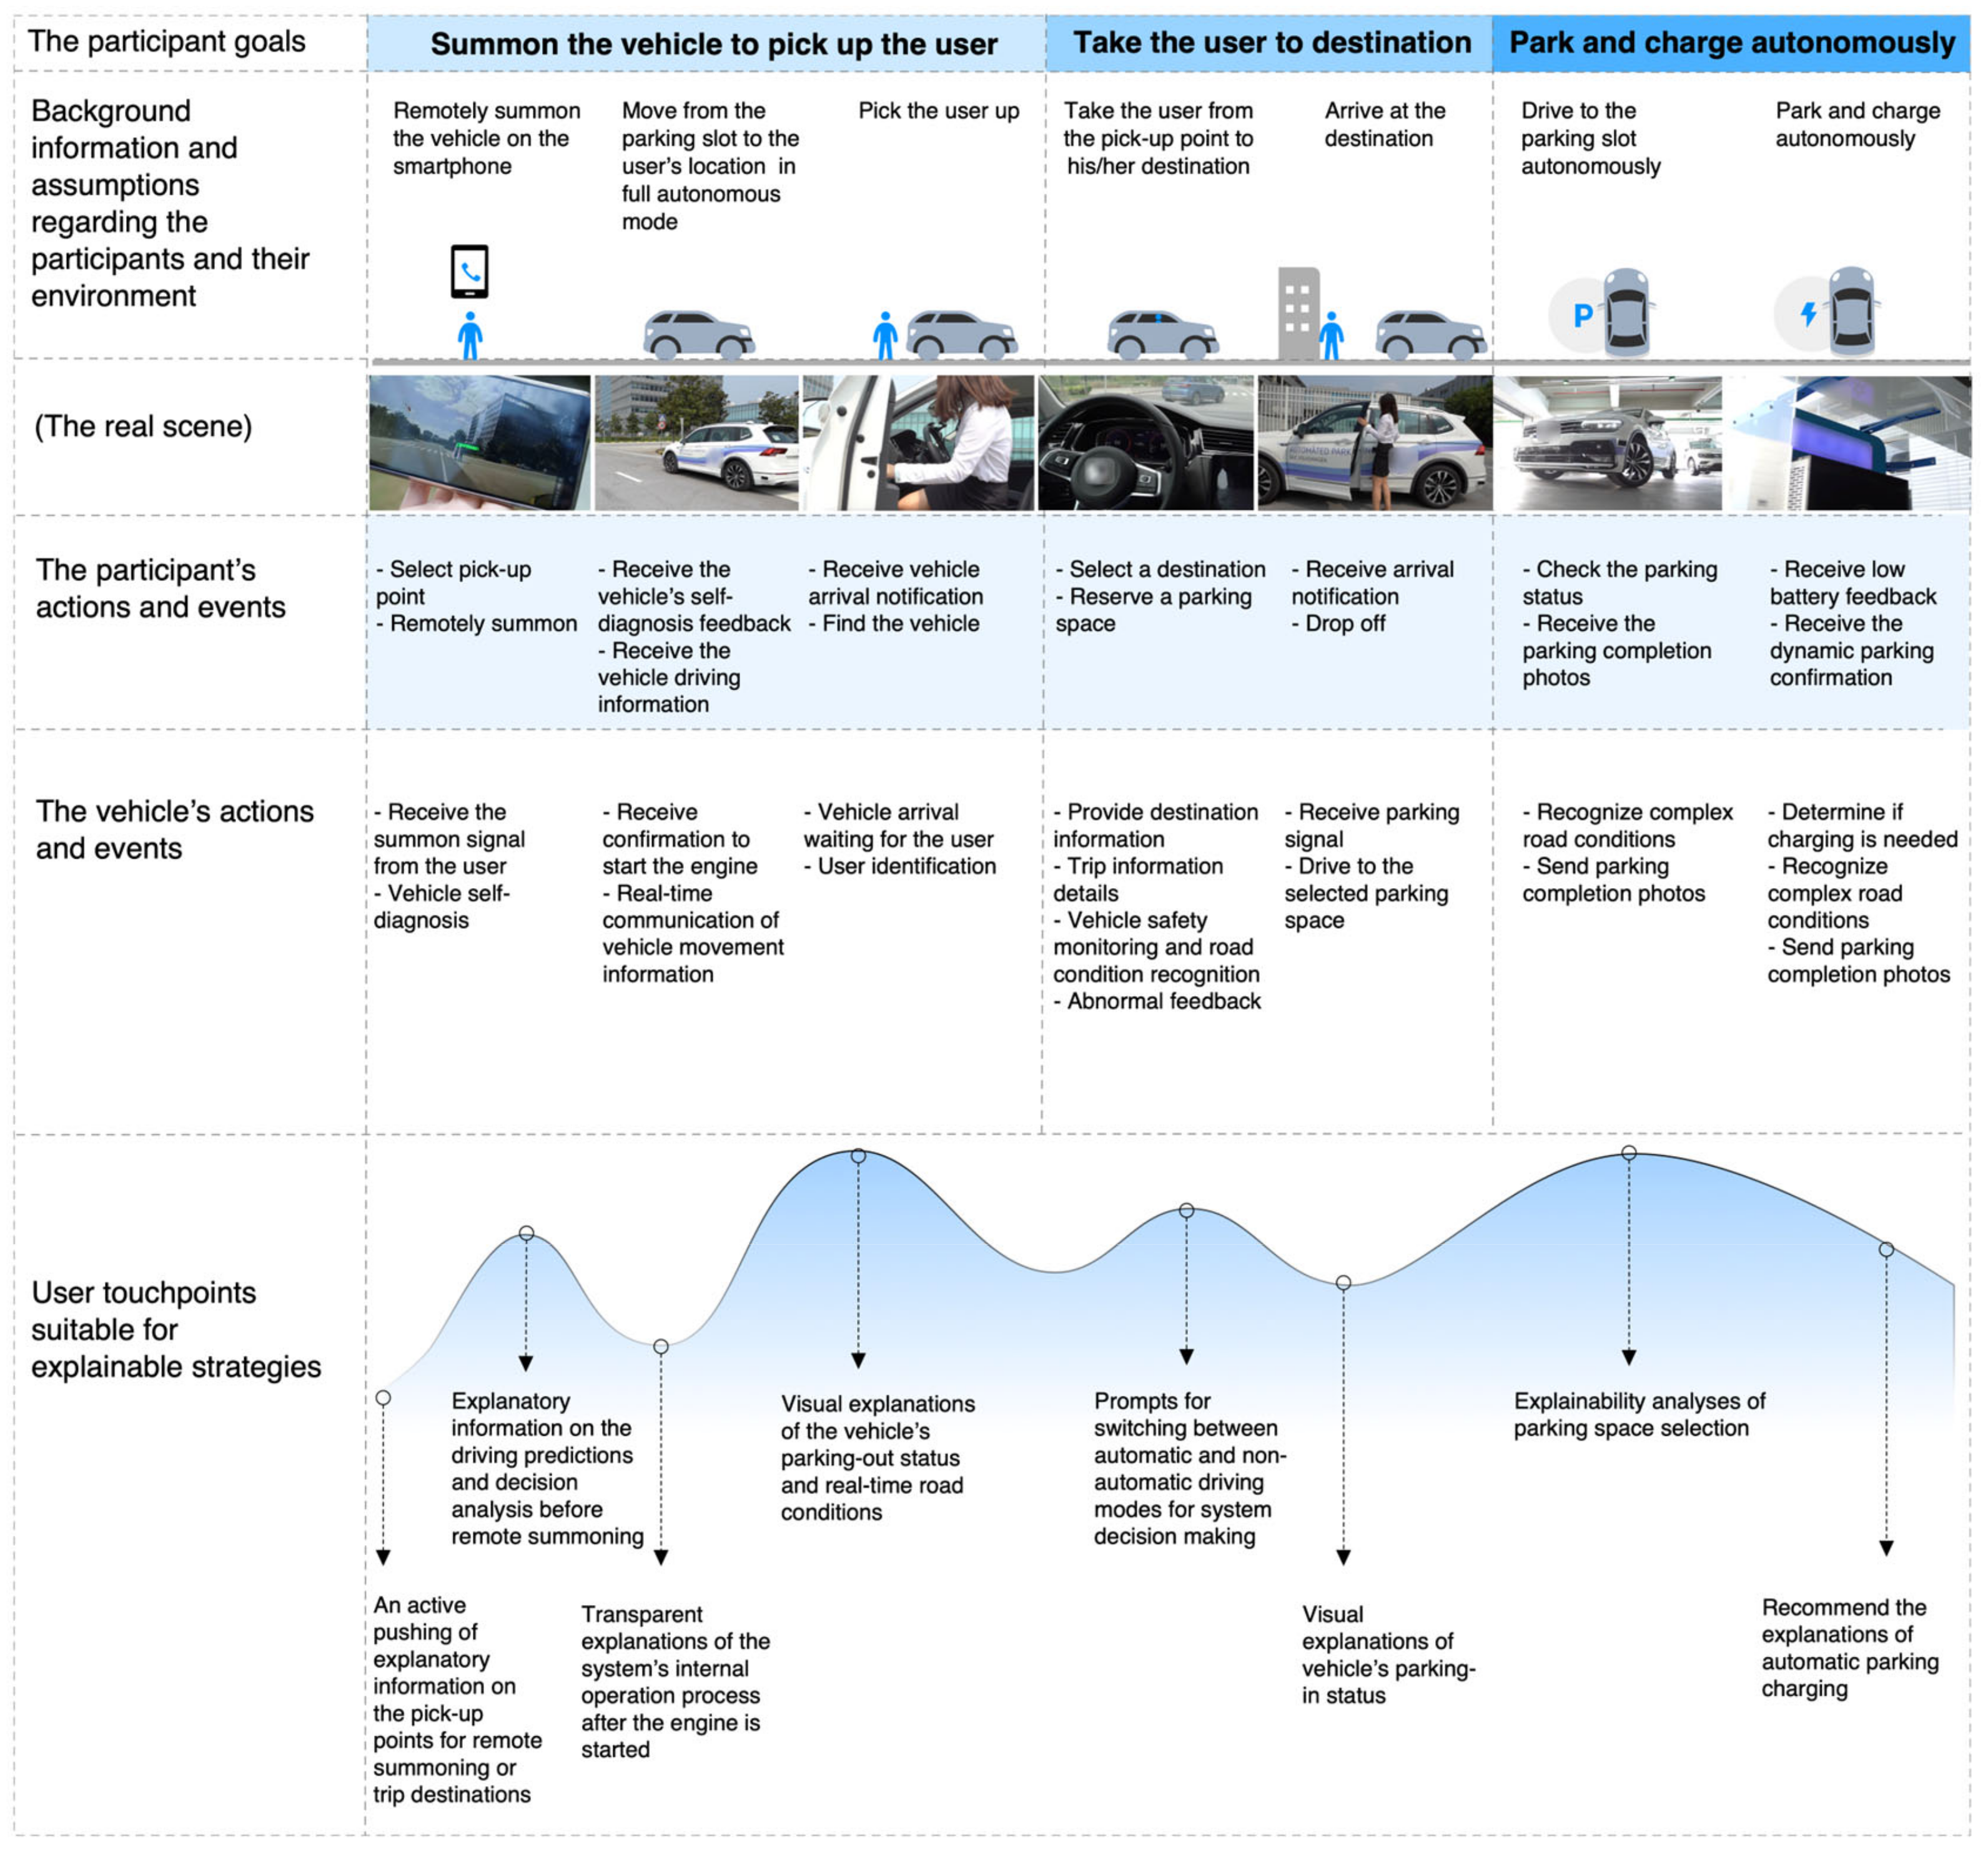
  • As the role of the driver in autonomous driving changes, the usage scenarios of AVP expand beyond in-car human–machine interaction. The AVP provides safe and convenient travel while also introducing challenges related to user inadaptation. Therefore, to include the human factor in engineering, it is necessary to study highly automated vehicles that cater to diverse user needs while considering the environments in which AVs operate, and how they are used. Figure 1 visually and textually presents the background and environment in which users utilize AVPs, including summoning vehicles from any location and allowing drivers to step out of the car to monitor and control the overall parking process through their mobile phones.
3.
Participant goals or objectives:
  • Understanding the goals and objectives of participants is integral to tailoring the AVP system to meet diverse user needs. The basic goals include the following: summoning the vehicle to pick up the user, taking the user to a destination, self-parking, and charging.
4.
The sequence of actions and events:
  • A critical aspect of this framework is its focus on the sequential flow of actions and events within the AVP system. By elucidating the step-by-step journey of users interacting with the system, this focus helps explore what types of explanations users might need while using the AVP system. The primary interaction process of the system is as follows: Firstly, the user can remotely control his or her vehicle using a smartphone. When the vehicle is summoned, it leaves the parking space and automatically drives to the user’s location. After picking the user up, the vehicle drives to the destination selected by the user. At the same time, the user can choose a parking space near the destination via the in-car system; thus, some of the services of the AVP system are linked to the in-car system. When the vehicle arrives at the destination and drops the user off, the vehicle automatically drives to the garage and starts parking. From the perspective of the whole service process design, the interaction medium of the AVP system includes the mobile phone application and Human–machine Interface (HMI) in the vehicle. In addition, the interaction medium switches between different scenarios during the usage process. Therefore, the functional design and information presentation in different scenarios must be based on the corresponding user scenario and environment.
Based on this information, experts identified eight user touchpoints suitable for explanatory strategies within the AVP system. These touchpoints are various moments at which a user will directly or indirectly interact with the AVP system and include the following: (1) an active pushing of explanatory information on the pick-up points for remote summoning or trip destinations, (2) explanatory information on the driving predictions and decision analysis before remote summoning, (3) transparent explanations of the system’s internal operation process after the engine is started, (4) visual explanations of the vehicle’s parking-out status and real-time road conditions, (5) prompts for switching between automatic and non-automatic driving modes for system decision making, (6) visual explanations of vehicle’s parking-in status, (7) explainability analyses of parking space selection, and (8) recommended explanations of automatic parking charging. The prototypes for the two experiments were designed to differentiate between these touchpoints.
During the expert interviews, we also found that the most critical groups of people using the AVP system could be divided into new and frequent users. The focuses of explainable requirements differed between the groups. For example, new users had higher demands for system comprehension when they first encountered the AVP system. At the same time, frequent users of the AVP system pursued faster and more convenient operations. Therefore, considering such individual differences, we further analysed the explainability strategies of different user groups.
We conducted two experiments to verify the effectiveness of scenario-based explanations and whether using different explanation strategies for different population segments could improve explainability utility. Experiment 1 was a controlled experiment with and without scenario-based explanations for the same user population. Experiment 2 tested generic explainable prototypes for new and frequent users and customised prototypes for different user groups to verify whether significant differences existed in the quality of explanations between the customised prototypes for different user groups and generic prototypes.

3. Experiment 1 Method
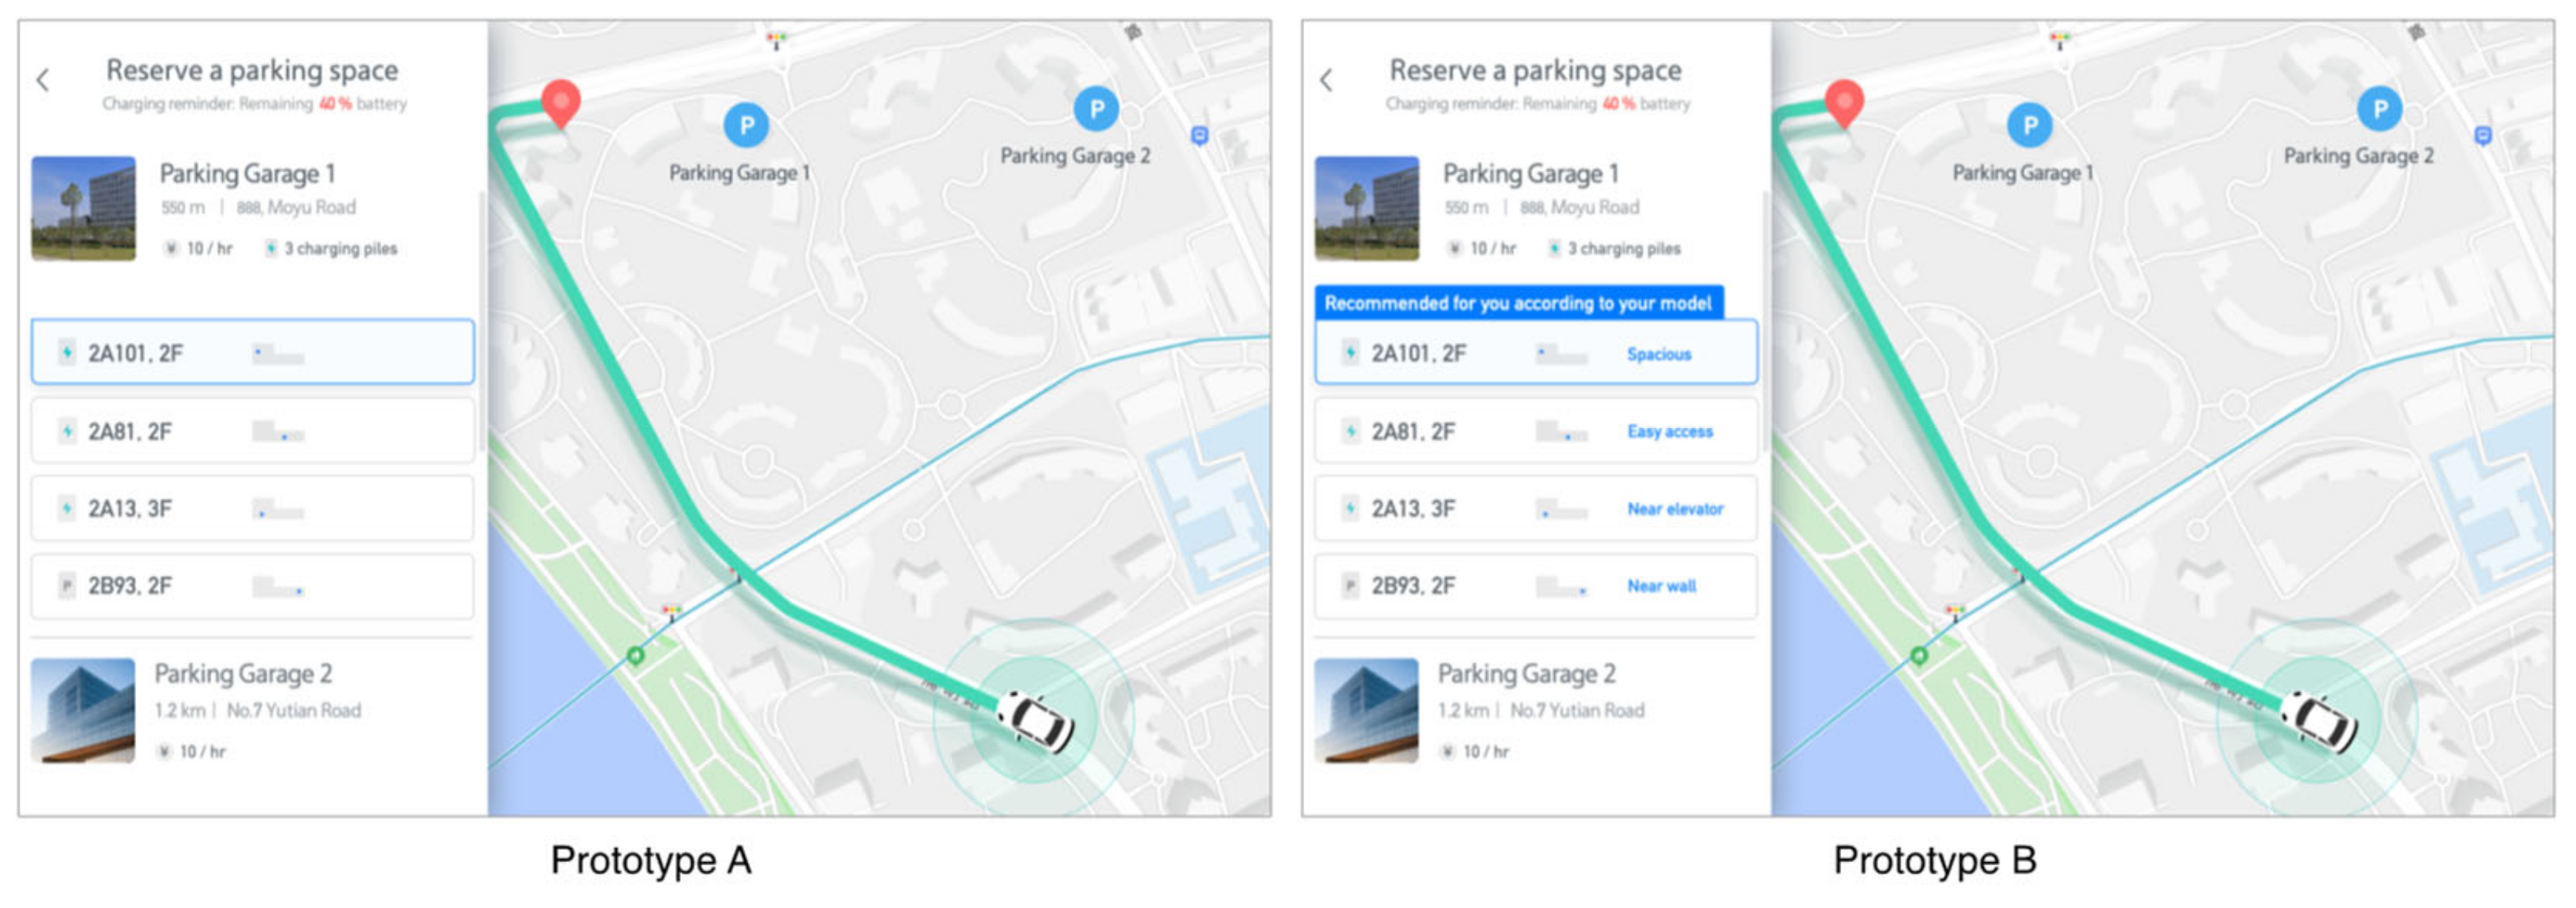
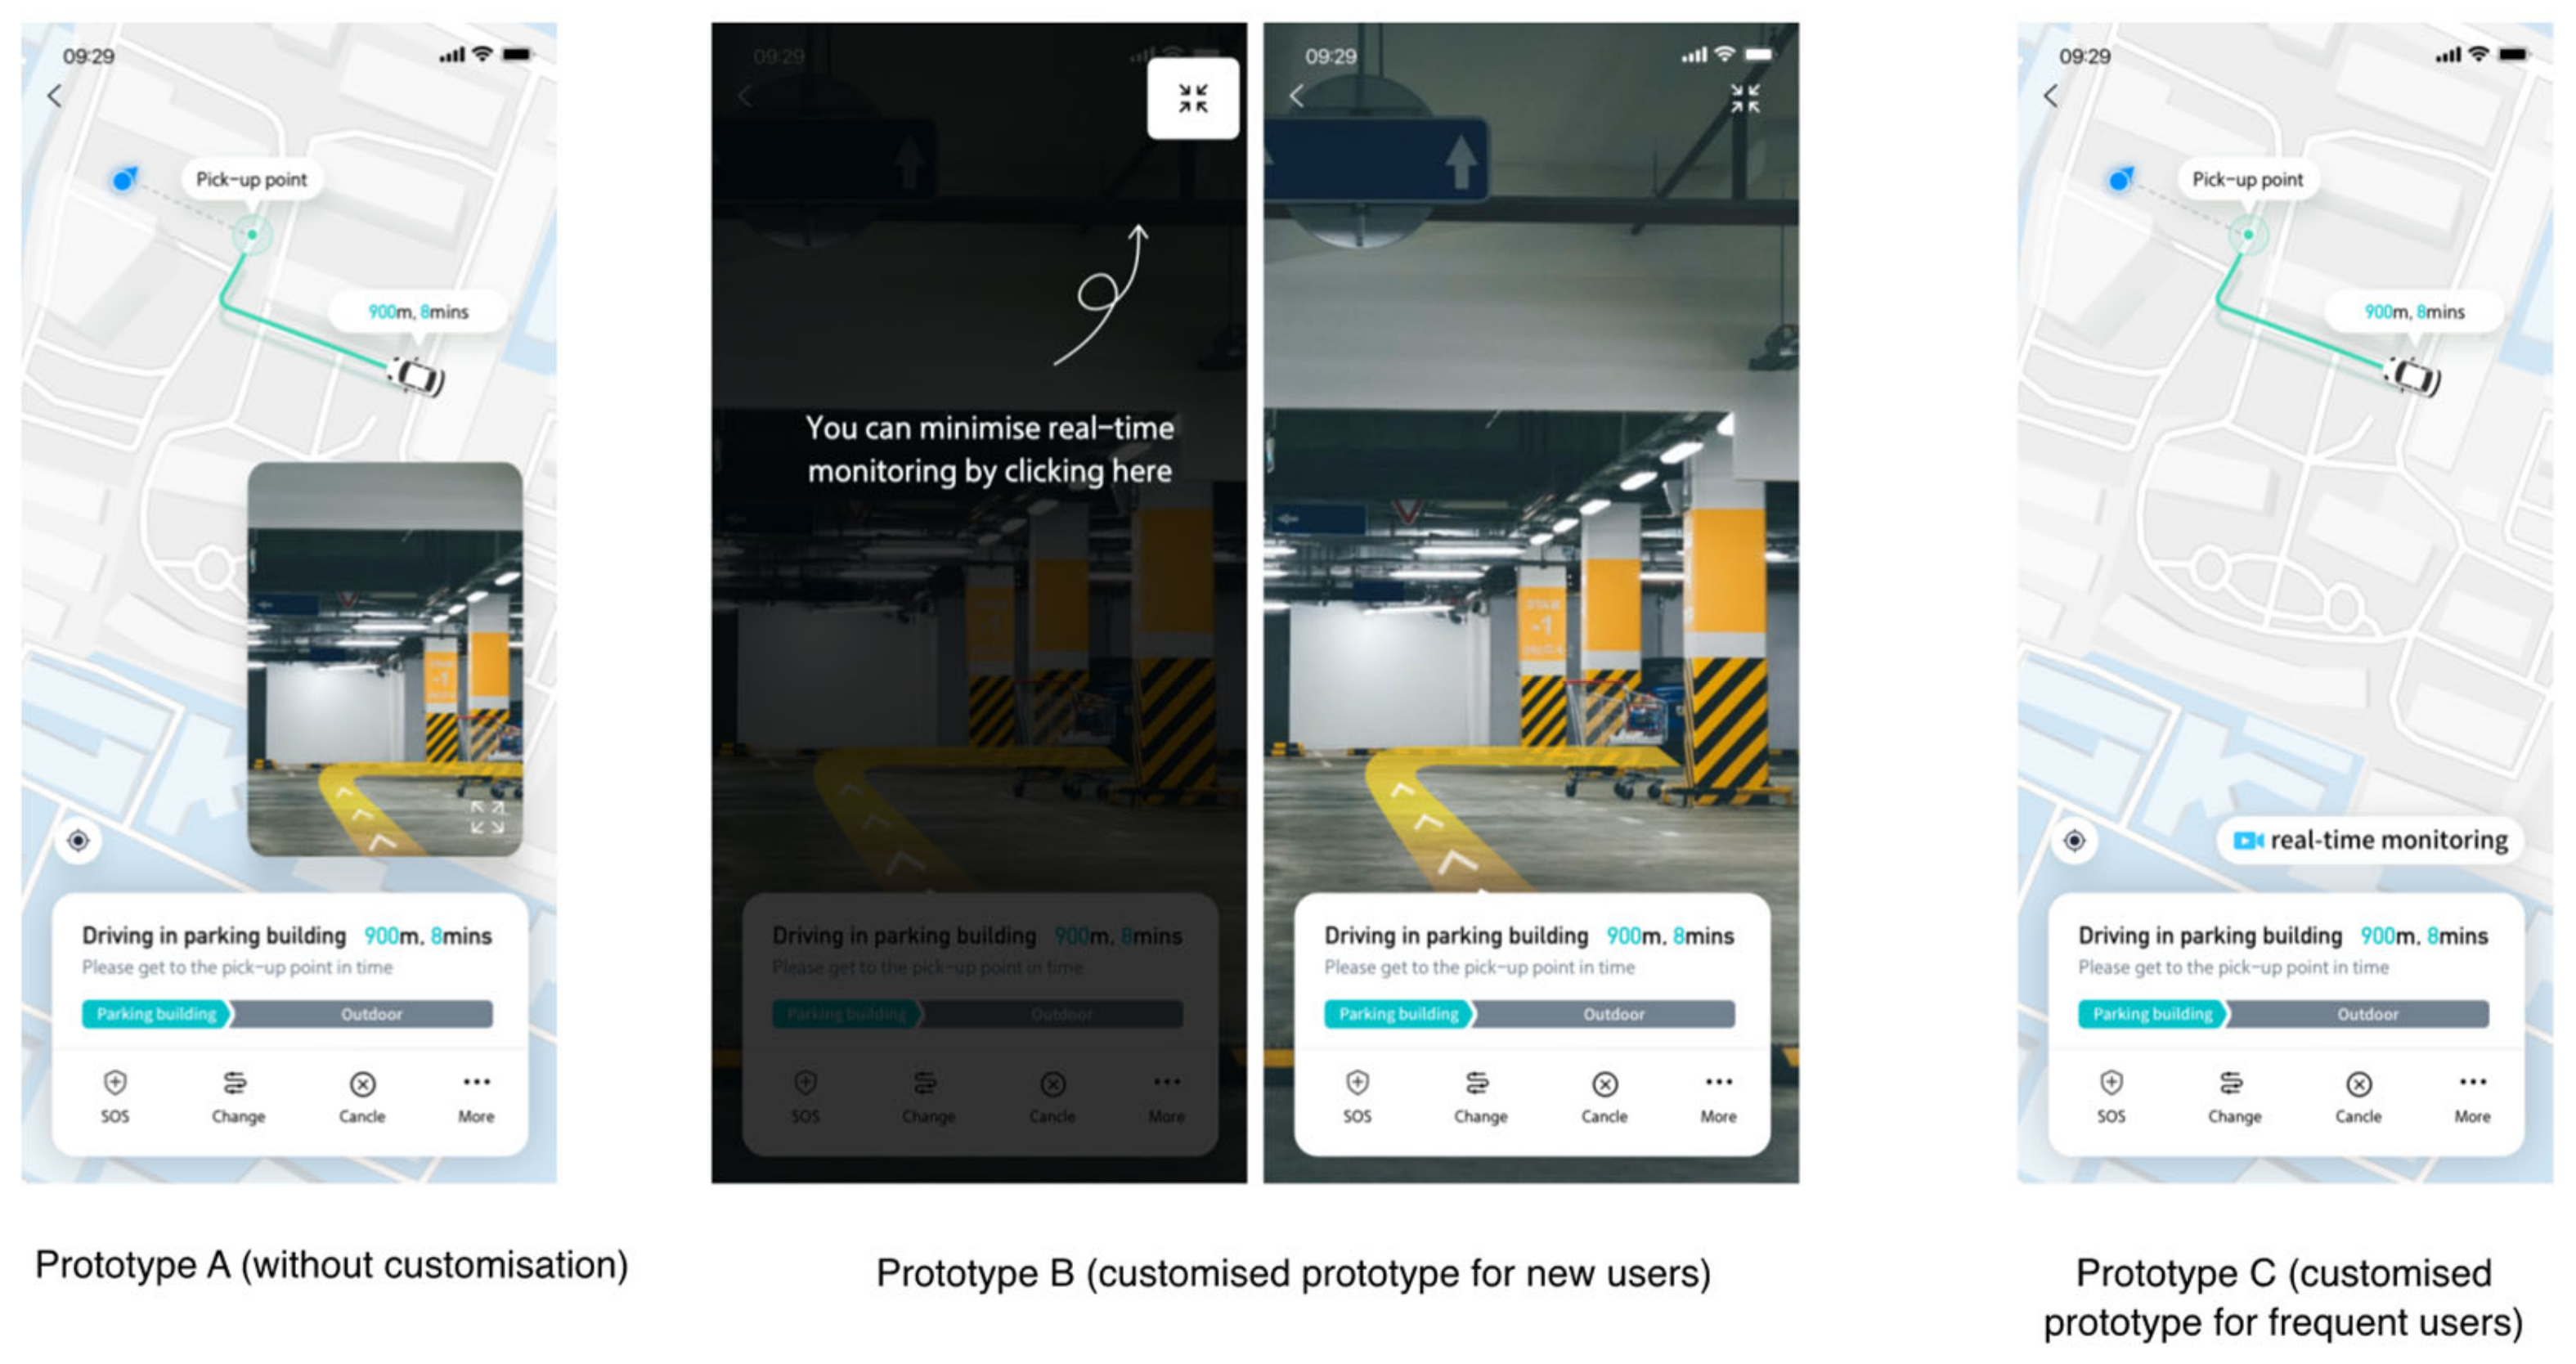
We chose a within-subjects design since we studied whether the scenario-based explanation strategy would impact participants’ subjective metrics (situational trust, UX, and mental workload) and objective metrics (reaction time and return times). The independent variable contained scenario-based explanation information (with/without) of the mobile applications and HMI prototypes for the AVP system.

3.1. Prototypes

We developed mobile applications and HMI prototypes for the AVP system. Parts of the interactive prototypes are presented in Figure 2. At the bottom of the page, a map is included as the base map of the system and displays the current navigational path for the user in real-time. Regarding the page layout, the most frequently used function modules are placed on the left side of the interface according to the user’s browsing habits. Such operations include selecting a destination, reserving a parking space, and opening navigation. These functions are displayed in the form of a floating window in the content-switching area on the left side.
One way to deliver explanatory information for the in-vehicle display is to use visualisation with visual communication texts, images, or augmented reality in the interface [32]. For this purpose, we visualised eight scenario-based explanations in the AVP interface. For example, let us consider parking space selection touchpoints, wherein the user needs to manually select a parking space for the vehicle when approaching a destination during autonomous driving. Prototype A, on the left side of Figure 2, presents the result recommended by the system directly (without explanation), whereas Prototype B, on the right side of Figure 2, presents an explanation of the options provided:
  • Text with a coloured background on the screen.
  • Textual information regarding how the AVP system makes decisions.
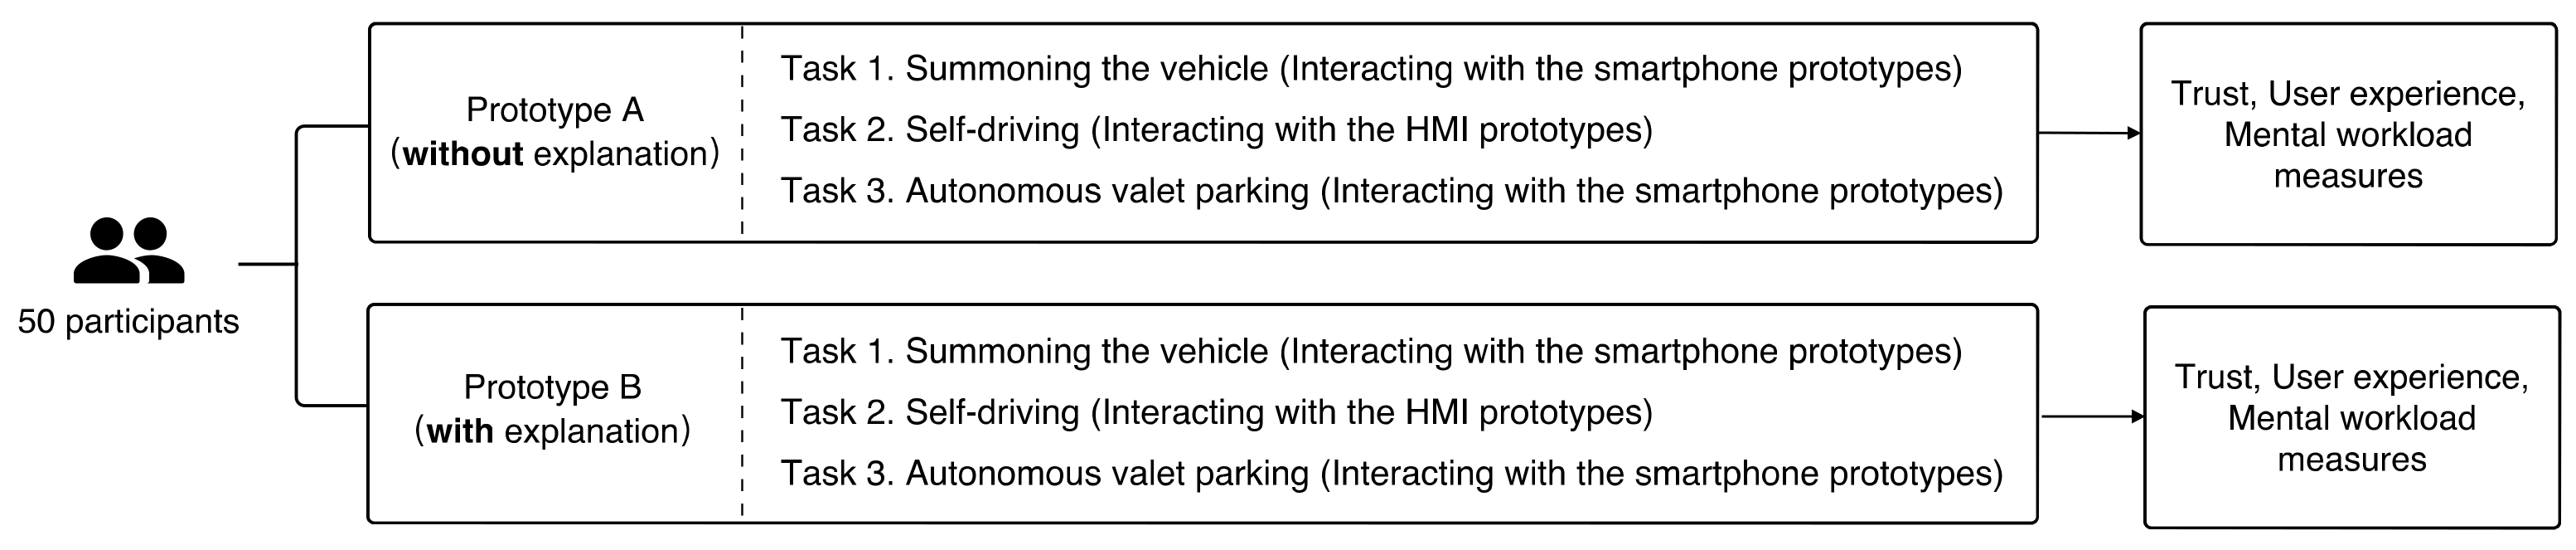
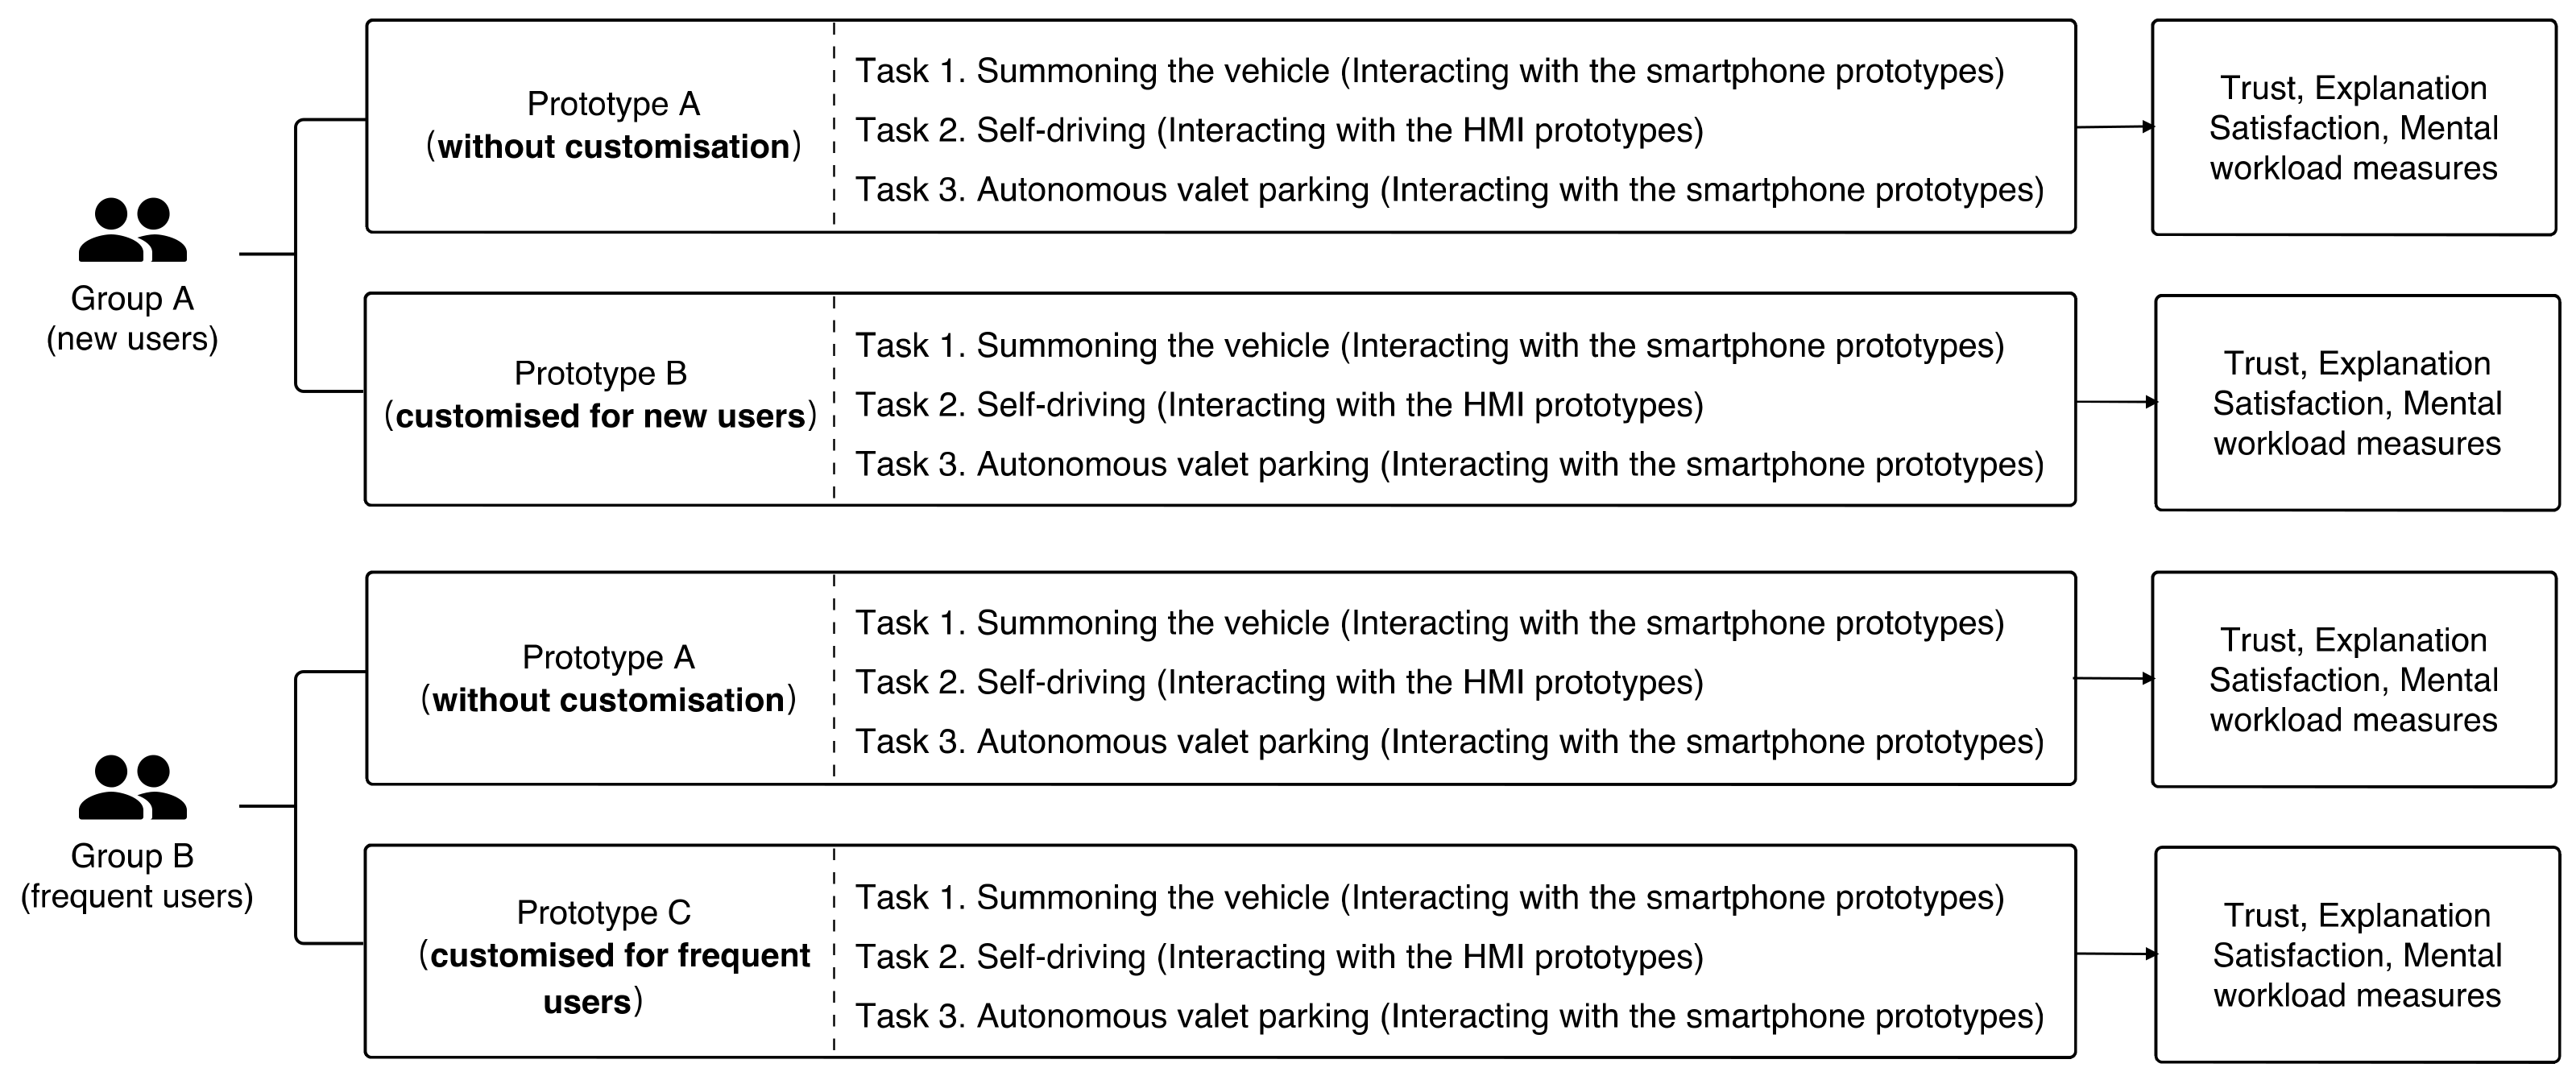
3.2. Procedures

Part of the experimental process was performed in a static (non-mobile) driving simulator equipped with four car seats (two at the front and two at the back) and a 240° curved screen. The video was pre-recorded with a camera. We filmed driving scenarios on city roads. The simulation was designed to help participants better understand the state of the self-driving car. This experimental environment is shown in Figure 3. Participants entered the simulator from the side and occupied their seats within the enclosed driving space (A). The mobile application was installed on a smartphone (B) (length: 15.86 cm; width: 7.25 cm). An android pad was installed in the car as the HMI (C) (length: 20.64 cm and width: 12.52 cm).
Participants were initially placed in an office next to the driving simulator. We introduced participants to the experiment with the information that they would fill in questionnaires, participate in an autonomous driving experiment, and interact with a mobile application and HMI. Participants watched a brief two-minute video on YouTube.com (https://www.youtube.com/watch?v=YEn9bQkBXkE (accessed on 1 October 2021) describing the main functions of the AVP system, helping them better understand the background information. After participants signed the consent form, we videotaped the entire process.
The test flow for Experiment 1 is shown in Figure 4. The same participants were asked to test prototypes A (without explanation) and B (with explanation). In each prototype, participants were asked to complete three tasks. In task 1, participants were initially asked to summon their vehicle using a mobile application. After completing the operation, the participants were taken next door to the driving simulation lab. This sequence was intended to replicate a scenario in which the self-driving car had arrived at the pick-up point. Once in the car, participants were asked to fasten their seat belts and select their destination and parking spot on the HMI in task 2. The driving simulator then activated the autonomous driving mode. Next, the user completed the task of switching to manual driving. When nearing the destination, the user was instructed to exit the car. In task 3, each user returned to the office and controlled the vehicle using the smartphone prototypes for automatic parking. After completing the tasks, the participants filled in the Situational Trust Scale for Automated Driving (STS-AD), the User Experience Questionnaire—Short (UEQ-S), and the NASA-TLX. Participants were also asked if they felt good, if anything was unclear, and if there was anything else they wanted to express about the experience. The whole experiment took nearly one hour.

3.3. Sample

In total, 50 participants, including university students and unrelated professionals, were recruited in Shanghai, China, through WeChat, Weibo, and QQ. All participants had a driver’s license and were in the age range of 25–40 years, with an average age of 28.5 years. The gender distribution of participants was 42% female and 58% male. Each participant received an honorarium of ¥100. The study was conducted in accordance with the Declaration of Helsinki and approved by the Science and Technology Ethics Committee of Tongji University (tjdxsr012) for studies involving humans.

3.4. Dependent Variables

Subjective Measures: After each trial, participants evaluated the vehicle encounter based on three aspects: situational trust, user experience, and mental workload. Refer to Appendix A for questionnaire details.
Situational trust was measured using the self-reported Situational Trust Scale for Automated Driving (STS-AD) [33]. This model evaluates situational trust using six items: trust, performance, non-driving related tasks (NDRT), risk, judgment, and reaction [33].
The User Experience Questionnaire—Short (UEQ-S) is a semantic differential questionnaire that measures UX based on the model of pragmatic and hedonic qualities. This questionnaire uses a seven-point Likert scale for eight items: obstructive–supportive, complicated–simple, inefficient–efficient, confusing–clear, boring–exciting, not interesting–interesting, conventional–inventive, and common–leading edge [34].
As a measure of the mental workload, we used a subjective mental workload assessment tool called the NASA-TLX, which uses a scale from 0 to 20. The NASA-TLX was developed with six subscales to represent the mental, physical, and temporal demands, as well as the frustration, effort, and performance [35]. We used a modified version in which the subscales were averaged without paired comparisons [36].
Objective Measures: Performance can be measured in terms of the time and correctness (hits, errors, and misses) with which the user completes the tasks [37]. In the experiment, we filmed the entire human–machine interaction process, which included the user’s reaction time when faced with a recommendation that required a decision and the number of times the user clicked to return to the previous step due to doubt or hesitation in the smartphone and HMI. Therefore, we reviewed the video and collected objective data on the reaction time (time in seconds) and the return times (number of times). We hypothesized that the more explainable the system became, the shorter the reaction time of the user would be, and the fewer times the user would return to the previous step.

3.5. Hypotheses

The assumed hypotheses for the experimental setup were as follows:
Hypothesis 1 (H1).
AVs that provide explanations have higher driver (a) trust, (b) UX, and (c) mental workload than AVs that do not provide explanations.
Hypothesis 2 (H2).
AVs that provide explanations will reduce (d) the reaction time of users. When the system provides explanations, people will respond faster when faced with a recommendation that requires a decision. These data will be timed from the recorded video.
Hypothesis 3 (H3).
AVs that provide explanations will decrease (e) the return times. People will return to the previous step less often due to doubt or hesitation when faced with the system’s explanations.

4. Experiment 1 Results

Data were analysed using SPSS Statistics (version 28.0). Because the subjective and objective data were not normally distributed (Shapiro–Wilk tests; p > 0.05), nonparametric tests were performed for data analysis. We performed a Wilcoxon signed-ranks test on relevant samples, which was used to determine the differences between paired samples.
From Table 2, statistically significant differences in the scenario-based explanations were observed for the situational trust (Z = −3.421, p < 0.001), UX (Z = −2.900, p < 0.05), and mental workload (Z = 3.310, p < 0.001) of drivers. Combining the boxplot of each index shows that the scenario-based explanations led to higher situational trust, averaging 22.34 (SD = 7.46) for Prototype B and 19.26 (SD = 4.80) for Prototype A; increased UX averaged 24.62 (SD = 10.94) for Prototype B and 21.74 (SD = 9.16) for Prototype A; and lower mental workload averaged 59.42 (SD = 15.80) for Prototype B and 65.96 (SD = 9.47) for Prototype A, compared to AVs without explanations (Figure 5). Hence, H1 was partially supported.
Table 3 presents the objective evaluations, revealing statistically significant differences in the reaction times (Z = 2.906, p < 0.05) and return times (Z = 3.059, p < 0.05) at a 95% confidence level and indicating the impact of explanations. The boxplot illustrates faster reaction times for Prototype B with explanations (M = 59.64, SD = 24.46) compared to Prototype A (M= 66.73, SD = 23.77), and fewer return times for Prototype B (M = 1.70, SD = 0.93) compared to Prototype A (M = 2.20, SD = 1.29) (Figure 6). These findings strongly support the validity of hypotheses H2 and H3.

5. Experiment 2 Method

We chose a within-subjects design since we studied whether the customised prototypes would significantly improve the explainability of the AVP. Here, the independent variable was set as the customised prototypes (with/without) of the mobile applications and the HMI prototypes of the AVP system.

5.1. Prototypes

In Experiment 2, three prototypes were used for testing in the smartphone and HMI. Prototype A considered a generic interface designed without customised solutions, while Prototype B and C were customised for new and frequent users, respectively, offering different explanatory strategies (see Figure 7). The smartphone application prioritizes a map display for users to quickly track journey progress, with all prototypes showing the driving status during vehicle wait times. In the case of any abnormal issues, the system presents a safety alert.
In Prototype A (without customisation), we sought to display all information in a balanced way. A visual explanation of the vehicle’s parking-in status is presented through a live video minimized in a corner of the screen, and the overall journey path is shown.
For Prototype B (the customised prototype for new users), we customised the explanatory information based on the user’s preference for guidance:
  • Textual information is provided with guides for key functions during initial use.
  • A full-screen live video presents the real-time vehicle status, with overlay visualisations simulating augmented reality to enhance system transparency.
For Prototype C (the customised prototype for frequent users), efficiency is prioritized for users familiar with the system:
  • By presenting information concisely, the vehicle provides users with an overview of the travel route for easy viewing and convenience.
  • Textual information with an icon conveys semantic information to help users monitor the vehicle’s parking status.
The final prototypes were designed according to each of the eight explainable scenarios of AVP.

5.2. Procedures

The overall process and equipment in Experiment 2 were similar to those in Experiment 1. The key distinction between the two lies in the participants and test prototypes. Subjects were divided into two groups, Group A (new users) and Group B (frequent users). Participants were individually tested with two prototypes: one without customisation and one tailored to the specific test population.
Participants, initially situated in an office next to the driving simulator, were introduced to the experiment’s details, involving a video introduction on the main functions of the AVP system, interaction with a mobile application and HMI, and the completion of questionnaires. A confidentiality agreement was signed, and the entire process was videotaped. Then, the driving simulator experiment began, with participants receiving instructions and completing three tasks following the test flow in Figure 8.
In Task 1, participants initiated the vehicle summoning process on a mobile application. After completion, they proceeded to the adjacent driving simulator, simulating a scenario where the self-driving car arrived at the pick-up point. Task 2 involved selecting a destination and the parking spot via the HMI prototypes. Subsequently, the driving simulator activated the autonomous driving mode, allowing participants to switch to manual mode. Upon nearing their destination, participants exited the car. Task 3 involved users returning to the office and controlling the vehicle for automatic parking using smartphone prototypes. After the interaction, Group A and Group B participants filled out a questionnaire including the STS-AD, Explanation Satisfaction, and NASA-TLX, followed by a discussion of their views. The whole experiment took nearly one hour.

5.3. Sample

Subjects were recruited through WeChat, Weibo, QQ, and automobile clubs via email in Shanghai, China, to enable a controlled experiment. Prior to the experiment, participants completed online questionnaires to gather background information and assess their autonomous driving experience. We asked respondents how often they used the relevant functions of autonomous driving, such as AVP. Responses were collected on a 7-point scale (1 = “never” to 7 = “more than two to three times per week”). In total, we selected 100 participants—50 without autonomous vehicle experience and 50 frequent users (use of an automated driving system more than two to three times per week). To distinguish between new users (Group A) and frequent users (Group B), participants were categorized based on usage frequency. Each group contained 50 participants, with Group A having 26 females and 24 males with an average age of 30, and Group B consisting of 25 females and 25 males with an average age of 32. All participants received a ¥100 honorarium. This study was also approved by the Science and Technology Ethics Committee at Tongji University.

5.4. Dependent Variables

Subjective Measures: Experiment 2 was performed to investigate the effectiveness of scenario-based explanations using customised solutions for different user groups. In addition to measuring the subjective impressions of situational trust and mental workload, this research focused on comparing the quality of explanations and prioritizing capturing Hoffman et al.’s [37] five metrics for an Explainable AI system. This Explanation Satisfaction scale measures the utility of an explanation to evaluate whether users are satisfied with the explanation and how well users understand AI systems. This questionnaire was presented to the participants with five items and measured with a 7-point Likert scale. The following items were included: the explanation of how the AV behaves was (1) satisfying, (2) had sufficient details, (3) told me how to use it, (4) was helpful, or (5) let me judge when I should trust and not trust the AV [37] (See Appendix A).
Objective Measures: The objective measures collected in Experiment 2 were the same as those in Experiment 1 and both collected objective metrics on the reaction time (time in seconds) and return times (number of times).

5.5. Hypothesis

Hypothesis 4 (H4).
AVs that provide customised solutions for different user groups have a higher driver (a) trust and (b) explanation satisfaction.
Hypothesis 5 (H5).
AVs that provide customised solutions for different user groups have a lower (c) mental workload.
Hypothesis 6 (H6).
AVs that provide customised solutions for different user groups reduce the (d) reaction time of users. When the system provides explanations, people will respond faster when faced with a recommendation that requires a decision.
Hypothesis 7 (H7).
AVs that provide customised solutions for different user groups decrease (e) return times. People will return to the previous step less often due to doubt or hesitation when faced with explanations of the system.

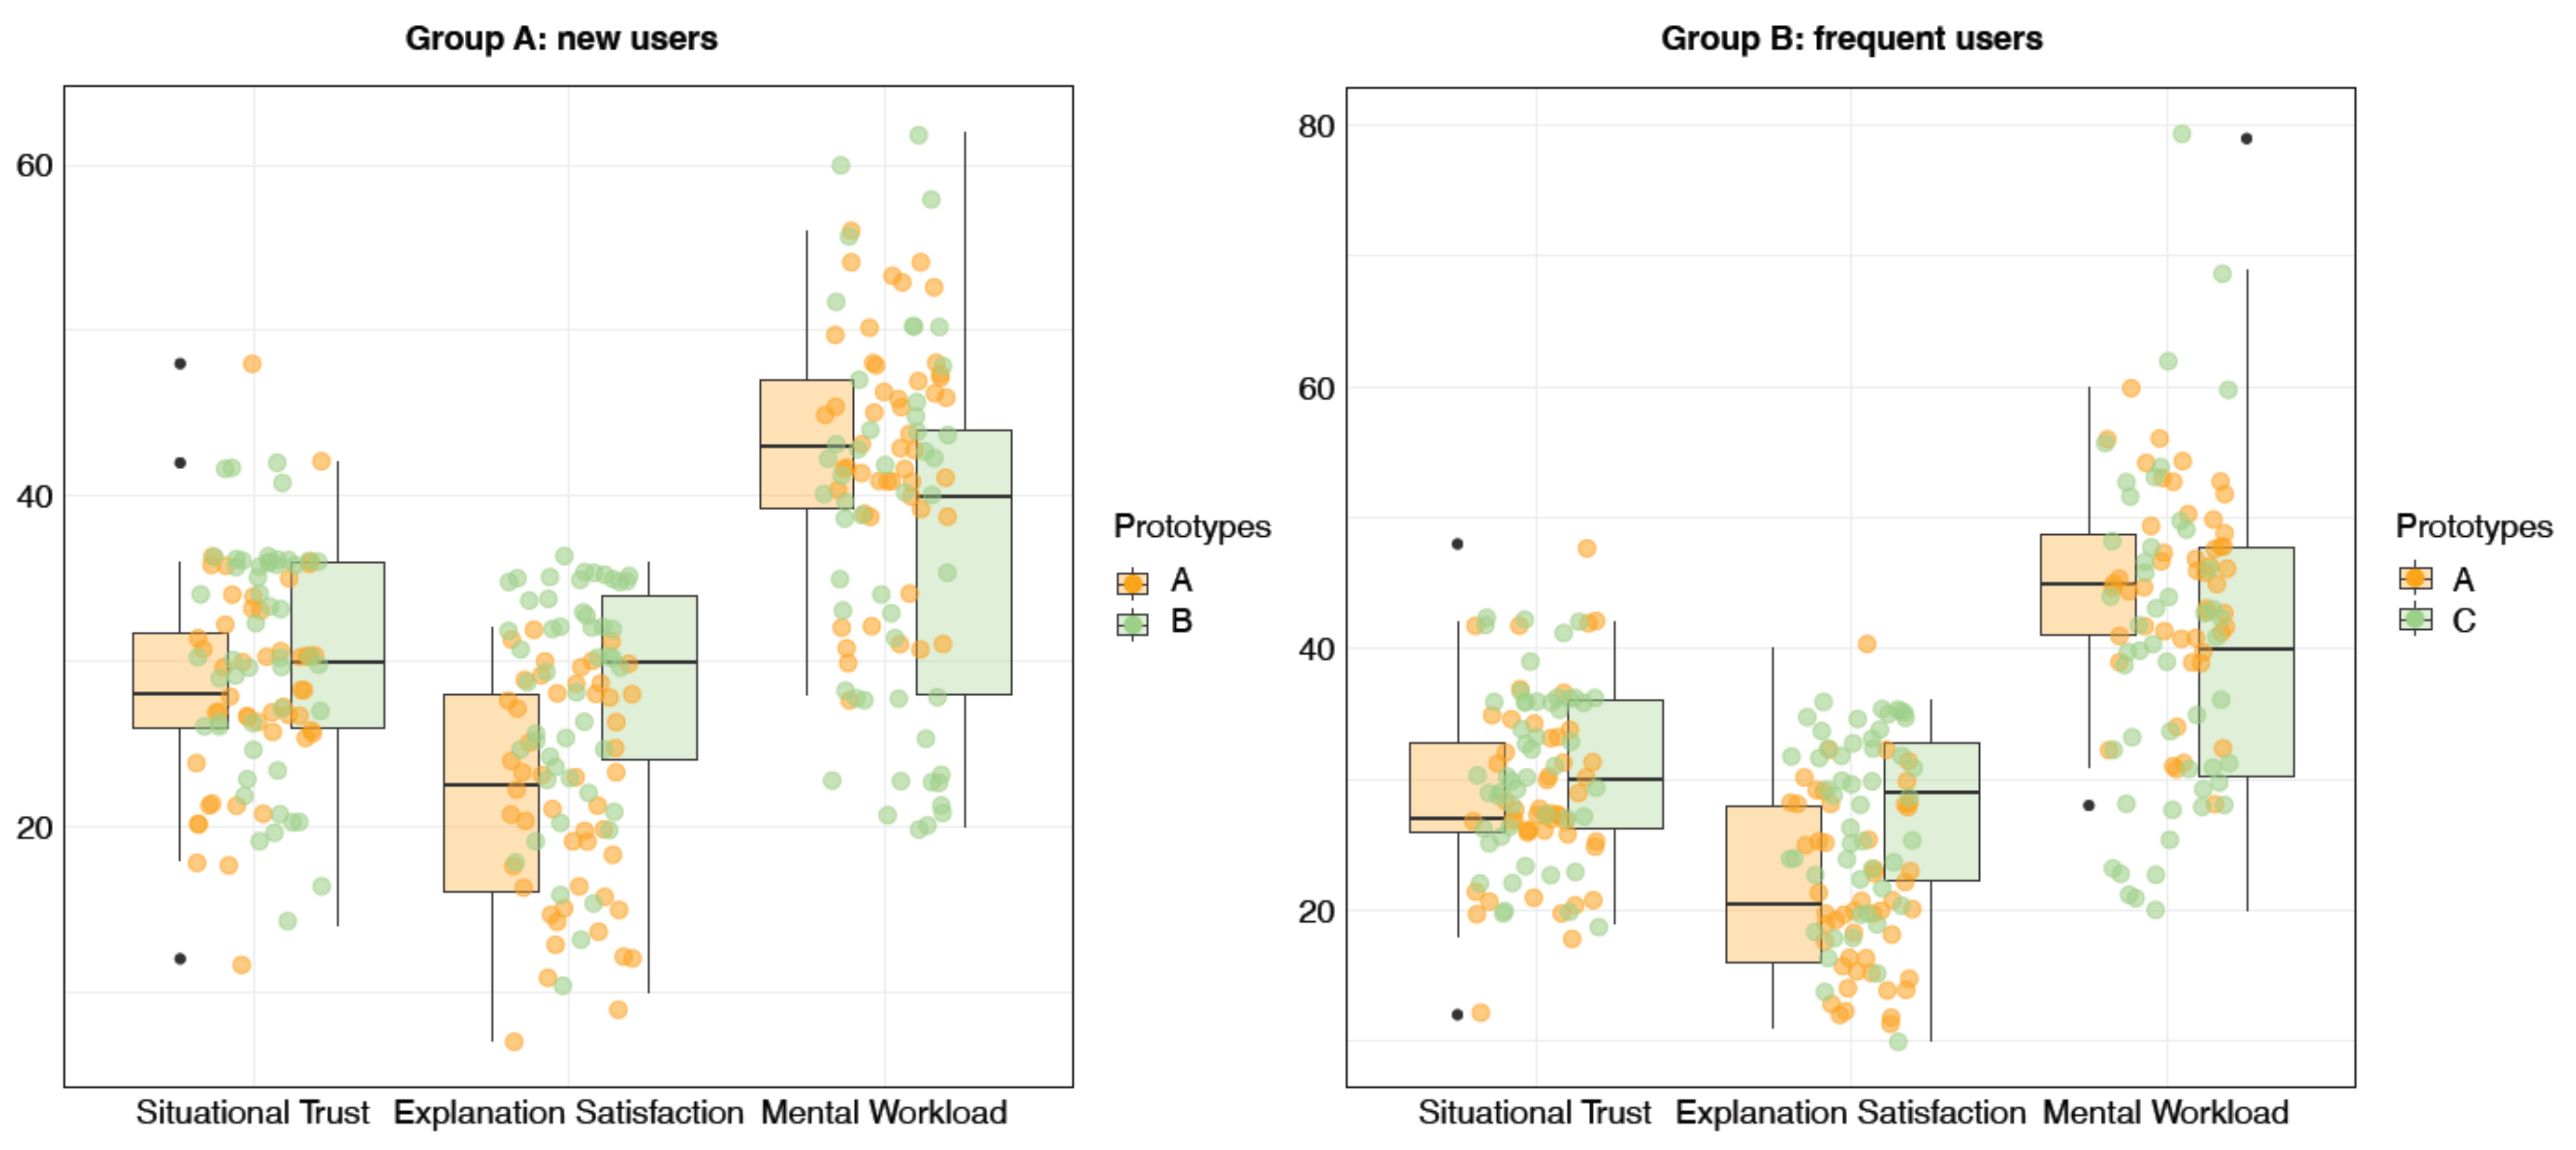
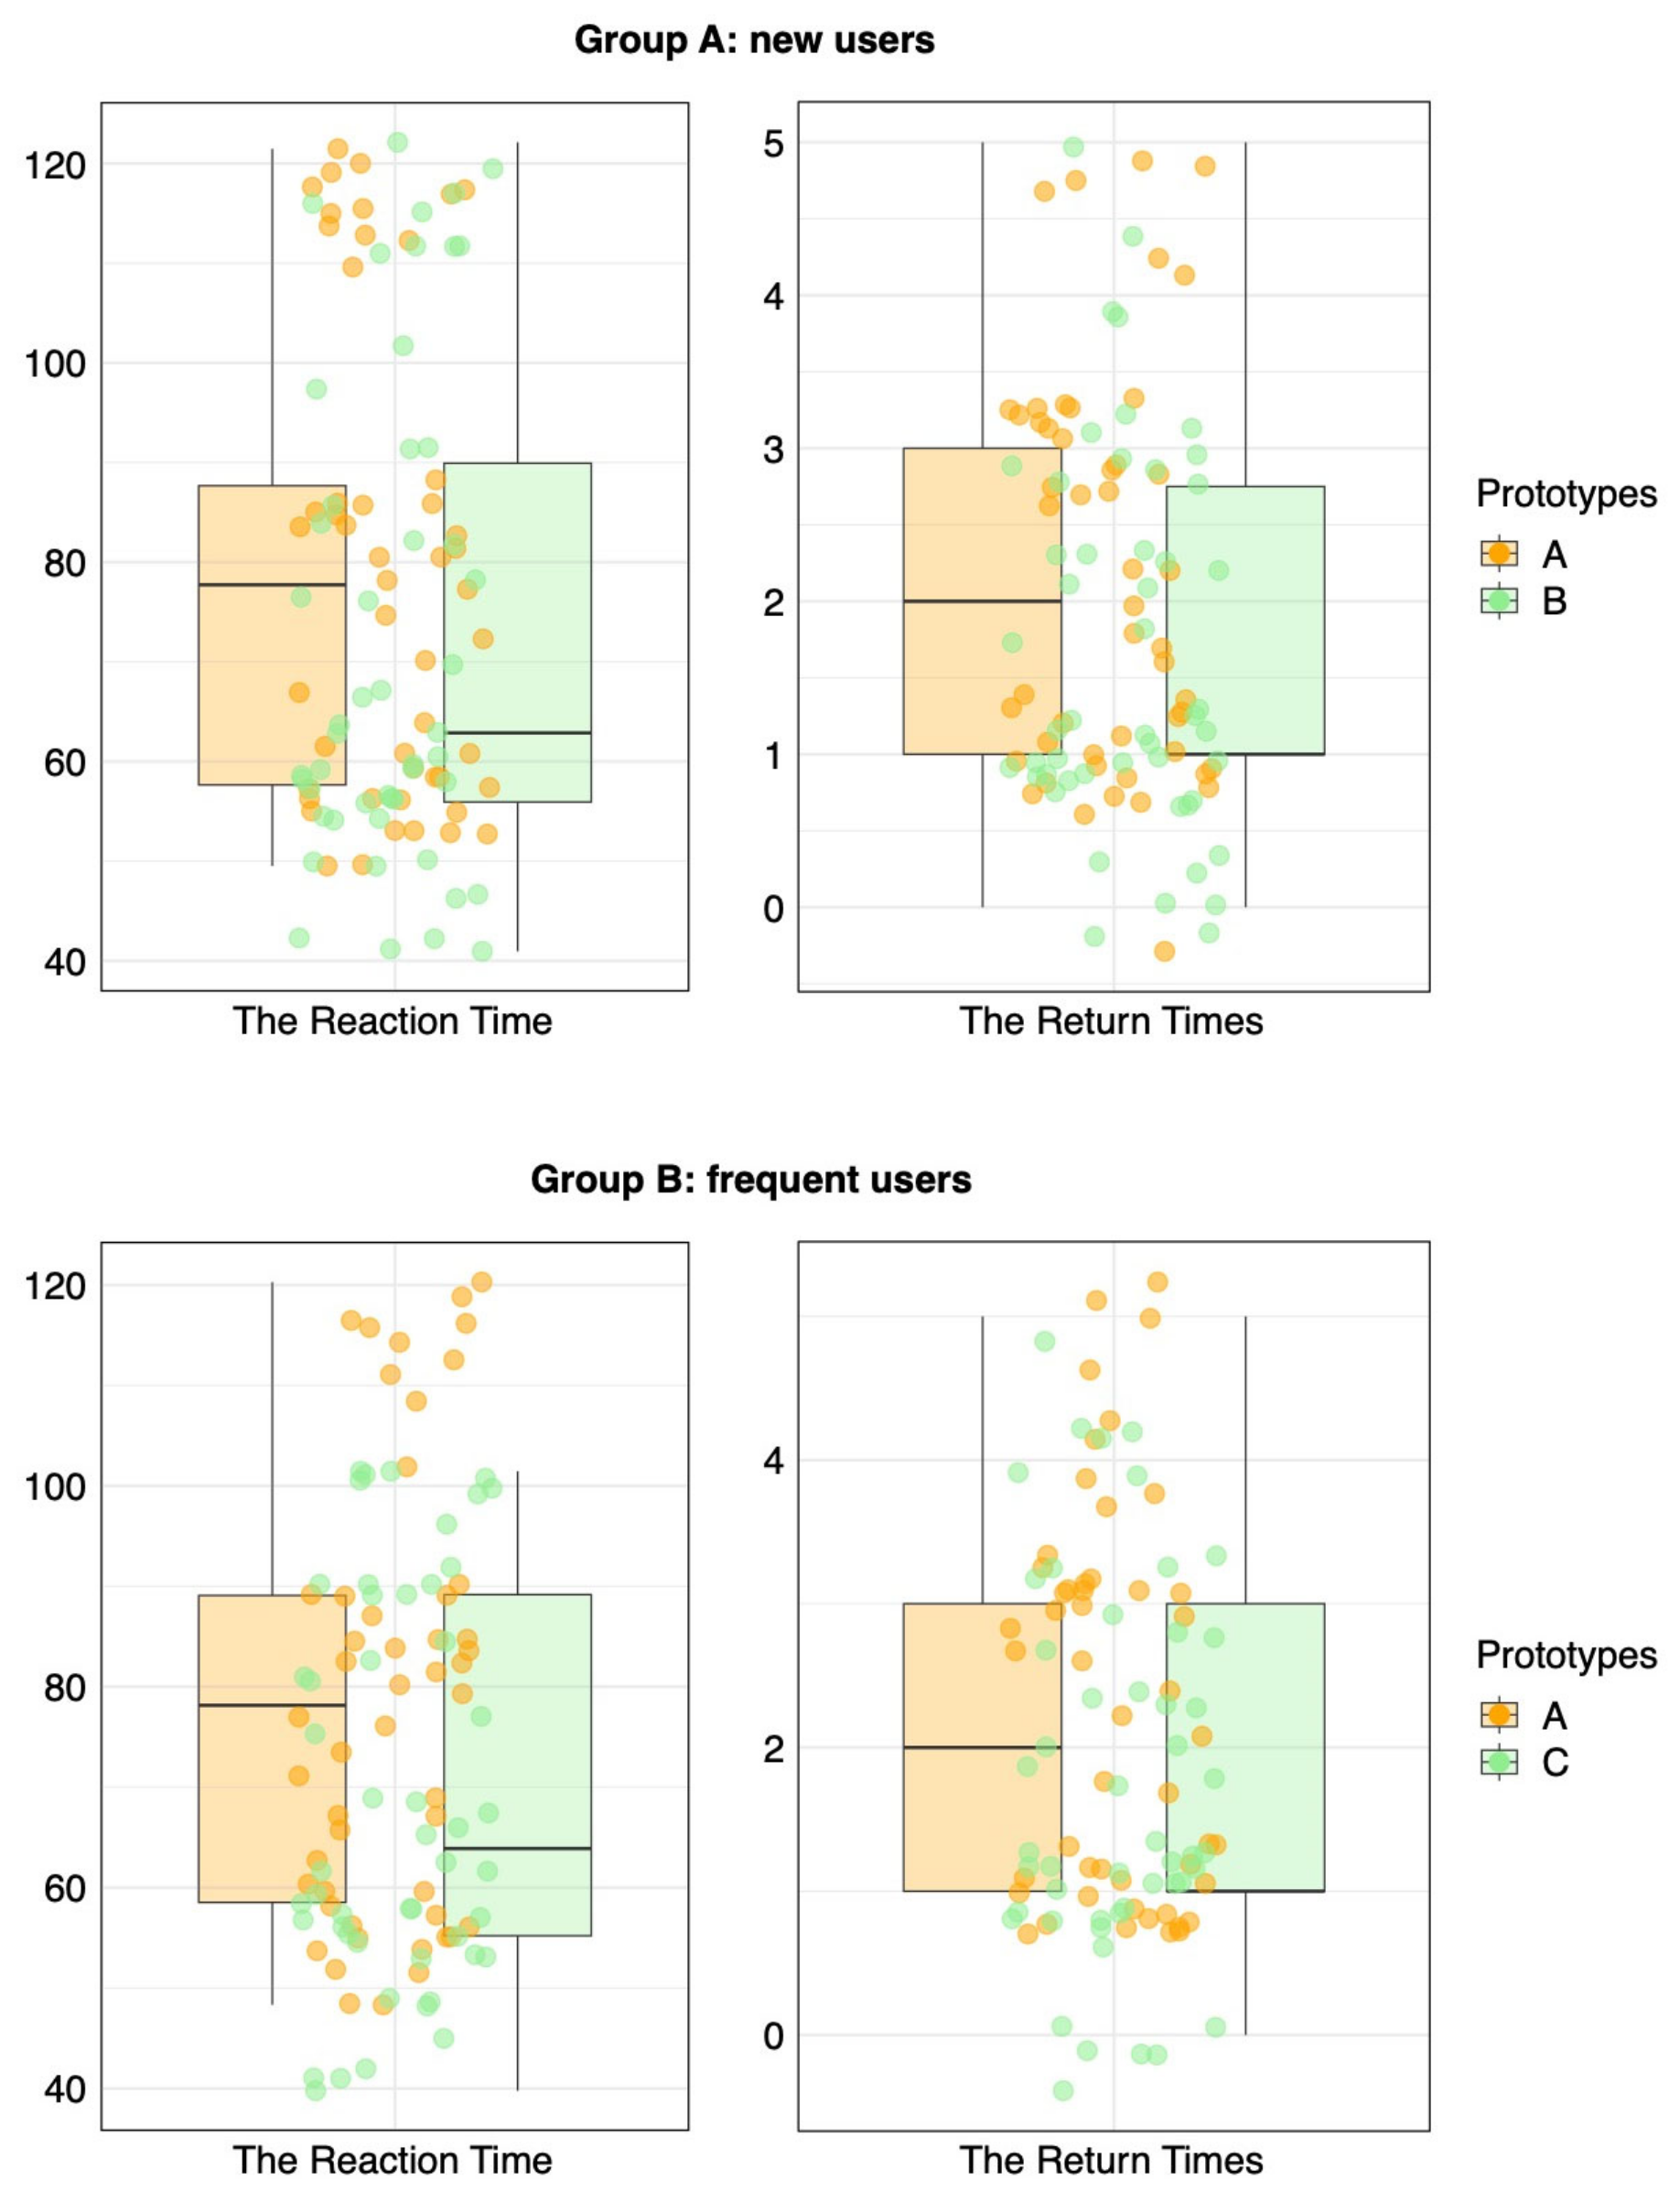
6. Experiment 2 Results

As in the case of Experiment 1, because the group results were not normally distributed, we performed Wilcoxon signed-ranks tests on relevant samples. The subjective evaluations of these tests for new and frequent users are presented in Table 4 and Table 5, respectively. For new users, customised explanations significantly affected situational trust (Z = −2.631, p < 0.05), explanation satisfaction (Z = −5.786, p < 0.001), and mental workload (Z = 3.075, p < 0.05). For frequent users, customised solutions also significantly affected the above indexes (p < 0.05).
Combining the boxplot of each index (Figure 9) shows that the participants were significantly more satisfied with the customised explanations. For new users, the explanation satisfaction of Prototype B (M = 28.08, SD = 6.75) was higher than that of Prototype A (M = 21.86, SD = 6.71); for frequent users, the results of Prototype B (M = 27.06, SD = 6.82) were higher than those of Prototype A (M = 21.64, SD = 6.58). Similarly, the situational trust of new users increased by 1.84 points compared to the results without customisation solutions, and that of frequent users increased by 1.98 points. Furthermore, we found that participants’ mental workload was significantly lower with the customised solutions compared to the control condition. For new users, Prototype B (M = 37.48, SD = 11.42) offered a lower mental workload than Prototype A (M = 42.66, SD = 6.97); for frequent users, Prototype B (M = 40.04, SD = 12.88) offered a lower mental workload than Prototype A (M = 44.42, SD = 7.23). In terms of the mean value for each index, both B and C among the customised prototypes generally performed better than Prototype A, which did not have a customised design. This result confirms that segmentation for different user groups improves the utility of the explanations presented.
The objective evaluations from experiment 2 are presented in Table 6. For Prototype A and B, the effects of the customised explanations on reaction time (Z = 2.751, p < 0.05) and return times (Z = 2.418, p < 0.05) were significant. Similarly, significant differences (p < 0.05) existed between Prototype A and C in terms of the reaction time (Z = 4.107, p < 0.001) and return times (Z = 2.557, p < 0.05). As shown in the boxplot of objective evaluations (Figure 10), for new users, the customised Prototype B (M = 72.85, SD = 24.65) offered a faster reaction time than the generic Prototype A (M = 79.32, SD = 23.77). For frequent users, the result of Prototype B (M= 69.67, SD = 19.56) was lower than that of Prototype C (M = 78.34, SD = 21.76). Similarly, the return times of new users decreased by 0.52 points compared to the values without the customisation solutions, and frequent users decreased by 0.56 points. These results strongly support the validity of hypotheses H6 and H7.

7. Discussion

In this study, we investigated the impact of scenario-based explanations on users’ subjective and objective evaluations of AVP systems. Moreover, we validated the impact of customised schemes specific to new and frequent users on the quality of explanations based on subjective and objective measures.
Based on the results of Experiment 1, H2 and H3 were supported, and H1 was partially supported. The subjective data from participants in this study indicated that scenario-based explanations increased situational trust and improved the UX along with providing a lower mental workload. Specifically, our study found that providing scenario-based explainable information on the in-vehicle HMI display and the mobile application effectively increased the UX from neutral to positive compared to a scenario without offering explainable information on system decision-making. This result is aligned with that of Tobias et al.’s study [11], which demonstrated that providing explanations improved the user experience of AVs.
Previous research has suggested that providing detailed information about autonomous driving situations may not effectively increase trust [38]. However, in this study, participants were able to understand the reasons behind the decisions made by the autonomous driving system through the scenario-based explanations. Particularly, the scenario-based explanations fostered the participants’ perception and comprehension of the current situation, enabling them to quickly understand the system’s intent and thereby increase confidence in the vehicle’s performance. These findings suggest that scenario-based explanations can effectively enhance trust and confidence in autonomous driving systems.
Our findings also differ from those of Du et al. [39], which found no differences in mental workload. In contrast, our study demonstrates that providing explanations reduced the drivers’ mental workload. This study also suggests that many users may be content with brief or concise textual explanations to satisfy their cognitive needs and enhance their understanding of the system’s decision-making process, leading to a reduction in both mental and physical demands.
Importantly, most research focuses on subjective measurements as explanations. Surveys and interviews are used to measure user satisfaction [40,41], the goodness of an explanation [42], the acceptance of the system’s advice [43,44], and trust in the system [45,46,47,48]. Such subjective measurements can provide valuable insight into the user’s perspectives on such explanations. However, these results do not necessarily relate to the behavioural effects an explanation could cause [49]. Therefore, we also measured users’ reaction time and return times as objective measurements to reliably evaluate the explanations. Although Silva et al. [50] found that explainability had no effect on completion time, in our study, scenario-based explanations resulted in improvements in the reaction time and return times. These results could be explained by user performance improving as a result of receiving satisfying explanations, effectively helping participants perform tasks correctly and completely [37].
In addition, Experiment 2 demonstrated that explanations designed for different population segments, such as new and frequent users, can improve users’ subjective evaluations, including their situational trust, explanation satisfaction, and mental workload. The results indicated that incorporating customisation functions into the system that consider individual differences and provide optimal explanations can effectively enhance the system’s explainability. These customised solutions can also help users make decisions in less time and reduce the number of return times. This result suggests that scores measuring explanation satisfaction are highly correlated with evaluations of the quality of users’ mental models [37]. Thus, the results from our evaluation support the hypotheses in Experiment 2.
In the final user interviews, new users highlighted a positive correlation between the ease of learning and their trust in AVP. Design features, including usability in automation, were found to influence trust by shaping user perceptions [51]. Likewise, the easy-to-learn characteristics of AVP, driven by explanations considering the users’ characteristics and contextual needs, contribute to smooth adaptation, especially for new users, thereby fostering perceptions of trustworthiness. A step-by-step wizard workflow with abundant visual explanations was used to enhance learnability, enabling users to perform the task as fast as possible even when completing it for the first time, which positively impacts trust and represents a crucial aspect of the autonomous vehicle adoption process [52]. Consequently, highly learnable AVP systems exhibit steep learning curves, reaching saturation with minimal repetition.
A natural progression of Experiment 2 would be to analyse the effects of users’ preferences between different target populations to allow for more personalised explanations. Such an analysis would be especially important for long-term exposure, as the need for explanations is anticipated to change when the user interacts with a system repeatedly [11]. For instance, our findings reveal that new users exhibit a higher demand for explanations, while the need for explanations decreases over time when users become more accustomed to the interaction. This indicates that a personalised AV appears to be significantly more reliable when each driver’s needs are understood [53]. Additionally, the participants note that, although new users are more conservative and cautious than frequent users, their trust level increases as they become more experienced with Autopilot and Summon. To some extent, this result parallels real-world research on Tesla drivers, which shows that trust in AV systems increases over time regardless of experience [54]. Hence, we should be attentive to the time effects of explainable systems, recognizing evolving contextual needs and the dynamic nature of trust.
Most current research on the explainability of autonomous driving has focused on the theory and implementation of explanations based on perceptual data, whereas empirical studies centred on the user remain scarce [55]. In contrast to other AVP studies, we innovatively explored the scenario-based explainability design of an AVP system and validated variations in the needs of different user populations. We designed interactions in the context of an automated future in line with users’ wishes, providing efficient solutions to address people’s concerns [6,7].

7.1. Design Implications and Future Challenges

In this section, we discuss how to design explanations that integrate with existing HMI guidelines on automated vehicles, in addition to addressing generalizability and potential challenges for real-world applications.
Explanations for AVs should be delicately designed, taking into account the cognitive responses and user experience of each driver or user. Firstly, prioritize pictographic information over text-based messages in visual interfaces whenever applicable, emphasising information that is readily understood by drivers [56]. There are several guidelines specific to pictographic information and icons that can support the design of such elements [57,58]. Secondly, when explaining the behaviour of autonomous systems, it is crucial to consider how to improve the system transparency and visibility of the explanatory information. For instance, visualising AV awareness with object recognition, using 3D displays in AV contexts, and revealing inner workings could be considered nice-to-have features [59]. Furthermore, the text with a coloured background we used in this study could be helpful to quickly shift attention to the explanation’s presentation location. These design strategies are expected to help drivers consume explanations quickly and understand them easily, enhancing current HMI standards.
This study introduced a scenario-based explanation framework based on explainable AI and assessed its effectiveness in the AVP system. This framework is not exclusive to AVP; it focuses on what users need to understand about AI systems to act in accordance with the system’s outputs [23]. This framework is easily adaptable to other domains, including levels L3–L5 of automated driving. In the AVP system, this framework extends to non-driving tasks (NDRT), freeing drivers from constant monitoring and enabling engagement with infotainment systems. It is anticipated that users of Level 3 driving automation will spend their newly acquired free time on activities not related to driving, as such users could easily become distracted and engage in NDRT [60]. Scenario-based explanations will reduce drivers’ mental workload, contributing to safer interactions. Moreover, the proposed framework can be applied to complex usage scenarios such as shared AVs, helping designers understand users’ flexible motivations and achieve engaging journey experiences for AVs [61]. At the same time, we combined self-reported subjective measurements with objective measurements to evaluate the impact of explainable design on user performance in specific tasks. This evaluation will help researchers provide more valuable insights in this area.
When these scenario-based explanations perform under real-world driving scenarios, certain explanatory information, such as the system decision criteria for allocating the right car park, must rely on more robust and explainable artificial intelligence (XAI) algorithms. XAI algorithms can provide feature importance, decision boundaries, and other explanatory information, thereby enhancing system transparency [62,63]. In explaining outputs from perception systems, AVs should also be able to provide real-time data access (onboard or remotely) to their digital representations of the 3D world, including semantic information, upon request by authorised entities [10]. Addressing security concerns and data privacy emerges as a key challenge in this context [64,65].

7.2. Limitations and Future Research

Inevitably, this study has some limitations. Firstly, since the experiment primarily focuses on investigating new technologies, participants who signed up were predominantly below the age of 40, resulting in a relatively young research sample. Future studies should diversify subjects by including different demographics, such as various age groups and cultural backgrounds, in field experiments to enhance external validity and result replicability. Secondly, visual explanations were found to be effective for highly automated driving in this study. However, the research also indicated that multimodal explanations of in-vehicle displays can have significant effects on various types of takeover situations [63]. Future investigations could explore the effectiveness of alternative explanations, such as auditory or haptic signals, considering different levels of automated driving systems. Furthermore, an interdisciplinary approach to the explainability of autonomous driving should also be adopted to enable better designing and evaluations of user-centred explanations. Such an approach should include disciplines like behavioural science (e.g., dialogue theory), human–computer interactions (e.g., user interface design), ethics (e.g., revealing biases in explanations), philosophy (e.g., causal explanation theories), and psychology [10].

8. Conclusions

Two experiments were conducted to explore the effectiveness of scenario-based explanations and whether group segmentation for new and frequent users could improve the quality of explanations. First, the results of Experiment 1 indicated that scenario-based explanations improved drivers’ perception and understanding of the intelligence capabilities of the system, leading to a significant increase in situational trust and positive user experience, as well as a decrease in mental workload. Scenario-based explanations also significantly improved task performance in objective evaluations. Second, the results of Experiment 2 suggested that new and frequent users have significantly different explainability needs. The needs of new users are centred on the cognitive generation of trust in the technology, with a higher demand for the ease of learning, understanding, transparency, and guided explanation of the system. In contrast, frequent users are more concerned about efficiency and driving safety, seeking faster and more convenient operation. Moreover, the experimental results confirmed that customised explanations for different segments of the population significantly improved users’ situational trust and explanation satisfaction and alleviated their mental workload. Adapting explanations to users will also enable improved task performance fluency. This study explored the explainability of autonomous driving systems in automated valet parking scenarios by merging the fields of HMI, UX design, explainable AI, and autonomous driving through a scenario-based design approach. This study also validated the designed explainability for different user populations. This study’s results could serve as a reference for designing interactions between drivers and AVs, which will enhance users’ acceptance of the technology and its sustainability.

Author Contributions

Conceptualisation, J.M. and X.F.; funding acquisition, J.M.; Project administration, J.M.; Supervision, J.M.; methodology, X.F.; software, X.F.; validation, J.M. and X.F.; data curation, X.F.; writing—original draft preparation, X.F.; writing—review and editing, J.M. and X.F.; visualisation, X.F. All authors have read and agreed to the published version of the manuscript.

Funding

This study was supported by the Shanghai Municipal Science and Technology Major Project (2021SHZDZX0100) and Fundamental Research Funds for the Central Universities.

Institutional Review Board Statement

The study was conducted in accordance with the Declaration of Helsinki and approved by the Science and Technology Ethics Committee of Tongji University (tjdxsr012) for studies involving humans on 1 September 2021.

Data Availability Statement

The data presented in this study are not available due to privacy.

Conflicts of Interest

The authors declare no conflict of interest.

Appendix A

Table A1. Details of the questionnaires given to the participants.
Variables QuestionsScaleReferences
Situational Trust01.I trust the automation in this situation.7-point Likert scale (Ratings that range from 1 = not at all, to 7 = extremely)[33]
02.I would have performed better than the automated vehicle in this situation (reverse scored).
03.In this situation, the automated vehicle performs well enough for me to engage in other activities (such as reading).
04.The situation was risky (reverse scored).
05.The automated vehicle made an unsafe judgement in this situation (reverse scored).
06.The automated vehicle reacted appropriately to the environment.
NASA-TLX07.How much mental and perceptual activity was required (e.g., thinking, deciding, calculating, remembering, looking, searching, etc.)? Was the task easy or demanding, simple or complex, exacting or forgiving?7-point Likert scale (Ratings that range from 1 = low, to 7 = high)[36]
08.How much physical activity was required (e.g., pushing, pulling, turning, controlling, activating, etc.)? Was the task easy or demanding, slow or brisk, slack or strenuous, restful or laborious?
09.How much time pressure did you feel due to the rate or pace at which the tasks or task elements occurred? Was the pace slow and leisurely or rapid and frantic?
10.How hard did you have to work (mentally and physically) to accomplish your level of performance?
11.How insecure, discouraged, irritated, stressed, and annoyed versus secure, gratified, content, relaxed, and complacent did you feel during the task?
12.How successful do you think you were in accomplishing the goals of the task set by the experimenter (or yourself)? How satisfied were you with your performance in accomplishing these goals?7-point Likert scale (Ratings that range from 1 = good, to 7 = poor)
User Experience13.Is it clear or confusing?7-point Likert scale (Ratings that range from 1 = negative term, to 7 = positive term)[34]
14.Is it inefficient or efficient?
15.Is it complicated or easy?
16.Is it obstructive or supportive?
17Is it boring or exciting?
18.Is it not interesting or interesting?
19.Is it conventional or inventive?
20.Is it usual or leading edge?
Explanation Satisfaction21.This explanation of how the [software, algorithm, tool] works is satisfying.7-point Likert scale (Ratings that range from 1 = not at all, to 7 = extremely)[37]
22.This explanation of how the [software, algorithm, tool] works has sufficient detail.
23.This explanation of how the [software, algorithm, tool] works tells me how to use it.
24.This explanation of how the [software, algorithm, tool] works is helpful.
25.This explanation lets me judge when I should trust and not trust the [software, algorithm, tool].

References

  1. Tomasevic, N.; Young, K.L.; Horberry, T.; Fildes, B. A path towards sustainable vehicle automation: Willingness to engage in Level 3 automated driving. Sustainability 2022, 14, 4602. [Google Scholar] [CrossRef]
  2. Banzhaf, H.; Nienhuser, D.; Knoop, S.; Zollner, J.M. The future of parking: A survey on automated valet parking with an outlook on high density parking. In Proceedings of the 2017 IEEE Intelligent Vehicles Symposium (IV), Los Angeles, CA, USA, 11–14 June 2017; pp. 1827–1834. [Google Scholar]
  3. Ni, J.; Lin, X.; Shen, X. Toward Privacy-Preserving Valet Parking in Autonomous Driving Era. IEEE Trans. Veh. Technol. 2019, 68, 2893–2905. [Google Scholar] [CrossRef]
  4. Chehri, A.; Mouftah, H.T. Autonomous vehicles in the sustainable cities, the beginning of a green adventure. Sustain. Cities Soc. 2019, 51, e101751. [Google Scholar] [CrossRef]
  5. J3016; Automated Driving—Levels of Driving Automation. SAE International: Warrendale, PA, USA, 2014.
  6. Rödel, C.; Stadler, S.; Meschtscherjakov, A.; Tscheligi, M. Towards autonomous cars: The effect of autonomy levels on acceptance and user experience. In Proceedings of the AutomotiveUI ‘14: 6th International Conference on Automotive user Interfaces and Interactive Vehicular Applications, Seattle, WA, USA, 17–19 September 2014; pp. 1–8. [Google Scholar]
  7. Ha, T.; Kim, S.; Seo, D.; Lee, S. Effects of explanation types and perceived risk on trust in autonomous vehicles. Transp. Res. Part F Traffic Psychol. Behav. 2020, 73, 271–280. [Google Scholar] [CrossRef]
  8. Edmonds, E. AAA Newsroom: Self-Driving Cars Stuck in Neutral on the Road to Acceptance. 2020. Available online: https://newsroom.aaa.com/tag/autonomous-vehicles/ (accessed on 5 March 2020).
  9. Cunneen, M.; Mullins, M.; Murphy, F. Autonomous Vehicles and Embedded Artificial Intelligence: The Challenges of Framing Machine Driving Decisions. Appl. Artif. Intell. 2019, 33, 706–731. [Google Scholar] [CrossRef]
  10. Omeiza, D.; Webb, H.; Jirotka, M.; Kunze, L. Explanations in autonomous driving: A survey. IEEE Trans. Intell. Transp. Syst. 2021, 23, 10142–10162. [Google Scholar] [CrossRef]
  11. Schneider, T.; Hois, J.; Rosenstein, A.; Ghellal, S.; Theofanou-Fülbier, D.; Gerlicher, A.R. Explain yourself! Transparency for positive ux in autonomous driving. In Proceedings of the CHI ‘2021 Conference on Human Factors in Computing Systems, Yokohama, Japan, 8–13 May 2021; pp. 1–12. [Google Scholar]
  12. Goldman, C.V.; Bustin, R. Trusting Explainable Autonomous Driving: Simulated Studies. In Proceedings of the 2022 IEEE Intelligent Vehicles Symposium (IV), Aachen, Germany, 4–9 June 2022; pp. 1255–1260. [Google Scholar]
  13. Zhang, Q.; Yang, X.J.; Robert, L.P. What and When to Explain? A Survey of the Impact of Explanation on Attitudes toward Adopting Automated Vehicles. IEEE Access 2021, 9, 159533–159540. [Google Scholar] [CrossRef]
  14. Haspiel, J.; Du, N.; Meyerson, J.; Lionel, P.R., Jr.; Tilbury, D.; Yang, X.J.; Pradhan, A.K. Explanations and expectations: Trust building in automated vehicles. In Proceedings of the HRI’18: ACM/IEEE International Conference on Human-Robot Interaction, Chicago, IL, USA, 5–8 March 2018; pp. 119–120. [Google Scholar]
  15. Häuslschmid, R.; von Buelow, M.; Pfleging, B.; Butz, A. Supporting Trust in autonomous driving. In Proceedings of the IUI ‘17: 22nd International Conference on Intelligent User Interfaces, Limassol, Cyprus, 13–16 March 2017; pp. 319–329. [Google Scholar]
  16. Koo, J.; Kwac, J.; Ju, W.; Steinert, M.; Leifer, L.; Nass, C. Why did my car just do that? Explaining semi-autonomous driving actions to improve driver understanding, trust, and performance. Int. J. Interact. Des. Manuf. 2014, 9, 269–275. [Google Scholar] [CrossRef]
  17. Naujoks, F.; Forster, Y.; Wiedemann, K.; Neukum, A. Speech improves human-automation cooperation in automated driving. In Proceedings of the Mensch und Computer 2016–Workshopband, Aachen, Germany, 4–7 September 2016. [Google Scholar]
  18. Hois, J.; Theofanou-Fuelbier, D.; Junk, A.J. How to Achieve Explainability and Transparency in Human AI Interaction. In Proceedings of the HCII 2019: International Conference on Human-Computer Interaction, Orlado, FL, USA, 26–31 July 2019; pp. 177–183. [Google Scholar]
  19. Abdul, A.; Vermeulen, J.; Wang, D.; Lim, B.Y.; Kankanhalli, M. Trends and trajectories for explainable, accountable and intelligible systems: An HCI research agenda. In Proceedings of the CHI ‘18 Conference on Human Factors in Computing Systems, Montreal, QC, Canada, 21–26 April 2018; pp. 1–18. [Google Scholar]
  20. Park, S.Y.; Moore, D.J.; Sirkin, D. What a Driver Wants: User Preferences in Semi-Autonomous Vehicle Decision-Making. In Proceedings of the CHI‘20: Conference on Human Factors in Computing Systems, Honolulu, HI, USA, 25–30 April 2020; pp. 1–13. [Google Scholar] [CrossRef]
  21. De Craen, S.; Twisk, D.; Hagenzieker, M.; Elffers, H.; Brookhuis, K. Do young novice drivers overestimate their driving skills more than experienced drivers? Different methods lead to different conclusions. Accid. Anal. Prev. 2011, 43, 1660–1665. [Google Scholar] [CrossRef]
  22. Zhang, J.; Guo, G.; Wang, P.; Tang, Q.; Zhang, Z. Research on the Differences of Risk Perception Ability Between Novice and Experienced Drivers. In Proceedings of the HCII 2019: International Conference on Human-Computer Interaction, Orlando, FL, USA, 26–31 July 2019; pp. 433–447. [Google Scholar]
  23. Wolf, T.C. Explainability scenarios: Towards scenario-based XAI design. In Proceedings of the IUI ‘19: 24th International Conference on Intelligent User Interfaces, Los Angeles, CA, USA, 17–20 March 2019; pp. 252–257. [Google Scholar]
  24. Rosson, M.B.; Carroll, J.M. Scenario-based Design. Human-Computer Interaction: Development Process. In The Human-Computer Interaction Handbook; Jacko, J.A., Sears, A., Eds.; Lawrence Erlbaum Associates Inc.: Mahwah, NJ, USA, 2003; pp. 1032–1050. [Google Scholar]
  25. Carroll, J.M. Becoming social: Expanding scenario-based approaches in HCI. Behav. Inf. Technol. 1996, 15, 266–275. [Google Scholar] [CrossRef]
  26. Jo, Y.; Ha, J.; Hwang, S. Survey of Technology in Autonomous Valet Parking System. Int. J. Automot. Technol. 2023, 24, 1577–1587. [Google Scholar] [CrossRef]
  27. Williams, L. The whole story of parking: The world of parking is no longer stationary. Eng. Technol. 2019, 14, 56–61. [Google Scholar] [CrossRef]
  28. Khalid, M.; Cao, Y.; Aslam, N.; Raza, M.; Moon, A.; Zhou, H. AVPark: Reservation and Cost Optimization-Based Cyber-Physical System for Long-Range Autonomous Valet Parking (L-AVP). IEEE Access 2019, 7, 114141–114153. [Google Scholar] [CrossRef]
  29. Khalid, M.; Cao, Y.; Zhang, X.; Han, C.; Peng, L.; Aslam, N.; Ahmad, N. Towards autonomy: Cost-effective scheduling for long-range autonomous valet parking (LAVP). In Proceedings of the 2018 IEEE Wireless Communications and Networking Conference (WCNC), Barcelona, Spain, 15–18 April 2018; pp. 1–6. [Google Scholar]
  30. Khalid, M.; Wang, K.; Aslam, N.; Cao, Y.; Ahmad, N.; Khan, M.K. From smart parking towards autonomous valet parking: A survey, challenges and future Works. J. Netw. Comput. Appl. 2020, 175, 102935. [Google Scholar] [CrossRef]
  31. Go, K.; Carroll, J.M. The blind men and the elephant: Views of scenario-based system design. Interactions 2004, 11, 44–53. [Google Scholar] [CrossRef]
  32. Fröhlich, P.; Schatz, R.; Buchta, M.; Schrammel, J.; Suette, S.; Tscheligi, M. “What’s the Robo-Driver up to?” Requirements for Screen-based Awareness and Intent Communication in Autonomous Buses. i-com 2019, 18, 151–165. [Google Scholar] [CrossRef]
  33. Holthausen, B.E.; Wintersberger, P.; Walker, B.N.; Riener, A. Situational trust scale for automated driving (STS-AD): Development and initial validation. In Proceedings of the Automotive UI ‘20: 12th International Conference on Automotive User Interfaces and Interactive Vehicular Applications, Virtual Event, 21–22 September 2020; pp. 40–47. [Google Scholar]
  34. Schrepp, M.; Hinderks, A.; Thomaschewski, J. Design and Evaluation of a Short Version of the User Experience Questionnaire (UEQ-S). Int. J. Interact. Multimedia Artif. Intell. 2017, 4, 103–108. [Google Scholar] [CrossRef]
  35. Hart, S.G.; Staveland, L.E. Development of NASA-TLX (Task Load Index): Results of empirical and theoretical research. In Advances in Psychology; North-Holland: Amsterdam, The Netherlands, 1988; Volume 52, pp. 139–183. [Google Scholar]
  36. Hart, S.G. Nasa-Task Load Index (NASA-TLX); 20 Years Later. Proc. Hum. Factors Ergon. Soc. Annu. Meet. 2006, 50, 904–908. [Google Scholar] [CrossRef]
  37. Hoffman, R.R.; Mueller, S.T.; Klein, G.; Litman, J. Metrics for explainable AI: Challenges and prospects. arXiv 2018, arXiv:1812.04608. [Google Scholar]
  38. Helldin, T.; Falkman, G.; Riveiro, M.; Davidsson, S. Presenting system uncertainty in automotive UIs for sup-porting trust calibration in autonomous driving. In Proceedings of the Automotive UI ‘13: 5th International Conference on Automotive User Interfaces and Interactive Vehicular Applications, Eindhoven, The Netherlands, 28–30 October 2013; pp. 210–217. [Google Scholar]
  39. Du, N.; Haspiel, J.; Zhang, Q.; Tilbury, D.; Pradhan, A.K.; Yang, X.J.; Lione, P.R., Jr. Look who’s talking now: Implications of AV’s explanations on driver’s trust, AV preference, anxiety and mental workload. Transp. Res. Part C Emerg. Technol. 2019, 104, 428–442. [Google Scholar] [CrossRef]
  40. Bilgic, M.; Mooney, R.J. Explaining recommendations: Satisfaction vs. promotion. In Beyond Personalization 2005, A Workshop on the Next Stage of Recommender Systems Research, Proceedings of the 2005 International Conference on Intelligent User Interfaces, San Diego, CA, USA, 10–13 January 2005; GroupLens Research: Minneapolis, MN, USA, 2005; Volume 5, p. 153. [Google Scholar]
  41. Ehsan, U.; Harrison, B.; Chan, L.; Riedl, M.O. Rationalization: A Neural Machine Translation Approach to Generating Natural Language Explanations. In Proceedings of the AIES ‘18: AAAI/ACM Conference on AI, Ethics, and Society, New Orleans, LA, USA, 2–3 February 2018; pp. 81–87. [Google Scholar]
  42. Hendricks, L.A.; Akata, Z.; Rohrbach, M.; Donahue, J.; Schiele, B.; Darrell, T. Generating visual explanations. In Proceedings of the Computer Vision–ECCV 2016: 14th European Conference, Amsterdam, The Netherlands, 11–14 October 2016; pp. 3–19. [Google Scholar]
  43. Herlocker, J.L.; Konstan, J.A.; Riedl, J. Explaining collaborative filtering recommendations. In Proceedings of the 2000 ACM Conference on Computer Supported Cooperative Work, Philadelphia, PA, USA, 2–6 December 2000; pp. 241–250. [Google Scholar]
  44. Ye, L.R.; Johnson, P.E. The Impact of Explanation Facilities on User Acceptance of Expert Systems Advice. MIS Q. 1995, 19, 157–172. [Google Scholar] [CrossRef]
  45. Zhou, J.; Li, Z.; Hu, H.; Yu, K.; Chen, F.; Li, Z.; Wang, Y. Effects of influence on user trust in predictive decision making. In Extended Abstracts of the 2019 CHI Conference on Human Factors in Computing Systems; Association for Computing Machinery: New York, NY, USA, 2019; pp. 1–6. [Google Scholar]
  46. Berkovsky, S.; Taib, R.; Conway, D. How to Recommend?: User Trust Factors in Movie Recommender Systems. In Proceedings of the IUI’17: 22nd International Conference on Intelligent User Interfaces, Limassol, Cyprus, 13–16 March 2017; pp. 287–300. [Google Scholar]
  47. Holliday, D.; Wilson, S.; Stumpf, S. User Trust in Intelligent Systems: A Journey Over Time. In Proceedings of the IUI’16: 21st International Conference on Intelligent User Interfaces, Sonoma, CA, USA, 7–10 March 2016; pp. 164–168. [Google Scholar]
  48. Nothdurft, F.; Heinroth, T.; Minker, W. The impact of explanation dialogues on human-computer trust. In Human-Computer Interaction. Users and Contexts of Use. HCII 2013; Lecture Notes in Computer Science; Springer: Berlin/Heidelberg, Germany, 2013; Volume 8006, pp. 59–67. [Google Scholar]
  49. van der Waa, J.; Nieuwburg, E.; Cremers, A.; Neerincx, M. Evaluating XAI: A comparison of rule-based and example-based explanations. Artif. Intell. 2021, 291, 103404. [Google Scholar] [CrossRef]
  50. Silva, A.; Schrum, M.; Hedlund-Botti, E.; Gopalan, N.; Gombolay, M. Explainable Artificial Intelligence: Evaluating the Objective and Subjective Impacts of xAI on Human-Agent Interaction. Int. J. Human–Computer Interact. 2023, 39, 1390–1404. [Google Scholar] [CrossRef]
  51. Hoff, K.A.; Bashir, M. Trust in automation: Integrating empirical evidence on factors that influence trust. Hum. Factors 2015, 57, 407–434. [Google Scholar] [CrossRef] [PubMed]
  52. Zhou, S.; Sun, X.; Wang, Q.; Liu, B.; Burnett, G. Examining pedestrians’ trust in automated vehicles based on attributes of trust: A qualitative study. Appl. Ergon. 2023, 109, 103997. [Google Scholar] [CrossRef] [PubMed]
  53. Sun, X.; Li, J.; Tang, P.; Zhou, S.; Peng, X.; Li, H.N.; Wang, Q. Exploring Personalised Autonomous Vehicles to Influence User Trust. Cogn. Comput. 2020, 12, 1170–1186. [Google Scholar] [CrossRef]
  54. Dikmen, M.; Burns, C. Trust in autonomous vehicles: The case of Tesla Autopilot and Summon. In Proceedings of the 2017 IEEE International Conference on Systems, Man, and Cybernetics (SMC), Banff, AB, Canada, 5–8 October 2017. [Google Scholar] [CrossRef]
  55. Schuß, M.; Riener, A. ”Give Me the Keys, I’ll Drive!”. In Proceedings of the AutomotiveUI ‘20: 12th International Conference on Automotive User Interfaces and Interactive Vehicular Applications, Virtual Event, 20–21 September 2020. [Google Scholar]
  56. Mehrotra, S.; Wang, M.; Wong, N.; Parker, J.I.; Roberts, S.C.; Kim, W.; Romo, A.; Horrey, W.J. Human-Machine Interfaces and Vehicle Automation: A Review of the Literature and Recommendations for System Design, Feedback, and Alerts; AAA Foundation for Traffic Safety: Washington, DC, USA, 2022. [Google Scholar]
  57. Korpi, J.; Ahonen-Rainio, P. Design guidelines for pictographic symbols: Evidence from symbols designed by students. In Proceedings of the 1st ICA European Symposium on Cartography, Vienna, Austria, 10–12 November 2015; pp. 1–16. [Google Scholar]
  58. Collaud, R.; Reppa, I.; Défayes, L.; McDougall, S.; Henchoz, N.; Sonderegger, A. Design standards for icons: The independent role of aesthetics, visual complexity and concreteness in icon design and icon understanding. Displays 2022, 74, 102290. [Google Scholar] [CrossRef]
  59. Colley, M.; Stampf, A.; Fischer, W.; Rukzio, E. Effects of 3D Displays on Mental Workload, Situation Awareness, Trust, and Performance Assessment in Automated Vehicles. In Proceedings of the MUM ‘23: International Conference on Mobile and Ubiquitous Multimedia, Vienna, Austria, 3–6 December 2023. [Google Scholar]
  60. Lee, S.C.; Yoon, S.H.; Ji, Y.G. Effects of Non-Driving-Related Task Attributes on Takeover Quality in Automated Vehicles. Int. J. Human–Computer Interact. 2021, 37, 211–219. [Google Scholar] [CrossRef]
  61. Pink, S.; Osz, K.; Raats, K.; Lindgren, T.; Fors, V. Design anthropology for emerging technologies: Trust and sharing in autonomous driving futures. Des. Stud. 2020, 69, 100942. [Google Scholar] [CrossRef]
  62. Molnar, C. Interpretable Machine Learning. 2019. Available online: https://christophm.github.io/interpretable-ml-book/ (accessed on 17 December 2023).
  63. Lee, S.; Hong, J.; Jeon, G.; Jo, J.; Boo, S.; Kim, H.; Jung, S.; Park, J.; Choi, I.; Kim, S. Investigating effects of multimodal explanations using multiple In-vehicle displays for takeover request in conditionally automated driving. Transp. Res. Part F Traffic Psychol. Behav. 2023, 96, 1–22. [Google Scholar] [CrossRef]
  64. Goudarzi, A.; Ghayoor, F.; Waseem, M.; Fahad, S.; Traore, I. A Survey on IoT-Enabled Smart Grids: Emerging, Applications, Challenges, and Outlook. Energies 2022, 15, 6984. [Google Scholar] [CrossRef]
  65. Waseem, M.; Khan, M.A.; Goudarzi, A.; Fahad, S.; Sajjad, I.A.; Siano, P. Incorporation of Blockchain Technology for Different Smart Grid Applications: Architecture, Prospects, and Challenges. Energies 2023, 16, 820. [Google Scholar] [CrossRef]
Figure 1. Scenario-based explainable design for AVP.
Sustainability 16 00063 g001
Figure 2. Partial illustration of the prototypes in Experiment 1.
Sustainability 16 00063 g002
Figure 3. Experimental equipment: static driving simulator (A), smartphone with the mobile application (B), and HMI (C).
Sustainability 16 00063 g003
Figure 4. Test flow of Experiment 1.
Sustainability 16 00063 g004
Figure 5. Boxplot of each index between Prototype A and B.
Sustainability 16 00063 g005
Figure 6. Boxplot of the reaction times (left) and return times (right) between Prototype A and B.
Sustainability 16 00063 g006
Figure 7. Partial illustration of the prototypes in Experiment 2.
Sustainability 16 00063 g007
Figure 8. Test flow of Experiment 2.
Sustainability 16 00063 g008
Figure 9. Boxplot of each index in Experiment 2.
Sustainability 16 00063 g009
Figure 10. Boxplot of the reaction time and the return times of Experiment 2.
Sustainability 16 00063 g010
Table 1. Participants’ profiles.
RespondentsTitleGenderCountryPosition
1DrFChinaResearcher
2DrMGermanySenior Researcher
3DrMChinaLead Tech
4DrFChinaResearcher
5Mr.MChinaSenior Project Manager
6Mr.MChinaDirector
7Ms.FChinaSenior Project Manager
8DrFChinaResearcher
Table 2. Wilcoxon signed-ranks test statistics a for the subjective evaluation of Experiment 1.
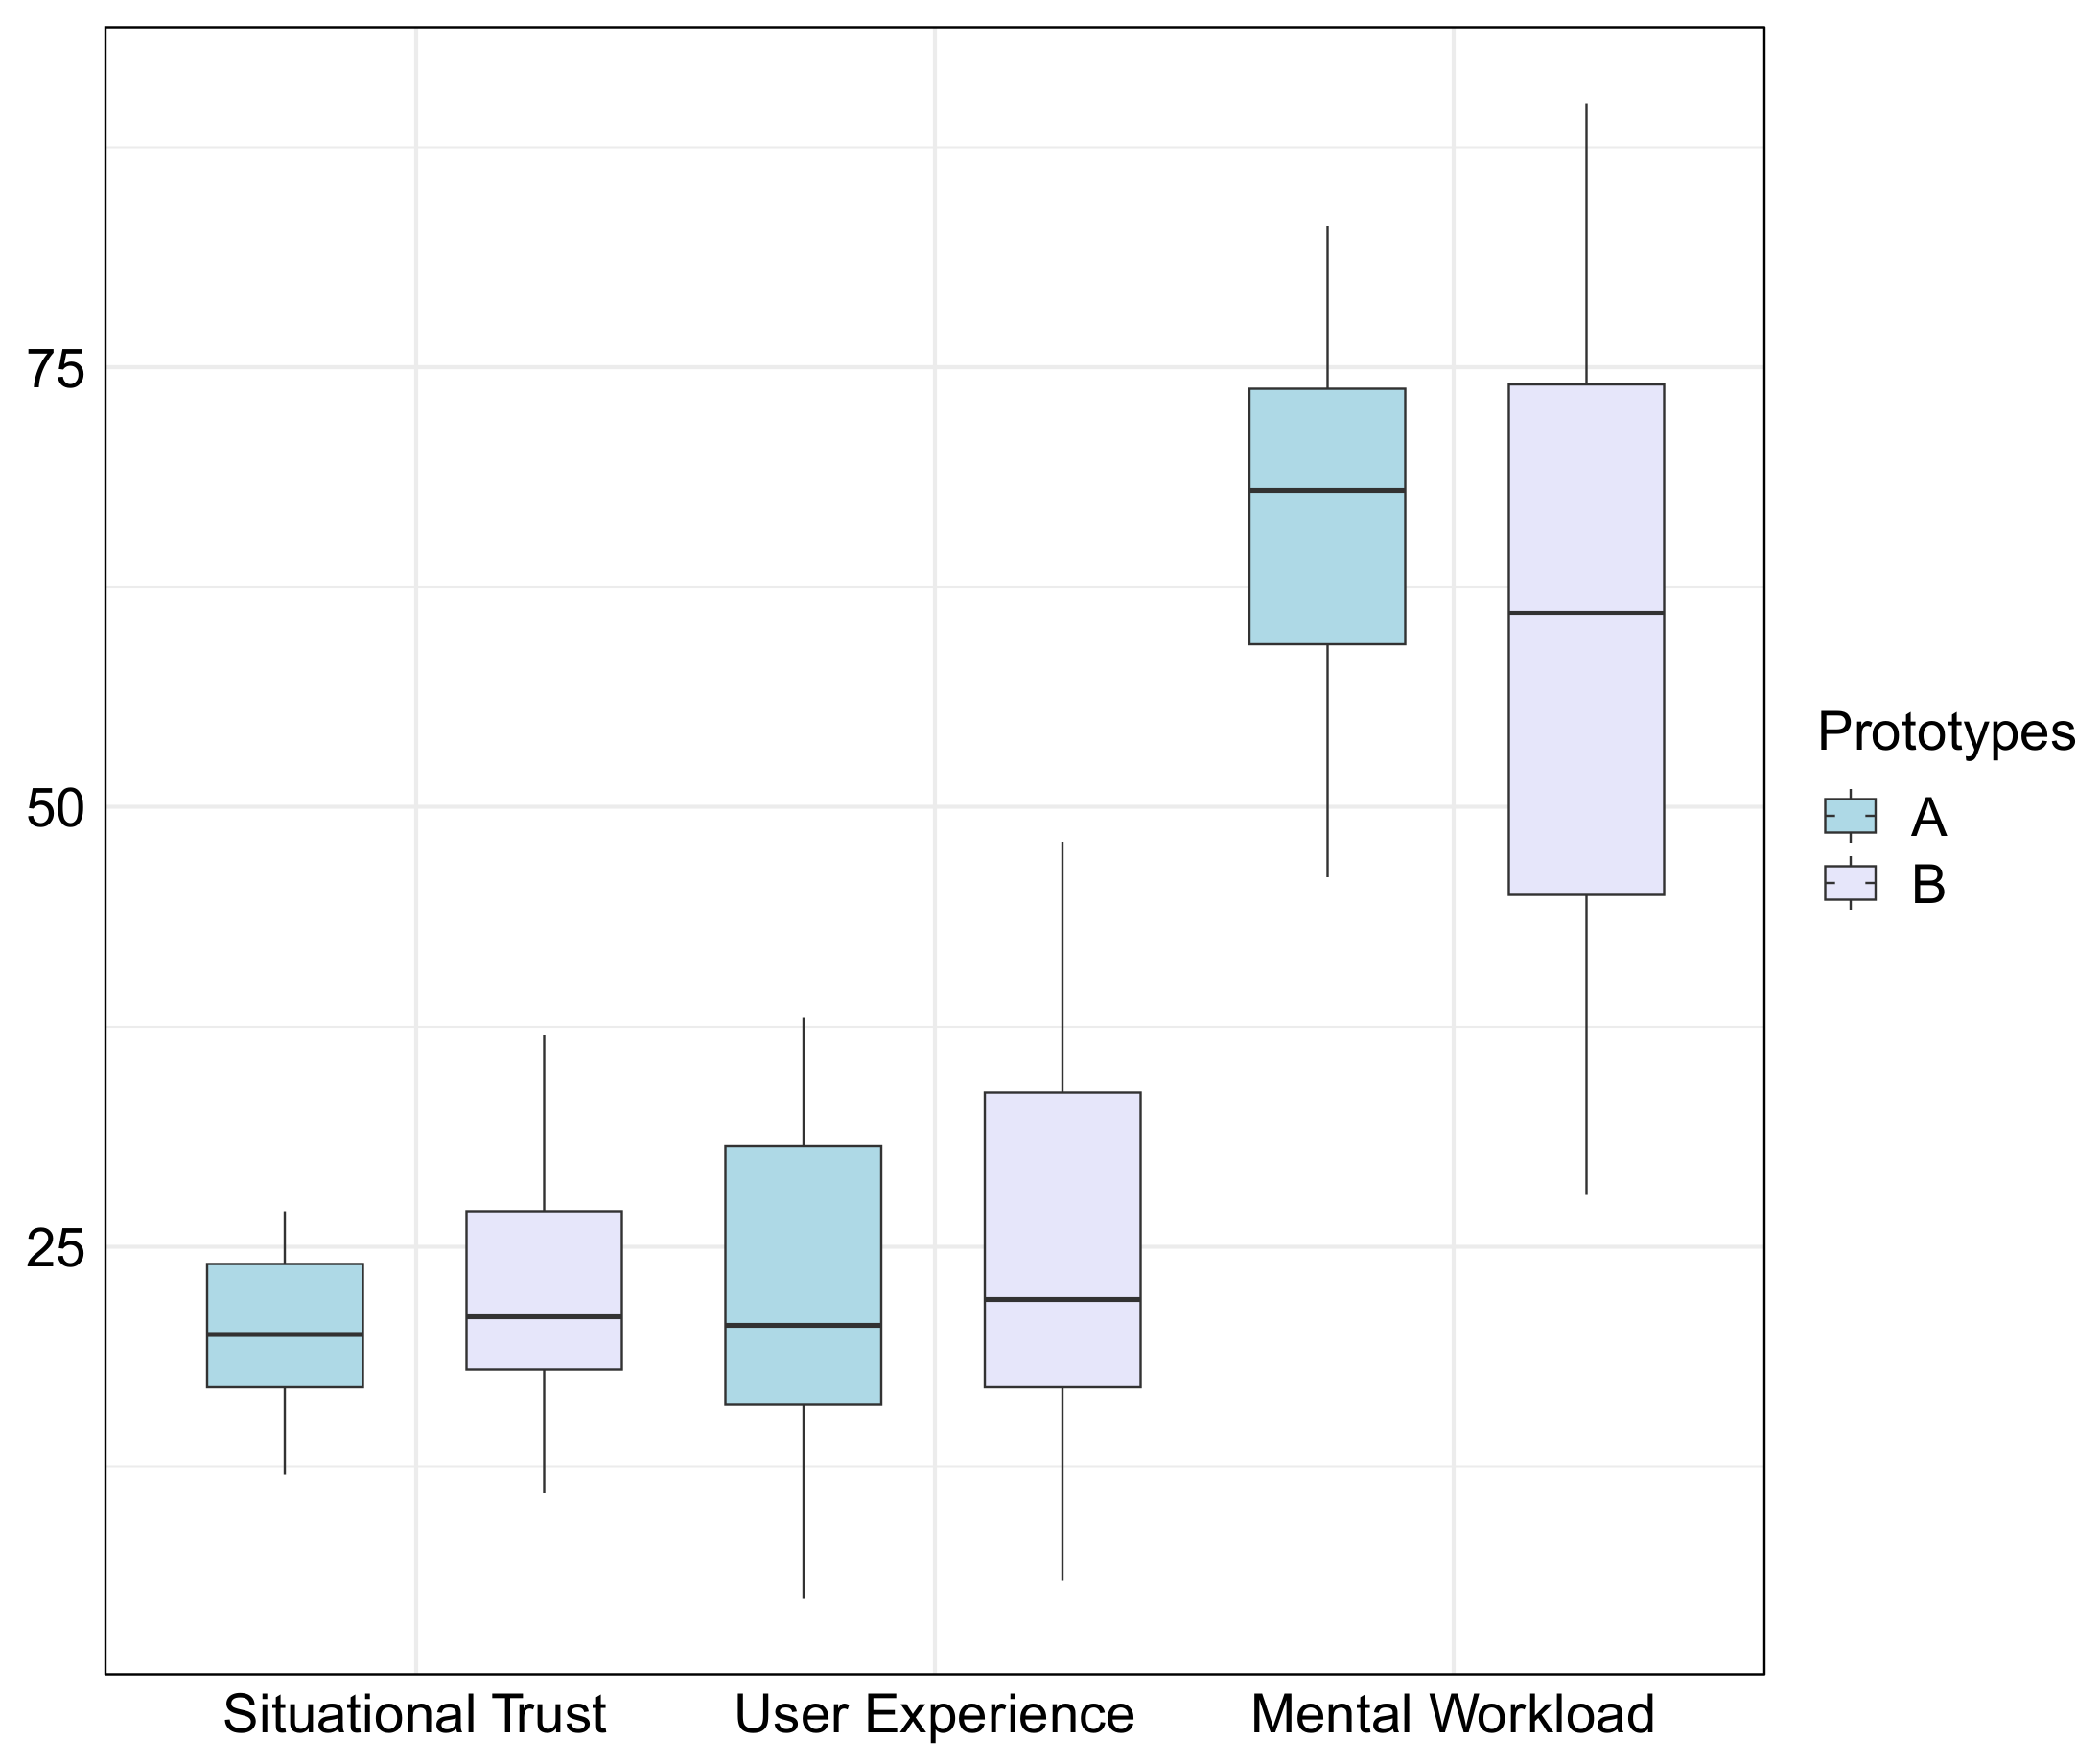
Situational Trust (B)-
Situational Trust (A)
UX (B)-UX (A)Mental Workload (B)-
Mental Workload (A)
Z−3.421 c−2.900 c−3.310 b
Asymptotic significance (two-tailed)<0.0010.004<0.001
Note: (a) Wilcoxon Signed Ranks Test based on (b) positive ranks and (c) negative ranks.
Table 3. Wilcoxon signed-ranks test statistics a for the objective evaluation of Experiment 1.
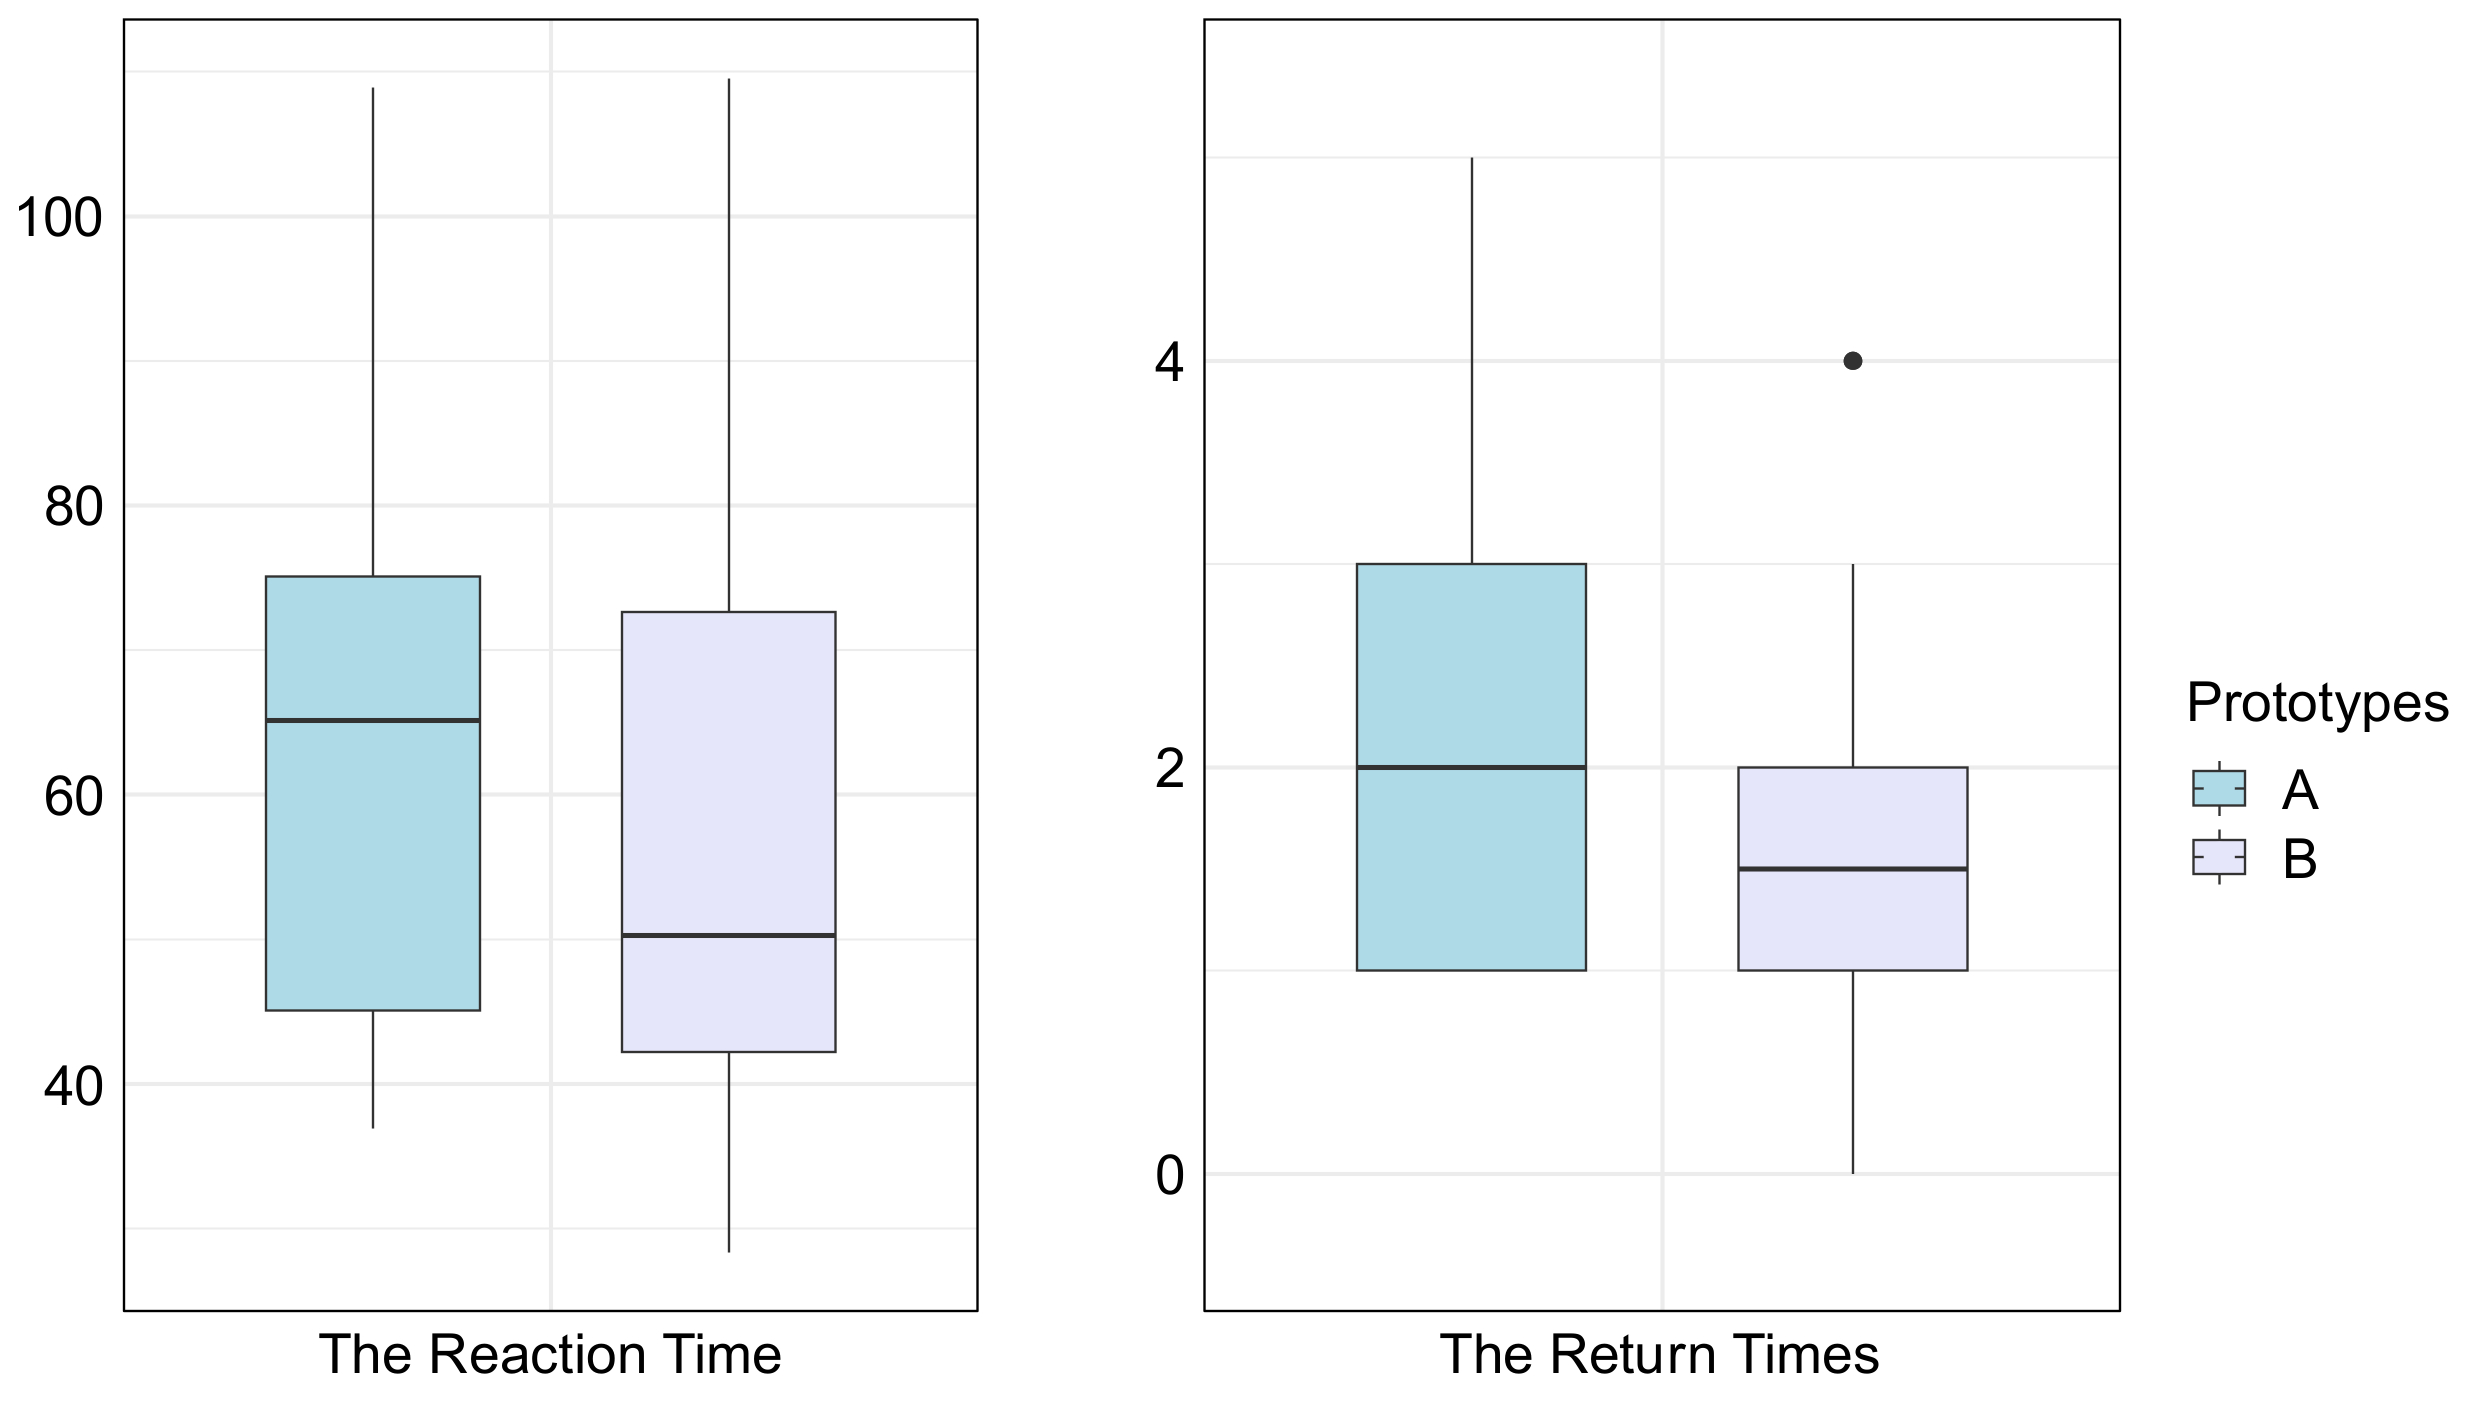
The Reaction Time (B)-The Reaction Time (A)The Return Times (B)-The Return Times (A)
Z−2.906 b−3.059 b
Asymptotic significance (two-tailed)0.0040.002
Note: (a) Wilcoxon Signed Ranks Test (b) based on positive ranks.
Table 4. Wilcoxon signed-ranks test statistics a for the results obtained for new users using Prototype A vs. Prototype B.
Situational Trust (B)-Situational Trust (A)Explanation Satisfaction (B)-Explanation Satisfaction (A)Mental Workload (B)-Mental Workload (A)
Z−2.631 c−5.786 c−3.075 b
Asymptotic significance (two-tailed)0.009<0.0010.002
Note: (a) Wilcoxon Signed Ranks Test; (b) based on positive ranks; (c) based on negative ranks.
Table 5. Wilcoxon signed-ranks test statistics a for the results obtained for frequent users in Prototype A vs. Prototype C.
Situational Trust (C)-Situational Trust (A)Explanation Satisfaction (C)-Explanation Satisfaction (A)Mental Workload (C)-Mental Workload (A)
Z−2.996 c−5.032 c−2.632 b
Asymptotic significance (two-tailed)0.003<0.0010.008
Note: (a) Wilcoxon Signed Ranks Test (b) based on positive ranks; (c) based on negative ranks.
Table 6. Wilcoxon signed-ranks test statistics a for the objective evaluation of Experiment 2.
The Reaction Time (B)-The Reaction time (A)The Reaction Time (C)-The Reaction Time (A)The Return Times (B)-
The Return Times (A)
The Return Times (C)-The Return Times (A)
Z−2.751 b−4.107 b−2.418 b−2.557 b
Asymptotic significance (two-tailed)0.006<0.0010.0160.011
Note: (a) Wilcoxon Signed Ranks Test (b) based on positive ranks.
Disclaimer/Publisher’s Note: The statements, opinions and data contained in all publications are solely those of the individual author(s) and contributor(s) and not of MDPI and/or the editor(s). MDPI and/or the editor(s) disclaim responsibility for any injury to people or property resulting from any ideas, methods, instructions or products referred to in the content.

