1. Introduction
According to the conclusions given in the “AR6 Synthesis Report: Climate Change 2023” [
1], global surface temperatures increased by 1.1 °C between 2011 and 2020 when compared to the period between 1850 and 1900. Furthermore, it is expected that global temperatures will continue to rise, exceeding the 1.5 °C threshold over the following two decades. The study emphasizes the relevance of global warming above the 1.5 °C threshold, stating that it will result in several climatic hazards affecting both natural and society systems. Furthermore, it warns that fragile ecosystems will undergo irreversible changes. Nonetheless, carbon dioxide emissions have been established as the principal cause of climate change. China, being the world’s leading developing country, is also the greatest emitter of carbon dioxide on a worldwide scale. According to He et al. [
2], China contributed around 27.3% of the total global carbon emissions in 2015, with a total of 9.15 billion tons. In light of the aforementioned circumstances, China has accepted its responsibility and pledged to work toward reaching the point of greatest carbon emissions by 2030, while also moving toward carbon neutrality by 2060 [
3].
The primary source of CO
2 is the utilization of fossil energy resources such as natural gas, crude oil, and coal [
4]. AlShafeey and Rashdan [
5] conducted a study that used data on U.S. energy consumption and greenhouse gas (GHG) emissions from 1965 to 2021. Their findings showed that a 25% increase in coal use corresponded to a 13% increase in GHG emissions. As a result, reducing the use of fossil fuels appears to be a critical strategy for reducing carbon dioxide emissions. Currently, multiple governments and institutions have put in place various steps to reduce the use of fossil fuels, particularly coal. These actions can be divided into two groups, one of which is the carbon tax. It was first observed in Finland in 1990, and it has since gained substantial popularity in a number of other countries. Another noteworthy market-oriented method is the implementation of permit trading programs such as an emissions trading scheme (ETS). The first described instrument is a price mechanism designed to stimulate the use of greener energy sources by imposing higher costs on the energy use of companies. The second instrument, on the other hand, is a market-based mechanism with greater implementation flexibility [
6]. The primary source of CO
2 emissions is the inefficient utilization of fundamental energy resources. Furthermore, the market is critical in determining how resources are allocated, thereby enhancing energy delivery efficiency. As a result, encouraging the market’s active participation in resource allocation is beneficial in reducing CO
2 emissions [
7].
The ECPT is a recently proposed market mechanism in China that aims to promote social energy saving. The concept was first introduced in September 2015 as part of the General Plan for the Reform of the Ecological Civilization System. The National Development and Reform Commission (NDRC) published the Pilot Scheme on Paid Use and Trading System of Energy Rights in July 2016. This initiative designated Zhejiang, Fujian, Henan, and Sichuan as pilot provinces, allowing the ECPT to be improved [
7].
Figure 1 shows the pilot areas of the ECPT.
The ECPT oversees the general energy consumption levels in several areas and provinces as well as setting particular energy consumption objectives for individual businesses. When an enterprise exceeds its specified energy consumption limit during the manufacturing process, it has the option of obtaining additional energy quotas from other enterprises in the market. Enterprises that own surplus energy quotas, on the other hand, have the option to sell these quotas in the market, generating financial gains. Nonetheless, this implies that enterprises producing energy-intensive items must obtain significant sums of energy-consumption allowances from the market. As a result, the cost of production will escalate, putting the firm at a disadvantage in terms of price competition. As a result, in order to reduce the production costs, firms may be forced to reduce their energy use or invest in technological improvements targeted at improving energy efficiency [
8].
Currently, there exists a body of scholarly research focused on the examination of the ECPT. Wang et al. [
8] employed provincial data from China spanning the years 2006 to 2010 to examine the potential benefits of an ECPT through the application of a counterfactual simulation methodology. The findings of their analysis indicated that the ECPT has promise in terms of fostering economic growth and facilitating energy conservation. Yu et al. [
9] conducted simulations of actual trade situations to assess the cost differences between the ETS and ECPT. The findings of their analysis demonstrate that, within the same environmental context, the ECPT offers more cost savings compared to ETS. Zhang et al. [
10] conducted an investigation into the effects of the ECPT on energy consumption, energy intensity, and the underlying mechanisms. The study utilized data spanning the years 2016 to 2019. The findings of the study demonstrated that the implementation of the ECPT led to an average reduction in energy consumption of 43 Mtce in the pilot provinces. Presently, the scholarly investigation of the ECPT predominantly centers on energy intensity, potential gains, and economic advantages, while there is a dearth of research on the environmental benefits, influence processes, and heterogeneity of the ECPT. This research aims to assess the ECPT policy on CEP and the underlying mechanisms. The analysis employed a difference-in-differences (DID) approach, utilizing data from 28 provinces spanning the period from 2006 to 2020.
The primary contributions of this research article are outlined below. This paper utilized a DID methodology to evaluate the effects of the ECPT on CEP, specifically focusing on environmental pollution, enriching the existing research on the ECPT. Additionally, the current literature has predominantly employed static indicators such as carbon emission intensity and carbon emission footprint for carbon emission measurement, neglecting the influence of factors such as economic development and technological innovation on carbon emissions. Therefore, this paper aimed to comprehensively examine these factors. This paper also aimed to provide a comprehensive analysis of various factors such as economic development, labor, and capital, in relation to carbon emission production efficiency. The methodology employed in this study was based on Chen [
11] approach and utilized the SBM model, which incorporates non-expected output. Additionally, a Malmquist CEP index was constructed using the distance function of the production technology frontier, allowing for the examination of dynamic changes. Furthermore, this paper investigated the underlying mechanisms of the ECPT and explored the mediating effects of the energy consumption structure and technological innovation. The findings of this study can potentially offer valuable insights for developing countries seeking to promote the ECPT and achieve sustainable development. This research aims to elucidate the transmission mechanism of the ECPT, examine the mediating role of energy consumption structure and technological innovation, and offer significant insights for emerging nations seeking to foster the advancement of the ECPT.
The scholarly work conducted by Du et al. [
7] examined the influence of the ECPT on carbon emissions. Nevertheless, this paper introduces novel ideas and advancements built upon this foundation. Firstly, this paper applied the Super-SBM method containing non-expected outputs and the Malmquist index to measure the CEP. Compared with Du et al.’s estimation of carbon emission efficiency by constructing a stochastic boundary analysis model with the super logarithmic function as the equation, this paper’s measurement method can avoid the structural bias due to the mis-setting of the production function. Secondly, this paper argues that the ECPT can enhance CEP through optimizing the energy consumption structure and technological innovation, while Du et al. argued that the ECPT could enhance carbon emission efficiency through green technological innovation, reducing energy misallocation and optimizing the urban transportation network. Finally, this paper explores the heterogeneity of the impact of the ECPT on CEP from three perspectives, namely, regional location, level of green finance development, and environmental regulation intensity, which is different to the traditional perspective of regional and resource endowment by Du et al. Compared with Du et al.’s analysis from the traditional regional and resource endowment perspectives, this paper is more comprehensive and novel in its considerations.
The ensuing sections of the paper are organized in the following manner.
Section 2 provides a detailed account of the implementation process of the ECPT.
Section 3 critically examines the existing body of literature and subsequently formulates the research hypotheses. In
Section 4, the technique, variables, and data are outlined.
Section 5 of the study presents the baseline data, robustness testing, mechanism analysis, and heterogeneity analysis.
Section 6 of the document presents a comprehensive conclusion and offers policy recommendations.
2. Institutional Background
As its effects continue to worsen, global warming has become one of the most pressing sustainability challenges facing modern society. The main reason for this problem is energy consumption, as mentioned earlier. In light of the current climate catastrophe, numerous actions are being taken by various groups and governments. Resolving this issue can be achieved by optimizing our energy utilization. Things are looking bleak for the world’s energy usage right now: there was a 1% rise in worldwide energy demand in the preceding year, according to the 2023 Statistical Review of World Energy. Even if renewable energy is on the rise, fossil fuels still account for 82% of the world’s energy. Therefore, national efforts are focused on making the energy transition, reducing the energy intensity, and improving the efficiency of energy consumption. There is a wide variety of energy policies and plans that governments have put in place at the moment. As an example, in 2019, the EU unveiled the European Green Deal, a set of policies meant to promote long-term economic growth using renewable energy sources and other initiatives. The U.S. has also implemented a renewable energy quota system at the state level since 2005. Under this system, every state is required to make sure that a certain percentage of the power that goes into their grid comes from renewable sources and to push for the greater use of renewable energy in general.
China has implemented a range of actions. The ETS and the ECPT are two prominent energy programs in China. Both methods are efficacious in achieving energy conservation and emissions reduction, although they do exhibit certain distinctions. The ETS and ECPT are under the jurisdiction of separate authorities. The ETS is overseen by the Department of Industry and Information Technology, whilst the ECPT is overseen by the Department of Ecology and Environment [
12]. The ETS is a direct method of controlling the concentration of greenhouse gases in the atmosphere. It involves trading emission targets based on actual emissions to achieve the emissions reduction goals of enterprises and the state. This approach reflects the characteristics of end control. On the other hand, the ECPT focuses on optimizing energy use and indirectly reducing greenhouse gases. It achieves this by improving the energy structure and enhancing energy efficiency. The ECPT exhibits the characteristics of source control. Although the subjects of their transactions may differ, there can be some overlap, and Zhang et al. [
13] showed that combining an ETS and ECPT could lead to increased potential outputs and energy savings.
The ECPT can be described as an environmental regulatory strategy that prioritizes market-based approaches to energy allocation. Its main objective is to decrease energy intensity and improve energy efficiency. Firstly, based on the objective of regulating overall energy consumption in accordance with state regulations, the pilot provinces establish the initial energy consumption quota for firms based on their specific industrial structure, socio-economic development level, resource endowment, and other relevant variables. In the context of energy consumption quota control, energy-saving firms can generate profits by trading energy consumption quotas, whereas energy-intensive enterprises may have elevated production costs as a result of procuring a substantial quantity of energy consumption quotas. Enterprises, acting as rational economic agents, will opt to decrease their energy consumption or engage in technological advancements in order to pursue their objective of maximizing profits [
8]. Secondly, the ECPT helps bring down the costs of lowering coal capacity. In order to move away from coal and toward other energy sources, it is essential to reduce coal production. Losses to overall well-being occur as a consequence of the costs associated with ensuring compliance during the process of reducing capacity. The high-efficiency coal industry has an opportunity to buy energy quotas and increase production through the introduction of an ECPT. Concurrently, it allows inefficient coal businesses to reduce output and sell energy quotas to make money. This method improves industrial productivity by allowing inefficient businesses to shift their production capacity to more efficient ones. This promotes a general decrease in production in the coal industry while simultaneously lowering the production costs, increasing revenue, and compensating for losses caused by reducing the production capacity.
Since 2017, four pilot provinces have gradually started the pilot implementation of the ECPT. Zhejiang Province took the lead in launching the ECPT by issuing the Implementation Plan for Pilot Work on the Scheme on Paid Use and Trading System of Energy Rights in Zhejiang Province in 2018 and officially launching market trading on 26 December 2019; Fujian Province took the lead in carrying out the ECPT in two industries, namely, cement and thermal power, in 2017, and formally launched trading on 19 December 2018; Henan Province identified the first batch of three industries, namely, iron, steel, cement and paper-making industries, and announced the list of 110 key energy-using firms included in the first batch of the ECPT. Henan Province and Sichuan Province officially launched transactions on 22 December 2019 and 26 September 2019, respectively.
At present, all four provinces have achieved certain success. In terms of energy-consumption rights transactions in Zhejiang Province, the total number of transactions for the whole year of 2022 was 70, with a significant increase in the number of transactions compared to 12 last year, and the amount of a single transaction ranged from 325.5 tons of standard coal to 339,250.43 tons of standard coal. In Fujian Province, the number of transactions for the whole year of 2022 was 1,237,200 tons of standard coal, and the transaction amount was CNY 18,396,000. However, transactions in Sichuan and Henan Provinces are not active and lack public information.
3. Literature Review and Research Hypotheses
3.1. Literature Review
3.1.1. Carbon Emission Performance (CEP)
Currently, research on carbon emissions can be divided into two categories: carbon emission intensity and CEP. In contrast to the intensity of CO
2 emissions, the performance of CO
2 emissions is determined by a variety of factors including economic development, energy, capital, and labor input, and economic output. The measurement procedure stresses its “total factor” properties, showing a level of input–output efficiency [
14]. Consequently, this paper employed the CEP as a metric to quantify the magnitude of carbon emissions.
Existing studies on the factors of CEP can be loosely categorized into three key categories: demographic dynamics, economic advancement, and technological advancements [
11]. To begin, it is critical to recognize that population has a significant impact on the CEP The phenomenon, known as the population agglomeration effect, has the ability to increase factor productivity, hence contributing to the CEP [
15]. Furthermore, academics generally agree that there is a favorable relationship between economic progress and the potential for improved CEP. Wang et al. [
16] examined the CEP of 61 cities in the Yangtze River City region using a spatial autoregressive model (SAR). The results showed a statistically significant positive affect on PGDP at the 1% level. The study found that increasing pgdp growth resulted in an average 2.2% increase in carbon emission efficiency. It is worth noting that the interaction between foreign direct investment (FDI) and industrialization, both of which are acknowledged as important drivers of economic growth, has a significant impact on the CEP. Song et al. [
17] investigated the impact of foreign direct investment (FDI) on the CEP using a two-tier stochastic frontier model. According to the research, FDI has the ability to increase the CEP by 6.63% on average. Lv et al. [
18] used the Tobit model to investigate the drivers of CEP in their study. Industrialization and CEP were positively associated at a 1% significance level. Finally, R&D investment has the potential to stimulate technological improvements, hence positively improving the CEP enhancement. Fang et al. [
19] used the spatial Durbin error model to examine the factors of carbon emission efficiency in 282 Chinese cities. With a significance threshold of 1%, their findings showed a statistically significant positive link between R&D investment and carbon emission efficiency. Since Zhou et al. [
20] pioneered the application of DEA to study energy and environmental challenges, the DEA model has become the primary tool for measuring the CEP. Zhou et al. [
21] undertook a thorough evaluation of the literature in this area. The studies can be divided into two categories. The first group focuses on measuring radial distance functions like CCR and CCF [
22,
23,
24]; the second group examines the problem from a non-radial perspective like the SBM model [
25,
26,
27]. The second source provides information about the effectiveness of specific inputs in comparison to the former. This allows for the identification of specific inputs that may be handled and improves the efficiency of the unit under consideration [
28]. Nonetheless, one significant limitation of the aforementioned studies is their proclivity to analyze carbon dioxide emission performance using cross-sectional data analysis rather than considering the temporal element. In light, of this, Zhou et al. [
29] proposed using a Malmquist CO
2 emission performance index (MCPI), which measures the total CEP across time. The Malmquist index, which is based on the DEA, is commonly used to analyze changes in production performance. The index’s use enables for the analysis and comparison of DEA outcomes [
30]. Furthermore, the index’s deconstruction allows for the identification of the numerous elements that drive variations in performance. Zhang and Choi [
31] developed a meta frontier non-radial Malmquist CO
2 emission performance indicator (MNMCPI) to examine the temporal fluctuations in China’s fossil-fuel-fired power stations’ CEP from 2005 to 2010.
3.1.2. Energy-Consumption Permit Trading Scheme (ECPT)
To attain carbon peaking, nations are actively seeking mechanisms to conserve energy and mitigate emissions. Market-oriented environmental regulation policies have been widely used in various countries and have gradually replaced the traditional aggregate and control policies [
10]. Currently, tradable energy consumption policies such as the white certificate system (WCS) is receiving attention in many countries. The WCS involves the government setting energy-saving goals for businesses and awarding white certifications to energy-saving entities after their performance is evaluated by third-party energy-saving testing organizations [
32]. The WCSs are a fungible asset. Enterprises that do not achieve their energy-saving goals might evade penalties by acquiring certificates from enterprises that have surpassed their goals [
33]. WCSs have been widely used in Europe after being practiced in the U.S [
34]. WCSs have been proven to be a tool that can realize economic and environmental benefits at the same time. Stede [
35] found that a WCS could save 3.2 Mtoe of energy, about 2% of Italy’s primary energy; Mundaca [
36] evaluated the impact of the WCS in Europe and found that a WCS could save 32% of social costs and save two hundred metric tons of greenhouse gases.
Similar to the WCS, China has proposed the ECPT. The WCS and ECPT share a connection while also exhibiting distinct characteristics. Both are fungible assets, having legally recognized ownership that can be exchanged in the marketplace and can be tracked [
10,
35]. Both approaches can effectively achieve the goal of conserving energy and lowering emissions by enhancing the energy efficiency of businesses and minimizing expenses associated with energy conservation through market-based transactions. Nevertheless, there exist disparities between the two. The WCS mandates the minimum threshold for energy conservation that firms must achieve [
36], whereas the ECPT establishes the upper limit for energy use by enterprises.
Presently, there exists a limited body of research on the ECPT. However, a majority of scholars have substantiated the efficacy of the ECPT in enhancing energy consumption efficiency and mitigating energy intensity. Zhang et al. [
10] conducted a study utilizing PSM-DID modeling techniques. Their findings indicated that the energy intensity of the pilot provinces had a notable reduction of around 13% between 2016 and 2019. This outcome provides empirical evidence supporting the significant negative impact of the ECPT on energy intensity. Che and Wang [
37] arrived at a similar finding, namely that the implementation of the ECPT led to an average reduction of 10.42% in energy consumption and an average decrease of 5.18% in energy intensity. Additionally, they observed significant spatial spillover effects and regional disparities associated with the ECPT, with the long-term policy impact being more pronounced than the short-term effect. Wang et al. [
8] analyzed the potential benefits of the Spatial Tradable Energy Quota Permit (SET) and the Spatial and Temporal Tradable Energy Quota Permit (STET) schemes using a nonparametric optimization model. The results demonstrate that maximum average potential energy savings of 1.213% can be achieved by using the STET.
However, studies on the ECPT have paid little attention to carbon emissions, even though they are an important part of reaching carbon neutrality targets. At the moment, only a small group of academics are looking at how the ECPT affects carbon emissions. Du et al. [
7] employed the DID methodology to investigate the effects of pilot policies implemented by the ECPT on carbon emission efficiency (CEE). Their findings indicated that the adoption of the ECPT had a noteworthy impact on enhancing CEE. Specifically, the introduction of the ECPT led to a 5.8% rise in the CEE of the pilot provinces. Furthermore, this effect was observed to persist for approximately three years. This work aims to delve deeper into the impact of the ECPT on the CEP, building upon the research conducted by Du et al. [
7].
In relation to the mechanisms by which the ECPT influences the CEP and the determinants of variations in this impact, it is pertinent to consult the existing literature on emissions trading systems (ETSs). Shao et al. [
38] employed the mediated effect model to investigate the mechanisms by which an ETS influences provincial atmospheric pollution. The findings of their analysis indicated a statistically significant impact of an ETS on the configuration of energy consumption at a significance level of 1%. Hu et al. [
39] conducted a study using the SFA model and found that an ETS significantly promoted technological progress at the 5% level, thus promoting energy conservation and emissions reduction. Furthermore, researchers have discovered that there exists variability in the influence of an ETS on carbon emissions. The effectiveness of emissions trading systems (ETSs) is positively correlated with the presence of stringent rules, well-established infrastructure, and advanced environmental frameworks inside urban areas [
40,
41]. Nevertheless, the impact of an ETS in economically advanced areas is expected to be mitigated due to their heavy dependence on fossil fuels for sustaining economic progress [
42].
3.2. Research Hypotheses
Economic development will inevitably produce large amounts of carbon dioxide (i.e., negative externalities of industrial development), and enterprises, in order to maximize their personal interests, will also maximize the use of public resources and carry out unlimited emissions. There are two main ways to address negative economic externalities: one is the “Pegu tax”, and the other is the definition of property rights based on the Coase theorem.
The ECPT is based on Coase’s theory of property rights. According to Coase’s theory [
43], the market mechanism can optimize resource allocation when property rights are well-defined. In addition to clarifying producer energy-consumption quotas, which allow producers to freely trade quotas on the grounds of controlling the overall amount of energy, the ECPT establishes the property rights features of energy-consumption rights through the energy management department. Assuming that the total energy consumption stays constant, energy consumption quotas turn into a type of scarce resource, and market trading allows for efficient allocation. Businesses that consume more energy than that allotted can purchase quotas from other businesses, and businesses that have excess energy can sell their quotas to other businesses for a profit. This reduces the negative externalities associated with economic development and achieves Pareto optimality.
Furthermore, the ECPT is fundamentally an environmental control strategy based on market incentives. This policy has the ability to limit businesses’ limitless energy usage. This is due to the fact that the ECPT will fortify government oversight of businesses’ energy usage and do away with excessive energy consumption. Businesses who go above their quotas also have to buy more energy quotas, which will surely result in higher external operating costs. Businesses may see an increase in their production expenses as a result of environmental costs [
44]. Therefore, with the implementation of the ECPT, the market demand for green products and environmentally friendly enterprises will increase. Enterprises will tend to develop green technologies and reduce their energy use in order to improve market competitiveness, thus reducing carbon emissions. Thus, the hypothesis is proposed as follows.
H1: The ECPT can enhance CEP.
The ECPT can optimize the energy structure. First, the ECPT imposes a maximum limit on energy consumption, prompting firms to reallocate resources toward enhancing energy efficiency in order to minimize the costs associated with acquiring energy quotas [
45]. This, in turn, leads to a reduction in overall energy usage. Furthermore, the establishment of a regulatory framework that supports the transition to clean energy is facilitated by the implementation of clear and uniform environmental legislation, which reduces the investment risks. Such rules provide stability and confidence to energy industry enterprises and investors, making it more conducive to the development of renewable energy projects. Thus, these policies encourage private investment and propel the expansion of the renewable energy sector [
46]. Furthermore, the energy composition of firms is expected to undergo modifications as a result of heightened environmental regulations. These changes will involve a decrease in coal consumption and a corresponding increase in the utilization of oil and natural gas. Additionally, firms will be incentivized to adopt technological innovations that enable the substitution of labor with capital. These combined measures are anticipated to promote the adoption of environmentally friendly energy sources [
45,
47].
In the past few years, the utilization of fossil fuels, particularly coal, has played a pivotal role in China’s economic progress and has become a substantial contributor to the nation’s energy consumption [
48]. However, it is important to note that fossil fuel usage remains the predominant contributor to China’s CO
2 emissions. The carbon emissions of a nation tend to rise in correlation with the percentage of fossil fuels utilized in its energy consumption framework [
49]. Therefore, implementing strategies to use less fossil fuels, promoting the progress of clean energy technologies and renewable resources, and optimizing energy consumption patterns are all imperative actions in mitigating carbon emissions.
A considerable body of scholarly research has substantiated the efficacy of enhancing the framework of energy usage as a viable approach to mitigating carbon emissions. Xiao et al. [
50] investigated the determinants of CEP using the Tobit model. The results showed that the CEP was significantly improved by 14.21% for every 1% increase in the proportion of renewable resources. In addition, at the 1% level of significance, the data showed that renewable resources were positively associated with the CEP. Wang and Ma [
51] used the Tobit model to look at what factors in Jiangsu Province caused the CEP. Their results showed that at the 5% level of significance, there was a negative correlation between coal consumption share and CEP. Sun and Huang [
52] found that the carbon emission efficiency decreased when coal usage as a percentage of overall energy consumption rose. Their research showed that carbon emission efficiency dropped by 16.71% for every 1% increase in coal usage. Thus, the hypothesis is formulated as follows.
H2: Through energy consumption structure optimization, an ECPT can enhance the CEP. According to Porter’s hypothesis, environmental regulation generates external pressures. Effective and efficient laws can minimize carbon dioxide emissions by forcing firms to comply with environmental regulations [
53]
. This is because strict environmental policies force firms to pay compliance costs. However, the benefits of innovation can offset the qualifying costs or even exceed them, giving companies a profit and, to a certain extent, a definite advantage over foreign companies that are not subject to similar regulations. Therefore, in order to save money and comply with the ECPT, businesses will, on the one hand, use less energy and emit fewer carbon emissions. On the other hand, because they are rational agents seeking to maximize profits, businesses will use technological innovation to their advantage and become more competitive. Presently, many scholars have employed diverse methodologies to substantiate the efficacy of technological innovation in augmenting the CEP. Wang and Zhao [
54] employed the Tobit model to investigate the determinants of CEP. The findings of their analysis indicated that technological innovation could improve the CEP statistically, with a significance level of 1%. Zhou et al. [
55] employed the industrial GVAR model to examine the underlying factors influencing intrinsic carbon emission efficiency. Their findings indicated that, over an extended period, a 1% increase in technical advancement led to a 3.14% enhancement in carbon emission efficiency. The study conducted by Li et al. [
56] provides evidence that the enhancement observed in the meta frontier total factor CEP index (NMTCPI) within the construction industry throughout 30 provinces in China, spanning the period from 2004 to 2017, can mostly be attributable to advancements in technology.
Technological innovation has the potential to improve the CEP through three distinct pathways. Firstly, it can enhance energy usage efficiency, resulting in reduced energy consumption per unit of production and consequently improving the CEP [
57]. Secondly, technological innovation can address provincial energy allocation distortions, leading to improved economic output, enhanced energy efficiency, and ultimately better CEP [
58]. Thirdly, the advancement of technology contributes to the expansion of renewable energy capacity, consequently bolstering the overall availability of renewable energy. This, in turn, facilitates the optimization of the energy framework, mitigates unforeseen energy shortfalls, and improves the performance of carbon emissions [
59]. Consequently, the following hypothesis is posited.
H3: Through technological innovation, the ECPT can enhance the CEP.
4. Model, Variables, and Data
4.1. Model
4.1.1. Super-SBM Model
In this investigation, the CEP was evaluated using a novel method that combined the Super-SBM model and the Malmquist index. The selection of these methodologies was informed by a comprehensive examination of the relevant literature. In this study, the carbon emission efficiency was assessed using the Super-SBM model, which adds non-expected outputs. The provided information is outlined in the following manner.
Let us consider a scenario where there exists a set of decision-making units denoted by ‘
n’. Each of these units is comprised of three distinct components, namely inputs, expected outputs, and non-expected outputs. Each of these components is represented by a vector and can be described as follows:
where
is the input matrix;
is the expected output matrix;
n is the input type; R is the input–output matrix of the m decision units. These three matrices are all greater than 0. The model is as follows:
In this context, the variables n, s, and t represent the number of decision-making units, the number of inputs, and the number of outputs, respectively. The variables x and y are indicator vectors that represent the inputs and outputs, while μ denotes the weight vector. Additionally, ρ represents the carbon emission efficiency. When ρ is less than 1, it signifies that the carbon emission efficiency is relatively low. Conversely, when ρ is greater than or equal to 1, it shows that the carbon emission efficiency has achieved a relatively high level. Moreover, a higher value of ρ corresponds to a higher level of carbon emission efficiency.
4.1.2. Malmquist Index
Additionally, the Malmquist index can be created using the distance function of the production frontier to analyze the dynamic changes. The index with constant returns to scale can be decomposed into EC efficiency and TC technology changes using the following formula.
4.1.3. DID Model
The introduction of the DID methodology to the field of economics may be attributed to Ashenfelter in 1978. Since its inception, DID has gained significant prominence as a widely utilized approach for evaluating policy impacts in contemporary times. In contrast to static statistical methods like the difference method, the difference-in-differences (DID) approach utilizes individual-level data and assesses the impact of policy implementation by examining statistical significance. This approach effectively addresses the issue of “pseudo-correlation” that may arise when comparing outcomes before and after policy implementation. Furthermore, the DID method can successfully address the issue of interaction between explained and explanatory variables, hence mitigating the problem of endogeneity. To validate Hypothesis 1, which examines the impact of the ECPT on CEP, we propose a DID model represented by Equation (1):
where “
i” and “
t” represent the province and year, respectively, and “
” represents the CEP of province “
i” in year “
t”.
is a binary indicator that takes the value of 1 if province
i belongs to the group of pilot provinces (namely Zhejiang, Henan, Fujian, and Sichuan), and 0 otherwise. Similarly,
is a binary indicator that takes the value of 1 if the year t is greater than or equal to 2017, and 0 otherwise. This article considered 2017 as the initial year in which the pilot provinces were impacted by the ECPT, despite the policy being established in 2016 and subsequently put into practice. The term “Control” is used to describe a group of variables that can be adjusted to affect how well carbon emissions are managed. These factors include gross domestic product per capita (PGDP), population density (PD), science and technology investment (IST), industrialization (INDU), and openness (FDI). Province fixed effects are denoted by
, and time fixed effects by
. The standard error term,
, is assumed to have a zero-mean, constant-variance normal distribution.
In order to confirm Hypotheses 2 and 3 while avoiding the endogeneity problem of the traditional three-step approach, this paper used the mediating effect of the two-step approach of Jiang [
60] to analyze:
where
and
denote the energy consumption structure (ES) and technological innovation (TI), respectively.
4.2. Variables
4.2.1. Explained Variable
The explained variable is carbon emission performance (CEP). The measurement of CEP was initially conducted using the Super-SBM model, which incorporates non-expected outputs in order to assess the carbon emission efficiency. The Super-SBM model incorporates non-expected outputs and encompasses three input variables: labor input, which is quantified by the number of laborers; capital input, which is defined by the investment in fixed assets across the entire society; and energy input, which is assessed based on the total energy consumption. The anticipated outcome pertains to the advancement of the economy, as quantified by the GDP. The unexpected outcome refers to the release of carbon dioxide, which is quantified by the aggregate amount of carbon emissions.
Additionally, utilizing the distance function of the production frontier, it is possible to develop a Malmquist index in order to assess the dynamic alterations in carbon emission performance.
Figure 2 shows the result of this:
4.2.2. Explanatory Variable
The explanatory variable is the DID. The DID refers to the product of the area dummy variables and (i.e., DID is 1 if province i is a pilot province for the ECPT and t is greater than or equal to 1, and 0 otherwise).
4.2.3. Control Variables
The control variables that were selected are as follows. Per capita gross domestic product (PGDP) is a useful indicator for assessing the extent of economic development. Cities that exhibit greater economic development typically possess a larger industrial scale and consume higher amounts of energy. Energy consumption, in turn, serves as the primary driver of industrial carbon emissions. Therefore, economic development directly contributes to the rise in carbon dioxide emissions [
54]. Foreign direct investment (FDI) is quantified as the ratio of the total foreign direct investment to the provincial GDP. FDI has a double impact on CO
2. FDI can lead to the relocation of pollution-intensive sectors to the home nation, effectively making it a safe haven for such industries [
61]. Conversely, foreign direct investment (FDI) inflows streamline and decreases the expense of obtaining overseas funds, which can be utilized for research and development in advanced clean technologies [
62] The degree of industrialization (INDU) is quantified by the proportion of value added by the secondary sector in the gross provincial product. Industrialization has a double effect on CO
2 emissions. Industrialization can facilitate economic activity that results in elevated levels of CO
2 emissions. Conversely, industrialization will optimize the utilization of urban infrastructure and industrial concentration, resulting in a decrease in CO
2 emissions [
63]. Population density (PD) is quantified as the number of individuals per square kilometer of land area. Provinces with higher population densities typically exhibit a more pronounced need for energy, resulting in increased energy consumption and carbon emissions [
37]. The measurement of the impact of science and technology (IST) is based on the amount of money the government spends on scientific research. By increasing investment in science and technology, we can encourage the advancement of clean energy and renewable resources, which is crucial in reducing CO
2 emissions [
64].
4.2.4. Mediating Variable
The intermediate variables are the energy consumption structure (ES) and technological innovation (TI). The measurement of energy consumption structure (ES) involves assessing the proportion of coal use in relation to the overall energy consumption. Encouraging the transition of energy systems and promoting the use of natural gas and renewable energy sources can effectively reduce CO
2 emissions both in the short- and long-term. China’s recent surge in investment in renewable energy has effectively diminished the reliance on fossil fuels, hence enhancing the efficiency of energy consumption and mitigating the growth of carbon emissions [
48]. The quantification of technological innovation (TI) is conducted by the assessment of the quantity of green patents that have been awarded [
65]. The fundamental endeavor to alleviate global warming is technological innovation. Technological innovation at the production level can transition the economy from a production-centric paradigm to an innovation-centric model, thereby decreasing carbon dioxide emissions resulting from corporate output. Technological innovation at the energy level enhances energy efficiency and minimizes energy wastage.
4.3. Data
To conduct a thorough analysis of the influence of the ECPT on CEP, this study established a panel dataset comprising 28 provinces excluding Tibet, Hainan, and Ningxia for the period spanning 2006 to 2020. The dataset encompasses variables related to energy consumption, carbon emission, and socio-economic factors. The “China Statistical Yearbook” for the years 2007 to 2021 and the statistical yearbooks of each province provided the bulk of the raw data for the pertinent indicators.
Table 1 displays the descriptive statistics for all variables:
5. Empirical Results
5.1. Correlation Coefficient Matrix
Prior to conducting the regression analysis, a Pearson correlation coefficient matrix was initially performed. The results showed a strong positive association between the DID and CEP, which is consistent with the hypothesis. In addition, PGDP and FDI, two of the control variables, showed statistically significant relationships with CEP at the 5% level of significance. Nevertheless, it is crucial to exercise caution when interpreting these findings. Without taking into consideration potential confounding factors like control variables and latent variables (such as time effects and individual effects), the correlation coefficient matrix only records the relationship between the bivariate variables. Consequently, these findings should be interpreted as preliminary, and additional regression studies are required to determine the precise association. Furthermore, we can rule out the possibility of covariate covariance by evaluating the correlation coefficients between the variables, and checking whether or not their absolute values are greater than 0.9.
Table 2 shows correlation coefficient matrix.
5.2. Baseline Regression
The provided information presents the outcomes of the baseline regression analysis, which aims to estimate the influence of the ECPT on CEP. The estimation was conducted using the DID approach. The mixed model is displayed in column (1). The results in column (2) present the findings obtained from the regression analyses that incorporate the province fixed effects as control variables. The third column presents the outcomes obtained from regression analyses that incorporate controls for fixed variables at the province and year levels.
According to the data presented in
Table 3 at the 1% level of significance, it is clear that the CEP had a statistically significant positive correlation with the ECPT used in regression (2). The policy effect caused a 0.045 unit rise in the CEP on average, as indicated by the coefficient value of 0.045. An additional positive association with the CEP at the 5% significance level is also shown by regression (3). This provides strong evidence that the adoption of the ECPT policy significantly improved the CEP. Therefore, we can say that Hypothesis H1 is correct. Not only that, but the equation’s R-squared value was higher than 0.5, which means the model fit well and had a lot of explanatory power.
5.3. Common Trend Test and Dynamic Analysis
A crucial precondition that must be satisfied for the validity of the DID model is the presence of parallel trends. It is imperative that both the treatment and control groups exhibit an identical time trend prior to the implementation of the ECPT policy. This study aimed to examine the extent to which the common trend assumption holds true for the conditional expectation of performance (CEP) comparing provinces with pilot programs and those without. The event study approach was employed to create binary variables representing the experimental group throughout time for various periods preceding and following the implementation of the policy. Regression analyses were then undertaken, with the pre1 period serving as the reference period. The construction of the model is outlined as follows:
where
M = −3 and
N = 3 denote the number of periods before and after the policy time point, respectively.
is a dummy variable that takes the value of 1 if the region has implemented a purchase restriction policy in period
t−
T, and 0 otherwise.
measures the effect of the ECPT policy implemented in period
t, and
represents the effect of the policy’s implementation in the current period.
Upon conducting the analysis, the findings indicate that none of the dummy variables denoting the pre-policy occurrence exhibited statistical significance. This suggests that the alterations in the dependent variables for both the experimental group and the control group prior to the policy implementation adhered to the parallel trend. The dummy variables, namely current, post1, and post2, which signify the time after the implementation of the policy, exhibited a positive correlation with the dependent variable, reaching statistical significance at a minimum level of 5%. This suggests that the policy has had a considerable impact.
Table 4 and
Figure 3 show the results of the parallel trend test.
5.4. Robustness Tests
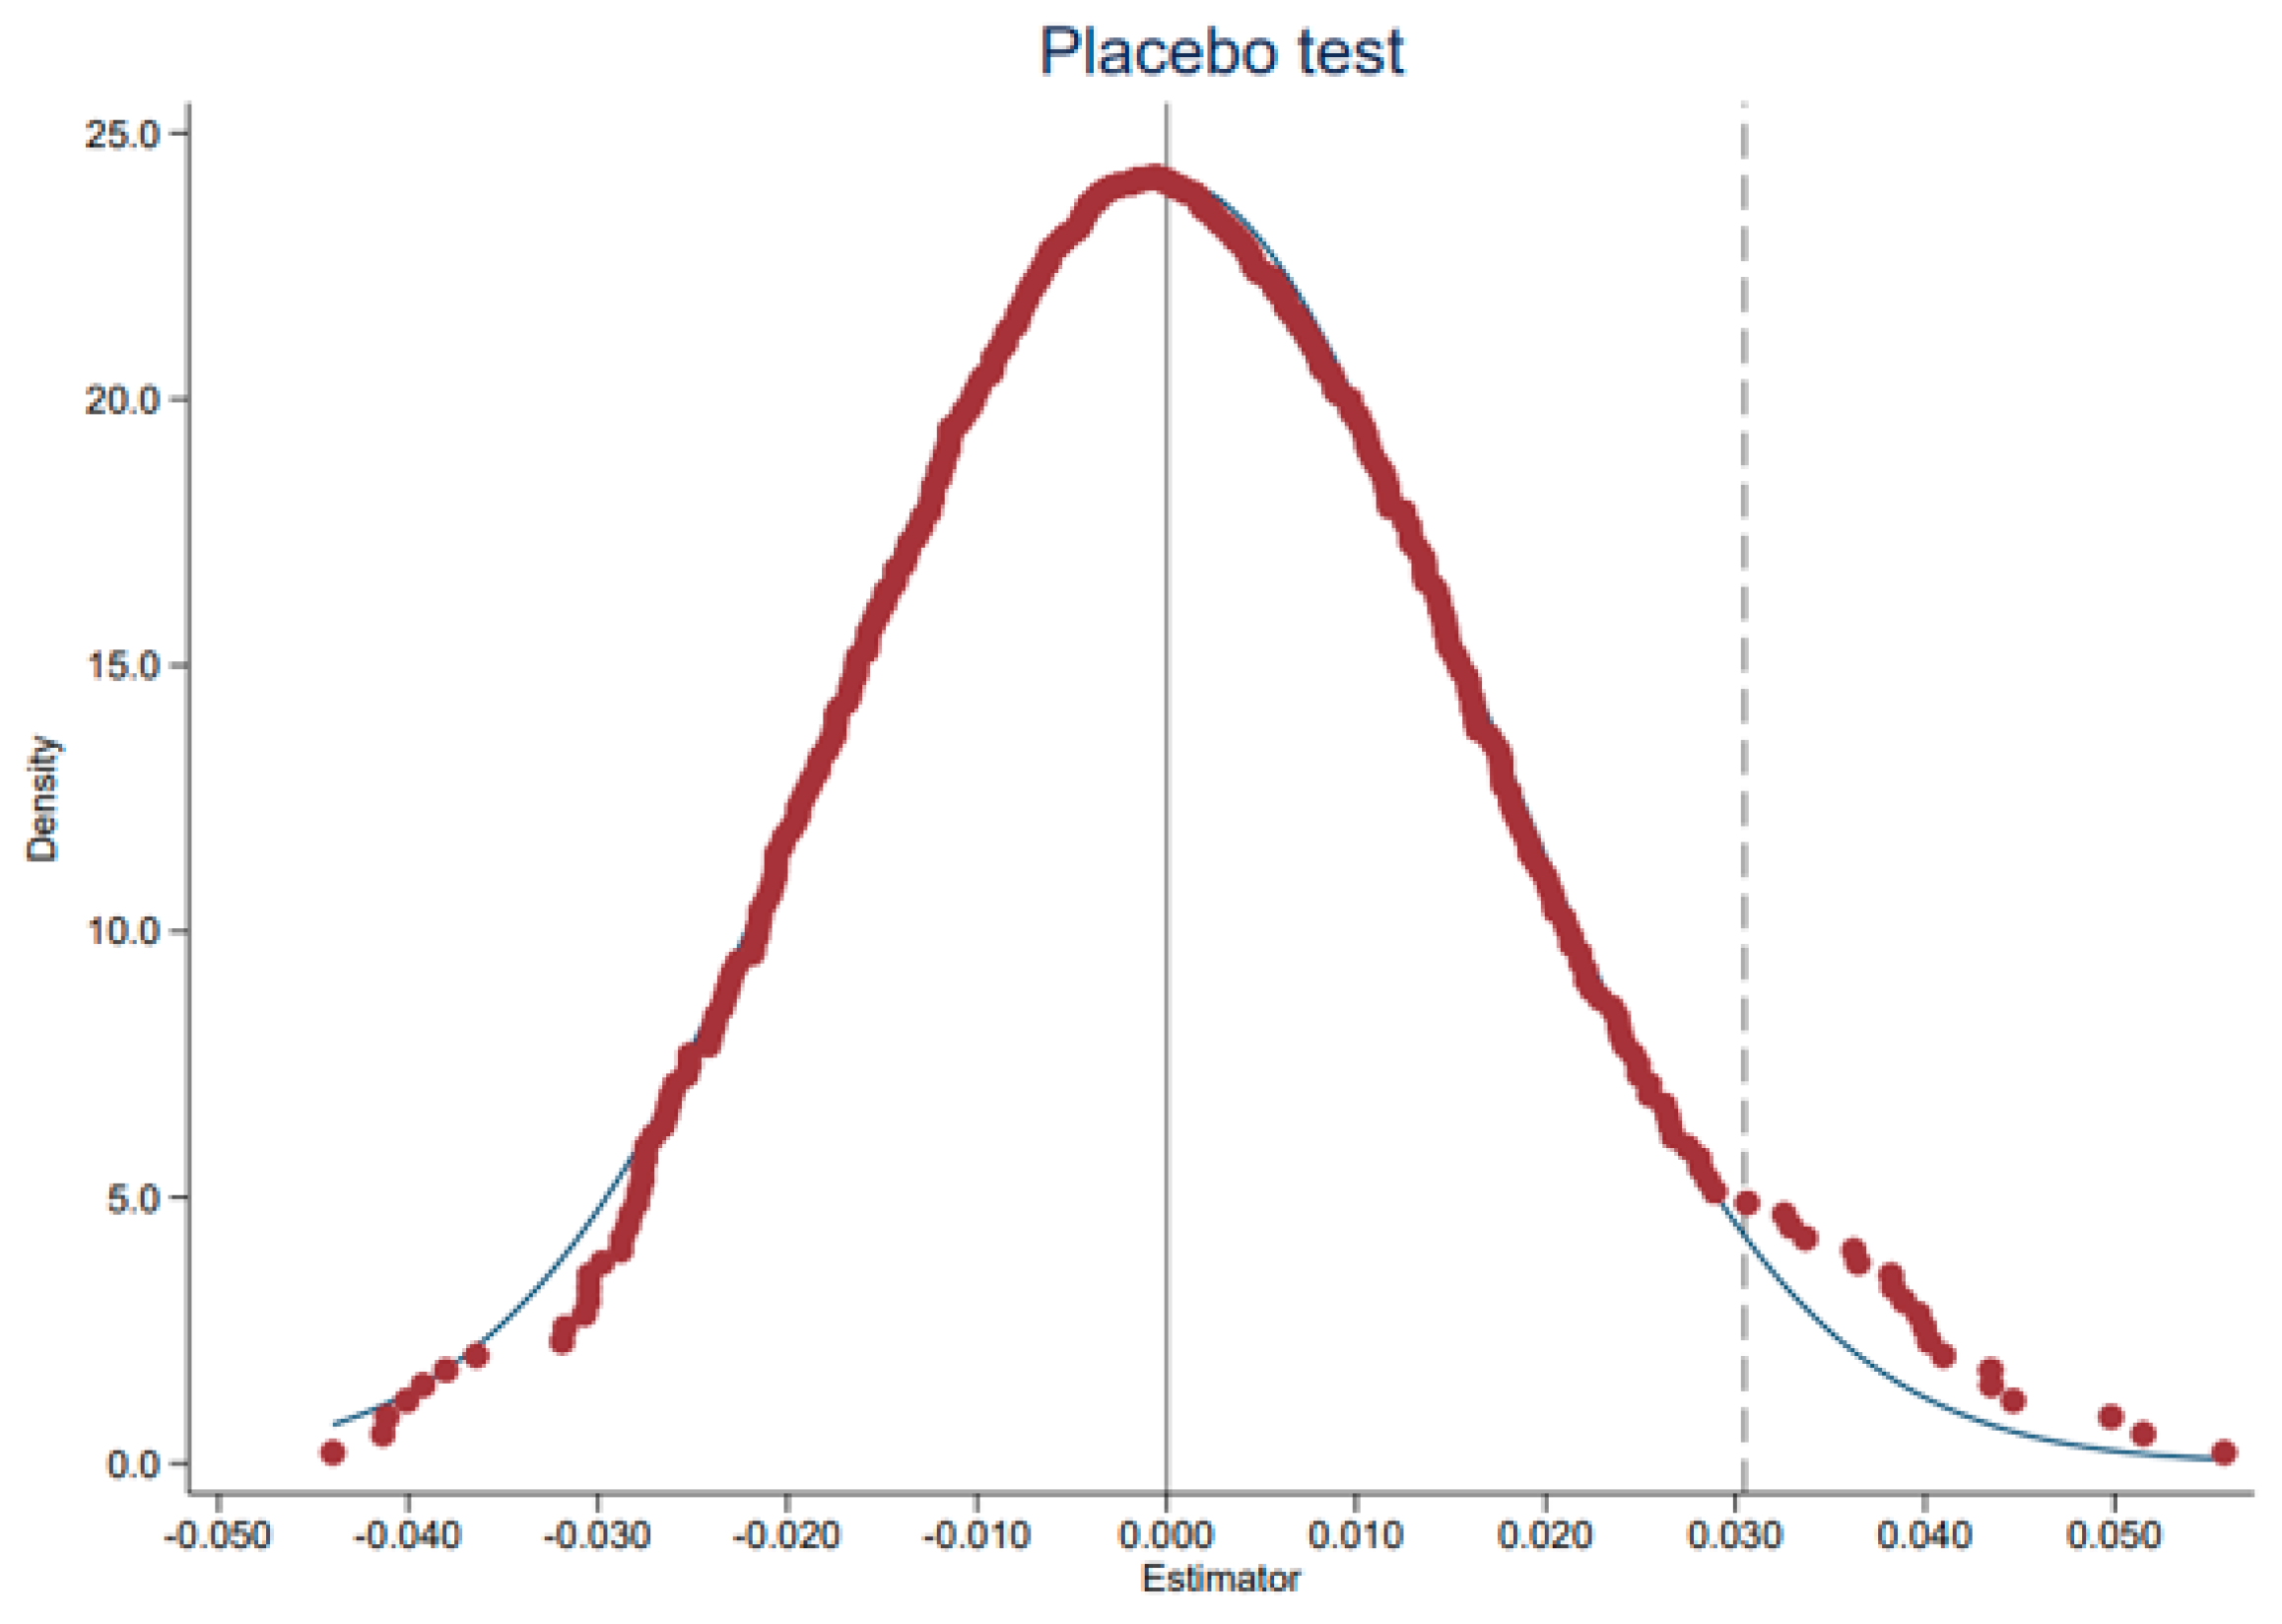
5.4.1. Placebo Test
This paper used the counterfactual assumption for robustness testing, where the experimental group and control group are randomly disrupted and then the same number of groups are extracted as the new “experimental group”, with the goal of minimizing the impact of other potential variables on the relationship between the DID and the dependent variable. The same is conducted for the policy juncture, and the interaction of the false experimental group and the time dummy yielded the new DID variable. This experiment was repeated 500 times, and the resulting coefficients were plotted. The analysis revealed that the coefficient distribution largely followed a normal distribution, and the true regression coefficients fell within the low probability rejection range. These findings indicate that the placebo test was successful.
Figure 4 shows the result.
5.4.2. PSM-DID
Indeed, the actual policy can be considered as a non-randomized experiment. Consequently, employing the DID method to evaluate policy effects will inevitably introduce sample selection bias. On the other hand, utilizing the PSM method allows for the matching of treatment group samples with specific control group samples, thereby approximating quasi-natural experiments that are nearly randomized. In order to enhance the quality of the samples and bolster the reliability of the findings, this study used PSM as its primary methodology. The matching process was conducted with a caliper value restricted to 0.01, and a closest neighbor matching mode of 1:1. Following the implementation of PSM, the samples underwent regression analysis once more. The findings revealed that the DID continued to exhibit significantly positive coefficients at a significance level of 1%. This outcome aligns with the prior conclusion drawn from the baseline regression, hence indicating the robustness of the results. The findings exhibited a high degree of robustness.
Table 5 shows the result.
5.4.3. Other Robustness Tests
- (1)
Exclusion of other policies
The Chinese government has taken measures to mitigate carbon emissions by implementing the Emissions Trading Scheme (ETS) policy in 2011 and the ECPT policy in 2017, within the timeframe of 2006–2020. Both trading techniques can be classified as cap-and-trade policies [
10]. Consequently, the introduction of the ETS may potentially influence the efficacy of the ECPT. Hence, the evaluation of the impact of the ECPT on CEP may be influenced by the ETS policy, potentially resulting in either an overestimation or underestimation of the regression outcomes. To mitigate the potential influence of such a strategy on the results, we incorporated the ETS policy into the time dummy variable and subsequently conducted a regression analysis.
Table 6 displays the regression findings, indicating that the DID maintained a statistically significant positive coefficient at the 5% significance level. This suggests that the improvement in the CEP resulting from the implementation of the ECPT is consistently seen and reliable.
- (2)
Exclusion of omitted variables
The success of the implementation of the ECPT can be influenced by variables other than PGDP, FDI, INDU, PD, and IST. Therefore, this study expanded upon previous research [
10,
37] by adding four more variables: marketization (ML), digital development (DGT), human capital (HCP), and investment in fixed assets (INV). Increased marketization levels correlate with heightened energy quota trading activity and facilitate the implementation of the ECPT. The metric for assessing digital progress is the quantity of individuals utilizing Internet broadband connections. Enhancing resource allocation efficiency through digital development can lead to a decrease in energy consumption [
37]. The quantification of human capital is determined by the count of individuals who have successfully completed their education at a comprehensive secondary school. An elevated degree of human resources signifies a populace that is better educated and encompasses a greater abundance of skilled individuals. The presence of skilled individuals can facilitate the advancement of technological innovation inside companies, enhance energy use efficiency, and foster the development of new energy sources [
66], which has a positive contribution to the ECP. The measurement of fixed asset investment is determined by calculating the ratio of the investment in fixed assets throughout the entire society to the gross regional product. An escalation in fixed asset investment, particularly an irrational investment framework, may result in a rise in energy consumption [
67], impeding the execution of the ECPT. These variables help to exclude the impact of unexplained factors on the results. The regression results with the previously omitted variables included are shown in
Table 7. The results show that the ECPT still has a favorable and statistically significant impact on the CEP, and the test for robustness was successful.
5.5. Impact Mechanism
Based on the aforementioned findings, it can be inferred that the ECPT has the potential to improve the CEP. However, it is imperative to engage in more discourse regarding the methods by which the ECPT can enhance its CEP. In this study, we put forth the proposition that implementation of the ECPT has the potential to enhance the CEP by means of optimizing the structure of energy consumption and fostering technical innovation. This work employed the two-step method proposed by Jiang [
60] to examine the mediating effect and mitigate the endogeneity issue associated with the conventional three-step approach. The regression outcomes were analyzed to investigate the impact of the policy on the dependent variable.
The initial stage involved the regression analysis of the DID and CEP models, specifically referred to as the previous conclusion regression. The obtained results demonstrate a statistically significant outcome. In the subsequent stage, the CEP was modified to the mechanism variable ES. With this change, the positive connection between the DID and ES remained statistically significant (
p < 1%). Notably, each unit increase in energy structure optimization resulted in a corresponding improvement of 1.6% in CEP. Hypothesis 2 has been confirmed. Likewise, the DID also had a strong positive connection with TI when CEP was substituted with TI. Additionally, technical innovation boosted CEP. A 1 unit increase in technical innovation increased the CEP by 13.2%. This finding aligns with Porter’s hypothesis and supports the validity of the mediating effect. Therefore, it can be concluded that technological innovation has a favorable impact on promoting the CEP. The process of verifying hypothesis H3 is as follows.
Table 8 shows the result.
5.6. Heterogeneity Test
It is apparent from the results of the baseline regression analysis that the ECPT can improve the CEP. Nevertheless, the execution of the aforementioned strategy exhibited variations across different locations as a result of distinct economic fundamentals and diverse resource endowments. Consequently, we proceeded to conduct a more in-depth examination of the diverse impacts of the ECPT on the CEP, specifically with regard to the geographic location, the degree of green finance development, and the intensity of environmental regulation.
5.6.1. Heterogeneity of Geographic Location
To assess the variety in the impact of the ECPT on the CEP, this study utilized group regression as the research methodology. The 28 provinces under investigation were classified into three distinct geographic regions: East, Central, and West. The results of the group regression analysis indicated that the DID coefficient was statistically significant in both the eastern and western regions. However, in the central region, the DID coefficient was not statistically significant. These findings suggest the presence of significant geographical variations in the relationship under investigation. This disparity aligns with the “central collapse theory”, which posits two main observations. Firstly, the central region exhibits a considerably lower economic output and overall level of development compared to the prosperous eastern coastal regions as well as a significant deviation from the national average. Secondly, in contrast to the development momentum and speed observed in the western region, the central region experiences a notably slower pace of development, both in comparison to the eastern region and the western region.
There exist multiple elements that contribute to the occurrence of the “central collapse” phenomena in relation to the impact of the ECPT on the CEP. The level of economic development plays a crucial role in influencing the CEP. The eastern region benefits from a favorable coastline geographical position, a thriving external economy, ample resources, and a high population density, all of which have collectively contributed to the economic affluence observed in this region. In places characterized by economic development, there is a significant availability of cash allocated for research and development. Moreover, the notion of green development is more deeply ingrained in these areas. Hence, when confronted with stringent environmental regulations, enterprises situated in developed regions demonstrate a greater willingness and capacity to allocate increased research and development (R&D) resources toward the development and acquisition of advanced production technologies. This, in turn, leads to enhancements in their CEP [
68]. Additionally, the energy consumption landscape will undergo a transformation as the western region experiences development. In response, the government has placed greater emphasis on the advancement of clean energy and the efficient utilization of existing energy sources within the western region. The aforementioned phenomenon has resulted in a transformation of the energy consumption framework in the western region, wherein there has been a departure from conventional, environmentally harmful energy sources such as coal, oil, and gas. Instead, there has been a notable transition toward cleaner energy alternatives like wind and photovoltaic power. This shift has played a significant role in enhancing the CEP. The industrial structure is an influential factor that warrants consideration. The central area exhibits a significant prevalence of secondary industry, wherein the production features of this sector dictate its elevated levels of energy consumption, material consumption, and carbon dioxide emissions in comparison to the primary and tertiary sectors. The advancement of the secondary sector is accompanied by the depletion of mineral and non-renewable resources. Hence, the efficacy of the ECPT in mitigating carbon emissions is impeded in the central region due to the predominant influence of secondary industry.
Table 9 shows the result.
5.6.2. Heterogeneity of Green Finance Levels
It is well-known that green finance is an important tool for enabling the transition to a low-carbon economy [
69]. Consequently, the introduction of the ECPT may yield varied effects on the CEP due to regional disparities in the extent of green finance availability. Hence, this research used the classification of the Local Green Financial Development Index and Assessment Report (2019) of local green financial development levels to divide the sample into two categories: high and low.
The regression outcomes for the subgroups are presented in
Table 10. The DID coefficient for the group with a low level of green finance development did not exhibit statistical significance. Conversely, the DID coefficient for the group with a high level of green finance development had a statistically significant positive effect at the 5% significance level. According to Ran and Zhang [
70], green finance promotes the modernization of conventional businesses and the mitigation of carbon emissions by strategically allocating capital to low-energy-consuming tertiary sectors, while imposing financial challenges on high-energy-consuming industries. Hence, places characterized by a significant degree of green finance advancement have the potential to bolster the efficacy of environmental carbon performance technologies (ECPT) in improving carbon emission outcomes.
5.6.3. Heterogeneity of Environmental Regulation Intensity
Currently, the academic community has a varied evaluation of the influence of environmental regulatory severity on environmental pollution. According to Jin et al. [
71], there is a belief among scholars that stringent environmental regulations can promote the reduction in carbon emission intensity. According to Jiang et al. [
72], there is a belief among scholars that high-intensity environmental regulations may exacerbate resource disparities between regions and lead to a rise in pollutant emissions. Regardless of the perspective taken, it can be observed that the level of environmental regulation directly influences the output of pollutants. Hence, it is plausible to suggest that variations in the strength of the environmental control across different locations could account for the disparities observed in the influence of the ECPT on the CEP. Hence, the measurement of the environmental regulatory intensity across various regions can be conducted by employing the ratio between the investment made in industrial pollution control and the value added by the secondary industry. This allows for the categorization of the sample into two distinct groups: a high-environmental regulatory intensity group and a low-environmental regulatory intensity group.
The regression outcomes for the subgroups are presented in
Table 11. The DID estimates for the low-environmental regulatory intensity groups were statistically significant at 1%. In places with low-environmental regulatory intensity, the ECPT improved the CEP significantly.
5.7. Discussion
The research conducted in this paper aligns with and introduces novel elements to prior studies on the ECPT.
Table 3 demonstrates that the ECPT has a substantial positive impact on the CEP, regardless of whether it controls for provinces alone or provinces and time. Additionally,
Table 8 provides evidence that the ECPT improves the CEP by optimizing energy consumption patterns and technical developments, which aligns with the findings of Du et al. [
7].
Table 9 demonstrates that the ECPT has a noteworthy impact in the eastern and western regions, but lacks influence in the middle region. Nevertheless, Chu et al. [
73] determined that the ECPT has the ability to substantially decrease carbon emission intensity in the eastern and central regions, but not in the western region. This could be attributed to the omission of other factors such as energy capital, labor inputs, and economic outputs in the calculation of carbon emission intensity. This paper examined the influence of various factors on the impact of the ECPT in a more comprehensive manner. It considered both the level of green financial development and the intensity of environmental regulation. This approach offers a fresh perspective compared to previous studies that only focused on the heterogeneity of the impact of the ECPT based on traditional factors like geographic location and natural resource endowment [
9,
37].
Nevertheless, the work presented in this paper does have certain constraints. This work lacks research on the possible benefits of the ECPT, regional spillover effects, and the impact of integrating carbon tax and joint implementation with the ETS, in comparison to the studies conducted by [
9,
74,
75]. Furthermore, this article specifically examined the effects of the ECPT regulations on the CEP in China, without delving into the potential consequences of comparable policies in other nations. China, being the greatest developing nation, is confronted with the dual challenges of economic growth and the need to save energy and reduce emissions, just like other emerging countries. This study focused on China because their planned ECPT policy can offer valuable insights and lessons for other developing countries in a similar scenario. Moreover, various countries have adopted policies akin to the ECPT such as the WCS, which has been implemented in the UK, France, Italy, Australia, and other nations. Hence, in future investigations, we can in-corporate a comparative analysis of the ECPT and analogous policies implemented in other nations, employ data from multiple countries to enhance our research, deepen our understanding of the factors influencing carbon emission performance, and establish a universally applicable methodology for global energy conservation and emissions reduction. Ultimately, there is a lack of examination of the enduring consequences. The parallel trend test demonstrates that the ECPT had a substantial impact on the carbon emission performance in all three years following its adoption. Nevertheless, the ECPT, a policy introduced by China in 2017, has a limited observation period due to the unavailability of data and its recent implementation, spanning only six years. As the ECPT policy becomes more widespread in the future, we can engage in a more in-depth analysis of its enduring consequences.
6. Conclusions and Policy Implications
China, being the most populous developing nation, has made a commitment to attain carbon peaking by the year 2030 in response to the escalating phenomenon of global warming. To fulfill this objective, China has implemented a range of initiatives. The Energy-Consumption Permit Trading Scheme (ECPT) is a recently introduced market-based energy trading system in China. Presently, there is a small amount of research available on the ECPT policy, with the majority of studies centering on the regulatory frameworks inside institutions and the associated economic advantages of the ECPT. The objective of this study was to investigate the effects of the ECPT on the CEP and elucidate its underlying mechanism.
This study employed panel data collected from 28 provinces in China, covering the time frame from 2006 to 2020. It aimed to investigate the influence of the ECPT policy on CEP as well as the underlying mechanisms by employing the difference-in-differences (DID) methodology. The results suggest that the introduction of the ECPT has had a significant and beneficial effect on the CEP of the pilot provinces. Furthermore, these results remained consistent and reliable even after undergoing a battery of tests. This study employed a two-step mediation effect model to examine the mediating role of energy consumption structure and technological innovation in the CEP of the ECPT. The findings indicate that the implementation of the ECPT had a notable impact on optimizing 1.6% of the energy consumption structure and fostering a 13.2% increase in technical innovation. Moreover, the ECPT demonstrates the potential to enhance the CEP by leveraging these two pathways. This article aimed to examine the varying effects of the ECPT on the CEP across different areas of China, considering varied levels of green financial growth and varying degrees of environmental regulation intensity. The ECPT exerted a substantial influence on the CEP in both the eastern and western regions of the country. Furthermore, was observed that the ECPT exerted a substantial impact on the CEP specifically in areas characterized by a high degree of green financial development and a low intensity of environmental regulation. In summary, the implementation of the ECPT as a novel environmental regulatory policy has demonstrated its efficacy in improving the CEP and facilitating the achievement of carbon reduction objectives. This document presents a set of recommendations aimed at enhancing the promotion of ECPT policy.
The implementation of ECPT policies should be tailored to local circumstances. ECPT policies have a greater impact in the eastern and western areas as well as in provinces with higher levels of green financial development and environmental legislation. Hence, when implementing the ECPT, it is imperative to modify the policy while taking into account the diverse resource allocation, economic progress, industrial composition, environmental consciousness, and other relevant aspects across various provinces. In the central region, where the impact of the ECPT is less pronounced, the government should take two approaches. Firstly, it should strengthen environmental regulation by intensifying restrictions and supervision on highly polluting companies as well as promoting environmental awareness among businesses. Secondly, the government can leverage green finance by introducing environmentally beneficial collateral such as pledge loans for carbon assets and franchises. This will provide support for initiatives like clean energy infrastructure, low-carbon industrial transformation, and green transportation construction as well as the implementation of initiatives such as low-carbon transformation, the building of green transportation infrastructure, and other projects. Additionally, it will enhance the issuing, underwriting, and investment of green bonds.
This will also facilitate the enhancement of energy consumption structure optimization and technical innovation. The mechanism of action indicates that the ECPT can improve the CEP by optimizing the energy consumption structure and promoting technological innovation. Therefore, it is imperative for the government to actively promote energy structure transformation and stimulate company innovation. The government can decrease its reliance on fossil fuels by implementing a change in its industrial structure, thereby altering its energy composition. The government has the ability to establish a science and technology innovation platform that focuses on green and low-carbon technologies. This platform will bridge the gap between traditional industries and emerging technologies, addressing issues such as overcapacity and inefficient resource utilization. It will also facilitate the ongoing improvement and modernization of traditional industries while phasing out the outdated industrial development model characterized by high energy consumption and pollution. Regarding technology, the government should enhance the funding for scientific research and provide policy backing for eco-friendly technologies such as novel environmental materials technology, environmental monitoring technology, new energy application technology, carbon capture and storage technology, and carbon-negative technology.
China has recently initiated efforts to advance the establishment of trading mechanisms for environmental rights and interests such as carbon emission rights, sewage rights, and water rights. However, it is important to note that there may be instances when these laws overlap, potentially leading to a dilution in the effective execution of the ECPT framework. Hence, to optimize the efficacy of each policy, it is imperative for the government to elucidate the interplay between these policies and diligently foster a cohesive market for environmental rights and interests.
This study examined the effects of the ECPT on the CEP and its underlying mechanism while also exploring the heterogeneity of these effects. By doing so, it contributes to the existing body of research on ECPT policy. Nevertheless, this paper is not without its limits. This study focused on panel data from 28 provinces in China, covering the period from 2006 to 2020. It is important to note that China has a total of 34 provincial-level administrative regions. Consequently, the sample size employed in this study may be considered insufficient, potentially affecting the accuracy of the provincial-level data. To enhance the comprehensiveness of the analysis, it is recommended to include data from prefectural-level municipalities in future research. Furthermore, it is recommended that this research article incorporated additional variables in order to carry out robustness testing, hence enhancing the overall reliability of the findings.


