Article

Effects of Stand Density on Growth, Soil Water Content and Nutrients in Black Locust Plantations in the Semiarid Loess Hilly Region

1
State Key Laboratory of Soil Erosion and Dryland Farming on the Loess Plateau, Northwest A&F University, Yangling 712100, Shaanxi, China
2
College of Forestry, Northwest A&F University, Yangling 712100, Shaanxi, China
3
Institute of Soil and Water Conservation, Chinese Academy of Sciences and Ministry of Water Resources, Yangling 712100, Shaanxi, China
4
College of Software, Henan University, Kaifeng 475004, Henan, China
5
Chongqing Forestry Investment Development Co., Ltd., Chongqing 401120, China
6
Gansu Monitoring Center for Ecological Resources, Lanzhou 730000, Gansu, China
*
Author to whom correspondence should be addressed.
Sustainability 2024, 16(1), 376; https://doi.org/10.3390/su16010376
Submission received: 11 December 2023 / Revised: 28 December 2023 / Accepted: 29 December 2023 / Published: 31 December 2023
(This article belongs to the Special Issue Forest Ecosystem: Structure and Functioning)

Abstract

:
Stand density is an important index of forest structure, which strongly affects local environments and functions in the forest. Many black locust (Robinia pseudoacacia) plantations with low quality in the Loess hilly region are assumed to be caused by inappropriate stand density. In this study, the growth status, spatio-temporal variations in soil water and nutrient conditions were investigated in the nearly middle-aged plantations with three density classes. The proportion of stunted trees increased with the increase in density class. The stands of <2500 stems ha−1 not only had the distribution peak of diameter at breast height (DBH) being at a larger diameter class, but also showed relatively rapid growths in diameter and biomass per tree. However, stand density did not show a significant effect on the growth rate of both mean tree height and biomass density. The maximum biomass density and relatively high soil NH4+-N content appeared in the density class of 2500–3500 stems ha−1. The temporal stability of soil water content (SWC) on a seasonal scale increased with the deepening of the soil layer, and spatio-temporal variations in the SWC remained relatively stable in the deep layer (200–300 cm). While the infiltration depth after rainfall was rainfall-amount-dependent, the depth of effective replenishment reduced with the density class increasing. The average SWC and its temporal stability in 0–300 cm of soil layer are the best in a stand density of less than 2500 stems ha−1. No significant differences were observed among the stand density classes in the contents of total nitrogen, total phosphorus, NO3-N, and available phosphorus in soils of these nearly middle-aged plantations that have experienced similar management history since the afforestation of abandoned cropland. Overall, the stand condition of density class I is superior at present. But thinning of stand density may be needed to maintain the best stand conditions in the future, with the stand age increasing. The results contribute to further understanding of the relations between density gradient and multiple variables in the plantations, which offer a reference for the forest management and sustainable development of ecosystems in the semiarid region of the Loess Plateau.

1. Introduction

The hilly region in the middle Loess Plateau in China has a semiarid climate and fragile ecosystems that tend to suffer from soil erosion and land degradation [1,2]. Forestation has been conducted as an efficient measure to alleviate soil denudation, improve soil quality and functions, and restore the ecosystems and environments [3,4,5]. The black locust (Robinia pseudoacacia) has been a favorable species and widely planted in the region owing to its characteristics of azotification, drought resistance, rapid growth, and high survival rate [6]. As the largest afforestation tree species in the Loess Plateau, black locust plantations covered a large area, spanning sub-humid and semiarid regions [7,8,9]. However, to maximize the soil conservation function, consideration of stand density in afforestation processes has been insufficient, resulting in many black locust plantations with excessive density, slow growth rates, and inadequate stand management [10,11,12,13]. In recent years, the occurrence of soil desiccation, stand degradation, and reduction in watershed runoff has become a recurring phenomenon in the plantation located areas [14,15,16,17].
Stand density is an important index of forest structure [18]. It establishes the spatial structure of a stand and determines the distributions of environmental factors, such as light, temperature, and water, which are crucial to the growth of both individual trees and the whole forest [19,20,21]. Consequently, stand density may indirectly affect soil physic-chemical properties, nutrient cycling, and photosynthesis [22,23,24]. For instance, stand density strongly affects the amount of available growth space in the community and natural resources available to a single tree [25,26]. A black locust plantation with higher density can capture more light energy through a higher leaf area index (LAI) and canopy density, and has stronger photosynthetic carbon fixation capacity [27]. However, high stand density would also intensify the competition for space and resources of single trees [28,29], which is not conducive to stand growth. A study on a ponderosa pine plantation clearly showed that the long-term average growth of a low-density forest was significantly higher than that of a high-density forest [30].
Stand density can affect the utilization of soil water by the forest, and indirectly affect the distribution and infiltration of rainfall through a changing stand structure [31,32], thereby affecting soil water conditions under the forest. High-density plantations of Chinese fir and black pine showed a long-term water shortage of trees and decreases in available soil water and nutrients, thus limiting the tree’s growth [25,33]. Low-density pine and oak plantations showed a high resilience to drought by improving light and water availability [34,35,36]. However, dryness in the shallow and middle soil of low-density stands appeared due to the increased evapotranspiration from the understory and soil surface of low-density ponderosa pine plantations that were strongly affected by solar radiation [30,37]. A study on black locust plantations found that a low stand density fixed carbon with less water expense, thereby achieving a collaborative result of forest carbon fixation and soil water conservation [38]. Another piece of research into black locust and Chinese pine plantations also indicated that maintaining proper stand density by thinning and replanting an optimized stand structure and root water absorption improved the soil’s permeability, and increased the soil water content (SWC) in the stands [39].
Soil nutrient conditions may also be affected by stand density. High-density stands of black locust have been found to accumulate more litter than low-density stands, thus providing a richer source of soil nitrogen and organic matter [40]. However, Zhang et al. [41] found the litter decomposition rate and amount of nitrogen and organic matter input to soil reduced in high-density black locust plantations due to worse transmission of light and lower enzyme activity in the surface soil. Studies of Chinese fir and black cottonwood both suggest that stand density not only affected the accumulation of litter but also affected the soil temperature and humidity, and the activities of microorganisms in the soil, thus impacting the condition of soil nutrients [42,43]. Other studies suggest that soil nutrient contents would reach the maximum values at a suitable density range, rather than following a simple correlation with the density gradient [44,45].
The samplings in the above study cases are diverse in plot ages and management background. Some studies focused on the influences of intermediate cutting on high density stands [27,39,46]. In this study, by setting up fixed plots with a similar stand age and land-use background, we comparatively investigated the characteristics of growth, soil water content, and nutrient conditions for the black locust plantations with density gradients. The objectives were (i) to determine the density effects on the forest biomass and tree growth for the nearly middle-aged plantations in this semiarid site, and (ii) to analyze the influence of the stand density gradient on the spatio-temporal variation in SWC and nutrient characteristics in the plantations.

2. Materials and Methods

2.1. Site Characteristics

This research was performed in the southern suburb of Yan’an, Shaanxi Province, China. The site is situated in an ecotone between forest and forest–steppe ecosystems [47]. The geographical coordinates are 36°27.21′ N–36°29.11′ N and 109°28.87′ E–109°33.84′ E. The altitude is 1150–1295 m. The landform types are mainly Loess hilly-gully, with a complex terrain fragmentation. This region has a semi-arid climate, is rainy and warm in the summer and autumn, and cold and dry in the winter and spring. According to the data recorded by the climatological station in Yan’an city, the averages (1956–2015) of annual precipitation and temperature are 537.9 mm and 10.0 °C, respectively [48]. Most of the rainfall is concentrated in June to September in this region, showing clear seasonal characteristics. The growing season begins from April and ends in October for most tree species in this region. According to the FAO classification system, the soil category is calcic cambisols [47]. The ability of the soil to retain water and fertilizer is poor, and e soil and water loss occur easily due to rain erosion [49]. Black locust plantation is the major plantation type in this area, with sparse shrubs and grasses within the plantations.

2.2. Plot Setting and Sampling Measurement

In March 2018, shortly before the year’s growing season, 10 sample plots of 20 m × 20 m were selected in black locust plantations with a clear density gradient and were located within a 1 km distance. All plots were at the nearly middle-aged stage [50], and were established on abandoned agricultural lands with an analogous management and history following the national project of Grain-for-Green [51]. For example, the lands experienced similar fertilization management until changing to forests. No thinning and other tending measures were carried out during the stand growth period. As planted pure forests, all the stands are singly dominated by black locust. For the convenience of analyses, the plots were grouped into three density classes as <2500 stems ha−1, 2500–3500 stems ha−1, and >3500 stems ha−1, with three to four plots in each class. The general characteristics of the plot survey are shown in Table 1.
For the plot survey, the DBH and height of each tree were measured and recorded once a year in the non-growing season. Due to the scarcity of shrubs and grasses in the plantations, the biomass of shrubs and grasses was neglected in this study.
For repeated measurements of the SWC, two representative spots were chosen as replicates in each plot at the relatively lower and upper positions, and a Tecanat® plastic tube (3 m in length) with an inside diameter of 42 mm was vertically inserted into the soil in each spot. The volumetric SWC was measured at 20-cm intervals across the 0–300 cm profile using a time-domain refectometry system (TRIME-TDR; IMKO Micromodultechnik, Ettlingen, Germany). The average value measured on the upper and lower positions was taken for each depth to represent the value for the plot. Measurements were carried out monthly, usually at the end of each month, avoiding rainfall at least three days before. The soil water content of 0–100, 100–200, 200–300 and 0–300 cm soil layers was obtained by calculating the arithmetic mean of the water content in different soil layers.
Soil samples from depths of 0–10, 10–20, 20–40, 40–60 and 60–100 cm were sampled for the determination of soil nutrients using a soil core auger (4 cm in internal diameter). Within each plot, six points were selected for representative sampling. The points were allocated to left and right groups, each encompassing upper, middle, and lower locations across the slope. Representative homogenized soil layer samples were prepared for each group by thorough mixing. Finally, a pair of replicates was collected from each plot at every depth level. Samples were processed to remove rock and vegetation particles, then dried under ambient conditions, crushed, and finally sieved using a 0.25 mm sieve. The soil organic carbon (SOC) content was quantified through a wet combustion technique employing the K2Cr2O7 method. The Kjeldahl acid-digestion technique was applied to determine the content of total nitrogen (TN). The total phosphorus (TP) content was evaluated through molybdenum-blue colorimetry. The Nessler’s reagent colorimetric approach was adopted to determine the content of NH4+-N. Ultraviolet and visible spectrophotometry was applied to determine the content of NO3-N. The available phosphorus (AP) content was determined by a sodium hydrogen carbonate solution with the Mo-Sb anti spectrophotometric method. The soil nutrient content of the whole 0–100 cm layer was obtained by calculating the weighted average of the nutrient content in different soil layers with their thicknesses.

2.3. Calculation of Growth Indexes

The biomass of black locust organs was estimated by allometric equations, based on the DBH and height of each tree. Biomass equations of black locust organs were selected from those previously established for application to this region [52] (Table 2).
The biomass was calculated for each tree by summing those of all organs. The total biomass was obtained by summing those of all trees in the plot, and the biomass density was determined by dividing this value by the plot’s area. The average biomass of an individual tree was calculated as the ratio of the total biomass to the number of trees. The biomass density growth rate (BDGR) was calculated by the equation [53] as:
B D G R = M i M 0 Δ t
where BDGR (t ha−1 year−1) is the biomass density growth rate; M0 (t ha−1) is the biomass density at the initial investigation time; Mi (t ha−1) is the biomass density at a later survey time; Δt (years) is the survey interval years. In this study, Δt is 4 years (2018–2022).
Similarly, the average biomass growth rate of individual trees (ABGR) was calculated as:
A B G R = N i N 0 Δ t
where ABGR (kg year−1) is the average biomass growth rate of the individual tree; Ni (kg) and N0 (kg) are the average biomass of the individual tree at time i and the initial investigation time, respectively; Δt is 4 years (2018–2022) in this study.

2.4. Statistical Analysis

The monthly coefficient of variation was calculated for the SWC as the ratio of the standard deviation to the mean value. Pearson correlation analysis was utilized for the relationship between growth variables (DBH or tree height) and the plot mean age. One-way ANOVA was applied to test for differences in indexes among stand density classes. The figures are drawn with OriginPro 2021 (OriginLab Corporation, Northampton, MA, USA).

3. Results

3.1. Variation in Stem Growth and Stand Biomass with Density Gradient

3.1.1. Variation in Stem Growth with Density Gradient

The DBH distribution of density I showed a peak around 8 cm while the distribution peaks of density II and III were concentrated in about 3 cm (Figure 1a). The density increase tended to decrease the tree diameters for the majority of individuals. The mean values of DBH were not statistically different among the density classes, though the mean value of class III was generally smaller than for the other two classes. The distribution peak of the tree height in density class II (about 10 m) ranked the highest among the three classes, while the distribution peaks for class I and III were about 9 m and 8 m, respectively (Figure 1b). With the increase in density, the distribution of tree height changed from unimodal to nearly bimodal. In other words, though the tree height distribution peaked at 10 m and 8 m in class II and III, respectively, there were also substantially smaller trees in these plots. Similarly, the mean values of tree height were also not statistically different among the density classes, though the mean value of class III was generally smaller than the other two classes.
During the investigation period, the DBH and height in the plantations could be fitted as linear functions of age (Figure 2). The slope of the regression line for the DBH changes in the density class I (0.32) was clearly greater than those of the other two classes (0.12), suggesting a higher growth rate of DBH in density class I during this period. Slopes of the regression lines for the mean tree height in the three density classes were similar (0.54, 0.5 and 0.56), though the mean tree height in class III was always smaller than that of the other two classes each year.

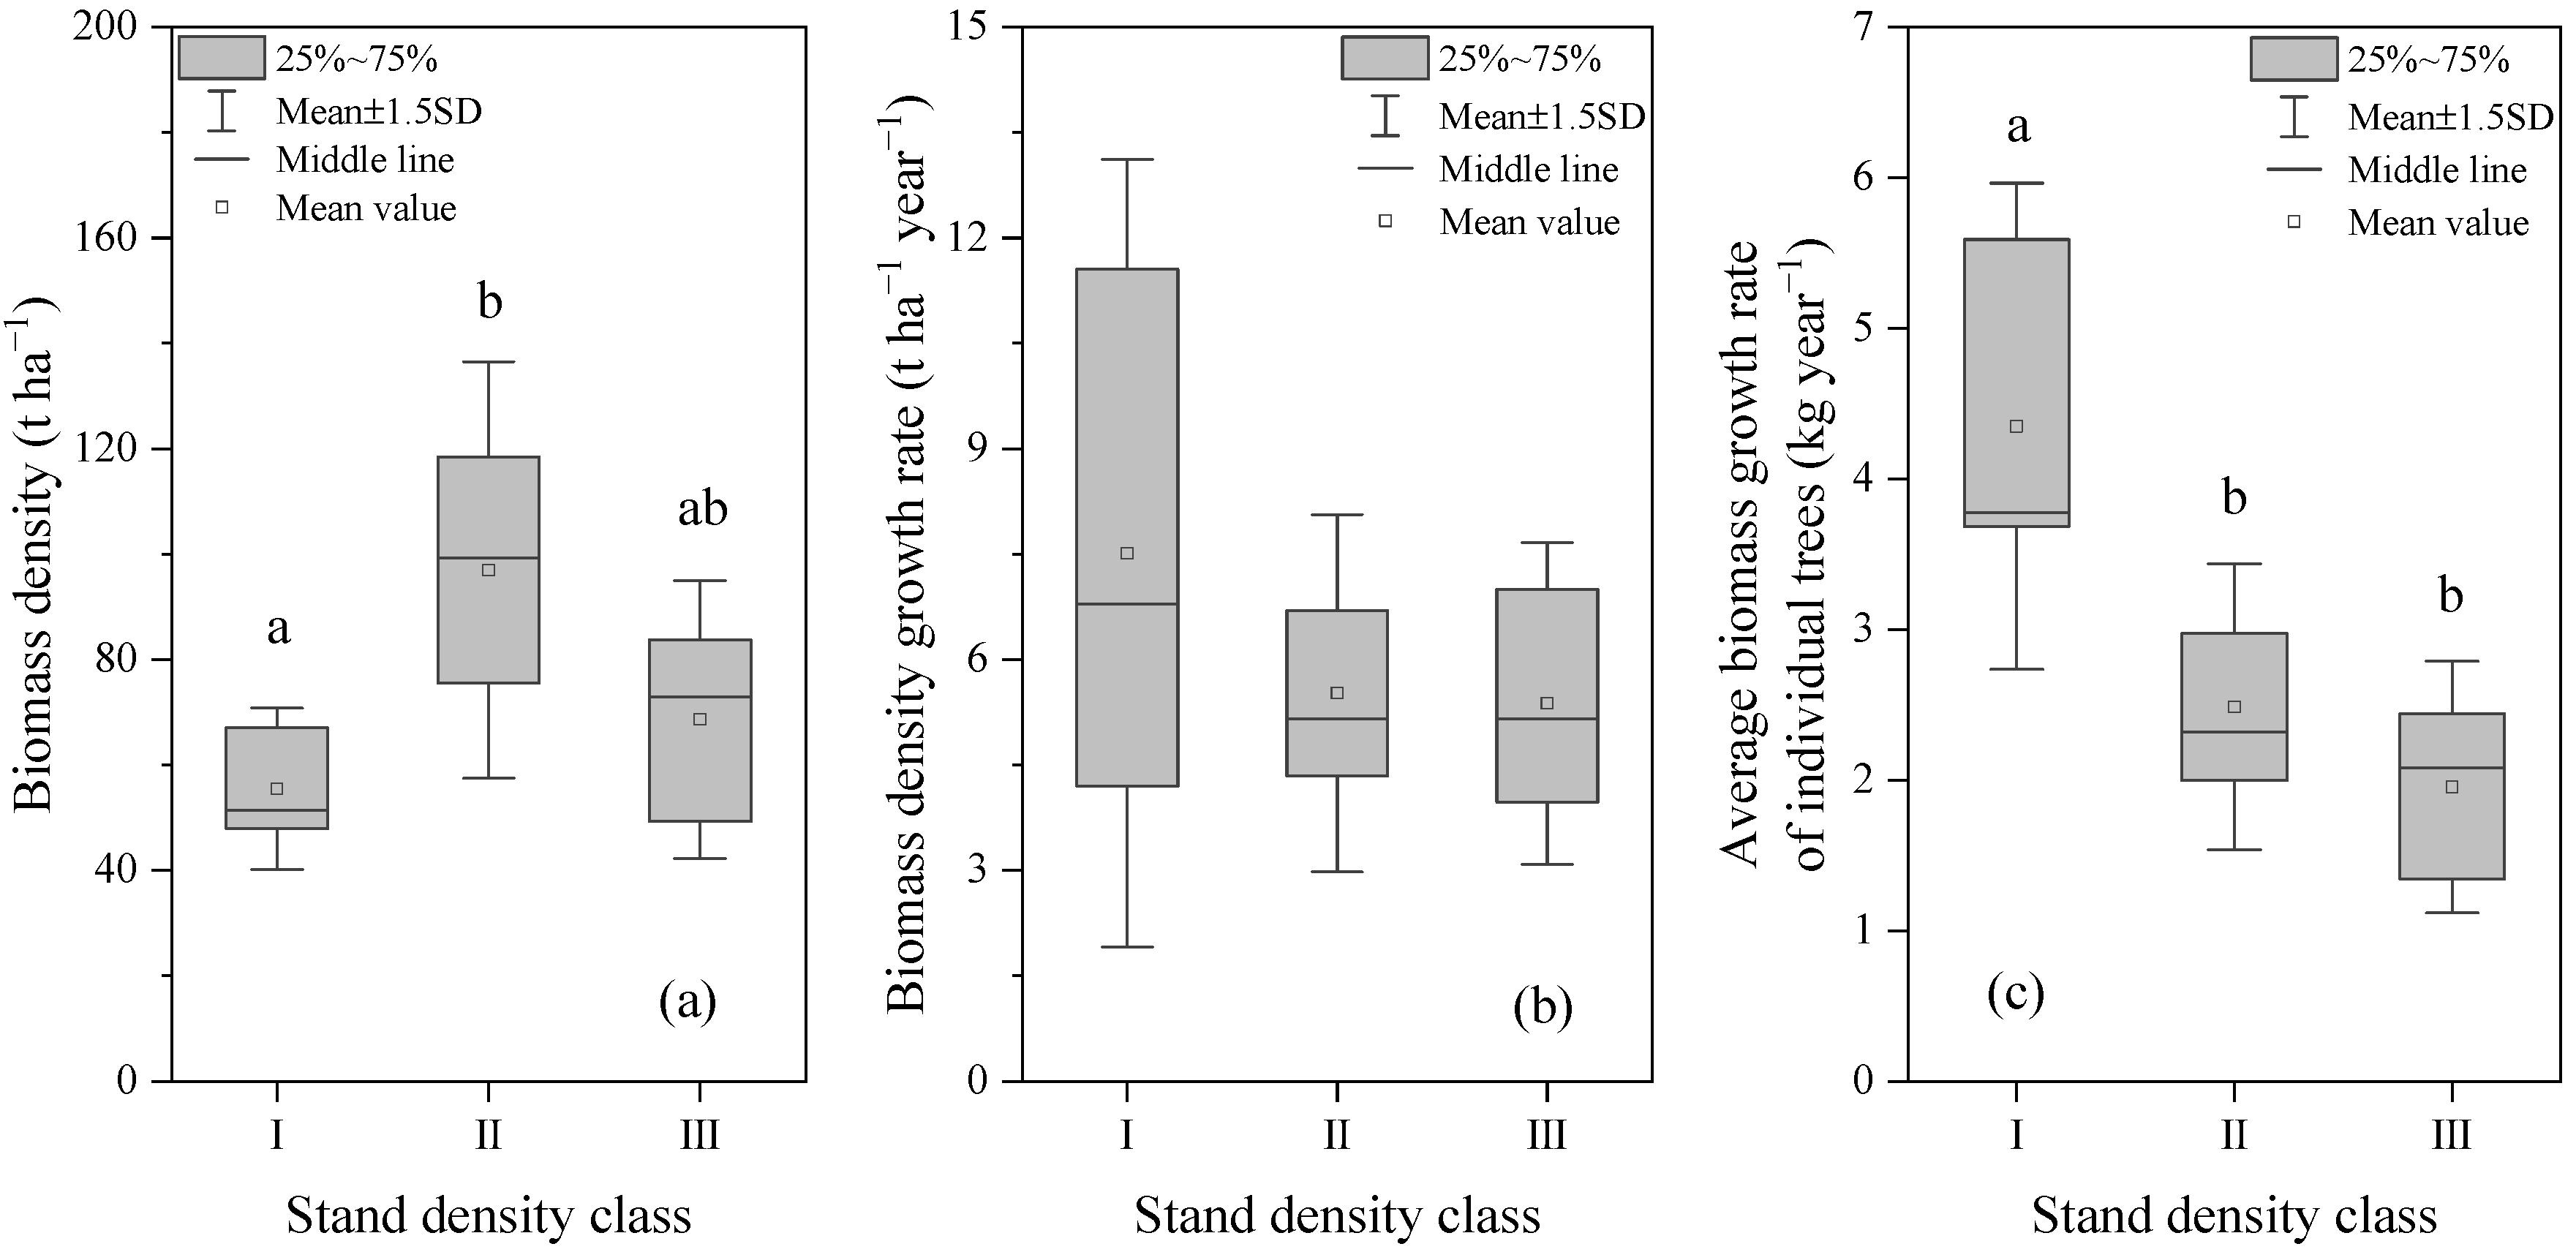
3.1.2. Variation in Stand Biomass with Density Gradient

The greatest biomass was achieved in class II among the three density classes of the plantations, with the descending order of II > III > I and the difference between class I and II being statistically significant (p < 0.05) (Figure 3a). Biomass density growth rates were roughly similar among the density classes, with that in class I being slightly greater (Figure 3b). The density class I showed the highest biomass growth rate of individual trees and the class III showed the lowest growth rate, with the difference between class I and the other two classes being significant (p < 0.05) (Figure 3c).

3.2. Effect of Stand Density on Spatio-Temporal Distribution of Soil Moisture

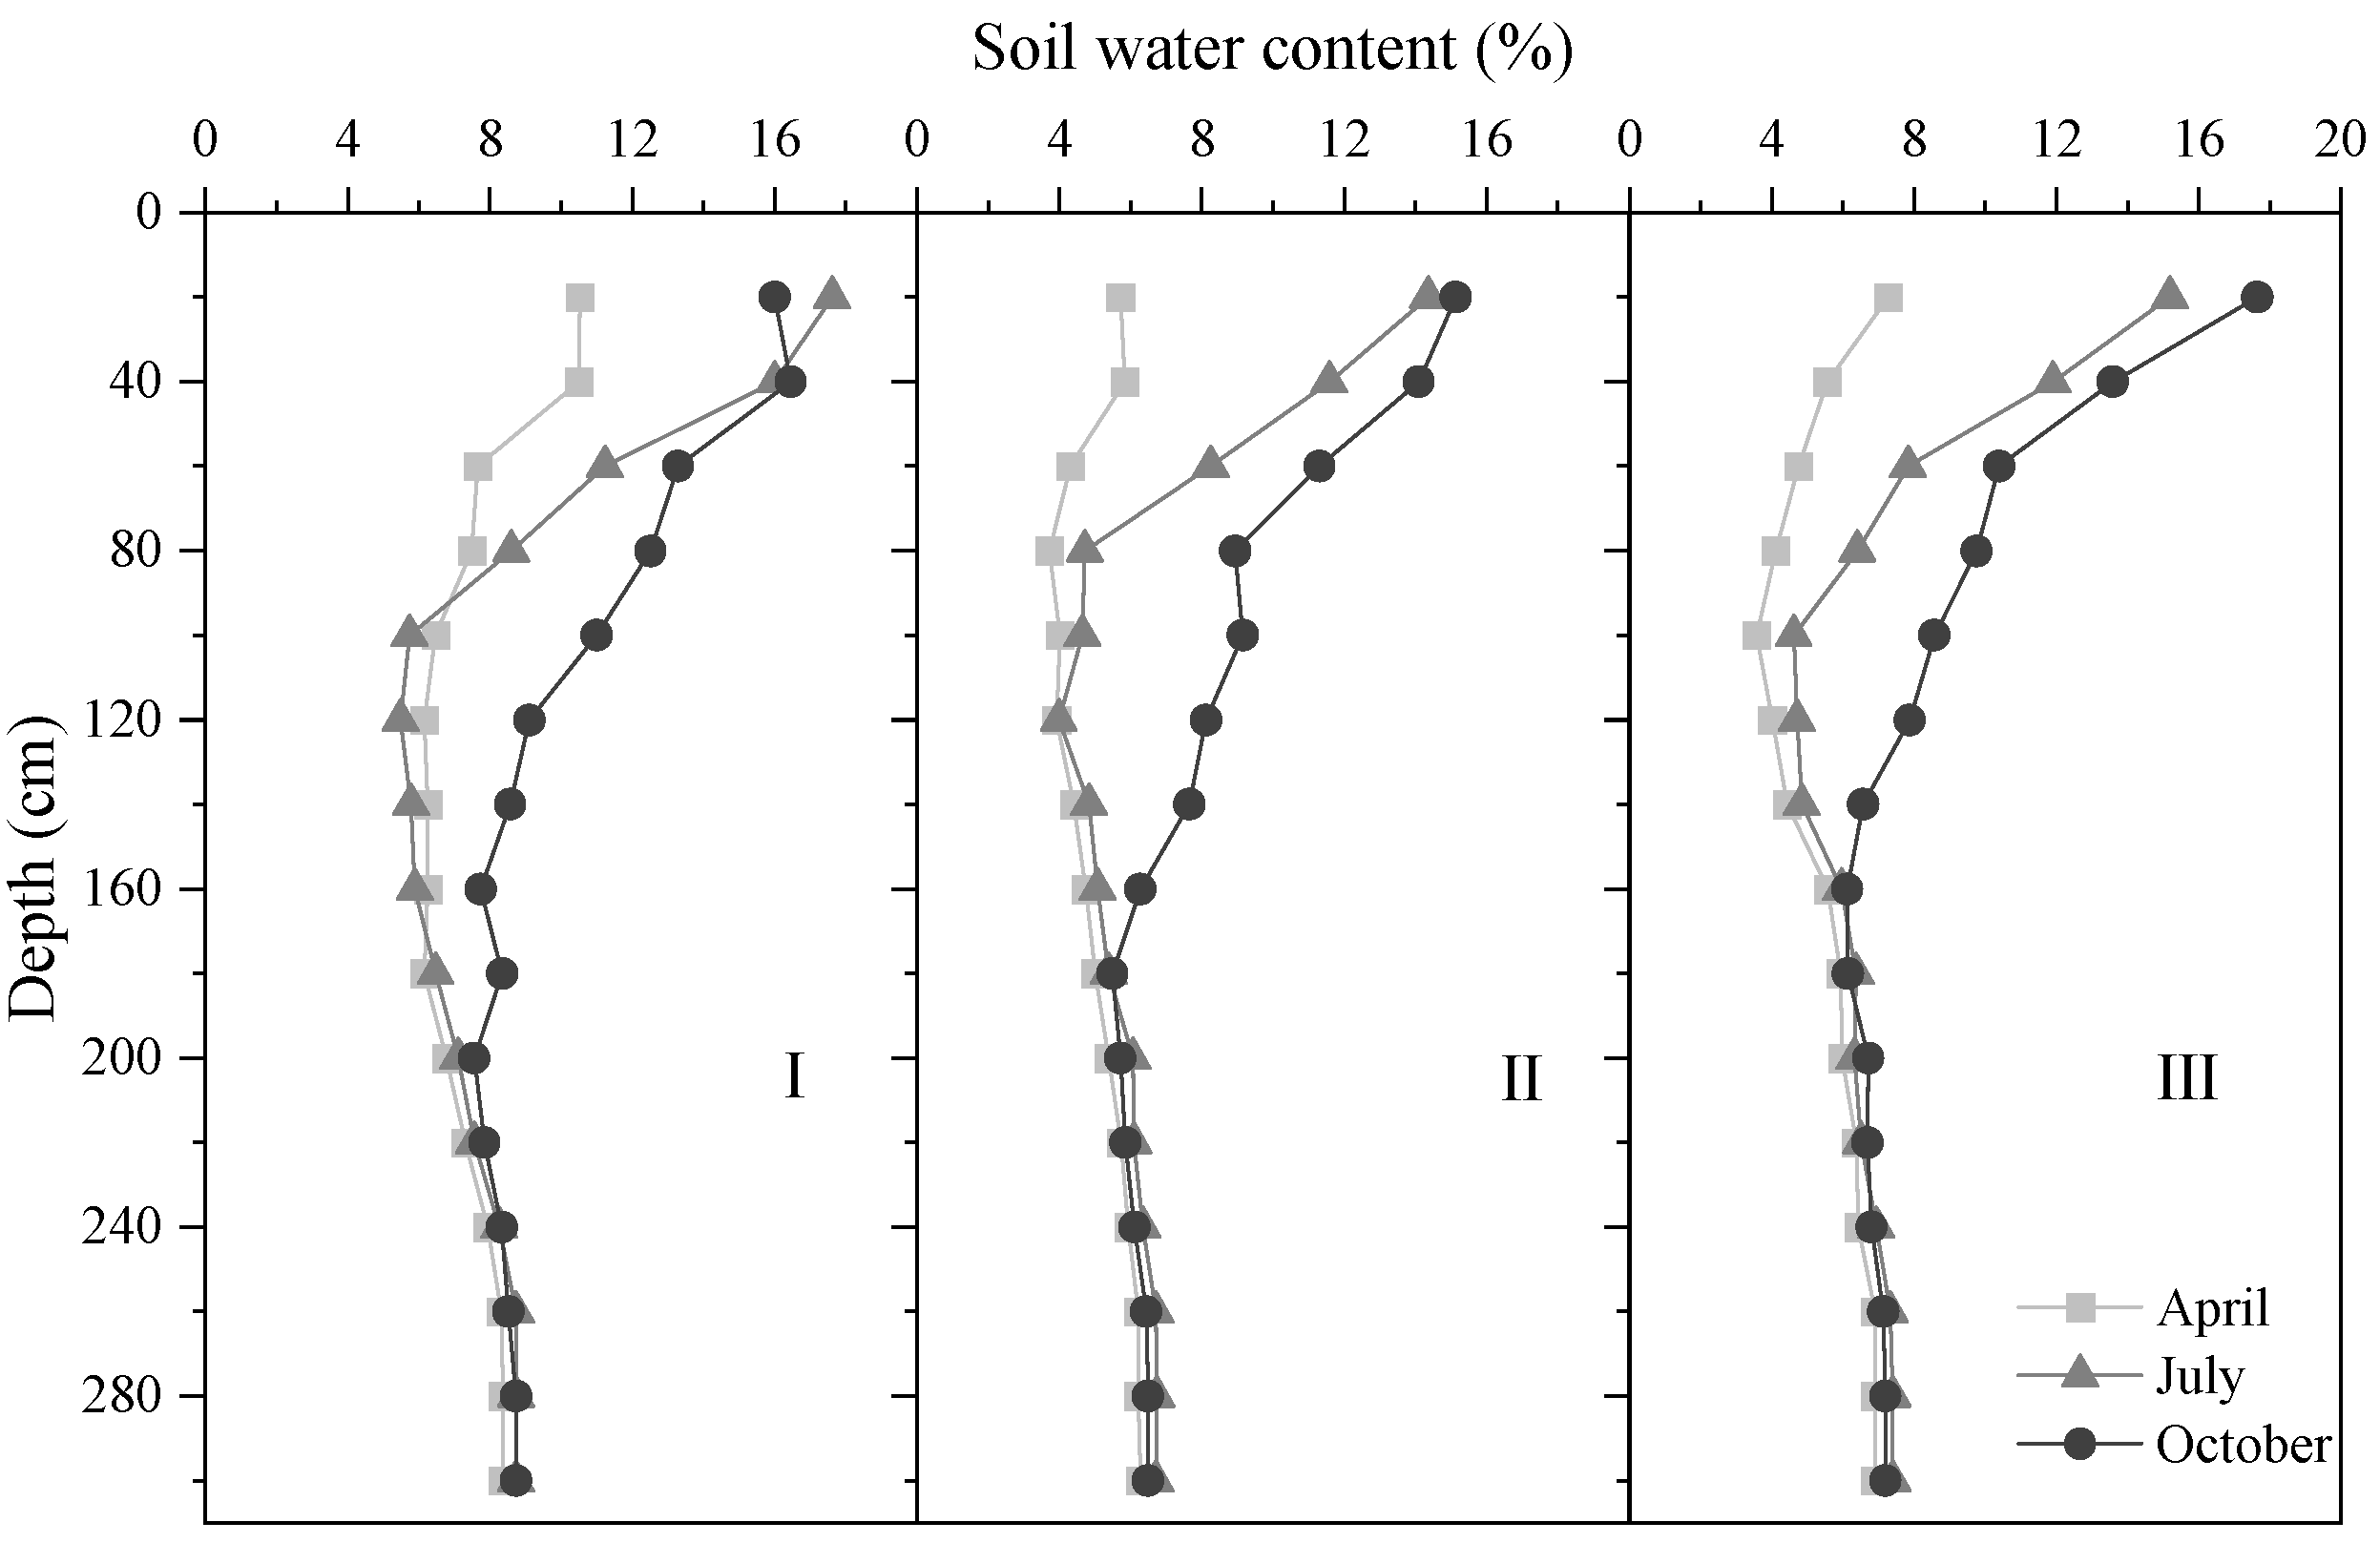
3.2.1. Variation in Vertical Distribution Dynamic of SWC with Density Gradient

The SWC in the stands of three density classes showed similar vertical and seasonal changing trends (Figure 4). As there was usually a small amount of soil water replenishment from snow melting in this region, the vertical pattern of the SWC at the incipience of the growth period (April) generally showed a gradually decreasing trend along the upper layer (0–100 cm), a relatively stabilized low level along the middle layer (100–200 cm), and a slightly increasing and stabilizing trend along the deep layer (200–300 cm). With the arrival of the rainy season, increases in the SWC were observed in the shallow and middle layers (0–200 cm) of the profile. Further increases were achieved by the last stage of the growth period (October), with the upper layers being substantially replenished. With the rainfall increasing, the depth of water infiltration clearly increased, but the depth of the soil water effectively replenishing in the last stage of the growth period (October) decreased with the increase in stand density. Vertical distributions of the SWC in density II and III were very similar, especially in the deep soil layer. The vertical distribution of the SWC in density I was always greater than that of density II and III (comparisons in detail are given in the next section).

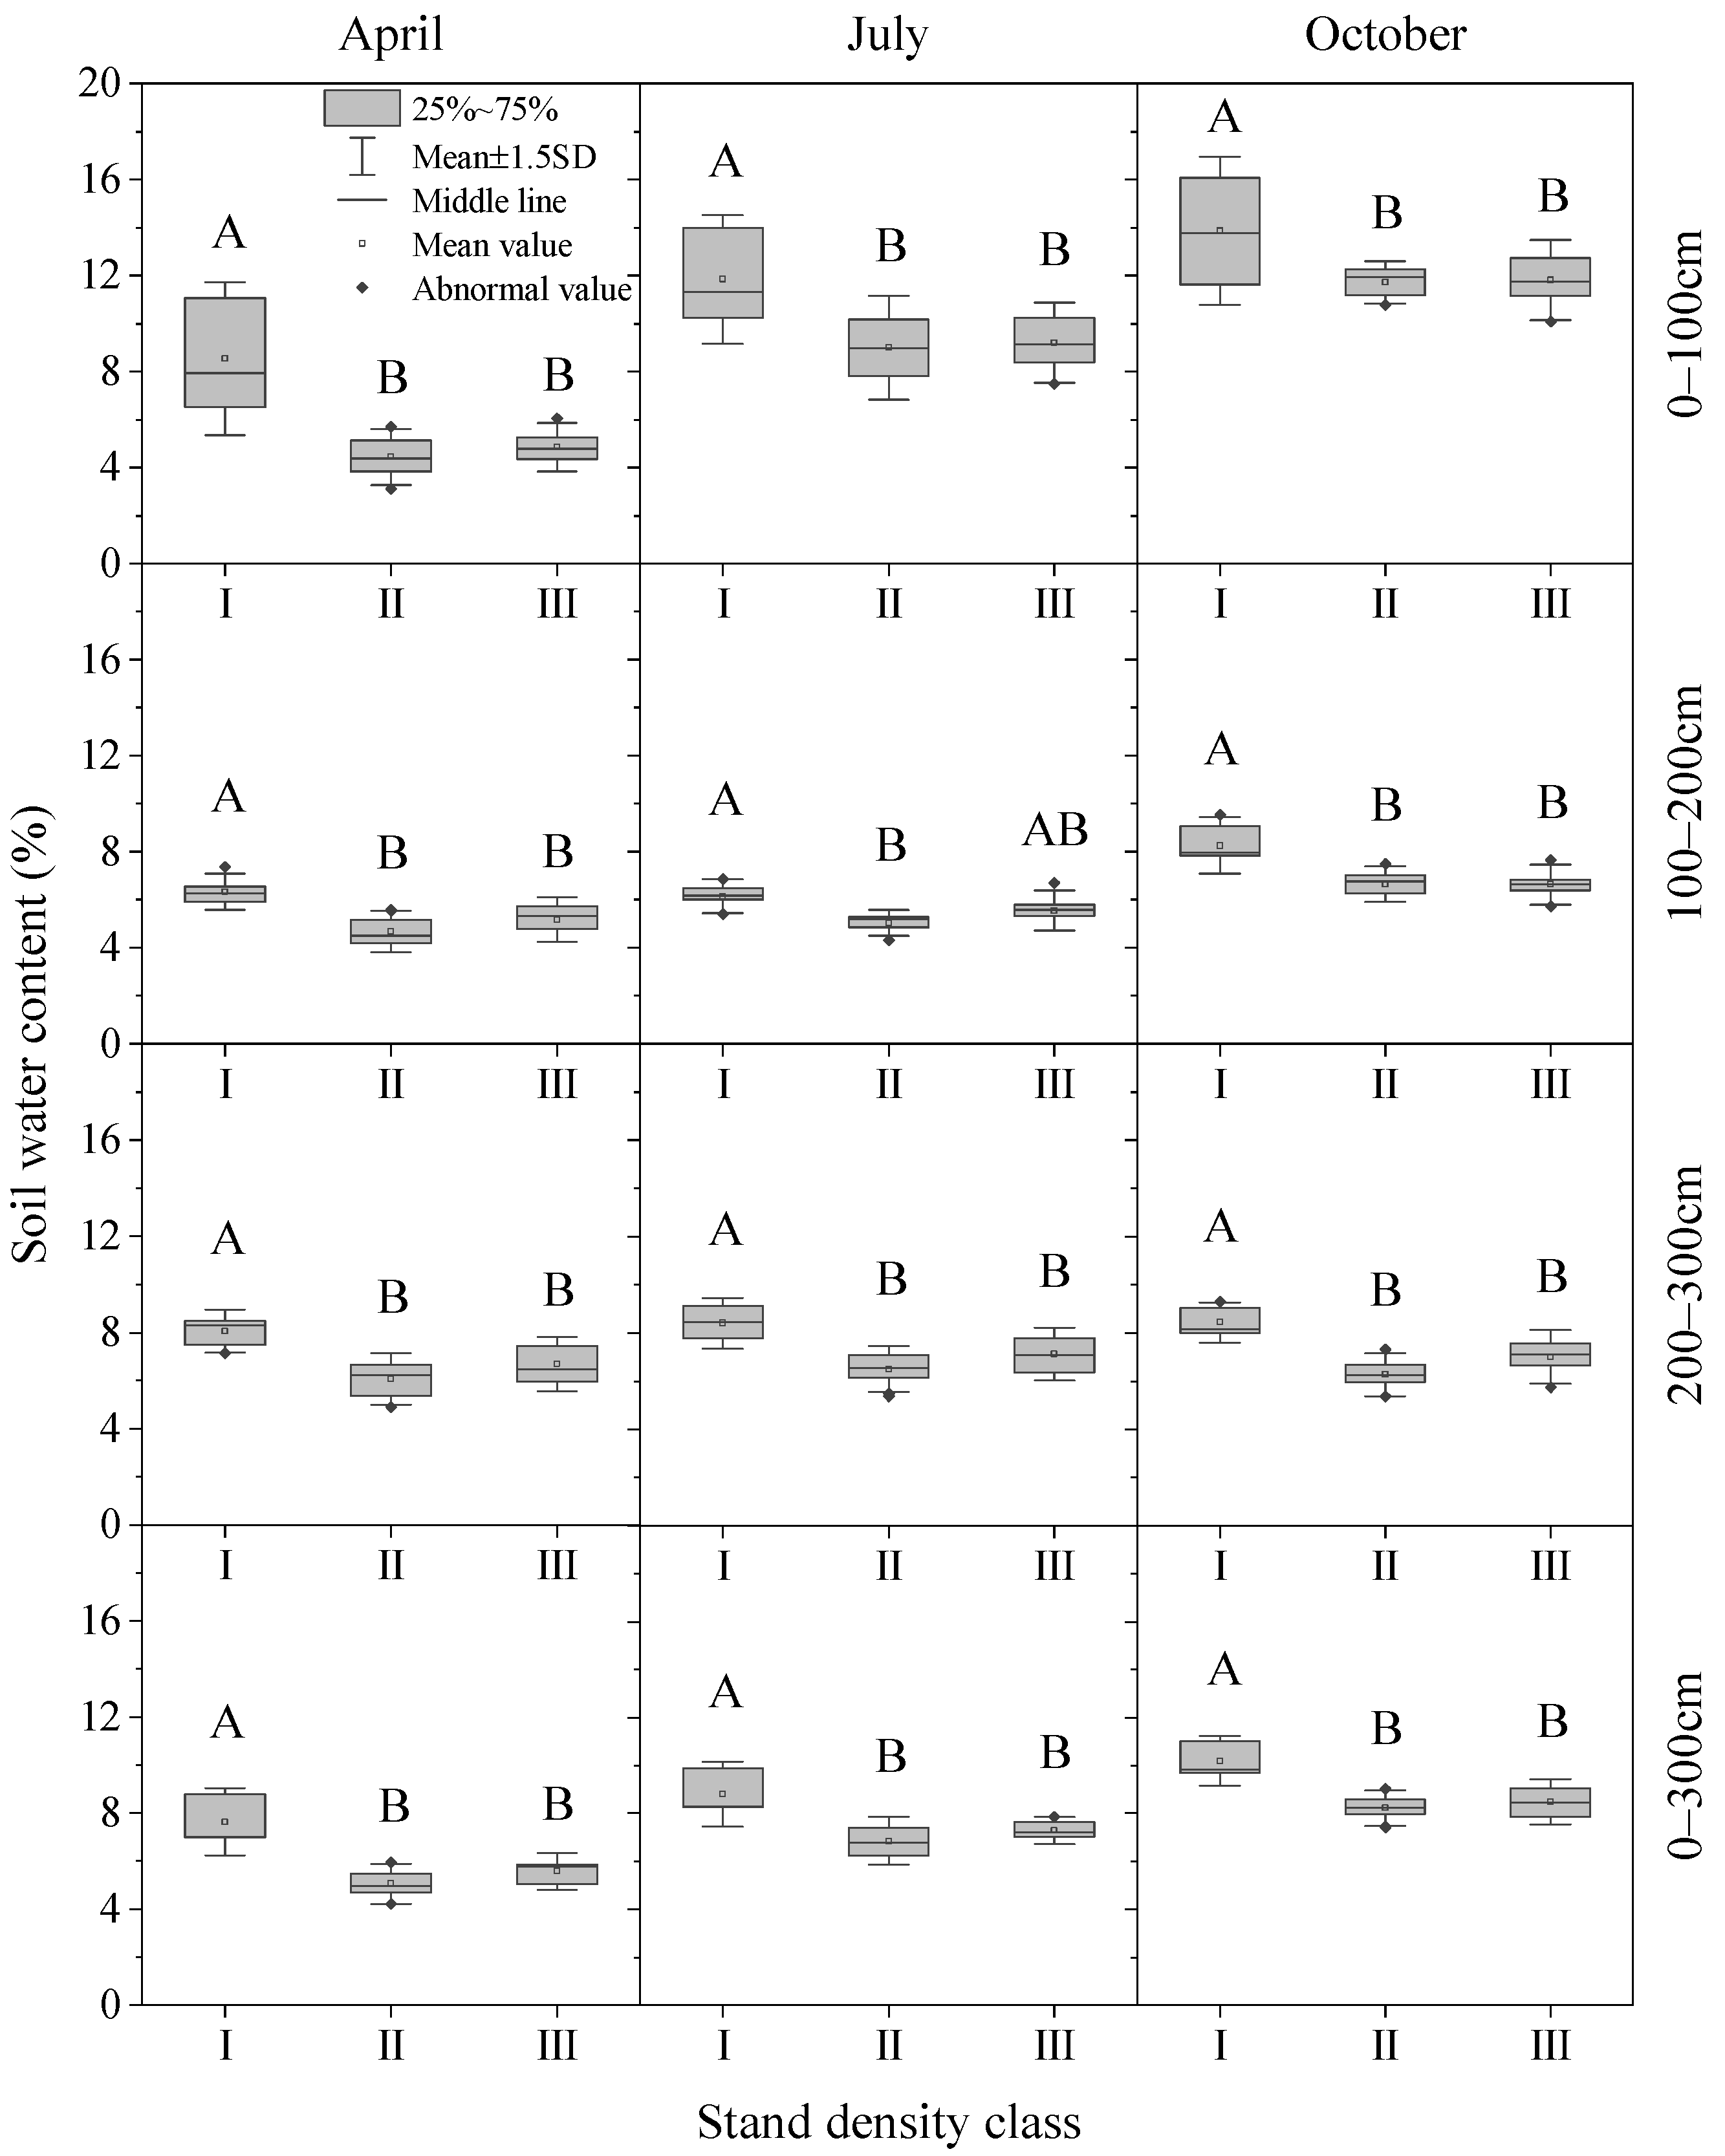
3.2.2. Temporal Variations in SWC in Different Soil Layers and Density Classes

The average SWC of each soil layer in density class I was always significantly higher than those of density classes II and III (p < 0.01 or p < 0.05), whether at the incipient, middle or last stage of the growth period (Figure 5). Significant difference between density II and III was found only in the 100–200 cm soil layer in the middle of the growing season (p < 0.05), and both of them were similar in each soil layer in other periods. After the combined effect of rainfall replenishment and evapotranspiration over the whole growing season, the SWC in all density classes increased in all soil layers with the 0–100 cm being the most obvious.

3.2.3. Monthly Variation Degree of SWC with Density Gradient

Monthly variation coefficients of the average SWC in different soil layers of the three density classes are shown in Figure 6. For each density class, the upper layer (0–100 cm) showed greater variation, with the deep soil (200–300 cm) being stable. Among the three density classes, class I showed significantly lower monthly variation coefficients than the other two classes except for the layer of 200–300 cm (p < 0.01 or p < 0.05), and there was no significant difference observed between density II and III. In the layer of 200–300 cm, monthly variation coefficients were similar among the density classes.

3.3. Effect of Stand Density on Soil Nutrient Condition

To investigate the effect of stand density on soil nutrient conditions, we compared six nutrient indices among the three density classes in each layer along the soil profiles. Overall, the contents of SOC, TN, AP, and NO3-N in the plantations showed a decreasing trend of vertical distribution along the soil profiles, whereas the vertical distribution of TP and NH4+-N were relatively stable (Figure 7). As for the differences between the density classes, no statistical significance was achieved either in the average content of each nutrient or in the content of each nutrient in any vertical layers. Particularly, the contents of TN, TP, NO3-N, and AP were very similar among the three density classes.

4. Discussion

4.1. Lower Density Is Beneficial to Stand Growth of the Plantations

Forest stand density has a great influence on the DBH and height of trees [54]. The present result is consistent with the common recognition that the main distribution range of the DBH shifted downward with the increase in the stand density (Figure 1a). Higher density also resulted in substantially smaller trees and the distribution of tree height changed from unimodal to nearly bimodal, though the main distribution peaks were close among the density classes (Figure 1b). Due to an increase in forest canopy density with the increase in the stand density, trees tend to sacrifice diameter growth for sustained height growth in order to obtain better lighting conditions [55]. However, stand density increase will cause more root overlap between trees and more competition for water and nutrients [56]. Deficiency of light and water conditions is a common problem that suppresses the plantations with a high density. Eventually, the proportion of stunted trees escalated with the stand density increasing.
During the observation period from 2018 to 2022, the DBH and tree height of these plantations showed a linearly growing trend on an inter-annual scale (Figure 2). Regression analyses confirmed that a lower density not only had the distribution peak of a larger diameter class, but also facilitated the rapid growth of the DBH. This was consistent with the study on the effect of thinning management for black locust plantations [57].
The biomass density of the plantations was not positively correlated with the stand density in this research, but reached the maximal value in the density class II (Figure 3). However, higher growth rates for biomass density and individual trees appeared in plots of lower stand density. This suggests that lower density is conducive to the rapid growth of trees and particularly beneficial to the cultivation of good-quality trees. Similar results were reported for black locust plantations with the density range of 1775–3050 stems ha−1 that higher stand density inhibited the growth and development of single trees, leading to a smaller growth of the DBH, tree height, and tree volume. Moreover, such inhibiting effects became increasingly intense with the increase in stand age [58].

4.2. Plantation with Lower Density Has Better Soil Moisture Conditions

In this semiarid region, forest ecosystems are frequently affected by a water resources shortage. Through the effects on the spatial structure of forests and various ecological factors, the stand density must affect rainfall infiltration and forest evapotranspiration [35]. This could be reflected by the spatio-temporal dynamic of the SWC. Vertical distribution patterns of the SWC within different stages of the growing season were similar among density classes in this research (Figure 4), which are basically consistent with the results of other research in this region [9,59,60]. Just like the rainfall infiltration pattern of forest land in this region [61], the depth of the water infiltration clearly increased with the increase in rainfall (Figure 4). However, it should be mentioned that the depth of effective replenishment at the end of the growing season (October) reduced with the increase in stand density (Figure 4). Furthermore, there were significant differences in the mean SWC of different density classes (Figure 5). The overall moisture condition in density class I was always better than that in class II and III in each soil layer. In other words, the plantation with a lower density always has better soil moisture conditions.
In general, the temporal variation in the SWC in the deeper soil is relatively stable compared with that in the near-surface soil [62]. The stability of the SWC in this study also increased with the deepening of the soil layer (Figure 6). However, except for the similarity of the three density classes in 200–300 cm soil layer, the monthly variation coefficient in density class I was significantly lower than that of density II and III. This suggests that the SWC in higher density classes tends to be easily affected by various environmental factors.

4.3. Effect of Stand Density on Soil Nutrients in These Plantations Was Not Significant in the Present Growth Years

Stand density builds different soil environments that influence the effectiveness of soil nutrients [63], and is considered to be one of the important elements affecting soil nutrient conditions [64]. In this study, the vertical distribution patterns of nutrient contents were generally consistent with those found in other studies. However, no significant difference between density classes was achieved either in the average content of each nutrient or in the content for each nutrient in any vertical layers. In particular, the contents of TN, TP, NO3-N and AP were very similar among the three density classes. A modelling analysis on black locust plantations also suggested that the stand structure had a comparatively smaller degree of impact on soil nutrient conditions, especially on phosphorous contents [65]. A proper explanation for the small influence of the stand density could be attributed to the relatively small stand age and the same background of land use. Before the “Grain for Green” project, there should be little difference in soil nutrients between the plantations due to the long-term cultivation of the cropland under similar fertilization management [51]. After replacing the cropland, the forest vegetation would change soil nutrient types and distribution gradually by changing the decomposition input of the litter, fine root yield and turnover rate [66,67]. Disparities in soil nutrients between different stand densities may gradually develop. Clearly, this natural change in the soil chemical property is a relatively long process. Some studies on black locust plantations of ages of up to 25 years detected significant differences in some soil nutrient types between stand density classes [68,69]. Nevertheless, it should be reasonable for the present 17-year-old plantations that soil nutrient contents did not significantly differ between the three density classes. Long-term studies will be beneficial to clarifying the density effects on soil nutrients with respect to the change in forest age in the black locust plantations in this region.

5. Conclusions

The proportion of stunted trees in black locust plantations increased with the increase in the density class. The plantation with a stand density of less than 2500 stems ha−1 not only has a DBH distribution peak with a larger diameter class, but also is beneficial to the rapid growth of the DBH and biomass per tree. However, there was no significant influence on growth rates of the mean tree height and biomass density from the stand density. The maximum biomass density and relatively high soil NH4+-N content appeared in the density class of 2500–3500 stems ha−1. The temporal stability of the SWC on a seasonal scale increases with the deepening of the soil layer. In other words, soil water replenishment reduced with a deepening of the soil layer, and vertical distribution in the deep soil layer (200–300 cm) remained relatively stable. With the rainfall increasing, the depth of water infiltration clearly increased, but the depth of soil water effectively replenishment in the last stage of the growth period reduced with the increase in the stand density. The water content and temporal stability in the 0–300 cm soil layer are the best in the plantation with a stand density of less than 2500 stems ha−1. The contents of SOC, TN, NO3-N, and AP in the soil were negatively correlated with the depth, while the contents of TP and NH4+-N were not significantly affected by the depth. It was not sufficient to cause significant differences between stand density classes in the nutrient contents during 17 years of development after the conversion of croplands with similar management history to forests. Overall, the stand condition of density class I is superior at present. With the stand age increasing, thinning of the stand density may be needed to maintain the best stand condition even for the density class I. The results contribute to an in-depth understanding of the relations between the density gradient and multiple variables in the plantations, which would offer a reference for the forest management and sustainable development of ecosystems in the semiarid region of the Loess Plateau.

Author Contributions

Conceptualization, B.Z. and S.D.; methodology, B.Z. and S.D.; investigation, B.Z., M.S., X.S. and Y.Z.; data curation, B.Z., M.S., X.S., Y.Z. and G.L.; writing—original draft preparation, B.Z.; writing—review and editing, G.L. and S.D.; funding and project administration, S.D. All authors have read and agreed to the published version of the manuscript.

Funding

This study was supported by the National Key R&D Program of China (2017YFC0504601).

Institutional Review Board Statement

Not applicable.

Informed Consent Statement

Not applicable.

Data Availability Statement

Data are available upon reasonable request to the corresponding author.

Acknowledgments

The authors thank the auxiliary classmates who collaborated in the collection of experimental data.

Conflicts of Interest

Author Xiaojuan Shen was employed by the company Chongqing Forestry Investment Development Co., Ltd. The remaining authors declare that the research was conducted in the absence of any commercial or financial relationships that could be construed as a potential conflict of interest.

References

  1. Li, Y.K.; Ni, J.; Yang, Q.K.; Li, R. Human impacts on soil erosion identified using land-use changes: A case study from the Loess Plateau, China. Phys. Geogr. 2006, 27, 109–126. [Google Scholar] [CrossRef]
  2. He, X.B.; Zhou, J.; Zhang, X.B.; Tang, K.L. Soil erosion response to climatic change and human activity during the Quaternary on the Loess Plateau, China. Reg. Environ. Chang. 2006, 6, 62–70. [Google Scholar] [CrossRef]
  3. Liu, J.G.; Li, S.X.; Ouyang, Z.Y.; Tam, C.; Chen, X.D. Ecological and socioeconomic effects of China’s policies for ecosystem services. Proc. Natl. Acad. Sci. USA 2008, 105, 9477–9482. [Google Scholar] [CrossRef] [PubMed]
  4. Jin, T.T.; Fu, B.J.; Liu, G.H.; Wang, Z. Hydrologic feasibility of artificial forestation in the semi-arid Loess Plateau of China. Hydrol. Earth Syst. Sci. 2011, 15, 2519–2530. [Google Scholar] [CrossRef]
  5. Deng, L.; Liu, G.B.; Shangguan, Z.P. Land-use conversion and changing soil carbon stocks in China’s ‘Grain-for-Green’ Program: A synthesis. Glob. Chang. Biol. 2014, 20, 3544–3556. [Google Scholar] [CrossRef] [PubMed]
  6. Li, G.Q.; Xu, G.H.; Guo, K.; Du, S. Mapping the global potential geographical distribution of black locust (Robinia pseudoacacia L.) using herbarium data and a maximum entropy model. Forests 2014, 5, 2773–2792. [Google Scholar] [CrossRef]
  7. Zhang, Q.D.; Wei, W.; Chen, L.D.; Yang, L. The joint effects of precipitation gradient and afforestation on soil moisture across the Loess Plateau of China. Forests 2019, 10, 285. [Google Scholar] [CrossRef]
  8. Jiao, L.; An, W.M.; Li, Z.S.; Gao, G.Y.; Wang, C. Regional variation in soil water and vegetation characteristics in the Chinese Loess Plateau. Ecol. Indic. 2020, 115, 106399. [Google Scholar] [CrossRef]
  9. Liang, H.B.; Xue, Y.Y.; Li, Z.S.; Wang, S.; Wu, X.; Gao, G.Y.; Liu, G.H.; Fu, B.J. Soil moisture decline following the plantation of Robinia pseudoacacia forests: Evidence from the Loess Plateau. For. Ecol. Manag. 2018, 412, 62–69. [Google Scholar] [CrossRef]
  10. Jiao, L.; Lu, N.; Fu, B.J.; Gao, G.Y.; Wang, S.; Jin, T.T.; Zhang, L.W.; Liu, J.B.; Zhang, D. Comparison of transpiration between different aged black locust (Robinia pseudoacacia) trees on the semi-arid Loess Plateau, China. J. Arid Land 2016, 8, 604–617. [Google Scholar] [CrossRef]
  11. Zhang, J.G.; Guan, J.H.; Shi, W.Y.; Yamanaka, N.; Du, S. Interannual variation in stand transpiration estimated by sap flow measurement in a semi-arid black locust plantation, Loess Plateau, China. Ecohydrology 2015, 8, 137–147. [Google Scholar] [CrossRef]
  12. Hou, G.R.; Bi, H.X.; Wei, X.; Wang, N.; Cui, Y.H.; Zhao, D.Y.; Ma, X.Z.; Wang, S.S. Optimal configuration of stand structures in a low-efficiency Robinia pseudoacacia forest based on a comprehensive index of soil and water conservation ecological benefits. Ecol. Indic. 2020, 114, 106308. [Google Scholar] [CrossRef]
  13. Zhao, X.K.; Li, Z.Y.; Zhu, D.H.; Zhu, Q.K.; Robeson, M.D.; Hu, J. Revegetation using the deep planting of container seedlings to overcome the limitations associated with topsoil desiccation on exposed steep earthy road slopes in the semiarid loess region of China. Land Degrad. Dev. 2018, 29, 2797–2807. [Google Scholar] [CrossRef]
  14. Wang, L.; Shao, M.A.; Hou, Q.C.; Yang, G.M. The analysis of dried soil layer of artificial Robinia pseudoacacia forestry land in the Yan’an experimental area. Acta Bot. Boreali-Occident. Sin. 2001, 21, 101–106. [Google Scholar] [CrossRef]
  15. Wang, Y.H.; Yu, P.T.; Feger, K.H.; Wei, X.H.; Sun, G.; Bonell, M.; Xiong, W.; Zhang, S.L.; Xu, L.H. Annual runoff and evapotranspiration of forestlands and non-forestlands in selected basins of the Loess Plateau of China. Ecohydrology 2011, 4, 277–287. [Google Scholar] [CrossRef]
  16. Shao, M.A.; Wang, Y.Q.; Xia, Y.Q.; Jia, X.X. Soil drought and water carrying capacity for vegetation in the critical zone of the Loess Plateau: A review. Vadose Zone J. 2018, 17, 170077. [Google Scholar] [CrossRef]
  17. Jia, X.X.; Shao, M.A.; Zhu, Y.J.; Luo, Y. Soil moisture decline due to afforestation across the Loess Plateau, China. J. Hydrol. 2017, 546, 113–122. [Google Scholar] [CrossRef]
  18. Burkhart, H.E. Comparison of maximum size-density relationships based on alternate stand attributes for predicting tree numbers and stand growth. For. Ecol. Manag. 2013, 289, 404–408. [Google Scholar] [CrossRef]
  19. Moreno, G.; Cubera, E. Impact of stand density on water status and leaf gas exchange in Quercus ilex. For. Ecol. Manag. 2008, 254, 74–84. [Google Scholar] [CrossRef]
  20. Ji, L.B.; Shu, D.W. Influence of stand density of Cunninghamia lanceolate on stand growth. For. Inventory Plan. 2017, 42, 135–137. [Google Scholar] [CrossRef]
  21. Martin-Benito, D.; Del Rio, M.; Heinrich, I.; Helle, G.; Canellas, I. Response of climate-growth relationships and water use efficiency to thinning in a Pinus nigra afforestation. For. Ecol. Manag. 2010, 259, 967–975. [Google Scholar] [CrossRef]
  22. Forrester, D.I.; Collopy, J.J.; Beadle, C.L.; Baker, T.G. Effect of thinning, pruning and nitrogen fertiliser application on light interception and light-use efficiency in a young Eucalyptus nitens plantation. For. Ecol. Manag. 2013, 288, 21–30. [Google Scholar] [CrossRef]
  23. Cai, H.Y.; Di, X.Y.; Chang, S.X.; Jin, G.Z. Stand density and species richness affect carbon storage and net primary productivity in early and late successional temperate forests differently. Ecol. Res. 2016, 31, 525–533. [Google Scholar] [CrossRef]
  24. Comita, L.S.; Queenborough, S.A.; Murphy, S.J.; Eck, J.L.; Xu, K.Y.; Krishnadas, M.; Beckman, N.; Zhu, Y. Testing predictions of the Janzen-Connell hypothesis: A meta-analysis of experimental evidence for distance- and density-dependent seed and seedling survival. J. Ecol. 2014, 102, 845–856. [Google Scholar] [CrossRef] [PubMed]
  25. Farooq, T.H.; Shakoor, A.; Rashid, M.H.U.; Zhang, S.Y.; Wu, P.F.; Yan, W.D. Annual growth progression, nutrient transformation, and carbon storage in tissues of Cunninghamia lanceolata monoculture in relation to soil quality indicators influenced by intraspecific competition intensity. J. Soil Sci. Plant Nutr. 2021, 21, 3146–3158. [Google Scholar] [CrossRef]
  26. Lochhead, K.D.; Comeau, P.G. Relationships between forest structure, understorey light and regeneration in complex Douglas-fir dominated stands in south-eastern British Columbia. For. Ecol. Manag. 2012, 284, 12–22. [Google Scholar] [CrossRef]
  27. Zheng, Y.; Zhou, J.J.; Zhou, H.; Zhao, Z. Photosynthetic carbon fixation capacity of black locust in rapid response to plantation thinning on the semiarid Loess Plateau in China. Pak. J. Bot. 2019, 51, 1365–1374. [Google Scholar] [CrossRef]
  28. Makinen, H.; Hein, S. Effect of wide spacing on increment and branch properties of young Norway spruce. Eur. J. For. Res. 2006, 125, 239–248. [Google Scholar] [CrossRef]
  29. Benomar, L.; DesRochers, A.; Larocque, G.R. The effects of spacing on growth, morphology and biomass production and allocation in two hybrid poplar clones growing in the boreal region of Canada. Trees-Struct. Funct. 2012, 26, 939–949. [Google Scholar] [CrossRef]
  30. Andrews, C.M.; D’Amato, A.W.; Fraver, S.; Palik, B.; Battaglia, M.A.; Bradford, J.B. Low stand density moderates growth declines during hot droughts in semi-arid forests. J. Appl. Ecol. 2020, 57, 1089–1102. [Google Scholar] [CrossRef]
  31. Wang, T.; Xu, Q.; Gao, D.Q.; Zhang, B.B.; Zuo, H.J.; Jiang, J. Effects of thinning and understory removal on the soil water-holding capacity in Pinus massoniana plantations. Sci. Rep. 2021, 11, 13029. [Google Scholar] [CrossRef] [PubMed]
  32. Zhang, J.J.; Finley, K.A.; Johnson, N.G.; Ritchie, M.W. Lowering stand density enhances resiliency of ponderosa pine forests to disturbances and climate change. For. Sci. 2019, 65, 496–507. [Google Scholar] [CrossRef]
  33. Sanchez-Salguero, R.; Camarero, J.J.; Dobbertin, M.; Fernandez-Cancio, A.; Vila-Cabrera, A.; Manzanedo, R.D.; Zavala, M.A.; Navarro-Cerrillo, R.M. Contrasting vulnerability and resilience to drought-induced decline of densely planted vs. natural rear-edge Pinus nigra forests. For. Ecol. Manag. 2013, 310, 956–967. [Google Scholar] [CrossRef]
  34. Gavinet, J.; Ourcival, J.M.; Gauzere, J.; de Jalon, L.G.; Limousin, J.M. Drought mitigation by thinning: Benefits from the stem to the stand along 15 years of experimental rainfall exclusion in a holm oak coppice. For. Ecol. Manag. 2020, 473, 118266. [Google Scholar] [CrossRef]
  35. Tsamir, M.; Gottlieb, S.; Preisler, Y.; Rotenberg, E.; Tatarinov, F.; Yakir, D.; Tague, C.; Klein, T. Stand density effects on carbon and water fluxes in a semi-arid forest, from leaf to stand-scale. For. Ecol. Manag. 2019, 453, 117573. [Google Scholar] [CrossRef]
  36. Aldea, J.; Bravo, F.; Bravo-Oviedo, A.; Ruiz-Peinado, R.; Rodriguez, F.; del Rio, M. Thinning enhances the species-specific radial increment response to drought in Mediterranean pine-oak stands. Agric. For. Meteorol. 2017, 237, 371–383. [Google Scholar] [CrossRef]
  37. Simonin, K.; Kolb, T.E.; Montes-Helu, M.; Koch, G.W. The influence of thinning on components of stand water balance in a ponderosa pine forest stand during and after extreme drought. Agric. For. Meteorol. 2007, 143, 266–276. [Google Scholar] [CrossRef]
  38. Yang, X.; Li, T.C.; Shao, M. Factors controlling deep-profile soil organic carbon and water storage following afforestation of the Loess Plateau in China. For. Ecosyst. 2022, 9, 100079. [Google Scholar] [CrossRef]
  39. Wei, X.; Liang, W.J. Regulation of stand density alters forest structure and soil moisture during afforestation with Robinia pseudoacacia L. and Pinus tabulaeformis Carr. on the Loess Plateau. For. Ecol. Manag. 2021, 491, 119196. [Google Scholar] [CrossRef]
  40. Hu, Y.W.; Shi, Z.L.; Liu, C.; Xu, Q.T.; Zhang, J.J. Effects of stand densities on understory vegetation diversity and soil physicochemical properties of Robinia pseudoacacia forest in loess region of western Shanxi Province. Chin. J. Ecol. 2023, 42, 2072–2080. [Google Scholar] [CrossRef]
  41. Zhang, W.; Liu, W.C.; Xu, M.P.; Deng, J.; Han, X.H.; Yang, G.H.; Feng, Y.Z.; Ren, G.X. Response of forest growth to C:N:P stoichiometry in plants and soils during Robinia pseudoacacia afforestation on the Loess Plateau, China. Geoderma 2019, 337, 280–289. [Google Scholar] [CrossRef]
  42. Lei, J.; Du, H.L.; Duan, A.G.; Zhang, J.G. Effect of stand density and soil layer on soil nutrients of a 37-year-old Cunninghamia lanceolata plantation in Naxi, Sichuan Province, China. Sustainability 2019, 11, 5410. [Google Scholar] [CrossRef]
  43. Jonsson, J.A.; Sigurdsson, B.D. Effects of early thinning and fertilization on soil temperature and soil respiration in a poplar plantation. Icel. Agric. Sci. 2010, 23, 97–109. [Google Scholar] [CrossRef]
  44. Ren, L.N.; Wang, H.Y.; Ding, G.D.; Gao, G.L.; Yang, X.J. Effects of Pinus tabulaeformis Carr. plantation density on soil organic carbon and nutrients characteristics in rocky mountain area of northern China. Arid Land Geogr. 2012, 35, 456–464. [Google Scholar] [CrossRef]
  45. He, Z.L.; Zhang, Y.X.; Guo, Y.D.; Yang, S.H.; Ren, D.; Ding, J.W.; Guo, J.P. Soil nutrient characteristics of natural Larix principis-rupprechtii in different stand density. Ecol. Environ. Sci. 2017, 26, 43–48. [Google Scholar] [CrossRef]
  46. Ma, C.K.; Luo, Y.; Shao, M.G. Comparative modeling of the effect of thinning on canopy interception loss in a semiarid black locust (Robinia pseudoacacia) plantation in northwest China. J. Hydrol. 2020, 590, 125234. [Google Scholar] [CrossRef]
  47. Tsunekawa, A.; Liu, G.B.; Yamanaka, N.; Du, S. Restoration and Development of the Degraded Loess Plateau, China; Springer: Tokyo, Japan, 2014; pp. 35–60. [Google Scholar]
  48. Cheng, R.R.; Chen, Q.W.; Zhang, J.G.; Shi, W.Y.; Li, G.Q.; Du, S. Soil moisture variations in response to precipitation in different vegetation types: A multi-year study in the loess hilly region in China. Ecohydrology 2020, 13, e2196. [Google Scholar] [CrossRef]
  49. Zheng, F.L. Effect of vegetation changes on soil erosion on the Loess Plateau. Pedosphere 2006, 16, 420–427. [Google Scholar] [CrossRef]
  50. State Forestry Administration. Regulations for Age-Class and Age-Group Division of Main Tree-Species. 2017, LY/T 2908-2017. Available online: http://lyj.baise.gov.cn/xxgk/zwgk/WJTZ/P020221114703370854900.pdf (accessed on 1 December 2023).
  51. Lyu, C.H.; Xu, Z.Y. Crop production changes and the impact of Grain for Green program in the Loess Plateau of China. J. Arid Land 2020, 12, 18–28. [Google Scholar] [CrossRef]
  52. Zhou, G.Y.; Yin, G.C.; Tang, X.L. Biomass Equation of Carbon Storage in China Forest Ecosystem; Science Press: Beijing, China, 2018. [Google Scholar]
  53. Paine, C.E.T.; Marthews, T.R.; Vogt, D.R.; Purves, D.; Rees, M.; Hector, A.; Turnbull, L.A. How to fit nonlinear plant growth models and calculate growth rates: An update for ecologists. Methods Ecol. Evol. 2012, 3, 245–256. [Google Scholar] [CrossRef]
  54. Kerhoulas, L.P.; Kolb, T.E.; Koch, G.W. Tree size, stand density, and the source of water used across seasons by ponderosa pine in northern Arizona. For. Ecol. Manag. 2013, 289, 425–433. [Google Scholar] [CrossRef]
  55. Pretzsch, H.; Rais, A. Wood quality in complex forests versus even-aged monocultures: Review and perspectives. Wood Sci. Technol. 2016, 50, 845–880. [Google Scholar] [CrossRef]
  56. Hakamada, R.E.; Hubbard, R.M.; Moreira, G.G.; Stape, J.L.; Campoe, O.; Ferraz, S.F.D. Influence of stand density on growth and water use efficiency in Eucalyptus clones. For. Ecol. Manag. 2020, 466, 118125. [Google Scholar] [CrossRef]
  57. Redei, K.; Meilby, H. Effect of thinning on the diameter increment in black locust (Robinia pseudoacacia L.) stands. Silva Gandav. 2000, 5, 63–74. [Google Scholar] [CrossRef]
  58. Wang, S.S. Directional Regulation of Robinia pseudoacacia Forest Density in the Loess Plateau in Western Shanxi, China; Beijing Forestry University: Beijing, China, 2021. [Google Scholar]
  59. Li, J.; Zhao, Z.; Yuan, Z.F.; Wang, D.H.; Hu, X.N. Dynamic model of soil moisture of Robinia pseudoacacia plantations in the Loess Plateau. Acta Bot. Boreali-Occident. Sin. 2014, 34, 1666–1675. [Google Scholar] [CrossRef]
  60. Ding, W.B.; Wang, F.; Jin, K. Effects of rainfall and plant characteristics on the spatiotemporal variation of soil moisture in a black locust plantation (Robinia pseudoacacia) on the Chinese Loess Plateau. Water 2023, 15, 1870. [Google Scholar] [CrossRef]
  61. Zhang, J.X.; Wang, X.; Wang, Y.K.; Jin, S.S. Regularities of rainfall infiltration and water migration in woodland drying soil in the loess hilly region. J. Soil Water Conserv. 2017, 31, 231–238. [Google Scholar] [CrossRef]
  62. Yang, L.; Wei, W.; Chen, L.D.; Chen, W.L.; Wang, J.L. Response of temporal variation of soil moisture to vegetation restoration in semi-arid Loess Plateau, China. CATENA 2014, 115, 123–133. [Google Scholar] [CrossRef]
  63. Bo, H.J.; Wen, C.Y.; Song, L.J.; Yue, Y.T.; Nie, L.S. Fine-root responses of populus tomentosa forests to stand density. Forests 2018, 9, 562. [Google Scholar] [CrossRef]
  64. Zheng, J.M.; Chen, X.Y.; Chen, L.G.; He, T.Y.; Rong, J.D.; Lin, Y.; Zheng, Y.S. Comprehensive evalution of soil quality at different stand densities of Dendrocalamus minor var. amoenus plantations. Appl. Ecol. Environ. Res. 2020, 18, 5985–5996. [Google Scholar] [CrossRef]
  65. Wei, X.; Bi, H.X.; Liang, W.J.; Hou, G.R.; Kong, L.X.; Zhou, Q.Z. Relationship between soil characteristics and stand structure of Robinia pseudoacacia L. and Pinus tabulaeformis Carr. mixed plantations in the Caijiachuan watershed: An application of structural equation modeling. Forests 2018, 9, 124. [Google Scholar] [CrossRef]
  66. Laganiere, J.; Angers, D.A.; Pare, D. Carbon accumulation in agricultural soils after afforestation: A meta-analysis. Glob. Chang. Biol. 2010, 16, 439–453. [Google Scholar] [CrossRef]
  67. Sun, M.M.; Zhai, B.C.; Chen, Q.W.; Li, G.Q.; Du, S. Response of density-related fine root production to soil and leaf traits in coniferous and broad-leaved plantations in the semiarid loess hilly region of China. J. For. Res. 2022, 33, 1071–1082. [Google Scholar] [CrossRef]
  68. Wang, Y.S.; Ma, B.M.; Gao, H.P.; Wang, B.T. Response of soil nutrients and their stoichiometric ratios to stand density in Pinus tabuliformis and Robinia pseudoacacia plantations in the loess region of western Shanxi Province, northern China. J. Beijing For. Univ. 2020, 42, 81–93. [Google Scholar] [CrossRef]
  69. Zhao, J.P. Effects of Mid-Aged Forest Density and Tending Years of Artificial Robinia pseudoacacia on Stand Composition Structure, Plant Functional Traits and Soil Properties; Northwest A&F University: Xianyang, China, 2022. [Google Scholar]
Figure 1. Distribution of tree DBH (a) and height (b) of the plantations for different density classes (survey data in March 2018). I–III in this and subsequent figures represent density classes as <2500 stems ha−1, 2500–3500 stems ha−1, and >3500 stems ha−1, respectively.
Sustainability 16 00376 g001
Figure 2. Changing trend of mean DBH (a) and height (b) as functions of age in the plantations of three density classes (I–III) during the measurement years (the forest age of 17 years corresponds to 2018).
Sustainability 16 00376 g002
Figure 3. Biomass density (a, in 2018), BDGR (b, 2018–2022), and ABGR (c, 2018–2022) in the plantations with three density classes (I–III). Data boxes with different lowercase letters are statistically different (p < 0.05).
Sustainability 16 00376 g003
Figure 4. Vertical distribution of SWC at the incipience, middle, and last stage of growth period of 2019 in the plantations of three density classes (I–III).
Sustainability 16 00376 g004
Figure 5. Average soil water contents at the incipient, middle, and last stage of the growth period of 2019 in different soil layers in the plantations of three density classes. Different capital letters represent a statistical difference (p < 0.01) between the stand density classes (I–III).
Sustainability 16 00376 g005
Figure 6. Monthly variation coefficients (from April to October) of average soil water contents in the plantations with density gradient. Different capital letters represent a statistical difference (p < 0.01) between the stand density classes (I–III).
Sustainability 16 00376 g006
Figure 7. Distribution of different nutrient types along the 0–100 cm soil in different density classes (I–III). Data bars with different lowercase letters are statistically different (p < 0.05).
Sustainability 16 00376 g007
Table 1. General characteristics of sample plots (Survey data in March 2018).
Stand Density (Stems ha−1)Stand Density ClassAltitude (m)Age (Year)Slope (°)pHMean DBH (cm)Mean Tree Height (m)Soil Bulk Density (g cm−3)
2130I129517228.67.97.71.26
2315129517168.78.38.41.26
2497129017148.77.36.51.26
2745II128517178.78.37.81.26
2825115017238.68.08.21.23
3133115017218.79.18.51.23
3478129017138.87.26.81.26
3669III115017218.66.26.21.23
3965128517238.77.17.31.26
4026115017178.76.76.81.23
Note: DBH is the diameter at the breast height (1.3 m). Soil physicochemical properties are averages of measurements along a profile of 0–100 cm as described in the text.
Table 2. Biomass equations for black locust organs [52].
Tree OrgansBiomass Equations
RootsW = 0.0119(DBH2H)0.9501
LeavesW = 0.0060(DBH2H)0.8403
BranchesW = 0.0040(DBH2H)1.0868
StemW = 0.0302(DBH2H)0.9474
Note: W is the biomass of each organ (kg); H is the tree’s height (m).
Disclaimer/Publisher’s Note: The statements, opinions and data contained in all publications are solely those of the individual author(s) and contributor(s) and not of MDPI and/or the editor(s). MDPI and/or the editor(s) disclaim responsibility for any injury to people or property resulting from any ideas, methods, instructions or products referred to in the content.

