Review

Re-Engineering Financial Resources through Development Finance in Africa: A Review of the Literature

by
Abiodun F. Okunlola
* and
Adewale R. Aregbeshola
Department of Business Management, College of Economic and Management Sciences—CEMS, University of South Africa, Tshwane 002, South Africa
*
Author to whom correspondence should be addressed.
Sustainability 2024, 16(1), 214; https://doi.org/10.3390/su16010214
Submission received: 18 October 2023 / Revised: 12 December 2023 / Accepted: 21 December 2023 / Published: 26 December 2023

Abstract

:
Most studies erroneously conclude that financial engineering occurs only within the purview of private institutions. This study defies this claim and affirms an equal public prerogative. It proceeds to innovate a financial re-engineering (F-Re) axiom expressed by the foundational, fundamental, and finance pillars (FFFps). This is encapsulated in a quadrant (Q), with which it is believed Africa’s accelerated development can be harnessed. Exploratorily, in addition to the visual and matching path analyses, this study provides a clear path in Q1–4, showing how Africa should re-engineer citizens’ priorities using deliberate development finance principal strategies going forward.

1. Introduction

The continent of Africa has often been referred to as the world’s gold mine. Given her abundance of oil—crude oil, petroleum, natural gas, and petroleum products, metals and minerals—iron, ore, phosphates, aluminum, and uranium, precious metals and minerals—gold, diamonds, and platinum, wood products—timber, fisheries, agriculture, and natural reserves, the continent’s abundant financial resources cannot be over-emphasized [1,2,3,4,5,6]. Despite the abundance, several studies still claim that the continent remains among the poorest globally and that her development and advancement remain elusive [4,5,7]. Refs. [7,8] claimed that about half of its population lacks decent living standards and lives below USD 1.90 per day. In addition, there are incidences of poor or bad governance, leadership crisis, political instability, financial mismanagement/wastage, and misallocation which have bred insecurity/war, poor health systems, poor educational systems, housing shortfalls or inadequacies, high illiteracy levels, poor/inadequate energy supply, a lack of technology, and corruption which have contributed to the slow advancement of Africa [7,8]. Regrettably, this situation has not abated [7].
In a bid to suggest a way forward, there is a need to structurally re-align and re-engineer the continent’s development path, leveraging the paradigm of development finance (DF) principles and practices [8,9,10]. Although financial engineering mantra has dominated the debate among many scholars as an innovative change tool, especially at the level of the private sector, few have agreed to its incorporation into the way public institutions perform their obligations to citizens. In fact, most studies erroneously conclude that the private sector (especially financial institutions) has a monopoly on engineering financial innovativeness. This thinking is not only shallow, but births this study’s financial re-engineering (F-Re) conceptualization axiom [8,9,10,11,12,13]. Thus, to re-engineer is to rejig the foundational principles underlying a developmental process.
It is noteworthy that the snag of the recent pandemic exposed the fact that global financial sophistication can be hampered, especially when left totally in the hands of the private innovators, to say the least, to a less sophisticated Africa [14,15]. An example is visible in the way China swiftly maneuvered during the pandemic [16,17]—an indication that the institution of government needs a full grasp of citizens’ foundational lives and needs patterns in finance, social, economic, food, education, and health [14,18,19,20,21]. This cannot be over-emphasized in the rejigging phase of Africa’s advancement.
To re-engineer Africa’s financial resources for all-inclusiveness and development, [22,23] claimed that a new strategic financial optimization is imperative. Refs. [23,24,25] corroborated this line of thought when they mentioned that the world’s economic development trajectory typically sits on three financial pillars: the foundational (basics), fundamental (signs/indicators), and financial pillars (driver) (FFFps), i.e., human development finance, capital finance, and technological finance [22,23,24,25]. While it appears that some emerging countries such as the developed East Asian group (called the Asia Tigers), the emerging Southeast Asia group (called the Asia Cubs), the BRICS economies, and a few countries in Africa are making noticeable progress, as evident in the foundational pillar (food, shelter, education, and health), to a larger extent, the progress of the fundamental (technology/innovation and infrastructure finance) and capital finance pillars (financing development) appears slow. This is because the former (foundational), which serves as the major driver of sustainable development (fundamental), has not received prioritized allotment [26,27]. The questions now are: Does this same scenario hold in Africa? Does Africa have any known and sustained records of FFFp investment? What is the state of her financial provisions to basic living needs—food, shelter, education, health, and energy? How well has Africa financed its knowledge economy to harvest future gains? What is the level of Africa’s investment finance in citizenship? Is infrastructural development deeply rooted? How much of her capital is human development driven? Evidently, these questions and more are summed up in [4,5,6], which asked, “why is Africa poor?” This is despite the continent supplying a composite of approximately 87 percent of natural mineral resources, including agriculture, to the rest of the world.
As a result, rather than being swayed by the euphoria of sophistication that describes development (indicators) among the advanced economies, and that of the private sector, this study unveils an F-Re approach as a pivotal tool designed to re-cultivate Africa’s advancement process, re-visits the need for public financial innovativeness, especially in the up-coming big data generation, and provides a financial quadrant solution path (FFFP) for development.
Thus, this study describes F-Re and development finance (DF) as government-deliberate actions aimed at providing a basic economic foundation through identifying and supplying for citizens’ basic needs and systematically channeling its financial resources to achieve all-inclusion.
In the words of [28]:
“With every passing day in Africa, a gazelle wakes up knowing he must outrun the fasted lion or perish. Likewise, a lion stirs and stretches, knowing he must outrun the fastest gazelle or starve…”
Without equivocation, this study is aimed at applying the advantages subsumed in the concepts of F-Re and DF to practically provide a new visible-path solution that re-engineers development patterns for Africa. It intellectually stimulates discussion using an F-Re axiom enshrined in a Quad on how financial resources in Africa can be re-engineered for practical results. Objectively, it situates this by identifying the constituency of F-Re and DF in the quadrant and provides explanatory metrics for future decision-making for Africa.

2. Literature Review

2.1. The Concept of Financial Engineering (FE)

A plethora of studies claim a private institutional monopoly of the concept of financial engineering and its associated computational, technological, and quantitative simulations [29,30]. Thus, the concept is seen as private institution (i.e., financial) biased [31,32,33,34,35,36,37,38,39]. On the one hand, the concept is viewed simply as innovation or re-innovation of financial products and associated accessories, i.e., technology [40,41,42]. On the other hand, some describe the concept as eclectic, containing the application of various disciplines such as statistics, mathematics, engineering, computer science, financial economics, and business analytics to the application of finance-related issues. Others view the concept simply as the interplay of risk management in the financial market and the financial system as a whole [43].
In all, and by implication, financial engineering connotes an act involving the adoption and simulation of related and allied fields of study (especially engineering, computing, and mathematics) for solving finance-related issues. Examples include the design of an automated teller machine, the debit card, credit assessment simulation machine, business analytic tools, international swift transfer, mobile money, digital money, internet banking, crowdfunding, forex transactions, point of sales, derivatives, and crypto currency, to mention a few. In fact, [42] affirmed that the development of financial engineering is inescapably linked to the development of other field of studies which serve as tools for financial interactions, manipulations, simulations, determination, and decision-making. It is also recorded that the act of perfecting counting led to the design of the counting machine which, ultimately, metamorphosed into today’s computer system.
The study (Scheme 1) describes F-Re and development finance (DF) as government-deliberate actions aimed at providing a basic economic foundation through identifying and supplying for citizens’ basic needs and systematically channeling its financial resources to achieve all-inclusion. Simply put, this study re-engineers the financial engineering concept associated mainly with the financial institution/private sector. It thus re-engineers a reset of Africa’s government priorities in its FFF pillars. At first, a clarification is made between the F—foundational, F—fundamental, and F—finance pillars (FFFP). Thereafter, F-Re quadrant modeling is espoused for adoption. Notably, the FFFP is not the inverse of the ideas that propel development (especially the past and ongoing policies across the continent), but differs in priority attention en route to the same purpose. However, the study finds its roots in Maslow’s and Hertzberg’s basic assumption theory of what motivates growth, i.e., what satisfies now and what later comes to satisfies. In other words, unsatisfied needs are basics (foundational) and, when left unsatisfied, distort the fundamentals (signs/indicators) because financial provisions are wrongly allocated—a typical scenario for most African countries [16,17,43,44].

2.2. Development Finance (DF)

Literally speaking, the concept of DF is a combination of two words—development and finance. On the one hand, development connotes every visible manifestation of good living standards socially, economically, and environmentally envisioned by public drive [45,46,47,48]. On the other hand, finance connotes a broad spectrum of theories, principles that guide effective and efficient use of financial resources to achieve prioritized and nominated units of development [45,48]. In this way, finance is pivotal to development—human, capital, and innovation.
However, being a new concept, its clear definition is still vague and devoid of consensus [43,47,48,49,50]. Broadly speaking, its basic meaning covers a greater spectrum of not just financing development but associated linkages. For instance, there are basics: sourcing, allocating, disbursing, utilizing, monitoring, supervising, managing, controlling, evaluating, and re-evaluating of financial resources for nominated but prioritized developmental needs [31]. Also, there are tools of engagement—financing, investments, debt, loans, credit, bonds, shares, equity, dividends, collateral, guarantees, venturing, remediation, bill, and trade money—as well as the visibility of the engagement in communities—rural, urban, towns, and cities—and industries—private, public, and private–public partnership [26,43].
Put together, ref. [49] describes DF as ‘efforts by local communities to support, encourage and catalyze expansion through public/private investment in physical development and redevelopment and or business and industry’. It goes further to say that DF is dedicated to programs expected to provide solutions to pending challenges. In doing this, public authorities are expected to be proactive in leveraging public resources to solve, maintain, and sustain the basic needs of the society.

2.3. Africa Development Finance Outlook

Arguably, no one fundamental pillar has been to Africa’s advantage over time. The recent studies of [11,18,19,51] show that Africa is yet to be on the radar of the minimal development benchmark, while [1,2,7,8,9,10] ask the critical question of ‘why Africa is poor’ despite it supplying 87 percent of the world’s natural and mineral resources. As a measure to address the foundational pillar proposed in this study, and as highlighted in the Oxford Poverty and Human Development Initiative OPHI in 2019, three key indicators of health, education, and living standards are segmented into nutrition, child mortality, years of schooling, school attendance, cooking fuel, sanitation, drinking water, electricity, housing, and assets, attesting to the fact that Africa only leads after Asia as the continent with the poorest people living below USD 1.90 a day [11].
At the macroeconomic level as well, the continent recorded overall real per capita growth of less than 5 percent in the last decade [1,2,4,8]. That is, 3.3 percent growth in 2005, up from 2.4 in 2000, −0.4 percent growth in 2016, and 1.1 and 1.0 percent in 2017 and 2018, respectively [2,4,8]. In addition, Africa’s food imports stand at USD 35 billion yearly with the expectation of a rise of USD 111 billion by 2025 [2,8].
Regionally, across the West, there was a rebound of economic growth of 3.8% in 2022, up from the previous 3.5% in 2021 [1]. Conversely, Southern economic growth performed slightly below expectation, barely reaching 2.7% in 2022 [1,52,53,54]. Ref. [55] affirmed that this was largely due to South Africa’s slow growth because of civil unrest, natural disaster, renewed anti-immigrant protest, cost of living and energy crises, and intense adverse weather. In Central Africa, [56] attests to an improved real gross domestic growth of 5%; however, fiscal spending was −1.8%. North Africa recorded a moderate economic growth of 4.1% in 2022, compared to 5.4% in 2021 [57]. However, this growth was not uniform across the countries within the region. Lastly, in East Africa, [1,58] reported a decline in economic growth from 4.7 to 4.4 in the years 2021 and 2022, respectively. This was largely due to global slow growth, high consumer prices, and adverse weather conditions.
Summarily, a comparative study of advanced economies and emerging China indicates that governments took deliberate action in financing the foundation—education, health, food, housing, and energy—that ultimately yielded the desired indicators as we have it today [6,7]. For instance, America, China, and many other European countries have consistently maintained double-digit funding of basics (foundation). In Africa, fewer countries have this record, and not for that length of time [6].

3. Material and Methods

This is an exploratory study. Exploratory research explores an area of study that has not been previously studied in depth or is new [59]. It also allows the researcher to present a new line of thought with which further development can be reached. In addition, an exploratory research method is adopted to ask and answer pertinent questions that are not well defined, under-investigated, and/or poorly understood [60,61,62,63,64,65]. Thus, to proceed, the study presents descriptive information of the explored concept using visuals and tables. Both provide the summation of a 10-year (2012–2022) trend and a corresponding visual analysis. Subsequently, the study develops further a visual abstraction called the F-Re quadrant (F-Re Quad), labeled Q1–4. For clarity, the F-Re Quad represents the foundational, fundamental, and finance (FFF) pillars of a four-sided item. Q1–Q4 are assigned equal weights of 25 percent, arranged in order of assumed scale-of-development priorities. Thereafter, each of the items is explored and explained for justification of inclusion in the scale. Thereafter, the study creates a matching path analysis in an attempt at justifying what needs are expected to be basics (i.e., foundation) compared to the needs that merely reflect them (fundamental/indicators), which mainly unveils the true development finance priorities.

4. Discussion

An attempt is made to explain and justify the need for Africa’s development finance priorities to be re-engineered. Ab initio, the study proposes a principal strategy—foundation, fundamental, and finance pillars encapsulated in a quadrant labeled Q1 to Q4—which is believed to serve as the pivotal drive. However, prior to this, the study presents some basic data across all countries in the continent and where each one stands in an attempt at justifying their development finance priorities. Additionally, common fundamental indicators are presented in the table as well. This, to a large extent, unveils where the rest of the finances were being allotted over the period in review.
The information in Table 1 attempts to beam a light into justification of the funding of basics—foundational and fundamental—as proposed in the study. A cursory glance indicates the total population in each country (2022 updated estimates) and education expenditure for a ten-year period (2012–2022)—combined education expenditure at all levels: primary, secondary, and tertiary levels. Also presented, is the domestic health expenditure per capita for the same period for all countries. Invariably, this excludes foreign health tourism expenditure incurred by public and private individuals across all levels. Population by multidimensional poverty level as a percentage of total population—PMP—is also presented. Here, data are for the current year (2022) and are as analyzed by [3,18]. Similarly, the Gini index is also presented. The Gini index tells of the level of inequality in a country, and it is measured based on +1 or −1 (100%). The closer it is to 1, the higher the level of inequality in a country. The number in parentheses represents the year in which the Gini measurement was calculated. These data are also sourced from [55,57,58,65,66].

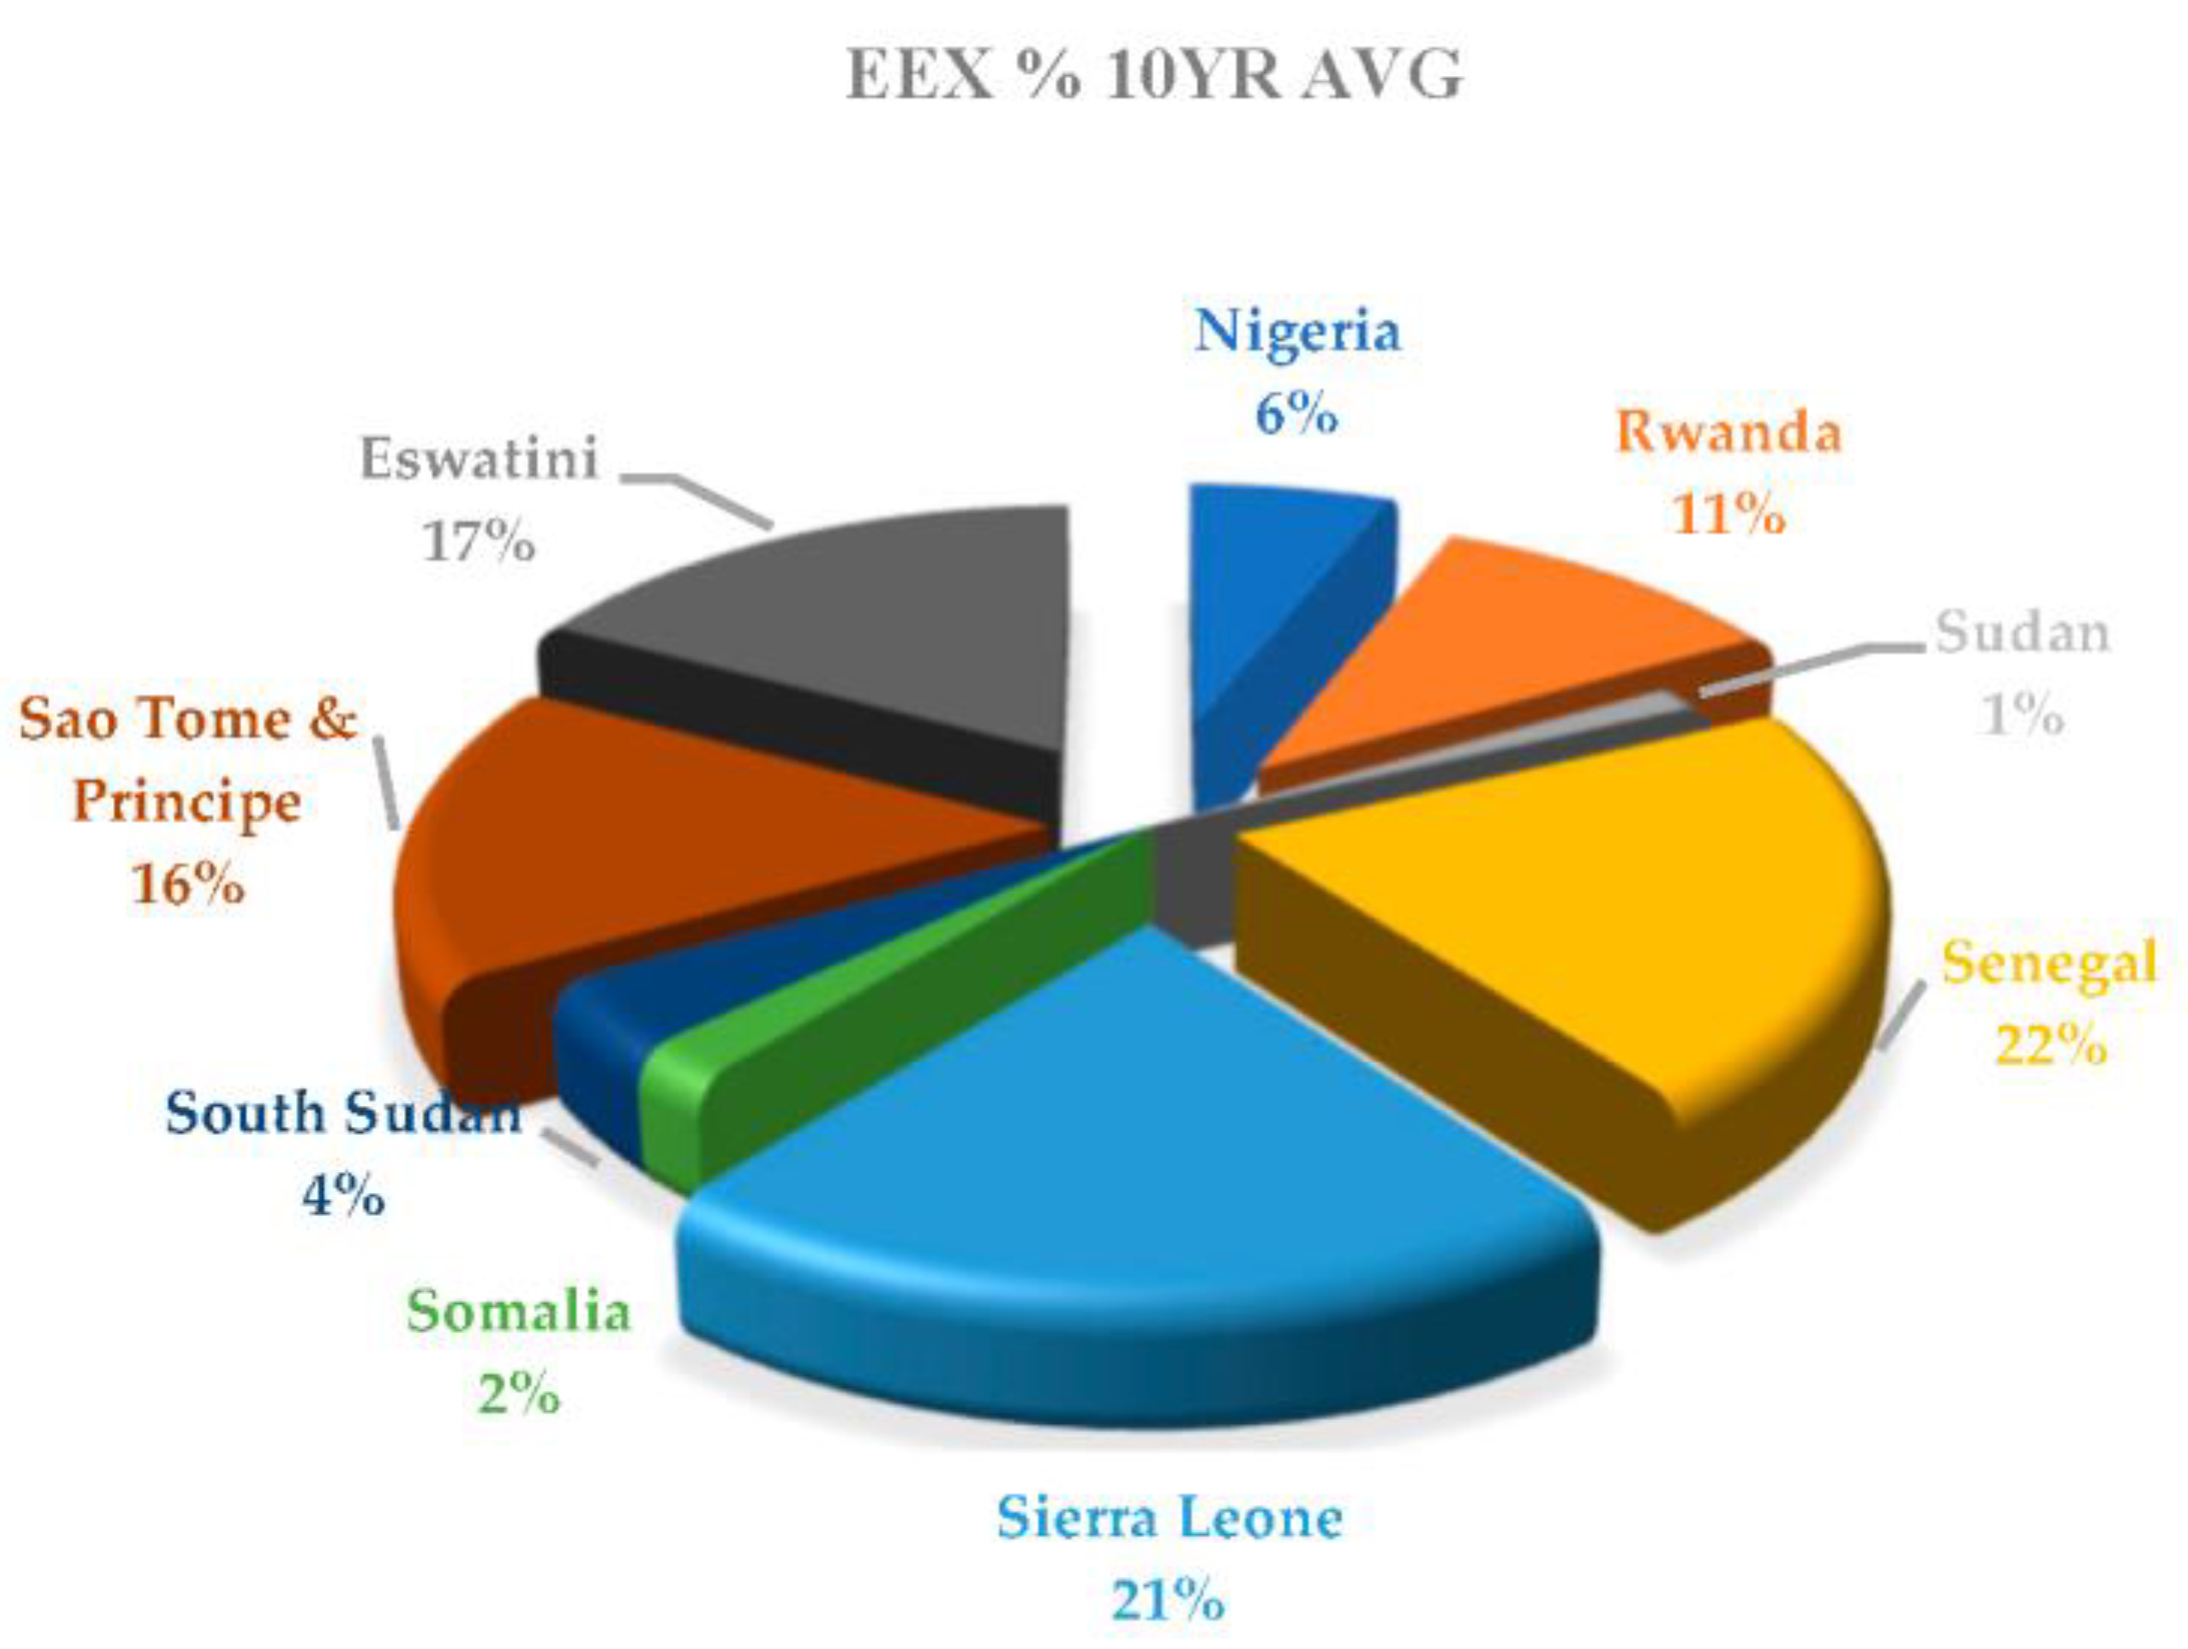
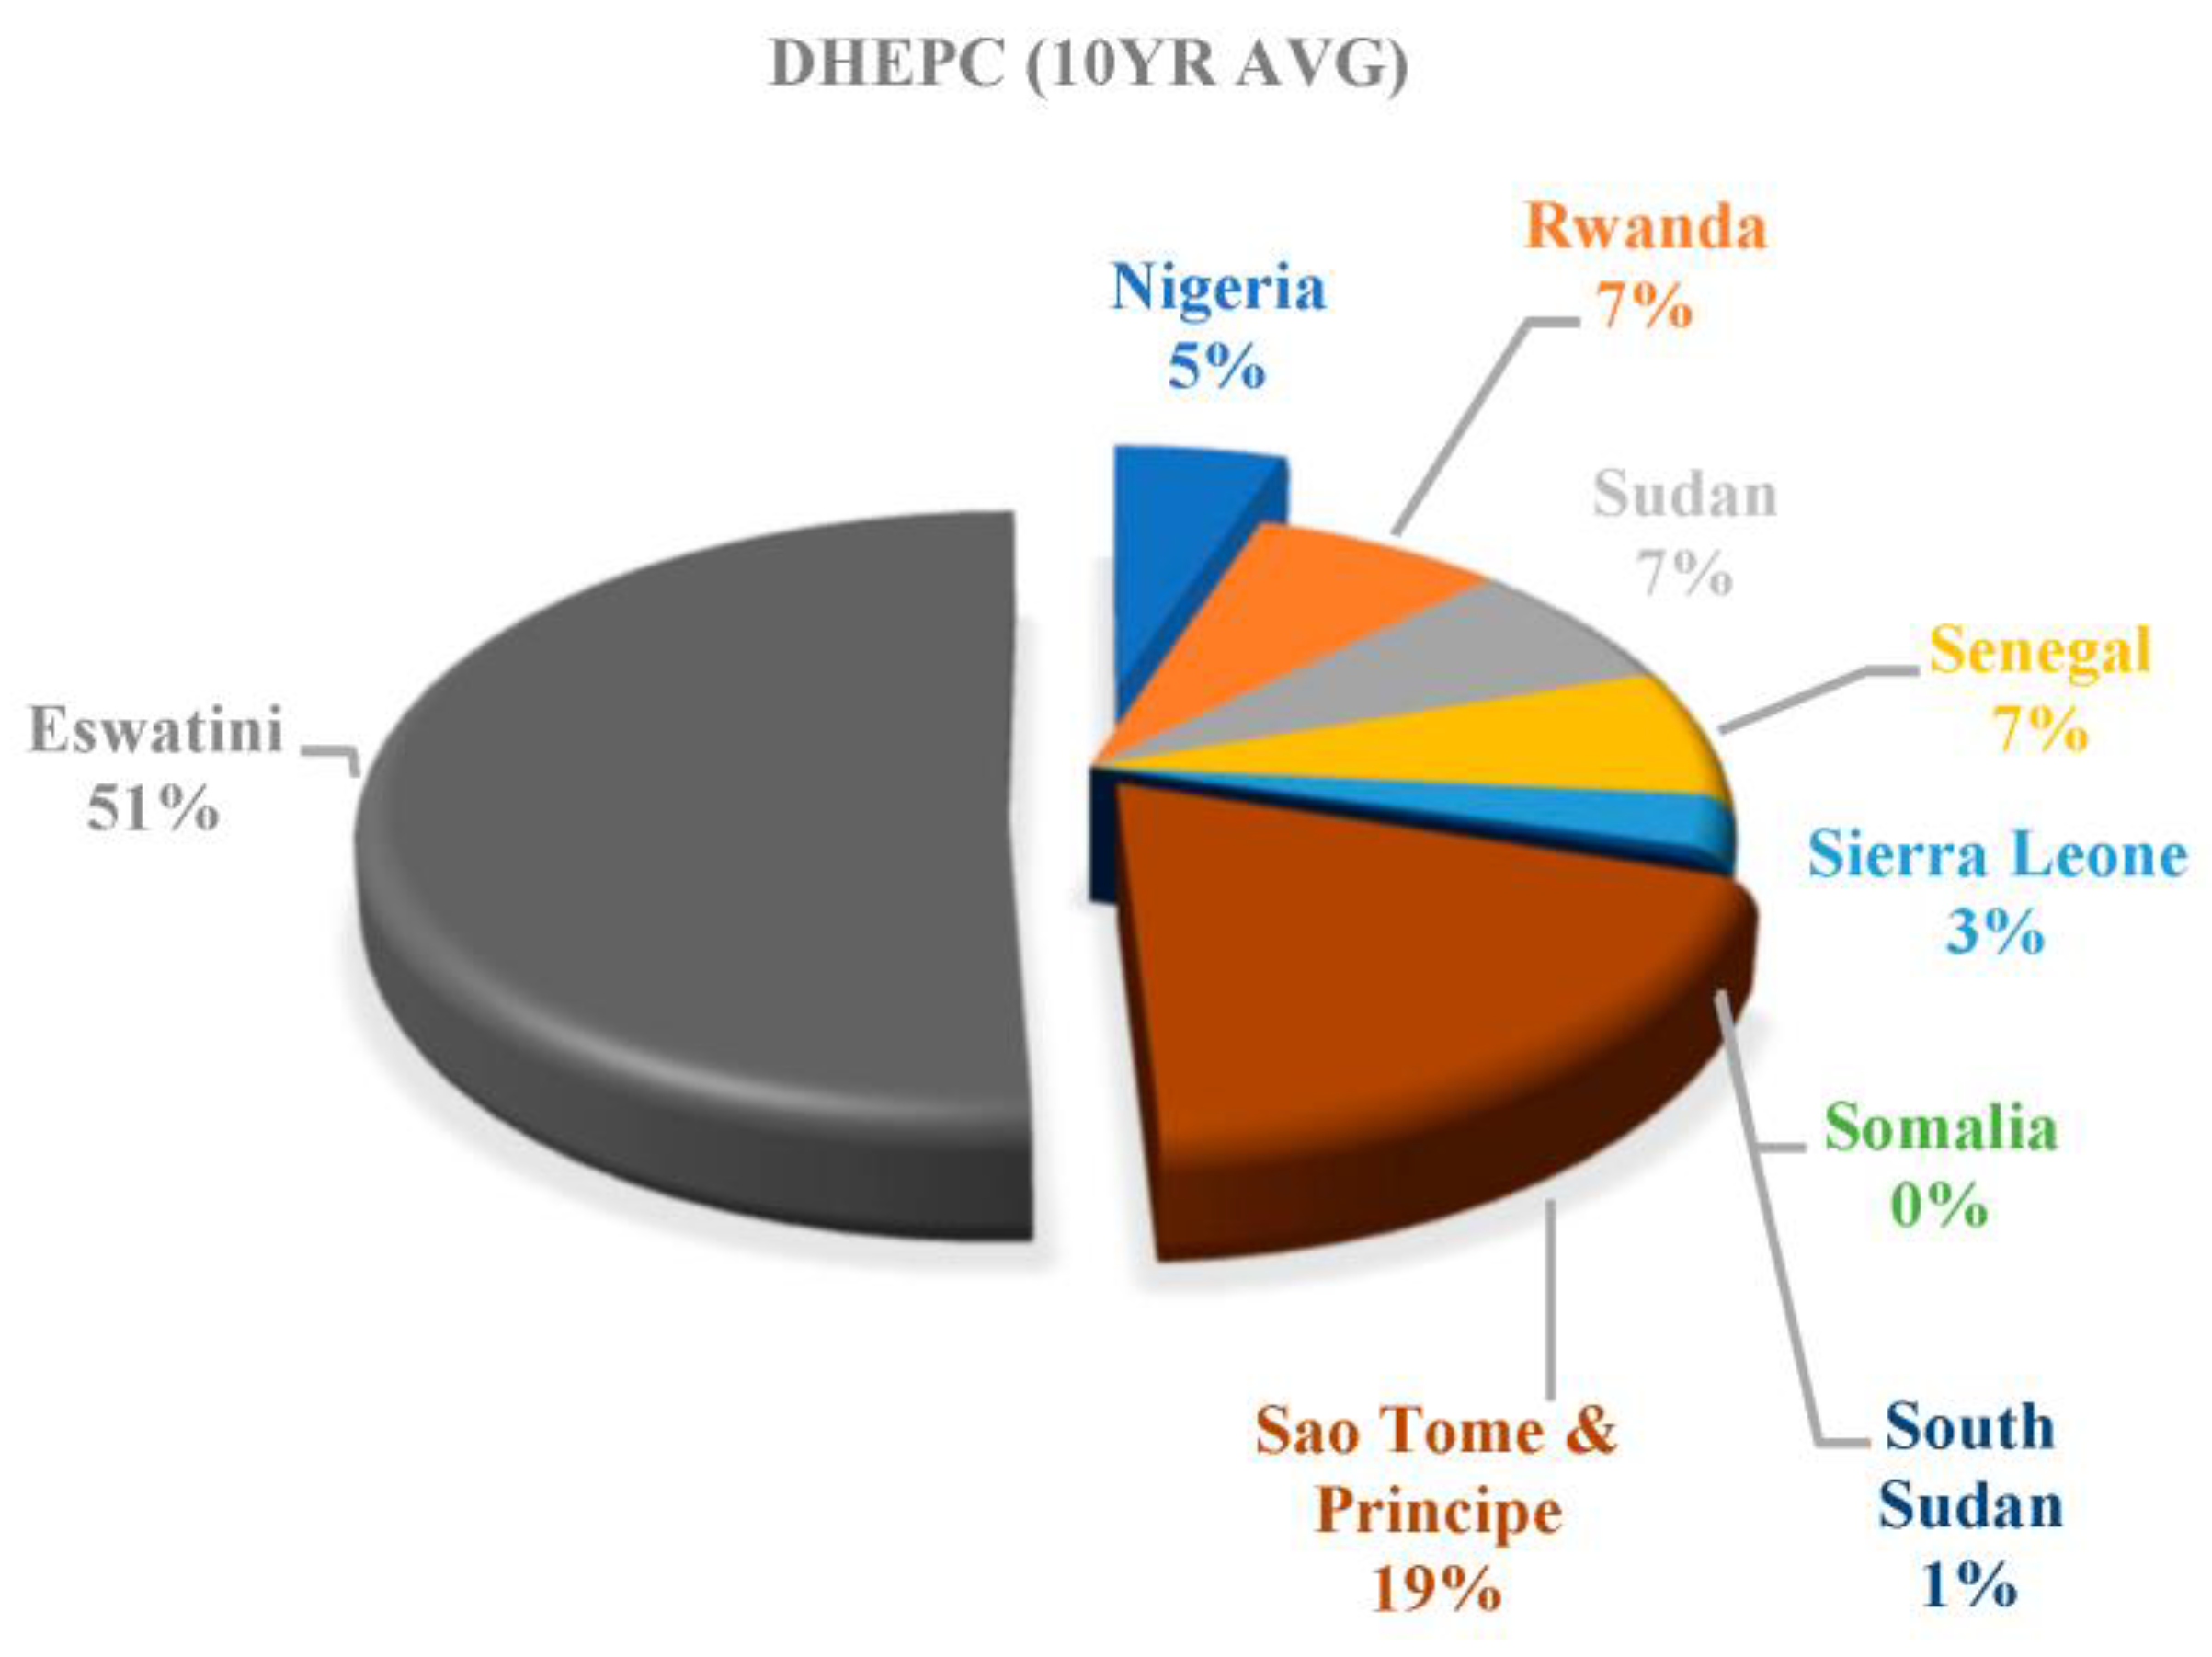
4.1. Government Finance Provision (% of 10-Year Average) across Africa for Basics

Again, the study makes a visual plot of each government’s financing provision as a percentage of the ten-year average across basics—education and health. These are represented by Figure 1, Figure 2, Figure 3, Figure 4, Figure 5, Figure 6, Figure 7, Figure 8, Figure 9, Figure 10, Figure 11 and Figure 12. A glance at Figure 1 indicates that Burkina Faso spent the most, 18.32% as a percentage of the ten-year average. This is followed by Burundi with 17%, Cote d’Ivoire with 15%, Algeria with 13%, Cameroon with 11%, Benin with 9%, Botswana with 8%, and CAR with 7%. In Figure 2, Ethiopia has the highest financing provision of basics at 20% of the ten-year average. This is followed by Cabo Verde—17%, Congo Republic—16%, Gabon—13%, Congo DR—12%, Djibouti—9%, and Egypt Arab Republic—3%, while that of Eritrea is not provided. Going forward, in Figure 3, Equatorial Guinea financed education to the tune of 29% in ten years, Lesotho —12%, Ghana, Guinea, and The Gambia—11%, Kenya, Liberia, and Guinea-Bissau—8%, while the percentage financed by Libya is 0%. In Figure 4, Namibia, Madagascar, Mozambique, Mauritius, Niger, Mali, and Malawi have double-figure financing percentages of 18%, 13%/13%, 12%, 11%/11%, and 10%, respectively. The rest have a percentage below double digits, with 6% for Morocco and Mauritania. In Figure 5, all countries have a double-digit finance provision except for Nigeria with 6% of the ten-year average, Sudan with 1%, South Sudan with 4%, and Somalia with 2%. Others values are: Senegal—22%, Sierra Leone—21%, Eritrea—17%, Sao Tome and Principe—16%, and Rwanda—11%. Likewise, in Figure 6, South Africa, Togo, Zimbabwe, Tanzania, Zambia, and Chad appear to have double-digit figures at 15%/15%, 14%/14%, 12%, and 10%. However, Uganda and Seychelles stand at 9% each, while Tunisia has 2%.
Similarly, for domestic health financing per capita as a percentage of the 10-year total, Figure 7, Figure 8, Figure 9, Figure 10, Figure 11 and Figure 12 provide each country’s provision. Specifically, in Figure 7, Botswana is the largest provider to the tune of 48% for the period under review. This is followed by Algeria at 33%. Angola’s provision is 9%, and Burkina Faso and Cote d’Ivoire have 3%, while Benin, Burundi, and Cameroon have 1% each. In Figure 8, Gabon, Cabo Verde, Egypt, and Djibouti maintain double-digit figures at 36%, 28%, 12%, and 10%, respectively. Others values are: Ethiopia—2%, Congo DR—1%, Congo Rep—7%, and Comoros at 3%. Furthermore, in Figure 9, Equatorial Guinea is the highest provider for the period at 29%. Also, Lesotho’s provision is 23%. Ghana and Kenya stand with 15% each. However, single-digit provision is traceable to Guinea at 3%, The Gambia at 4%, Guinea-Bissau at 2%, and Liberia at 4%. In Figure 10, Mauritius and Namibia hold double-digit provision at 42% and 35%, respectively. Mauritania holds a 4% record, and Mozambique and Malawi hold a 2% record, while Niger, Madagascar, and Mali hold a 1% record accordingly. In Figure 11, Eswatini holds a record of 51% domestic health spending of a 10-year average. This is followed by Sao Tome and Principe at 19%. Others have a single-digit record: Nigeria—5%, and Rwanda, Sudan, and Senegal hold a record of 7% each, while Sierra Leone and South Sudan hold a 0% and 1% record, respectively. Finally, Figure 12 shows that Seychelles holds the highest record at 50%, South Africa comes next at 29%, and then Tunisia at 13%. The rest are single digit—Zambia and Zimbabwe stand at 2% a piece, and Uganda, Tanzania, Togo, and Chad also hold 1% a piece.
This spending typically reflects these countries’ performance and achievement at all levels. Invariably, this spending, in total, falls below the desired amount pivotal to drive the desired development, especially when compared to other climes like China, with a total finance provision of USD 30985.1 million (education) for the same period and USD 4080 million spent on health between 2011 and 2020 [46,55,58,59,60,61].

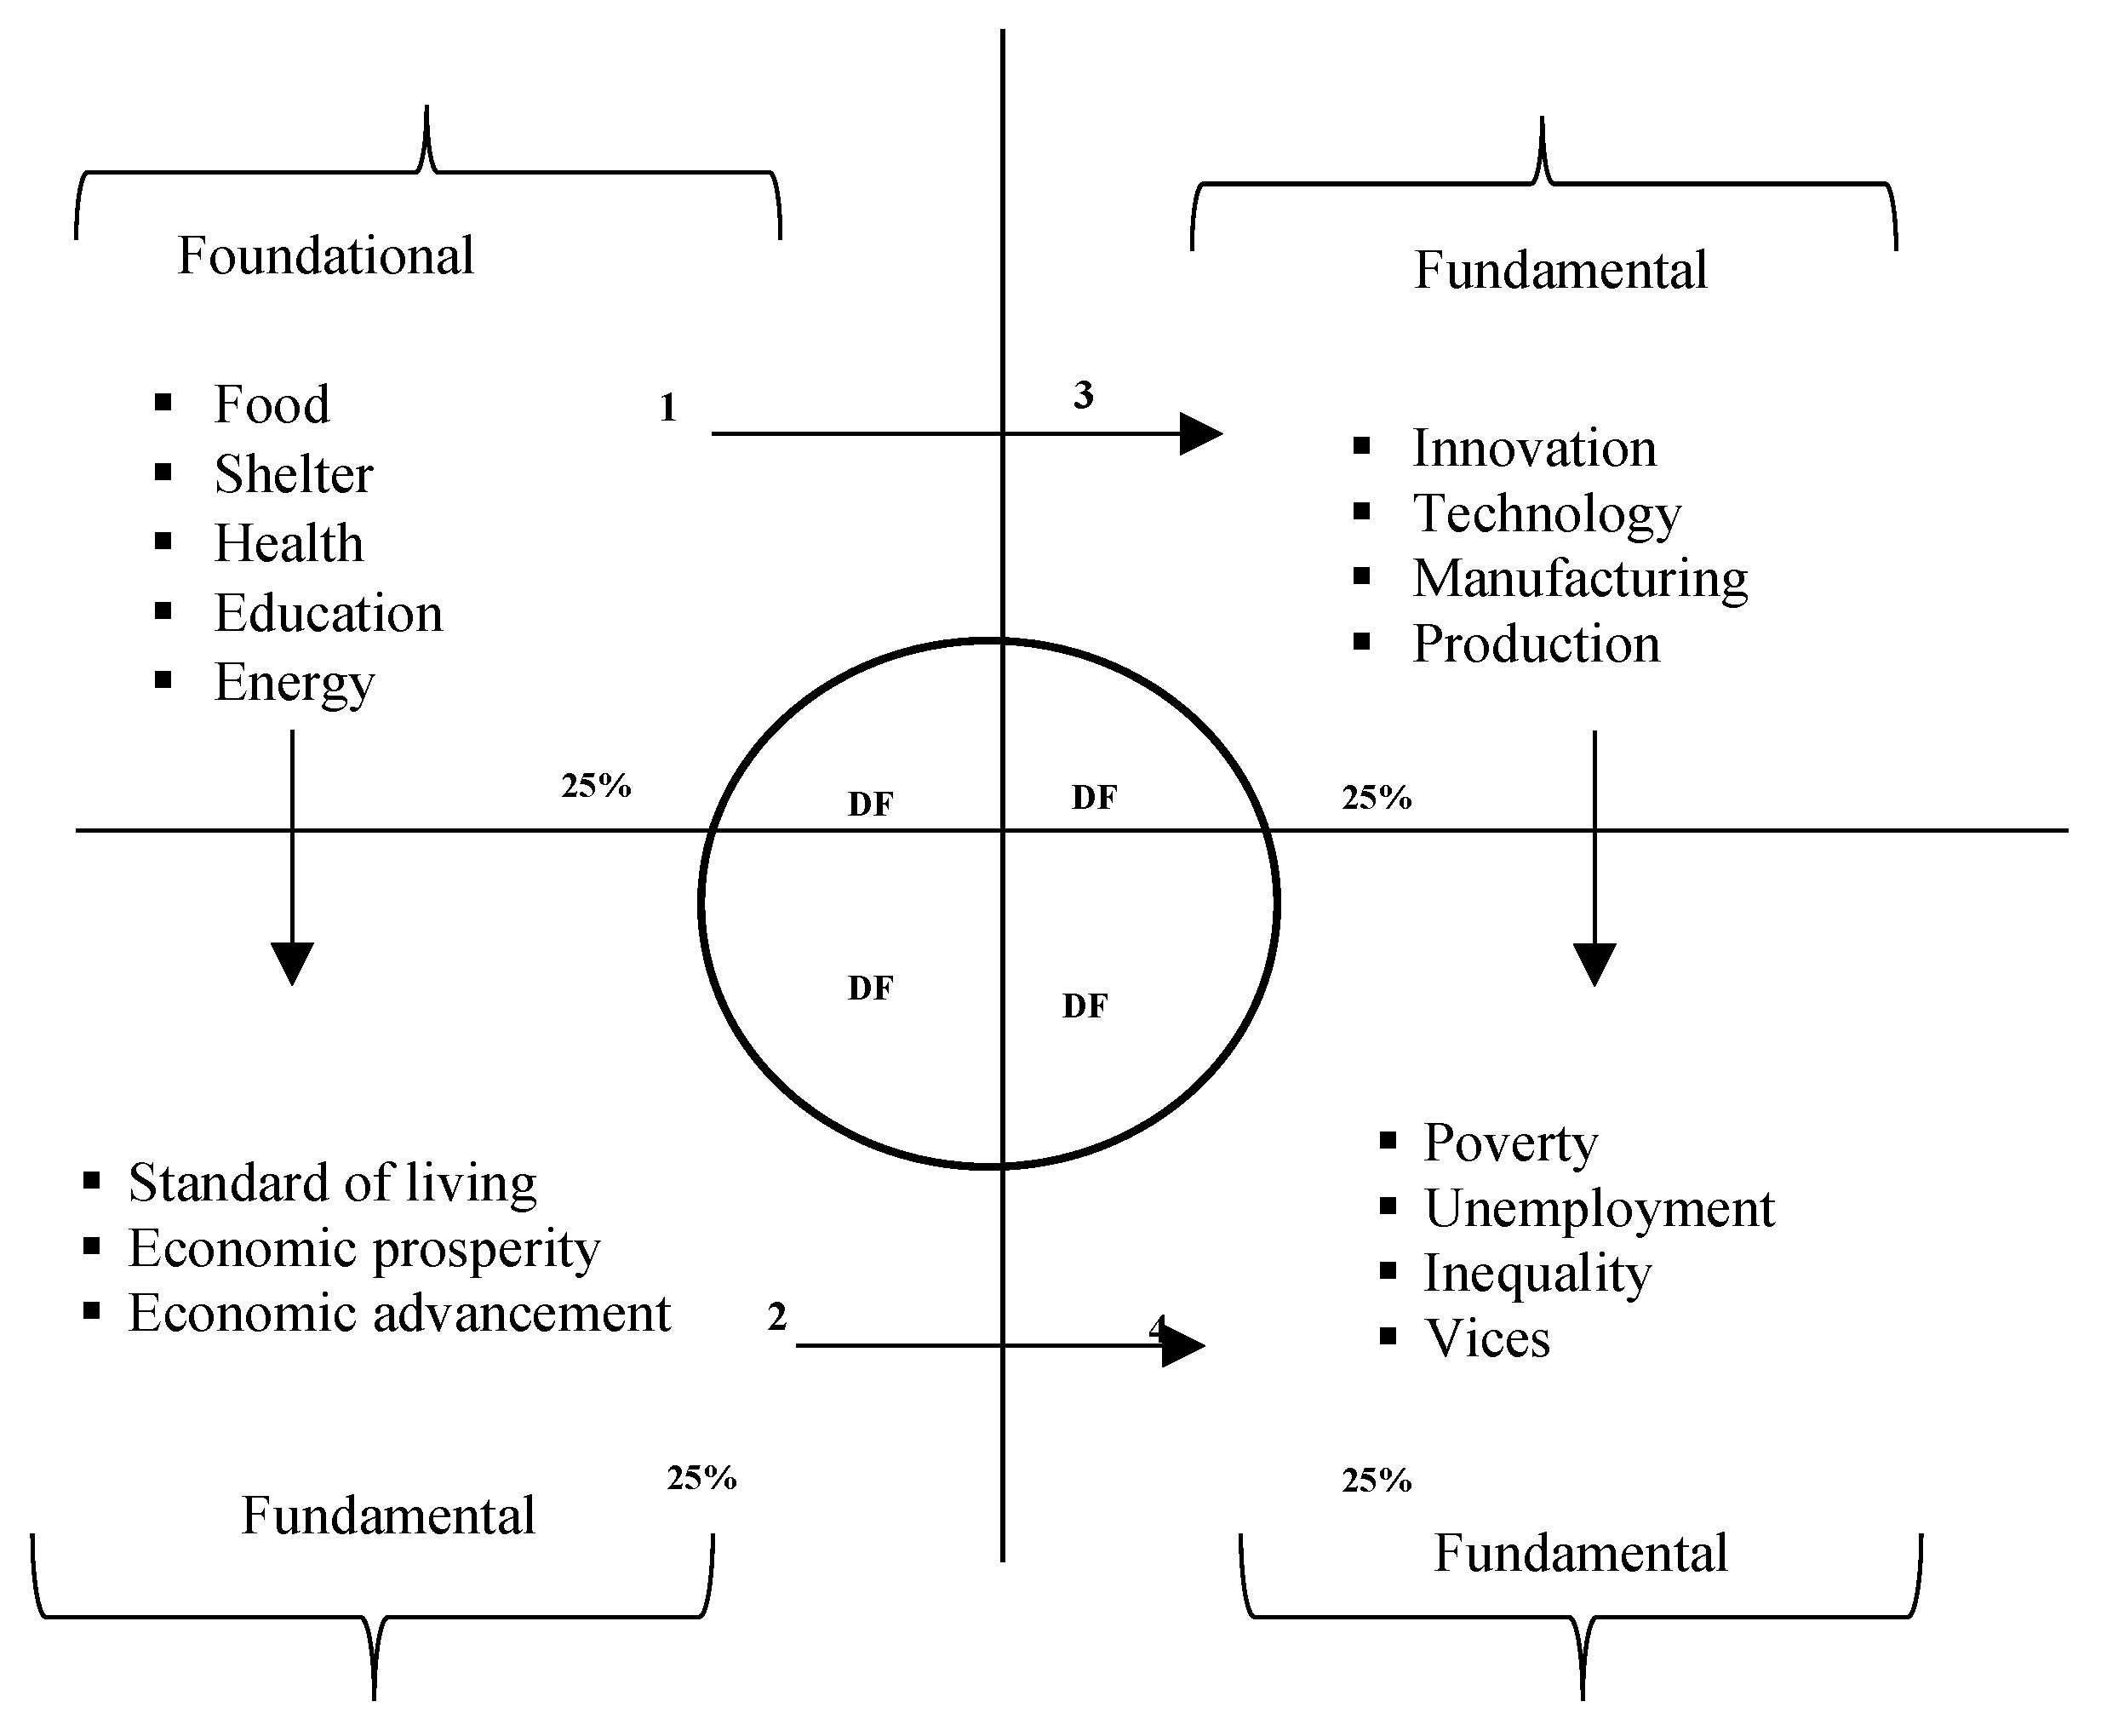
4.2. The F-Re Quadrant (Foundational—Fundamental—Financial Pillars (FFFP))

The F-Re Quad (Q) is divided into four sides, each assigned the same weight of 25 percent of prioritized government financing expenditure. Also, each of the Quads is divided into a group of two metrics. There are basics (foundational)—that is, those human basic needs (building blocks of the society) with which human existence (society) becomes inhabitable. This, the study calls the foundational pillar (Q1). Items in Q1 represent the basics of food, shelter, education, health, and energy. Similarly, the remaining three Quads (Q2–Q4) are called fundamental/signs/indicators, which derive their performance from the functional activities of the foundation. Here, they include Q2—standard of living, economic prosperity, and economic advancement, Q3—technology, innovation, manufacturing, and production, and Q4—poverty, unemployment, inequality, and insecurity. The whole Q is seen as a strategic model in F-Re, which can be propelled by development finance principles (Figure 13).
  • Quad 1.
Food: This provides basic minerals and vitamins that ensure that humans function optimally in their day-to-day activities. It is the essential fuel for life’s sustainability. With its adequate supply and availability, human stimulating ability becomes enhanced. Likewise, access to good, cheap, nutritious, and affordable food through deliberate finance ensures free flow of human activities, and, by extension, a nation’s productivity. This means that a country with an abundant supply of good, quality, and affordable nutritious food to its citizens can avoid any form of fundamental indicator (such as the hungriest/poorest/food insecure nation), as in the case of integrated food security—IPC/Cadre Harmonize classification [52,62]. For instance, on record, DRC, Nigeria, Ethiopia, South Sudan, Somalia, Sudan, Niger, Kenya, Burkina Faso, Chad, Mali, Angola, Mozambique, Guinea, Madagascar, Mauritania, Benin, and Cabo Verde lead in that order in Africa in the IPC/Cadre rating as the nations in acute food insecurity [66,68,69].
Shelter: This is a basic life need. It is also found in Q1’s foundational pillar. Shelter represents affordable/decent housing provision to all citizens, irrespective of income level or status. Housing provision is essential to living, and governments at all levels must ensure its provision through adequate financing of the sector. Shelter qualifies as basic infrastructure that aids productivity for the ultimate advancement of every nation. Again, according to [15,20], Africa faces a 51 million shortfall in housing deficits.
Education: This is the basic building block of society. Good, quality education enhances the ability of an individual and a nation to develop adequate mental capacity and capability to make informed decisions towards the general benefits of all [67,70,71]. Education is the wheel that drives the development capabilities of nations. In fact, it is often said that education is a life-long learning process [31,72,73]. The more individuals and a nation learn and unlearn, the better their ability to improve existing benefits for themselves and mankind. However, today, education in Africa is under threats of all forms [52,55]. For instance, in the West and Central Africa Republic, 75 percent of 38 million out-of-school children are found in Burkina Faso, Chad, Democratic Republic of Congo, Mali, Niger, and Nigeria, while 89 percent are from the poorest quintile and never attended school or dropped out of it [55,58,72]. By implication, Africa loses 75 percent of the vibrant knowledge contribution to growth that would have been achieved should this percentage have been educated. A deliberate attempt to educate all as proposed in the foundation Q1 is essential going forward.
Energy: This represents a basic amenity that enhances the effective functional ability of other items such as those at homes, schools, and health centers and in industry and transportation. This is placed in Q1 because it can be used as a tool to propel other fundamental measures. Presently, about 600 million (43%) people out of 1.3 billion in Sub-Saharan Africa lack access to electricity [73,74,75]. In other words, there is a need for deliberate financing provision for its development owing to its pivotal linkages with other sectors—hence, it is placed in Q1.
  • Quad 2.
Quad 2 is a direct consequence of what happens in Q1. For instance, a less/non-hungry nation, a healthy citizen, an informed population, and abundant availability of energy for productivity are immediate indicators of a progressive society—fundamentals.
Standard of Living: This is often used as a measure of how individuals, and, accordingly, a country, fair in their ability to provide basic items to the teeming population. Often, these items will include food, shelter, education, health, and energy. If this is so, then every government’s attention should be channeled to Q1 to achieve this indicator.
Economic Boom: A boom refers to a time of abundance—social, economic, and environmental—with natural/mineral resources, prosperity, advancement, and much more. However, a period of boom in mineral or natural resource abundance or otherwise without adequate man-manning capacity/capability fostered through education will need to import experts who have quality expertise occasioned by the quality education he/she has received. Doing this requires that Q1 is adequately financed to serve as a tool of economic boom.
  • Quad 3.
This third Quad is also referred to as a fundamental Quad. Items listed here are a direct translation of Q1. By implication, innovation, technology, manufacturing, and production are in Q3. In other words, the ability to innovate, invent, manufacture, and produce is weakened by the absence of a sound educational process, found in the foundation pillar, that propels innovative thinking [47].
Innovation: Although there has been no consensus on the definition of innovation, it has been viewed from the angle of application of critical thinking envisioned in an educational system to create value, add value, reduce cost, transform old products to new, and develop technology and non-technological actions [27,36,39,41,47,65,75]. Innovation, technology, manufacturing, and production are all end-products of critical and systematic steps brought about by studying as envisioned in the education seen in Q1. Thus, with adequate funding for education, technically, the ability to innovate will be unleashed [47].
Technology: This is often referred to as the application of scientific principles to solving human problems [39,41,66,68,75]. How technologically advanced a nation is is based on its educational process, which leads to the application of science knowledge to solve problems. Today, there is no one specific technology that is entirely African.
Manufacturing: This represents an act of making goods either by hand or machine [36]. When goods are manufactured on a large scale, it breeds potential exchange and income. The number of goods manufactured and sold has a direct relationship with the growth and development of a country. Invariably, the tenet of manufacturing requires a technical and educational foundation. Without this, it becomes difficult to manufacture at a low cost and become competitive. This process can only be thought through using the process found in Q1.
  • Quad 4.
This is the last quad in the F-Re model, and it contains poverty, unemployment, inequality, and insecurity.
Poverty: This is largely and often described as a state of deprivation of basic human needs [9,18,57,67,69]. Worthy of note is the fact that poverty belongs to the fundamentals in the Quad, which only manifest through unattended causes. Indeed, it is often the flagged indicator of the resultant denial of unattended foundational basics (Q1). On the one hand, poverty occurs because of a government’s inability to access and gauge its causes by providing deliberate funding to items in Q1. Whenever this is missing or inadequate, the resultant indicator refers to the continent’s poor [7,70,71,72].
Unemployment: Like the intended consequences in poverty, the same scenario applies to unemployment. Recall that unemployment occurs not only because there is an absence of graduates, but because the finance process leading to quality education has been compromised. Again, this points to the fact that governments only attend to symptoms and not causes—basics, as in Q1. When education is accessible to citizens, and it is of a good quality and standard, it indirectly creates employment itself and is not seeking employment.
Inequality: The ability to put forth quality debate will traditionally give way to or reduce inequality. This can only be achieved when attention is paid to Q1. Q1 will technically give way to Q2, and Q3 and Q4 will require less or no attention.
Insecurity: The inability to have quality depth of thought, which can only be brought about through sound education, will breed insecurity and vices. This will cut across life, property, and finance, to mention but a few areas. Hungry individual can be easily lured to vices. Likewise, homeless, uncared for individuals could easily be lured into vices—all in Q4.
Conclusively, the assumed earmarked 25 percent of finance provision across each Quad suggests how concerned authorities and/or governments should share equal attention and finance to achieve each Quad’s goal. Thus, reviews show that, with this act, indirectly, there are fewer deserving Quads compared to the critical Quad. Based on this, the study suggests that the extra resources (25%), which would have been an addition and sufficient for financing the foundation (Q1), targeting avoidance of the attendant fundamentals are insufficient; hence, the continent will continue to grapple with financing its fundamentals rather than making adequate provision for the foundation. Practically, the foundational pillar represents the building block required to achieve and/or avoid both the positive and the negative consequences inherent in the remaining fundamentals—Q2, Q3, and Q4 in the model.
The matching path analysis in Figure 14 further elaborates on the intertwining relationship between the foundational, fundamental, and finance pillars. It describes the importance of the link between them. Here, it shows that all foundational items have a direct relationship with the fundamentals and birth a series of indicators embedded in the fundamental items. For instance, sound and quality education can be used as a catalyst to propel illiteracy reduction, create technology, and increase production, among other things. This also applies to other items in the foundational list. Further, food availability and affordability can be used to catalyze hunger reduction and mental wellness. Shelter, health, and energy are all items that can catalyze the standard of living, wellness, and industrialization.

5. Conclusions

5.1. Summary of the Findings

This study has exploratorily and painstakingly thought through how Africa can achieve her development path going forward. This process birthed a new concept in financial re-engineering (F-Re) against the popular mantra of financial engineering, which seemingly has been monopolized by the private sector. The F-Re thus proffers Quads 1–4 as a panacea using development finance practices. From this, it proposes deliberate development finance priority of basics—foundational financing compared to financing fundamentals (indicators)—called the FFP pillars. With this, the study provides a defiant, known path to unravel the unknown. It queries, rejigs, and beams a light into the already established traditional prototype with which Africa pursues her development agenda, providing an alternative to achieving prioritized development actions.

5.2. Policy Implication

The following policy implications are expected from the study. First, African governments will be well informed of prioritized development spending and channel such energy towards that direction. Second, governments across the region will have the ability to identify and cut waste, especially in areas that need no funds but to which funds are allocated yearly. Third, rather than avoiding fundamental indicators like most countries/continents with the highest illiteracy level and countries/continents with the highest mortality rate and unemployment, a deliberate financing of the basics—foundational finance—has the potential to knock off these unfavorable indicators.

5.3. Limitation of the Research

This study is limited in scope as it only considers a ten-year (2012–2022) period to reach it conclusion. Likewise, owing to the sensitivity of relevant information that would have further improved the quality of the study, we were limited in data availability.

Author Contributions

A.F.O.: conceptualization, methodology, formal analysis, investigation, software, data curation, writing—original draft preparation. A.R.A.: writing—review and editing, visualization, supervision. All authors have read and agreed to the published version of the manuscript.

Funding

This research received no funding. We thank the University of South Africa for providing APC for open access.

Institutional Review Board Statement

Not applicable.

Informed Consent Statement

Not applicable.

Data Availability Statement

Acknowledgments

The authors acknowledge the support of the University of South Africa for providing access to material resources for this study.

Conflicts of Interest

The authors declare no conflicts of interest. The funders had no role in the design of the study; in the collection, analyses, or interpretation of data; in the writing of the manuscript; or in the decision to publish the results.

References

  1. African Development Bank AFDB. 2023 AfDB Statistical Pocketbook Volume 23. Published by the Economic and Social Statistics Division, Statistics Department, African Development Bank. 2023. Available online: http://www.afdb.org/statistic (accessed on 17 October 2023).
  2. African Development Bank [AfDB]. Africa Agriculture Status Report 2016: Progress towards Agricultural Transformation in Africa. 2016. Available online: www.afdb.org/04/06/2020 (accessed on 17 October 2023).
  3. Asante, G.N.; Takyi, P.O.; Mensah, G. The impact of financial development on economic growth in sub-Saharan Africa. Does institutional quality matter? Dev. Stud. Res. 2023, 10, 2156904. [Google Scholar] [CrossRef]
  4. Khemiri, W.; Chafai, A.; Alsulami, F. Financial inclusion and sustainable growth in North African firms: A dynamic-panel-threshold approach. Risk 2023, 11, 132. [Google Scholar] [CrossRef]
  5. Akinbode, S.O.; Okuneye, P.A.; Onyeukwu, C.O. Inequality, population growth, and hunger in Sub-Saharan Africa. SN Soc. Sci. 2022, 2, 250. [Google Scholar] [CrossRef] [PubMed]
  6. Ogunniyi, O.R.; Okunlola, A.F.; Alatise, M.A. Socio-economic inclusion and sustainable economic growth: Empirical analysis of Nigeria and South. Cogent Econ. Financ. 2023, 11, 2163077. [Google Scholar] [CrossRef]
  7. African Development Bank (AfDB). Africa Agricultural Trade Status Report 2020: Progress towards Agricultural Transformation in Africa. 2019. Available online: www.afdb.org (accessed on 20 February 2021).
  8. African Development Bank AFDB. West Africa Economic Outlook 2023. Mobilizing Private Sector Financing for Climate and Green Growth. AfDB 2023. Available online: www.afdb.org (accessed on 17 October 2023).
  9. Oxford Poverty and Human Development Initiative OPHI. Global Multidimensional Index 2019 Illuminating Inequalities. OPHI 2019. Available online: www.ophi.org.uk/multidimensional-poverty-index (accessed on 17 October 2023).
  10. Tatenda, R. Why Africa Is Poor. Master’s Thesis, National University of Science, and Technology, Bulawayo, Zimbabwe, 2019. [Google Scholar]
  11. African Development Bank AfDB. West Africa Economic Outlook 2018: Macroeconomic Developments and Poverty, Inequality, and Employment, Labour Markets and Jobs. 2018. Available online: www.afdb.org/14/02/2020 (accessed on 17 October 2023).
  12. Mota, A.E.; Lara, R. Inequality, hunger, and food production. Rev. Katálysis. 2022, 25, 437–442. [Google Scholar] [CrossRef]
  13. Tamasiga, P.; Onyeaka, H.; Akinsemolu, A.; Bakwena, M. The inter-relationship between climate change, inequality, poverty and food security in Africa: A bibliometric review and content analysis approach. Sustainability 2023, 15, 5628. [Google Scholar] [CrossRef]
  14. Teeuwen, A.S.; Meyer, M.A.; Dou, Y.; Nelson, A. A systematic review of the impact of food security governance measures as simulated in modelling studies. Nat. Food 2022, 3, 619–630. [Google Scholar] [CrossRef]
  15. Adeleye, B.N.; Gershon, O.; Ogundipe, A.; Owolabi, O.; Ogunrinola, I.; Adediran, O. Comparative investigation of the growth-poverty-inequality trilemma in Sub-Saharan Africa and Latin American and Caribbean Countries. Heliyon 2020, 6, e05631. [Google Scholar] [CrossRef]
  16. Aguilar, G.R.; Sumner, A. Who Are the World’s Poor? A New Profile of Global Multidimensional Poverty; CGD Working Paper 499; Center for Global Development: Washington, DC, USA, 2019; Available online: https://www.cgdev.org/publication/who-are-worlds-poor-new-profile-global-multidimensional-poverty (accessed on 17 October 2023).
  17. Boiardi, P. Managing and Measuring the Impact of Sustainable Investments: A Two-Axes Mapping; OECD Development Co-Operation Working Papers, No. 74; OECD Publishing: Paris, France, 2020. [Google Scholar] [CrossRef]
  18. Ambrish, V. Financial engineering a conceptual study. Int. Res. J. Manag. Sociol. Humanit. (IRJMSH) 2016, 7, 150–157. [Google Scholar]
  19. Boudoux, D.L.; Hehenberger, L. The Governance of Impact Measurement in European Impact Investing Funds. 2021. Available online: https://www.esade.edu/en/faculty-and-researc/research/knowledge-units/center-social-impact/research/governance-impact-measurement (accessed on 17 October 2023).
  20. Centre for Affordable Housing Finance. 2022 Yearbook: Housing Finance in Africa. Johannesburg, South Africa. 2022. Available online: https://housingfinanceafrica.org (accessed on 17 October 2023).
  21. Adams, S. An Inquiry into the Nature and Causes of Wealth of Nations; W. Strahan and T. Cadell: London, UK, 1776. [Google Scholar]
  22. Rostow, W.W. The stages of economic growth. Econ. Hist. Rev. 1959, 12, 1–16. [Google Scholar] [CrossRef]
  23. Mahato, J.; Jha, M.K. Does financial inclusion promote sustainable livelihood development? Mediating effect of microentrepreneurship. J. Financ. Econ. Policy 2023, 15, 485–499. [Google Scholar] [CrossRef]
  24. An, H.; Zou, Q.; Kargbo, M. Impact of financial development on economic growth: Evidence from Sub-Saharan Africa. Aust. Econ. Pap. 2021, 60, 226–260. [Google Scholar] [CrossRef]
  25. Alkire, S.; Kanagaratnam, U.; Suppa, N. The Global Multidimensional Poverty Index (MPI) 2022 Country Results and Methodological Note. 2022. OPHI MPI Methodological Notes 52, Oxford Poverty and Human Development Initiative, University of Oxford. Available online: https://www.ophi.org.uk/wp-content/uploads/OPHI_MPI_MN_52_2022.pdf (accessed on 17 October 2023).
  26. Attridge, S.; Engen, L. Blended Finance in the Poorest Economies: The Need for a Better Approach; Overseas Development Institute: London, UK, 2019. [Google Scholar]
  27. Bara, A.; Mudzingiri, C. Financial innovation and economic growth: Evidence from Zimbabwe. Invest. Manag. Financ. Innov. 2016, 13, 65–75. [Google Scholar] [CrossRef]
  28. Gary, B. A theory of the allocation of time. Econ. J. 1965, 75, 493–517. [Google Scholar]
  29. Gary, B. Human Capital: A Theoretical and Empirical Analysis with Special Reference to Education, 3rd ed.; The University of Chicago Press: Chicago, IL, USA, 1993. [Google Scholar]
  30. Beder, T.; Marshall, C.M. Financial Engineering: The Evolution of a Profession; John Wiley & Sons, Inc.: Hoboken, NJ, USA, 2011. [Google Scholar]
  31. Bloom, D.; Canning, D.; Chan, K. Higher Education and Economic Development in Africa; Harvard University: Cambridge, MA, USA, 2005. [Google Scholar]
  32. Felix, U.O.; Rebecca, L.I.; Onyeisi, O.R. The role of financial engineering in the growth of the financial market. Arab. J. Bus. Manag. Rev. 2015, 5, 1–8. [Google Scholar]
  33. Gabor, D. The Liquidity and Sustainability Facility for African bonds: Who benefits? European Network on Debt and Development Eurodad, Heinrich Böll Foundation and Nawi—Afrifem Macroeconomics Collective. 2021. Available online: hhtps://www.eurodad.org/the_and_sustainability_facility_for_african_sovereign_bonds_who_benefits (accessed on 20 September 2023).
  34. Ali, J.; Khan, M.A. Micro and macro-financial inclusion and their impacts on economic growth: Evidence from Asian economies with alternative approaches. Int. Trans. J. Eng. Manag. Appl. Sci. Technol. 2020, 11, 1–15. [Google Scholar]
  35. Bashiru, S.; Bunyaminu, A.; Yakubu, I.N.; AlFaryan, M.A.S. Drivers of financial inclusion: Insights from Sub-Saharan Africa. Economies 2023, 11, 146. [Google Scholar] [CrossRef]
  36. AlMaktum, M.A. My Vision: Challenges in the Race for Excellence; Motivate Publishing: Dubai, United Arab Emirates, 2012. [Google Scholar]
  37. Bang, M.K. Fiscal Policy in Korea for Building Infrastructure and Its Knowledge Based Economy October 9, 2003 WB-Vietnam-Korea Conference on Public Expenditure Moon-Kyu. Available online: https://slideplayer.com/slide/6321423 (accessed on 20 September 2023).
  38. Baporikar, N. Understanding Financial Engineering. Accredited Management Teacher (AIMA); PhD-Guide; Faculty of Management, University of Pune: Pune, India, 2009. [Google Scholar]
  39. Ezirim, B.C. Finance Dynamics: Principles, Technique and Applications; Markowitz Centre for Research & Development: Port Harcourt, Nigeria, 2007. [Google Scholar]
  40. Matchaya, G.; Nhemachena, C.; Nhlengethwa, S.; Muchero, M.; Elago, P. Africa Agriculture Transformation Scorecard: Performance and Lessons for the Southern African Development Community—SADC. Regional Strategic Analysis and Knowledge Support System (ReSAKSS) Issue Note, October 2018. Available online: https://ageconsearch.umn.edu/record/284786 (accessed on 20 September 2023).
  41. Holz, C.A. The unbalanced growth hypothesis and the role of the State: The case of China’s State-owned enterprises. J. Dev. Econ. 2011, 96, 220–238. [Google Scholar] [CrossRef]
  42. Gong, G. Two Stages of Economic Development. Asian Development Bank Institute [ADBI]. In Working Paper 628; Asian Development Bank Institute: Tokyo, Japan, 2016; Available online: https://www.adb.org/publications/two-stages-economic-development (accessed on 17 October 2023).
  43. Hruby, A. The Future of Development Finance. Atlantic Council Africa Center—Issue Brief. 2018. Available online: https://issuu.com/atlanticcouncil/docs/the_future_of_development_finance_/1 (accessed on 17 October 2023).
  44. Iriobe, G.; Tega, W.H.; Ayodele, T.; Taofeek, A. Financial technologies’ evolution and traditional banking: A case of retail payments in Nigeria. Glob. J. Bus. Econ. Manag. Curr. Issues 2021, 11, 163–177. [Google Scholar] [CrossRef]
  45. Kim, Y.E.; Loayza, N. Productivity Growth: Patterns and Determinants across the World. In Policy Research Working Paper 8852; World Bank Group: Development Economics, Development Research Group: Washington, DC, USA, 2019. [Google Scholar]
  46. Leimbach, M.; Kriegler, E.; Roming, N.; Schwanitz, J. Future growth patterns of world regions—A GDP scenario approach. Glob. Environ. Chang. 2017, 42, 215–225. [Google Scholar] [CrossRef]
  47. Li, Y.; Spigt, R.; Swinkels, L. The impact of fintech start-ups on incumbent retail banks’ share prices. Financ. Innov. 2021, 3, 26. [Google Scholar] [CrossRef]
  48. McManus, R.; Ozkan, F.G. On the consequences of pro-cyclical fiscal policy. Fisc. Stud. 2015, 36, 29–50. [Google Scholar] [CrossRef]
  49. Feyen, E.; Frost, J.; Gambacorta, L.; Nataraja, H.; Saal, M. Fintech and the Digital Transformation of Financial Services: Implications for Market Structure and Public Policy. Bank for International Settlement (BIS No 117). Monetary and Economic Department. 2021. Available online: https://bis.org/publ/bppdf/bispap117.pdf (accessed on 17 October 2023).
  50. Organization for Economic Cooperation and Development OECD. Unleashing the Impact of Development Finance: A Roadmap for the Impact Standards for Financing Sustainable Development; Organization for Economic Cooperation and Development OECD: Paris, France, 2022. [Google Scholar]
  51. International Labour Organization ILO. The Social Dimensions of Development Finance in Africa: Result of a Survey among AADFI Members; Working paper No. 70; International Labour Organization ILO: Geneva, Switzerland, 2016. [Google Scholar]
  52. Organization for Economic Cooperation and Development OECD. OECD Secretary-General Tax Report to the Group of 20 Finance Ministers and Central Bank Governors; OECD Publishing: Paris, France, 2021. [Google Scholar]
  53. Osuoha, J.I. Financial engineering, corporate governance and Nigeria economic development. J. Financ. Risk Manag. 2013, 2, 61–66. [Google Scholar] [CrossRef]
  54. Mbah, B.T.; Ojo, O.V. Africa’s Economic Growth: Trends, constraints and lessons from Asia. IOSR J. Humanit. Soc. Sci. (IOSR-JHSS) 2018, 23, 22–34. [Google Scholar]
  55. Blekking, J.; Waldman, K.; Tuholste, C.; Evans, T. Formal/informal employment and urban food security in Sub-Saharan Africa. Appl. Geogr. 2020, 114, 102131. [Google Scholar] [CrossRef]
  56. Pedro, S.A.; Dean, C.; Erwan, Q. Financial Engineering and Economic Development. United Nations Conference on Trade and Development UNCTAD (2018). Economic Development in Africa Report 2018: Migration for Structural Transformation. Available online: www.un.org/publications (accessed on 17 October 2023).
  57. Rittner, T. Practioner’s Guide to Economic Development Finance: Building and Utilizing the Development Finance Toolbox; Council of Development Finance Agencies: Columbus, OH, USA, 2021. [Google Scholar]
  58. Mincer, J. Family investments in human capital earnings of women. J. Political Econ. 1974, 82, 76–108. [Google Scholar] [CrossRef]
  59. Munevar, D. Liquidity Illusions: Who Really Benefits from Liquidity and Sustainability Facility? European Network of Debt and Development. 2021. Available online: https://www.eurodad.org/liquid_illusions_who_really_benefits (accessed on 17 October 2023).
  60. World Food Programme (WFP) and FAO. Hunger Hotspots. FAO-WFP Early Warnings on Acute Food Insecurity: June to September 2022 Outlook; World Food Programme (WFP) and FAO: Rome, Italy, 2022. [Google Scholar]
  61. Thakkar, F.M. Financial engineering: Factors leading to its growth in Indian financial market. Natl. J. Multidiscip. Res. Dev. 2017, 2, 38–41. [Google Scholar]
  62. Tapiero, C.S. Re-Engineering Risks and the Future of Finance; NYU-Polytechnic Institute: Brooklyn, NY, USA, 2014. [Google Scholar]
  63. Yap, S.; Lee, H.S.; Liew, P.X. The role of financial inclusion in achieving finance-related sustainable development goals (SDGs): A cross-country. Econ. Res.-Ekon. Istraz. 2023, 36, 1–21. [Google Scholar] [CrossRef]
  64. World Bank. Domestic General Government Health Expenditure per Capita (current US$). World Health Organization Global Health Expenditure Data Base. 2023. Available online: www.data.worldbank.org (accessed on 17 October 2023).
  65. United Nations Conference on Trade and Development—UNCTD. Financing for Development: Mobilizing Sustainable Finance beyond COVID-19. TD/B/EFD/5/2. 2022. Available online: https://unctad.org/system/files/official-document/tdb_efd5d2_en.pdf (accessed on 17 October 2023).
  66. World Bank. Government Expenditure on Education, Total (% of Government Expenditure) SE.XPD.TOTL.GB.ZS. UNESCO Institute for Statistics (UIS). UIS. Stat Bulk Download Services 2023. Available online: www.data.worldbank.org (accessed on 31 August 2023).
  67. World Bank. Population, Total. SP.POP.TOTL. United Nations Population Division. 2023. Available online: https://data.worldbank.org/indicators/SP.POP.TOTL (accessed on 17 October 2023).
  68. Makina, D.; Walle, Y.M. Financial inclusion and economic growth: Evidence from a panel of selected African countries. Extending Financ. Incl. Afr. 2019, 9, 193–210. [Google Scholar]
  69. Zhang, Y.; Wang, X.; Chen, K. Growth and distributive effects of public infrastructure investments in China. In Infrastructure and Economic Growth in Asia; Cockburn, J., Dissou, Y., Duclos, J.-Y., Tiberti, L., Eds.; Springer International Publishing: Berlin/Heidelberg, Germany, 2013. [Google Scholar]
  70. Xue, J. Arguments for and Against Economic Growth. In Proceedings of the 2nd Conference on Economic Degrowth for Ecological Sustainability and Social Equity, Barcelona, Spain, 26–29 March 2010. [Google Scholar]
  71. Theodore, S.W. Capital formation by education. J. Political Econ. 1956, 68, 571–583. [Google Scholar]
  72. Theodore, S.W. Investment in human capital. Am. Econ. Rev. 1961, 51, 1–17. [Google Scholar]
  73. Kothari, C.R. Research Methodology: Methods and Techniques, 2nd ed.; New Age: New Delhi, India, 2004. [Google Scholar]
  74. IEA. Africa Energy Outlook 2022—Key Findings. 2022. Available online: https://www.iea.org/reports/africa-energy-outlook-2022/key-findings (accessed on 17 October 2023).
  75. Stebbins, R. Exploratory Research in the Social Sciences; SAGE: Thousand Oaks, CA, USA, 2001; ISBN 0-7619-2398-5. [Google Scholar]
Scheme 1. Ref. [18] provided the stages involved in the development of financial engineering over time. This period dates from 1501 to the present modern-day 21st century. Notable in these periods are the stages associated with financial and technological innovativeness or development, often ascribed to private institutional development.
Sustainability 16 00214 sch001
Figure 1. EEx % 10-year average.
Sustainability 16 00214 g001
Figure 2. EEx % 10-year average.
Sustainability 16 00214 g002
Figure 3. EEx % 10-year average.
Sustainability 16 00214 g003
Figure 4. EEx % 10-year average.
Sustainability 16 00214 g004
Figure 5. EEx % 10-year average.
Sustainability 16 00214 g005
Figure 6. EEx % 10-year average.
Sustainability 16 00214 g006
Figure 7. DHEpc % 10-year average.
Sustainability 16 00214 g007
Figure 8. DHEpc % 10-year average.
Sustainability 16 00214 g008
Figure 9. DHEpc % 10-year average.
Sustainability 16 00214 g009
Figure 10. DHEpc % 10-year average.
Sustainability 16 00214 g010
Figure 11. DHEpc % 10-year average.
Sustainability 16 00214 g011
Figure 12. DHEpc % 10-year average. Source: Authors’ computation of data from World Bank Development Indicator (2023a,b,c) [64,66,67] and Alkire et al. (2022) [25].
Sustainability 16 00214 g012
Figure 13. F-Re quadrant—the building blocks.
Sustainability 16 00214 g013
Figure 14. The matching path analysis.
Sustainability 16 00214 g014
Table 1. Basic government finance data information.
CountryIndp. DayPop.EEx (10-Year est.)
(USD)
DHExpc (10-Year est.) (USD)PMP (%)Gini Index
Algeria196244.7159.31519.071.3827.6 (11)
Angola 197551.368.71389.8951.1053.3 (15)
Benin 1960 12.91118.4360.5166.8037.8 (18)
Botswana 19662.3497.542216.5117.2253.3 (15)
B. Faso 1960 21.51183.19125.8284.1947.3 (18)
Burundi 1962 12.89211.6948.1475.1038.6 (13)
Cameroon 1960 27.9141.3950.8243.5946.6 (14)
Cabo Verde 19750.58149.9982546.07n/a
CAR 1960 5.5890.6225.2280.4156.2 (08)
Chad 1960 17.41118.3656.9684.1737.5 (18)
Comoros 1975 0.8448.3278.837.2645.3 (14)
Congo Rep.1960 5.97144.09216.7724.2748.9 (11)
Congo DR1960 42.1107.1321.6464.5242.1 (12)
Cote d’Ivoire 1960 29.39186.87157.146.0737.2 (18)
Djibouti 19771.1282.9276.34n/an/a
Egypt Arab Rep. 1922 10471.1344.365.2431.5 (17)
Eq. Guinea1968 1.67349.71469.06n/an/a
Eritrea 1993 n/a36.67n/an/a
Ethiopia n/a123174.494.6968.7435 (15)
Gabon 1960 2.39116.22105.4215.6038 (17)
Gambia, The19652.42126.486.0641.7135.9 (15)
Ghana 1957 33.48126.8124.4424.6443.5 (16)
Guinea 1958 29.6130.614.8266.2129.6 (18)
Guinea-Bissau19742.1192.623.1664.4034.8 (18)
Kenya 1963 50.6125.525.1237.4840.8 (15)
Lesotho 19662.31149.8945.0519.6044.9 (17)
Liberia 18475.395.596.4452.3235.3 (16)
Libya 19516.81n/an/a 2.00n/a
Madagascar 1960 29.61169.396.7969.0842.6 (12)
Malawi 196420.41132.357.3349.8838.5 (19)
Mali 1960 22.59144.397.1868.3336.1 (18)
Mauritania1960 4.7386.3717.2958.4532.6 (14)
Mauritius 19681.26163.86203.50n/an/a
Morocco 195636.6780.0156.946.3439.5 (13)
Mozambique 1975 31.62168.987.7873.1454 (14)
Namibia 19902.6241.51168.8140.8859.1 (15)
Niger 1960 26.21141.456.9490.9737.3 (18)
Nigeria 1960 21861.819.6946.4235.1 (18)
Rwanda 196213.25110.414.1048.8243.7 (16)
Sao T. and Principe19750.23164.3236.4611.7140.7 (17)
Senegal196017.7221.3813.0550.8338.1 (18)
Seychelles 1976 0.1109.46415.860.8732.1 (18)
Sierra Leone 19618.61218.845.5259.2237.2 (18)
Somalia 1960 17.620.48n/a n/an/a
South Africa 1931/199459.89189.35241.886.2663 (14)
Sudan 195646.8712.4813.5852.3334.2 (14)
Swaziland 19681.17175.6896.8319.2154.6 (16)
Tanzania 1964 61.74171.9411.2057.0740.5 (18)
Togo 1960 8.85184.26.8037.642.4 (18)
Tunisia 195632.822.67105.380.7932.8 (15)
Uganda 196242.7112.015.1657.1742.7 (19)
Zambia 1964 57.1146.1821.2147.9157.1 (15)
Zimbabwe 1980 50.3167.2519.2625.8050.3 (19)
Source: Authors’ computation of data from World Bank Development Indicator (2023a,b,c) [66] and Alkire et al. (2022) [25]. WHO (2023) accessed from http://uis.unesco.org; http://apps.int/nha/database; http://apps.who.int/nha/database (accessed on 17 October 2023). Note: EEx = education expenditure as a percentage of total expenditure for ten-year average. Pop. = population. DHExpc = domestic health expenditure as a percentage of total expenditure per head—ten-year average. PMP = population of multidimensional poverty as a percentage of population. Gini Index = coefficient measure of the level of inequality (income/consumption) in a range of 0 to 1. The number in parentheses represents the calculated year per country. n/a means not available or not provided, or missing.
Disclaimer/Publisher’s Note: The statements, opinions and data contained in all publications are solely those of the individual author(s) and contributor(s) and not of MDPI and/or the editor(s). MDPI and/or the editor(s) disclaim responsibility for any injury to people or property resulting from any ideas, methods, instructions or products referred to in the content.

