Article

Prediction of Sodium Hazard of Irrigation Purpose using Artificial Neural Network Modelling

by
Vinay Kumar Gautam
1,*,
Chaitanya B. Pande
2,3,*,
Kanak N. Moharir
4,
Abhay M. Varade
5,
Nitin Liladhar Rane
6,
Johnbosco C. Egbueri
7 and
Fahad Alshehri
3
1
Department of Soil and Water Engineering, CTAE, Maharana Pratap University of Agriculture and Technology, Udaipur 313001, Rajasthan, India
2
Indian Institute of Tropical Meteorology, Pune 411008, Maharashtra, India
3
Abdullah Alrushaid Chair for Earth Science Remote Sensing Research, Geology and Geophysics Department, College of Science, King Saud University, Riyadh 11451, Saudi Arabia
4
Department of Earth Science, Banasthali University, Jaipur 302001, Rajasthan, India
5
Department of Geology, Rashtrasant Tukadoji Maharaj Nagpur University, Nagpur 440001, Maharashtra, India
6
Vivekanand Education Society’s College of Architecture, Mumbai 400074, Maharashtra, India
7
Department of Geology, Chukwuemeka Odumegwu Ojukwu University, Uli 6059, Nigeria
*
Authors to whom correspondence should be addressed.
Sustainability 2023, 15(9), 7593; https://doi.org/10.3390/su15097593
Submission received: 30 March 2023 / Revised: 26 April 2023 / Accepted: 29 April 2023 / Published: 5 May 2023
(This article belongs to the Special Issue Groundwater Hydrology, Contamination, and Sustainable Development)

Abstract

:
The present study was carried out using artificial neural network (ANN) model for predicting the sodium hazardness, i.e., sodium adsorption ratio (SAR), percent sodium (%Na) residual, Kelly’s ratio (KR), and residual sodium carbonate (RSC) in the groundwater of the Pratapgarh district of Southern Rajasthan, India. This study focuses on verifying the suitability of water for irrigational purpose, wherein more groundwater decline coupled with water quality problems compared to the other areas are observed. The southern part of the Rajasthan State is more populated as compared to the rest of the parts. The southern part of the Rajasthan is more populated as compared to the rest of the Rajasthan, which leads to the industrialization, urbanization, and evolutionary changes in the agricultural production in the southern region. Therefore, it is necessary to propose innovative methods for analyzing and predicting the water quality (WQ) for agricultural use. The study aims to develop an optimized artificial neural network (ANN) model to predict the sodium hazardness of groundwater for irrigation purposes. The ANN model was developed using ‘nntool’ in MATLAB software. The ANN model was trained and validated for ten years (2010–2020) of water quality data. An L-M 3-layer back propagation technique was adopted in ANN architecture to develop a reliable and accurate model for predicting the suitability of groundwater for irrigation. Furthermore, statistical performance indicators, such as RMSE, IA, R, and MBE, were used to check the consistency of ANN prediction results. The developed ANN model, i.e., ANN4 (3-12-1), ANN4 (4-15-1), ANN1 (4-5-1), and ANN4 (3-12-1), were found best suited for SAR, %Na, RSC, and KR water quality indicators for the Pratapgarh district. The performance analysis of the developed model (3-12-1) led to a correlation coefficient = 1, IA = 1, RMS = 0.14, and MBE = 0.0050. Hence, the proposed model provides a satisfactory match to the empirically generated datasets in the observed wells. This development of water quality modeling using an ANN model may help to useful for the planning of sustainable management and groundwater resources with crop suitability plans as per water quality.

1. Introduction

Groundwater represents a major source of water for irrigation, domestic, and household activities, as well as for industrial purposes, mainly in arid and sub-humid areas of Rajasthan, India. However, the over extraction of groundwater in these area leads to the deterioration of water quality, aquifer compaction, and major declines in water levels. In Rajasthan, approximately 68% of groundwater is utilized for irrigation and 85% for domestic purpose. Meanwhile, the surface water contribution in irrigation shrunk from 59% to 31% between 1950 and the 2000s [1]. Geochemical and physical analysis is an assessment of groundwater quality characteristics in relation to drinking and irrigation requirements [2,3]. The primary factor that affects the groundwater quality is geogenic activity, i.e., mixing of host rock, rock and water interaction, climatic effect, as well as the hydrogeological influence, e.g., high water level, soil composition, and anthropogenic factors, covering the human, agricultural and industrial activities [4,5,6]. It is crucial to evaluate the quality of groundwater focused on its physical, chemical, and biological properties in relation to its effects on human health and its intended uses [7]. Therefore, it is essential to assess water quality in order to effectively manage the existing water resources and establish alternative treatment approaches in the relevant places.
The quality of groundwater for irrigation is significantly influenced by the ratio of cations and anions, as well as the concentration of salts in the groundwater. The different irrigation suitability parameters, i.e., sodium adsorption ratio, residual sodium carbonate, Kelly’s ratio, and percent sodium, play an important function affecting the decisions concerning groundwater quality for agricultural practices [8,9]. The assessment of irrigation water quality must emphasize salt concentration, which causes soil salinity and influences soil fertility and agricultural yield [10].
Chen et al. [11] performed a thorough research on three aspects, including forward, recurrent, and hybrid architectures, based on ANN water quality predictions. The variables were mainly acquired through the sensor and monitored by specific instruments, such as a UV-visible photometer. The analysis of the results showed the efficacy of the different models in predicting the groundwater, river water and waste water qualities; and also in irrigation suitability. Yilma et al. [12] generated an ANN network and highlighted its suitability for forecasting water quality index (WQI) in Ethiopia’s Akaki region. Moreover, Wagh et al. [13] used an ANN model to measure and characterize the physicochemical parameters of drinking water. In general, ML models are less interested in intricate process processes and more focused on the connection of mapping between a system’s inputs and results [10,14]. With or without prior knowledge, the examined system’s extremely nonlinear relations can be accurately calculated by gaining information from a huge quantity of historical datasets containing the dynamic evolutionary process. For predicting crop growth and similar to irrigation water for agriculture puprosesa, a perform water quality assessment using a variety of machine learning algorithms, i.e., artificial neural network, have been created successfully (ANN) and used in irrigation water quality [10].
The sodium adsorption ratio (SAR) measures the hazardness of Na (Sodium) in irrigation water. In heavy soils, the high sodium content of irrigation water may have a negative effect on soil physical properties and impact the hydraulic characteristics. The concentration of sodium that will be absorbed by a soil depends on the proportion of sodium to divalent ions (Ca and Mg), which is explained by the sodium adsorption ratio (SAR) [15]. As a result, it is advised to avoid using water with a SAR > 10 (mmolesl−1) 0.5. The variation in the concentration of irrigation water quality parameters may be a reflection of the area’s various agricultural activities [16].
The southern part of the Rajasthan State is more populated as compared to remaining parts, which leads to the industrialization, urbanization, and evolutionary changes in the agricultural production in the southern region [7,13]. In addition, the excess application of fertilizers on the opium crop deteriorates the surface, sub-surface soil, and water in the region [17]. Consequently, an evaluation of WQ is essential for the better use of available water resources and the development of various techniques for remediation in the southern part of Rajasthan [18]. Therefore, it is necessary to propose innovative methods for analyzing and predicting the water quality (WQ) for agricultural use [19]. Keeping this in view, the focus of the work aims to develop an optimized artificial neural network (ANN) model to predict the sodium hazardness of groundwater for irrigation purposes. This is important because high levels of sodium in irrigation water can lead to soil degradation and reduced crop yields. To accurately predict sodium hazardness, several physicochemical parameters were identified, including SAR (sodium adsorption ratio), RSC (residual sodium carbonate), KR (Kelly’s ratio), and %Na (percentage of sodium).
The ANN model uses the feed-forward backpropagation algorithm, which is a common technique used in machine learning for training artificial neural networks. The model was optimized by selecting the appropriate number of hidden layers, neurons in each layer, and activation functions. The results of the study showed that the optimized ANN model had a high degree of accuracy in predicting the sodium hazardness of groundwater for irrigation purposes. This suggests that the model can be used as a valuable tool for farmers and policymakers to assess the suitability of groundwater for irrigation and to make informed decisions about crop selection and irrigation management practices. Overall, the study highlights the importance of using advanced techniques, such as artificial neural networks, to address complex environmental problems. By leveraging the power of machine learning, researchers and practitioners can gain a deeper understanding of the complex relationships between environmental variables and make more informed decisions about resource management.
This study will help to assess the pattern of irrigation water quality mainly in arid and sub-humid climates within a limited time period [3,19,20]. The main objectives of this research are: (1) to explore the ability of ML models, namely the ANN model: (2) to achieve the predication of input and output water quality layers, such as Ca, Mg, Na, K, CO3, and HCO3, as well as sodium absorption ratio (SAR), residual sodium carbonate (RSC), percentage sodium (%Na) and Kelly’s ratio (KR); (3) to obtain results of statistical performance evaluation of ANN Model.
The importance of conducting this research lies in the fact that water quality is an essential factor in determining the suitability of water for various purposes, including agricultural, industrial, and domestic use. The ability to accurately predict water quality parameters, such as Ca, Mg, Na, K, CO3, HCO3, SAR, RSC, %Na, and KR, using machine learning models such as ANN can help in better managing and utilizing the available water resources. Furthermore, the accurate prediction of water quality parameters can also aid in mitigating potential health hazards associated with consuming contaminated water, which is a significant concern in many parts of the world. By accurately predicting water quality parameters, stakeholders can take appropriate measures to prevent or minimize the impact of potential contamination, such as identifying and addressing pollution sources. Conducting this research in the study area is necessary because water quality can vary significantly depending on the specific location, climate, and other factors. Therefore, it is crucial to develop models that are tailored to the unique characteristics of the study area to achieve accurate predictions. Moreover, the study area may have specific water quality concerns that need to be addressed, which can be identified through the statistical performance evaluation of the ANN model.

2. Materials and Methods

2.1. Study Area

The Pratapgarh district is located in the southern part of Rajasthan State. It stretches between 23°24′00″ to 24°36′00″ north latitude and 74°00′ to 75°22′30″ east longitude covering an area of 4400.7 km2 (Figure 1). The area encompasses a diverse range of geographical and physical characteristics, ranging from thick jungle to mountainous terrain. The Pratapgarh area experiences a sub-humid to semi-arid climatic condition and receives the rainfall (700 mm) mainly from the south-westerly monsoon [17,18]. It comes under the humid southern plain agro-climatic zones, in which temperature ranges from 11.8 to 43.2 °C during January and May, respectively [17,21].
Five types of geological formation (phyllite–schist, gneiss, granite, and basalt) including hillocks are present in the district. The upper part of the Pratapgarh district is covered by the meta-sedimentary rocks of the ‘Aravalli’, ‘Bhilwara’, and ‘Vindhayan’ Super group. The phyllite, quartzite, dolomite and shale, slates, limestone, and dolomitic marble cover junks of subsurface area in the district [20]. The limestone formation occupies the northern to eastern part of the district in Chhoti Sadri and Pratapgarh blocks. The granite formation covers large areas in central parts of Pratapgarh and Dhariwad blocks [22].
The basaltic formation spans over southern part of the district and covers a majority of the villages [18]. These kinds of rock formations are not regarded as reliable sources of groundwater. Within the contact surface of basalt and other lithological units, there is a significant prospect for groundwater. According to recent drilling operations, it the hard rock aquifer in the area is made up of basalt, granite/gneiss, phyllite, and other minerals [23].
The area under investigation has major production of opium crop followed by wheat, barley, maize, groundnut, mustard, and soybean. The total crop water requirement of the district is 795.56 MCM, and the projected crop water demand will be 1047 MCM in 2025 [24].

2.2. Methodology

The application of ANN technique was used to predict the irrigation water quality parameters in 76 wells of the study area during pre- and post-monsoon season for 15 years (2005–2020). Some data were collected through manual survey of study area and remaining data were collected from the Rajasthan Groundwater Department, Jaipur. The collected data required normalization before the processing. MATLAB software was employed for the ANN analysis. On the basis of analytical results and their analysis in the developed model, the suitability of groundwater in the study area for irrigation use will be discussed and recommended.

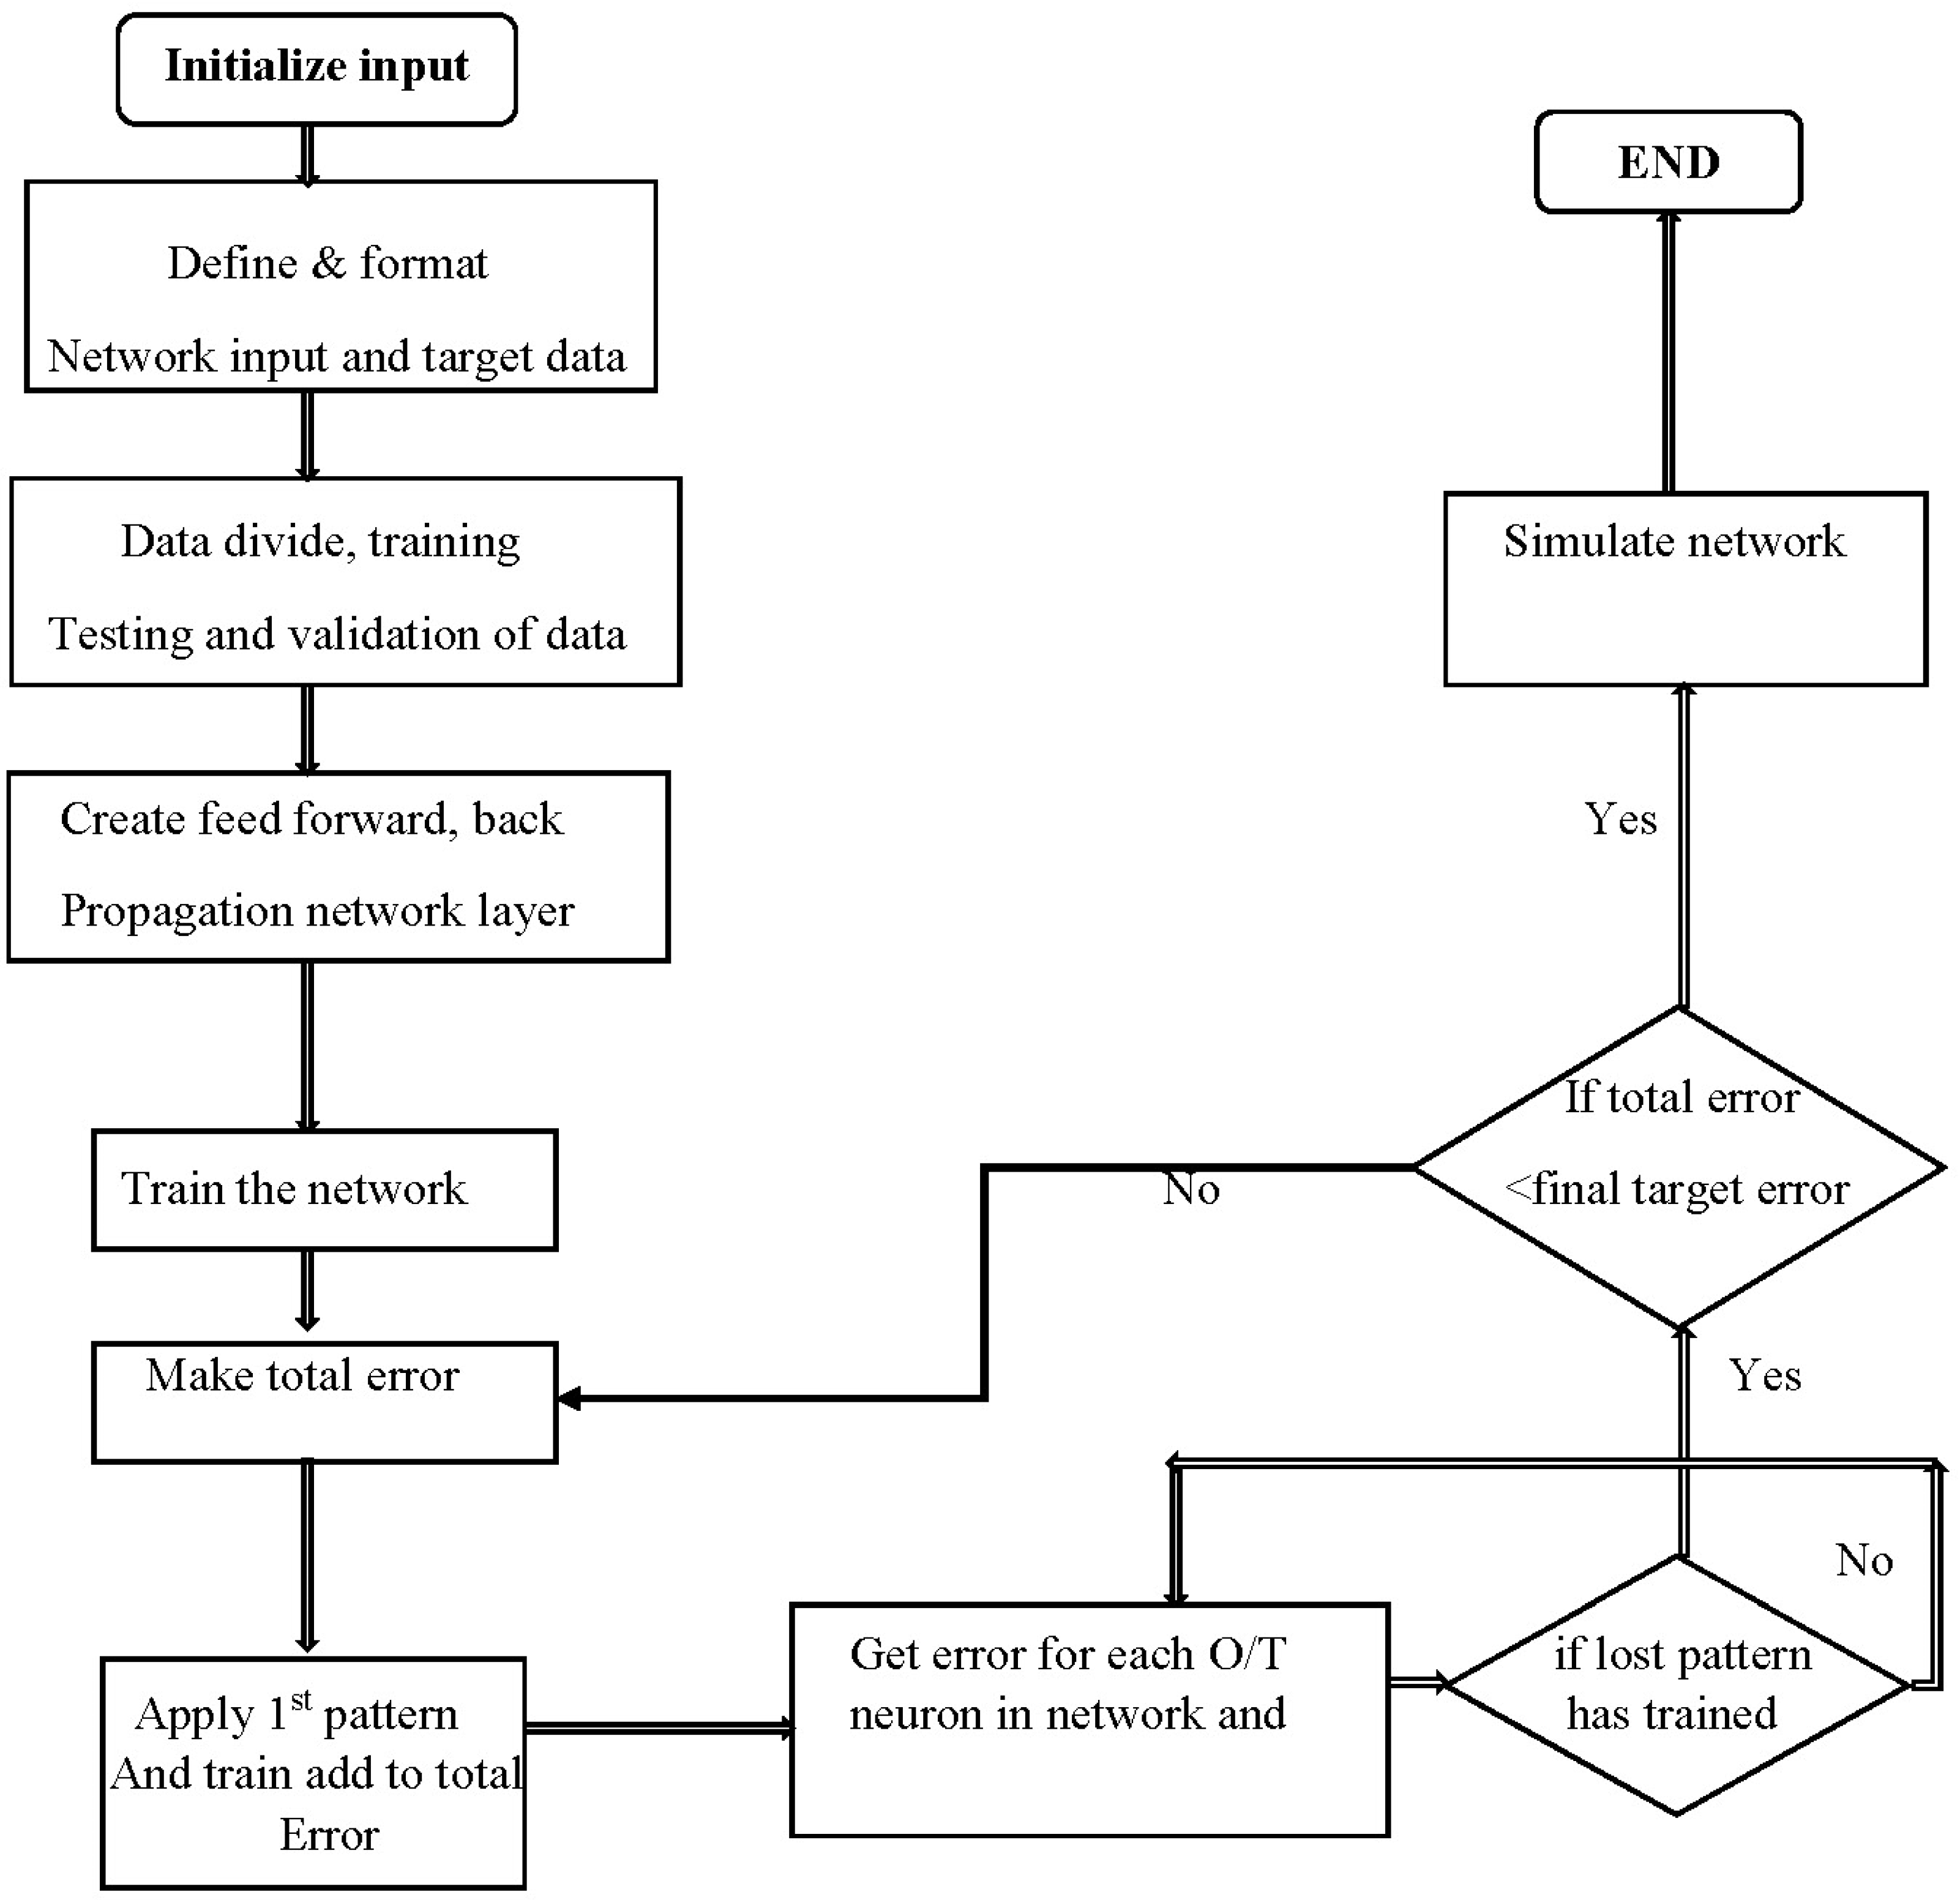
2.2.1. Development of ANN Model

To develop an accurate artificial neural network (ANN) models, it is essential to divide the data into training and testing sets. The training data are utilized to determine the relationship between observed and predicted outputs. In the present study, ten years of data (2010–2020) were collected for prediction modeling. To achieve desirable forecasting results, several ANN architectures with varying numbers of hidden neurons were developed. The training process is carefully monitored by cross-validation techniques, and the network’s performance is evaluated using the test datasets. In this study, various training algorithms and functions were applied using the ‘nntool’ of MATLAB 2018a software. The choice of algorithm and function depends on the nature of the problem and the dataset [25]. The performance of the ANN models was assessed based on various metrics, such as mean squared error, root mean squared error, mean absolute error, and correlation coefficient. The results showed that the models with higher numbers of hidden neurons and appropriate training algorithms and functions had better prediction accuracy. This dataset was divided into two parts, training and testing sets, which is crucial for the perfect development of ANN models for the predication of sodium hazard for irrigation water quality. The choice of algorithm and function should be based on the nature of the problem and the dataset. By carefully monitoring the training process and evaluating the performance of the models using appropriate metrics, we can develop ANN models with high prediction accuracy.

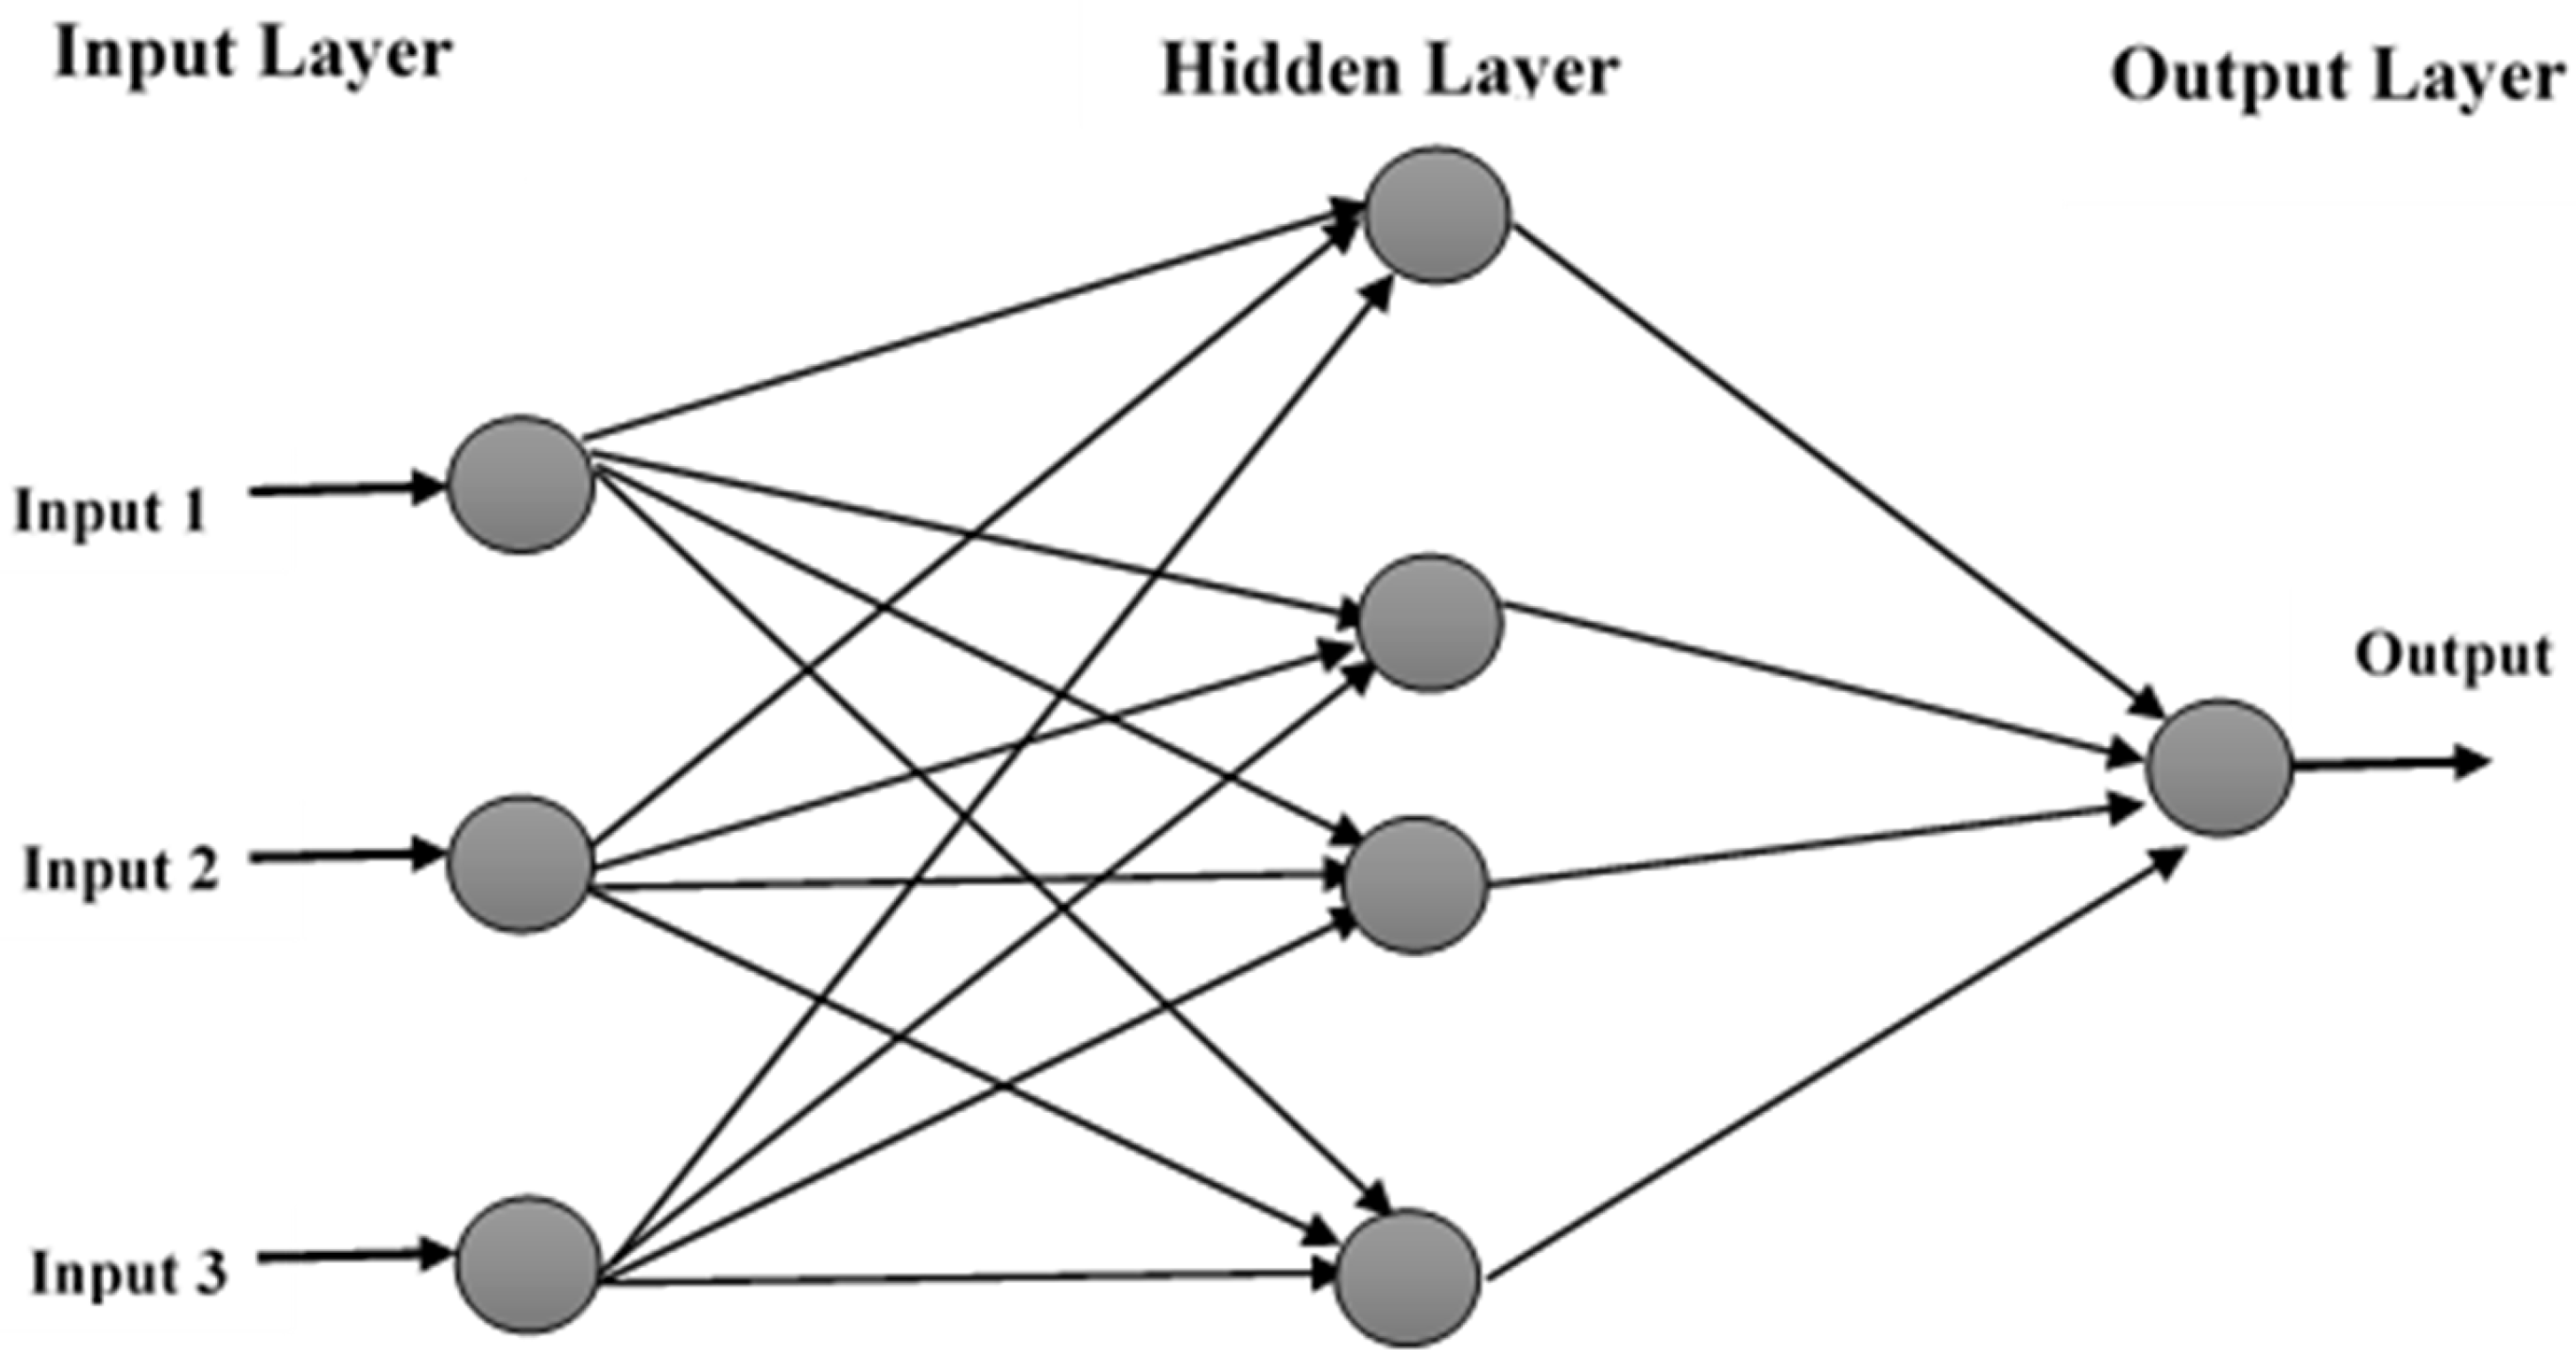
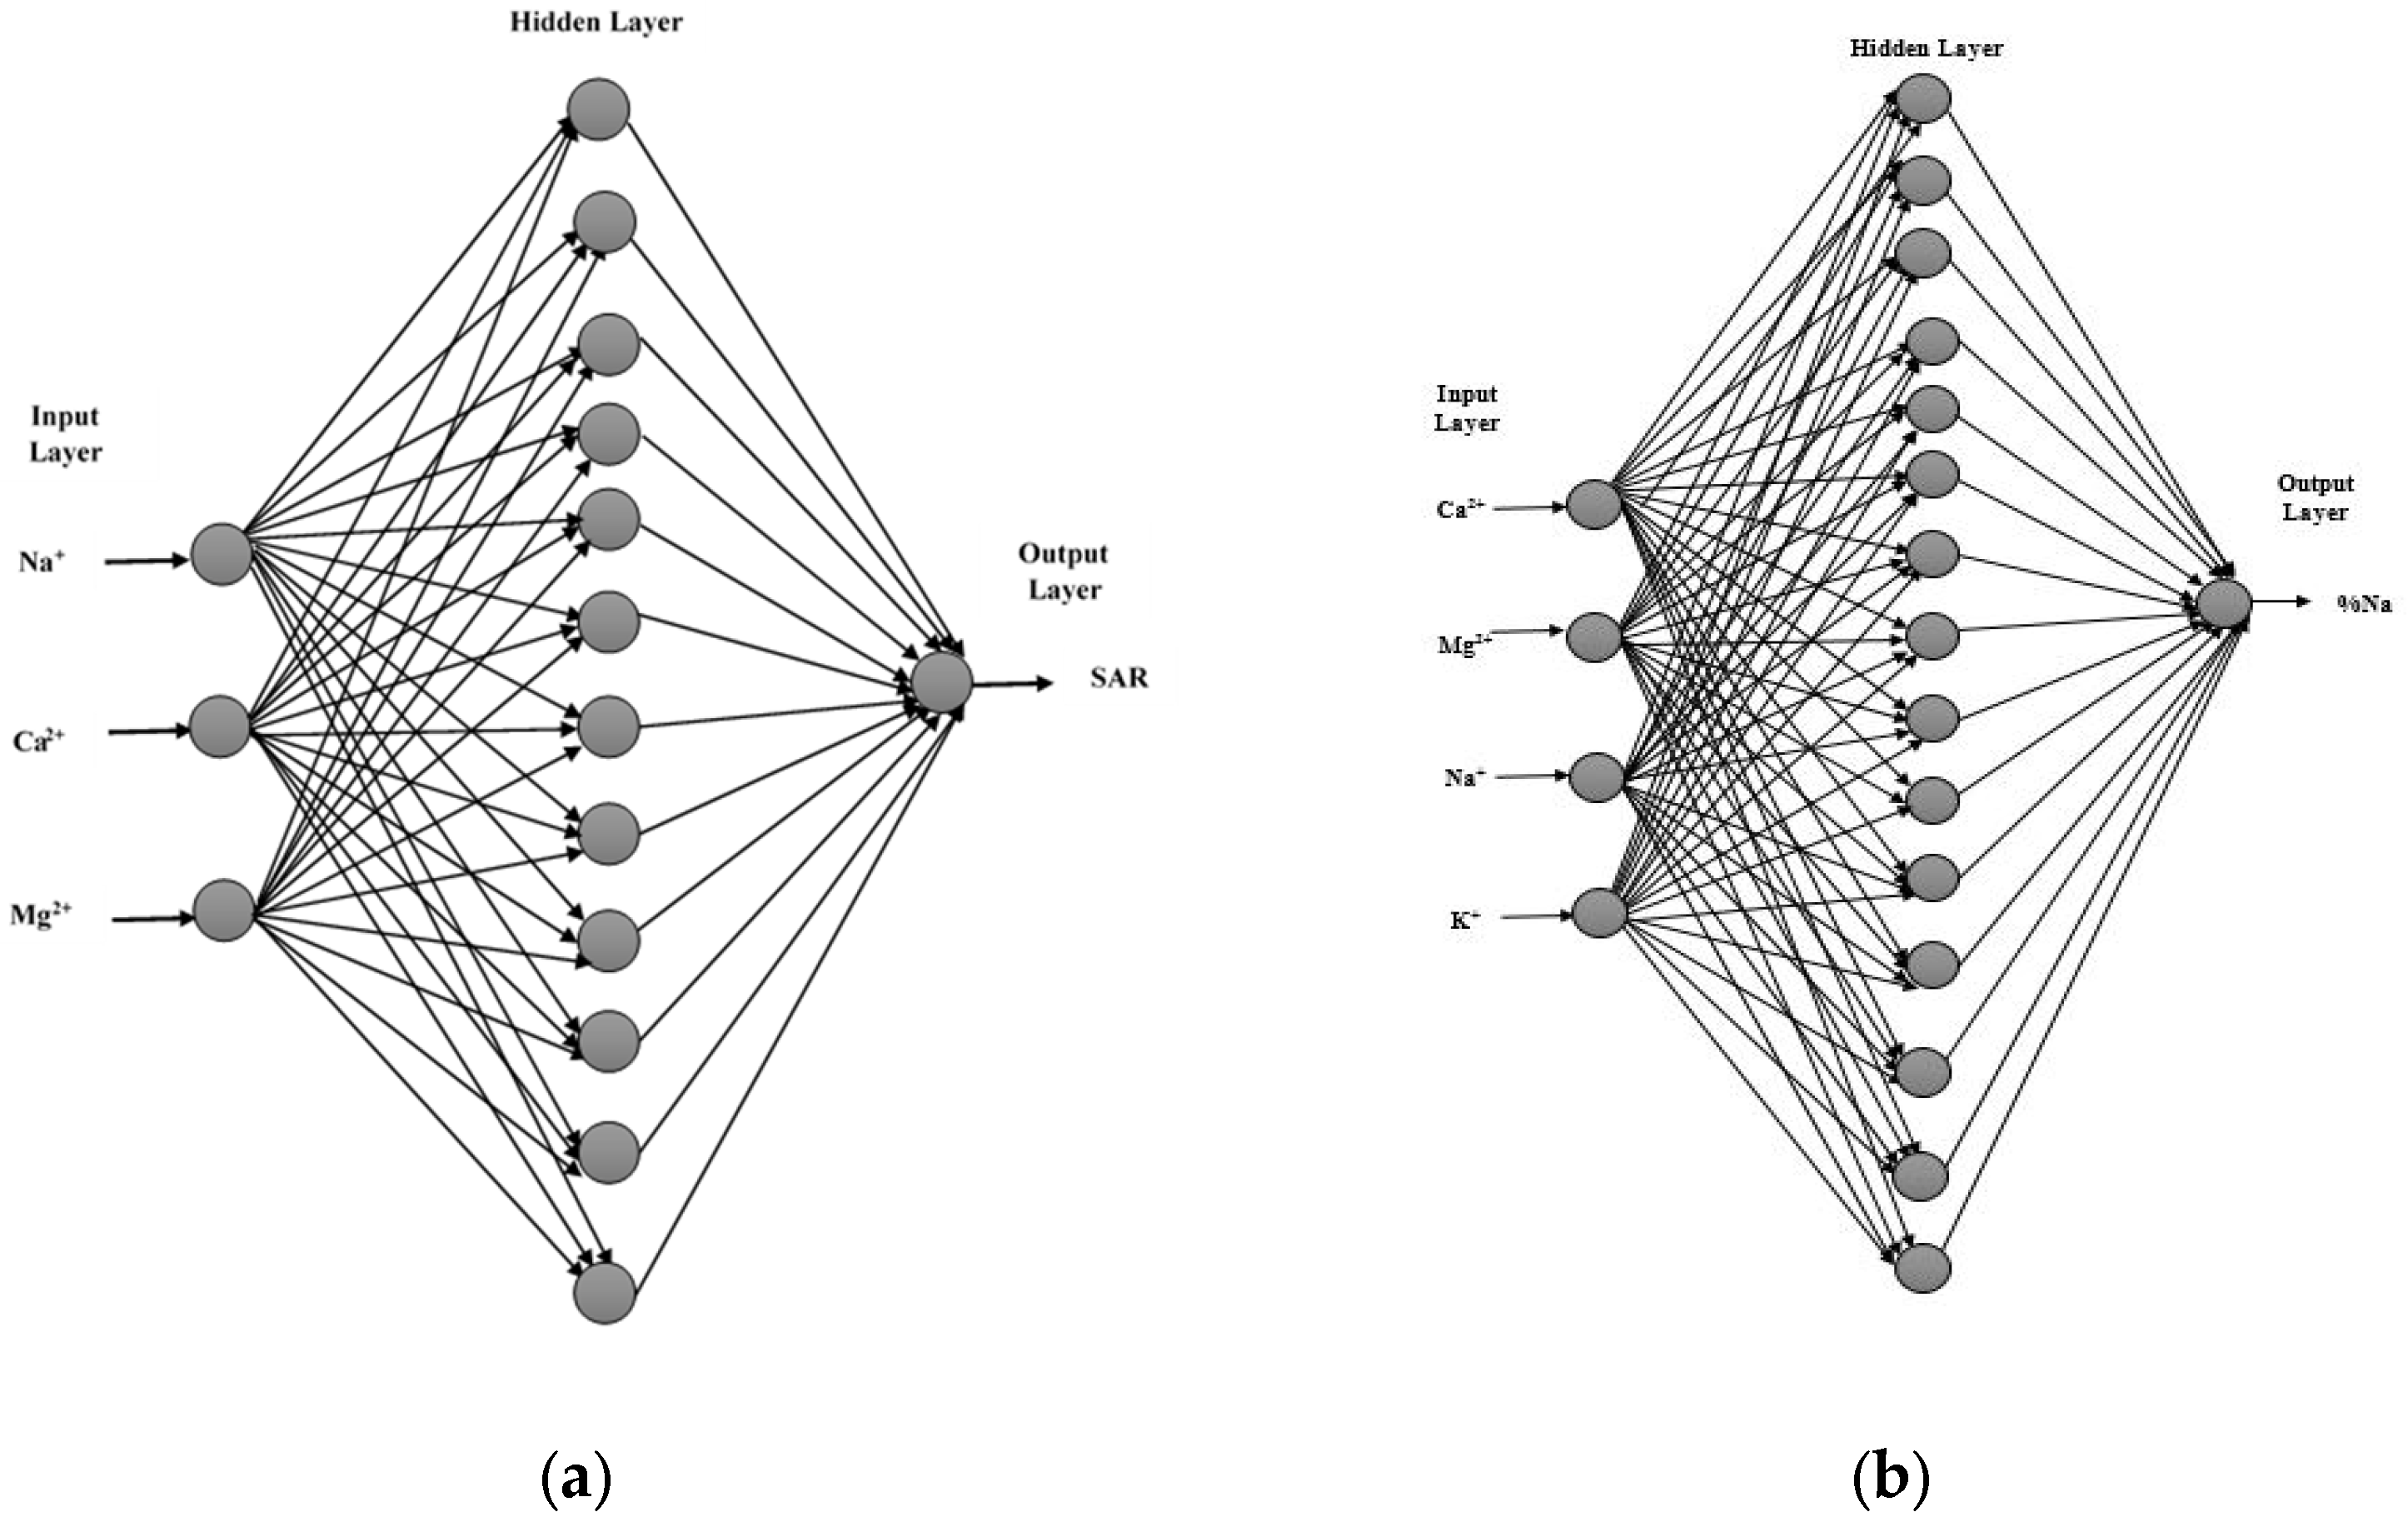
2.2.2. Selection of Input and Output Layer

When developing a neural network model for predicting irrigation water quality parameters, the selection of input layers is critical and depends on the desired output layers. In a recent study all six water quality parameters, including Ca, Mg, Na, K, CO3, and HCO3, were selected as input parameters for predicting the sodium absorption ratio (SAR), residual sodium carbonate (RSC), percentage sodium (%Na), and Kelly’s ratio (KR) parameters. These four parameters represent the sodium hazardness of irrigation water. The SAR is an important parameter used to assess the suitability of water for irrigation purposes. It is calculated as the ratio of the concentration of sodium ions to the sum of the concentration of calcium and magnesium ions in the water. A high SAR value indicates that the water may cause soil degradation and negatively impact crop growth. The RSC is another parameter that reflects the water’s potential to generate alkalinity when used for irrigation. A high RSC value indicates that the water contains a high concentration of bicarbonate ions and may cause soil salinization. The %Na parameter is the percentage of sodium ions in the water relative to the total cation concentration. It is an important indicator of the water’s potential to cause soil degradation and negatively impact crop growth. Kelly’s ratio (KR) is a comprehensive parameter that considers the SAR, RSC, and %Na parameters. It is a useful tool for assessing the suitability of irrigation water for agricultural purposes. In this study, the six water quality parameters were selected as input, and SAR, RSC, %Na, and KR (Table 1) were chosen as output parameters to represent the sodium hazardness of irrigation water. These parameters provide valuable information for assessing the suitability of water for agricultural purposes and can help farmers make informed decisions about irrigation practices.

2.2.3. Hidden Layers

Determination of hidden layer and node is a trial-and-error task in artificial neural network modelling. There is a rule of thumb for the selection of hidden layer, according to which number of samples in the training set should be greater than number of synaptic weight [26]. After ensuring that all of the other parameters for the output variables are constant, the number of neurons is optimized. As a result, the error rate dropped for the dataset that possessed the ideal number of hidden neurons. The common structure of an ANN model is illustrated (Figure 2).
Some suggested reviews for the selection of the number of hidden neurons in an ANN model are listed in Table 2. In Figure 3, the operational working of an ANN model is represented.

2.2.4. Data Normalization

It is necessary to normalize data before their application to the ANN model as input. Data normalization helps to reduce the time of process and to get more improved, reliable output. The normalized data are in the range of 0–1. The normalization of data ensures that all the input parameters receive equal attention during training phase of modeling [31]. The following Equation (1) shows the normalization of data [13].
X norm = X 0   X min X max X min
where Xnorm = normalized data, Xmin = maximum, minimum value in data series, and X0 = original data.
The division of normalized data could have an important impact on the model output [32]. Hence, the normalized data were divided in to three subsets, i.e., training (70%) and cross validation (30%). Based on this approach, 15-year datasets were split in to training (798 samples) and cross validation (342 samples).
Further, the renormalization of data to original values is carried out by restoring Equation (2):
X0 = Xnorm × (Xmax − Xmin) + Xmin

2.2.5. Training and Testing of Data

The training procedure is carried out by providing randomly selected samples to the ANN network [33]. Back-propagation training and Levenberg–Marquardt optimization algorithm, which is the most commonly used neural network method, was used in this analysis. The training was carried out by feeding the network with 70% (seven years of data) for training datasets, and the remaining 30% (three years of data) data were used as testing datasets [34,35].

2.2.6. Statistical Performance Evaluation of ANN Model

A model can be tested by contrasting its forecasting with the values actually measured in the over fitting test set after it has been trained on the training set. Using R, RMSE, MBE, and IA statistical indicators, as well as goodness of curve fit metrics, the simulation of training and testing datasets was analyzed [36,37,38].

Correlation Coefficient (R)

The coefficient of correlation (R) describes the degree of linear relationship between the observed and predicted values. It shows how closely predicted values follow actual observed values in terms of trend.
R = P O P O N P 2 P 2 N O 2 O 2 N
where, N is total number of observations in the dataset, P is a predicted value, and O is an observed value.

Root Mean Square Error (RMSE)

The root mean square error (RMSE) indicator attempts to measure the degree of error between two data sets. It compares a predicted value with an observed value, to be more precise. Predicted and observed values are closer together when the RMSE is smaller. The magnitude of the errors is estimated by the RMSE. It is a measure of accuracy that is used to compare prediction error from different estimators for a specific variable, but not among variables, because this indicator is scale-dependent [39].
RMSE = 1 N i = 1 n ( P i O i ) 2
where N is the total number of observations in the data set, Pi is a predicted value, and Oi is an observed value.

Mean Bias Error (MBE)

Mean bias error is commonly used to determine the mean bias in the model and to determine whether any actions are required to correct the bias. The MBE evaluates the mean bias in a prediction [40]. A variable with a positive bias or error indicates that the data from the datasets are overstated and simultaneously.
MBE = 1 N i = 1 n P i O i
where N is total number of observations in the data set, Pi is a predicted values, and Oi is an observed value.

Index of Agreement (IA)

The ratio of mean square error to potential error is represented by the agreement index, which ranges from 0 to 1, where a value of 1 indicates a perfect match, while a value of 0 indicates no accord at all [41].
d = 1 i = 1 N P i O i 2 i = 1 N . ( P i | O i | ) 2 d 1
where Oi = observed value, Pi = Predicted value, Ō = Mean observed value, and N = number of observations.

3. Result and Discussions

To evaluate and predict the groundwater suitability for irrigation purposes, some parameters, as listed in the Table 3, are used as an input layer with the different hidden neurons in the ANN model.

3.1. Prediction of Irrigation Water Quality Parameters

The ANN prediction models for irrigation water quality parameters, including Kelly’s ratio (KR), percent sodium (%Na), residual sodium carbonate (RSC), and sodium absorption ratio (SAR) were developed using MATLAB’s ‘nntool’. The selection of model parameters, i.e., input, output, and model structure, was an essential task for ANN modeling. Multilayer feed forward back propagation (MLFBP) with a ‘Tansig’ transfer function was used to develop the ANN model. An artificial neural network (ANN) model can be used to predict the quality of irrigation water. The model takes into account various parameters, such as pH, electrical conductivity (EC), sodium adsorption ratio (SAR), total dissolved solids (TDS), and bicarbonate (HCO3) concentration. The ANN model is trained using a dataset of historical water quality parameters and corresponding irrigation suitability classifications. The trained model can then be used to predict the suitability of irrigation water based on input parameters.
The accuracy of the ANN model’s predictions can be evaluated by comparing the predicted irrigation suitability classifications with actual classifications determined through the physical analysis of water samples. The model’s accuracy can be improved by adjusting the model’s hyper parameters and optimizing the training process. Overall, an ANN model can be a useful tool for predicting irrigation water quality parameters and ensuring that water is suitable for irrigation purposes.

3.1.1. Performance Evaluation of Sodium Absorption Ratio (SAR)

The ANN structure 3-12-1 (ANN4) was found to be the best performing model with the value of R, RMSE, IA, and MBE of 1, 0.18, 1, and 0.0117, respectively, for the training phase and 1, 0.16, 1, and 0.0137 for the testing phase. In Table 4, it is clear that ANN model 4 demonstrates good performance in the training and testing datasets as compared to the other three models. The developed graphs of the optimized model are displayed in Figure 4 in the form of time series plots, which represent a best fit between the observed and predicted SAR value (Figure 5).
Tuna et al. [42] applied the back propagation algorithm to predict groundwater quality and found satisfactory performance of the model with five input variables (EC, pH, and TDS, Cl, and total hardness), 12 hidden neurons and output variable of SAR value. This study states that a greater number of input variables and hidden layer may influence and improve the prediction values. The performance indicators, i.e., mean squared error (MSE), correlation coefficient (R), RMSE (root mean square error), IA (index of agreement), and MBE (mean biased error) of training and testing datasets of SAR parameter are presented in the Table 4.

3.1.2. Performance Evaluation of % Na

The artificial neural network (ANN) model with a structure of 4-15-1 (referred to as ANN4) was tested on training and testing datasets. The evaluation metrics used for measuring the model’s performance are R, RMSE, IA, and MBE. According to Table 4, the results show that ANN4 outperformed the other three models with a value of 1.00 for R and IA and a value of 1.80 for RMSE during the training period. Similarly, during the testing period, the values of R and IA were 1.00, RMSE was 0.72, and MBE was 0.019. These metrics indicate that the ANN4 model performed well in predicting the % Na. It is important to note that the model’s performance may vary depending on the dataset used and the specific problem being addressed. Therefore, it is crucial to validate the model’s performance using various metrics and datasets to ensure its accuracy and reliability (Figure 6 and Figure 7).

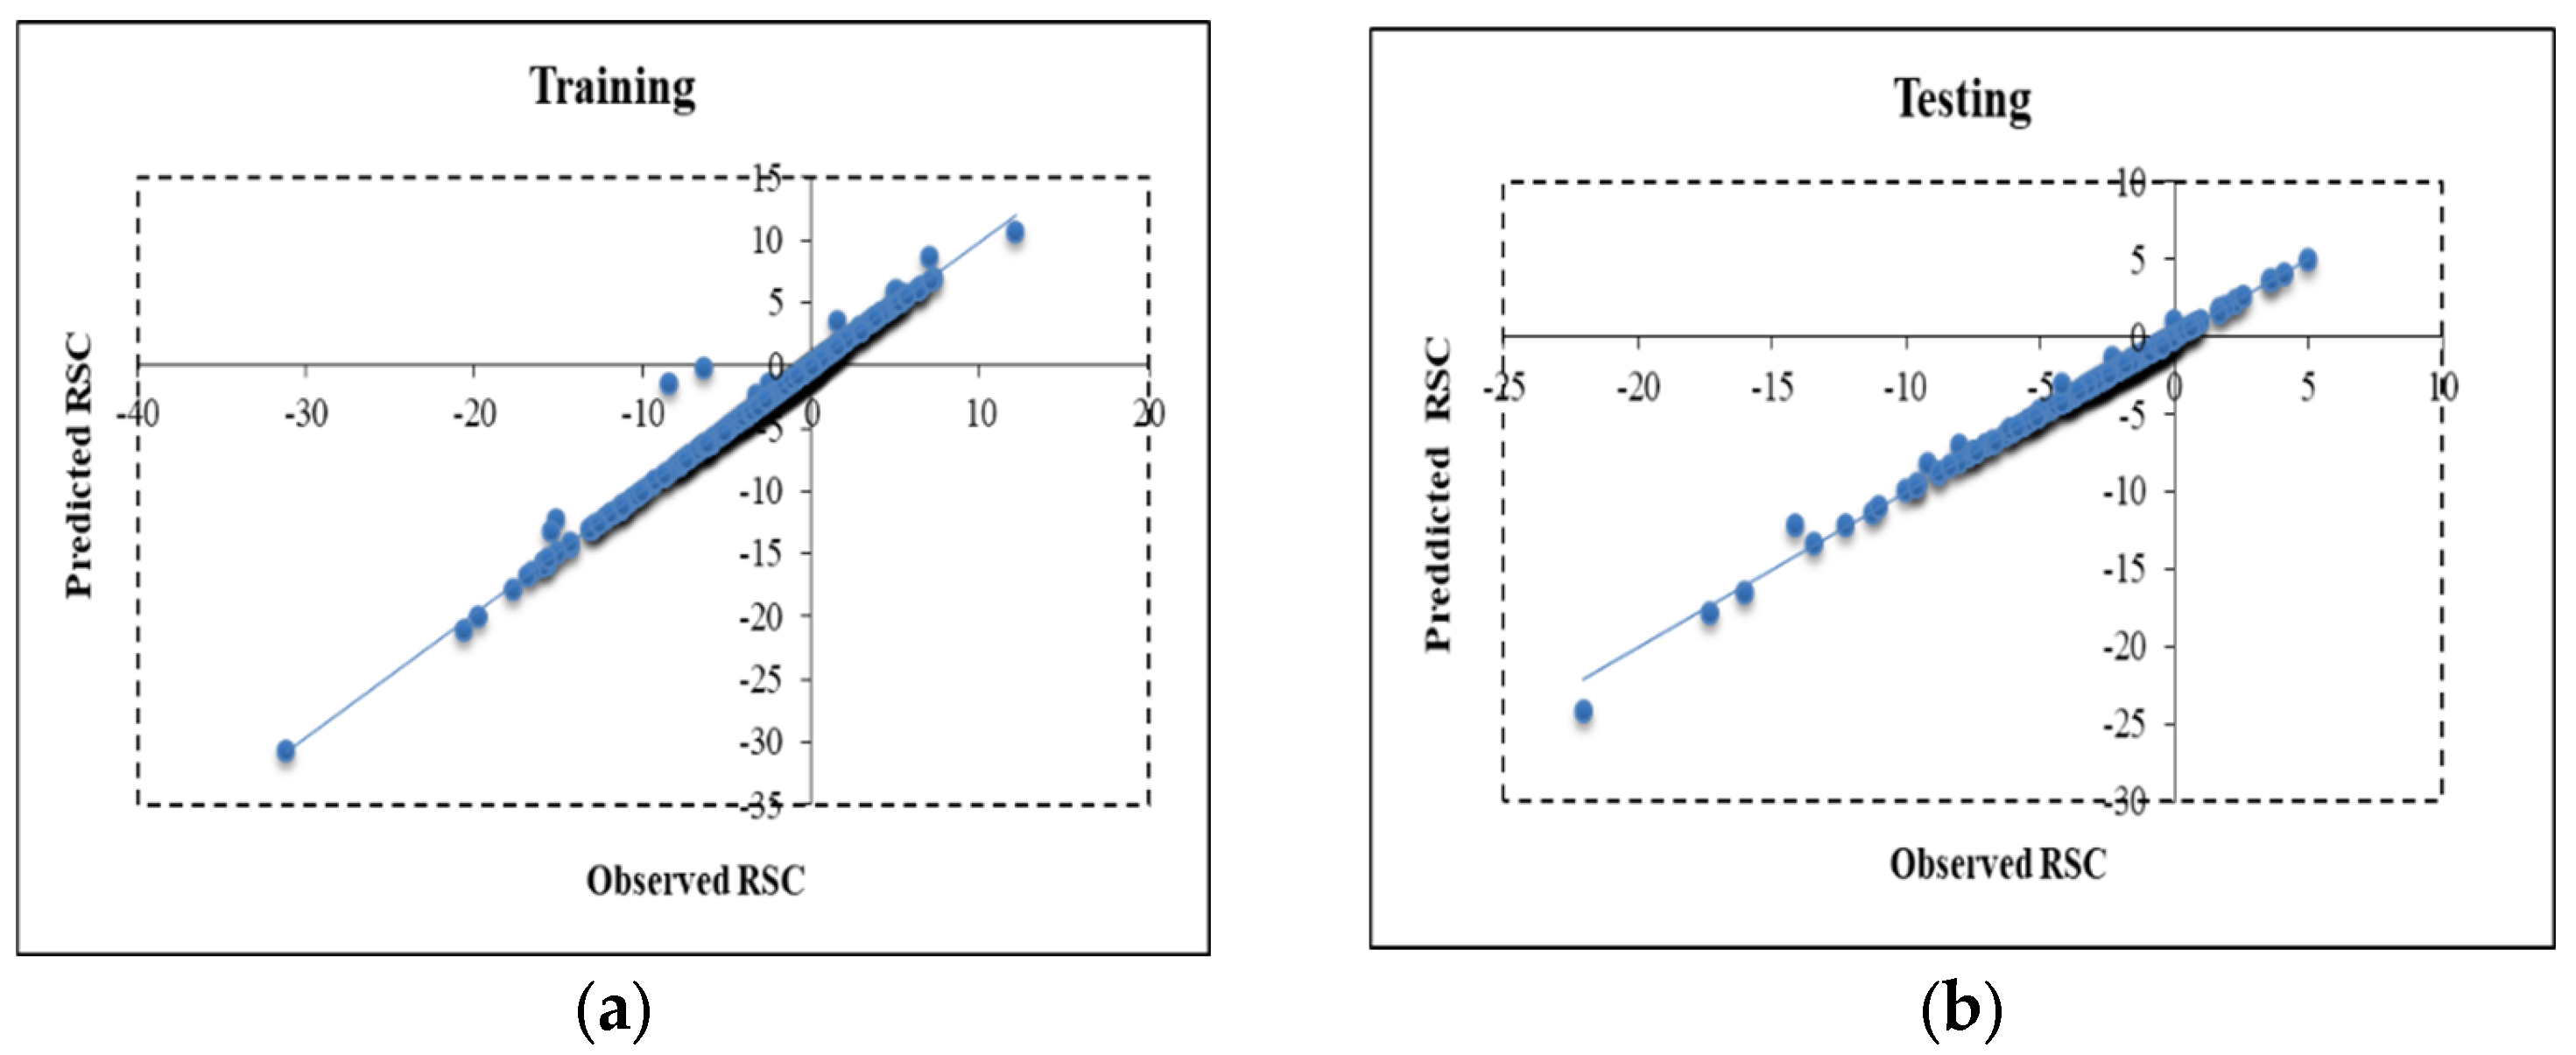
3.1.3. Performance Evaluation of Residual Sodium Carbonate (RSC)

The residual sodium carbonate (RSC) index of groundwater indicates the alkalinity risk posed by it and determines the suitability of groundwater for irrigation purposes. For crop use purposes, RSC index values should preferably be less than 1.25. The ANN model 1 was found to be the best performing model with the value of R, RMSE, IA, and MBE of 1.00, 0.38, 0.99, and 0.0253, respectively, for the training period and 1, 0.21. 0.99, and 0.0137 for the testing period. As shown in Figure 8, some positive RSC values indicate the possibility of sodium built, which may influence the soil physical properties and its permeability [19]. From Table 4, it is clear that the ANN1 (4-5-1) model demonstrates good performance in respect of training and testing datasets as compared to the other three models. Figure 8 shows the graphical form of time series plots, which represents a best fit between the observed and predicted KR ratio (Figure 9). The best performing ANN model structure of RSC is depicted. Similar results were observed by Wagh et al. [13]. The results of the model were measured using an MS excel based ANN model and the R and RMSE values of the predicted RSC model in training phase were 0.20 and 1.00, while for testing phase, 0.99 and 0.15, respectively.

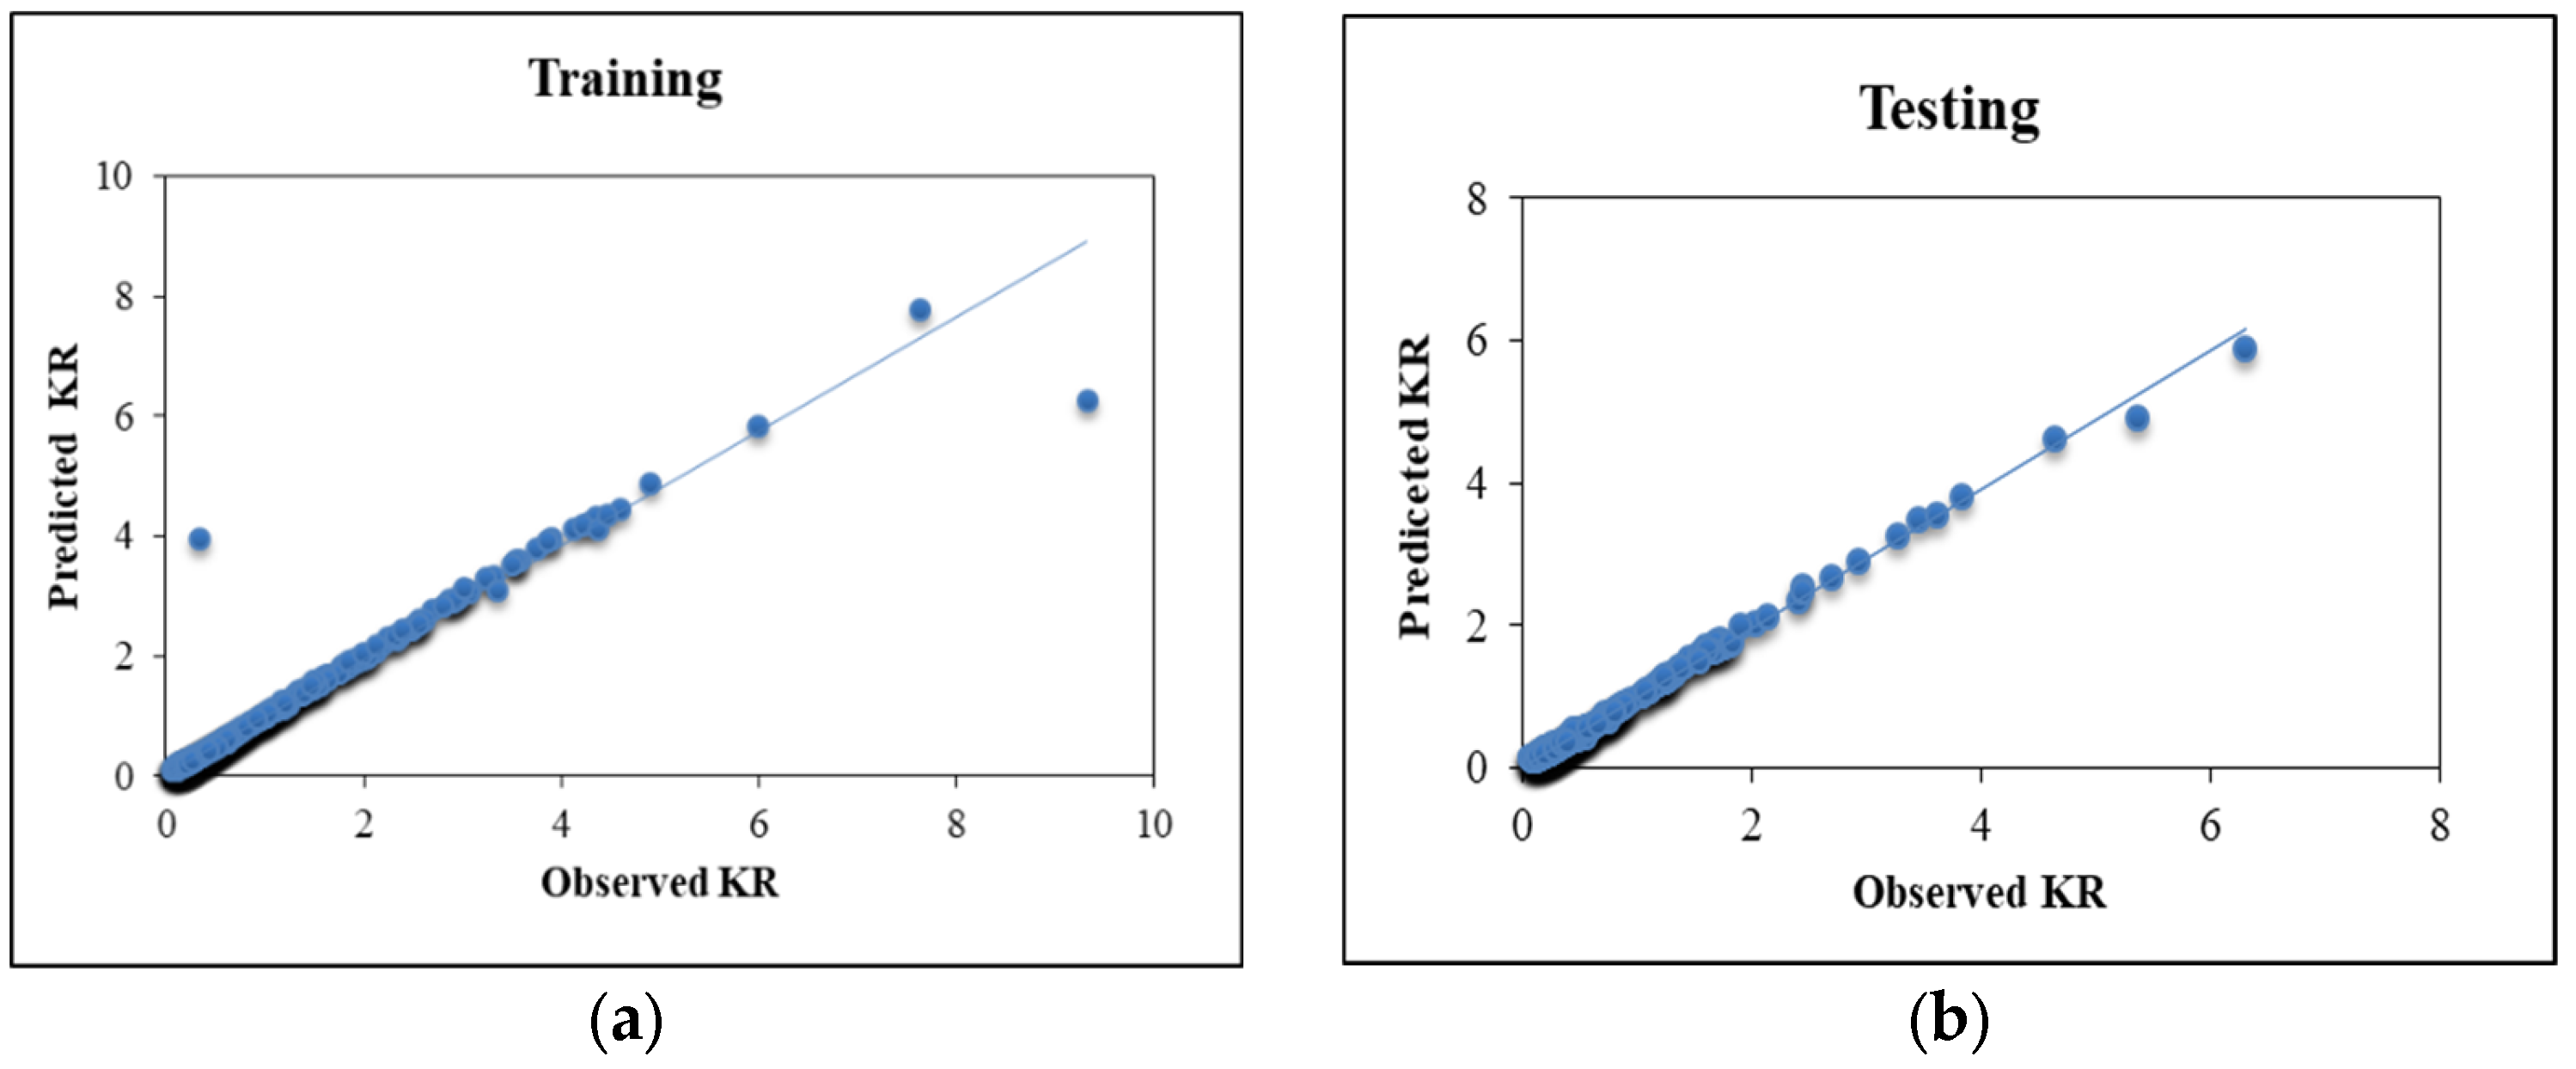
3.1.4. Performance Evaluation of Kelly’s Ratio (KR)

The input variables Na, Ca, and Mg were used in the input layer with a combination of four hidden neurons (3, 6, 9, and 12), and the output variable indicates KR ratio. It was observed that a change in the number of hidden neurons moderately affects the performance of model. Moreover, the performance indicators, i.e., R, RMSE, IA, and MBE, in training and testing periods change with the number of hidden neurons. Among all the models, the best model found for the present study was ANN4 (3-12-1), with R, RMSE, IA, and MBE values of 1.00, 0.17, 0.99 and 0.0012, respectively, for the training period and 1, 0.04, 1 and 0.0050 for the testing period. The graphical results of best performing model are displayed in Figure 10 in the form of time series plots, which represents a best fit between the observed and predicted KR ratio (Figure 11).
The performance of ANNs is generally precise and reliable, as shown in Table 4. The high coefficient of determination contributes to the proposed models high accuracy. Different hidden neurons (12, 5, 15, 12) were observed to show the smallest error rate for predicting the groundwater suitability for irrigation.
The architecture of the best performing ANN model for estimating sodium adsorption ratio (SAR), Percentage Sodium (% Na), Residual Sodium Carbonate (RSC) and Kelly’s Ratio (KR) are depicted in Figure 12a, Figure 12b, Figure 13a and Figure 13b respectively.

4. Discussion

Irrigation water quality is a crucial factor for the growth and yield of crops. Poor quality water can cause adverse effects on crops, including stunted growth, reduced yield, and even plant death. Therefore, predicting the quality of irrigation water is essential for farmers to optimize crop production and avoid losses [43]. An artificial neural network (ANN) model can be an effective tool for predicting water quality parameters relevant to irrigation [44,45]. ANN models can identify complex relationships between input parameters and output variables, making them well-suited for predicting water quality parameters based on multiple input variables [46].
In the case of predicting irrigation water quality of study area, the ANN model is trained using historical data of water quality parameters and corresponding irrigation suitability classifications. The input parameters for the model include pH, electrical conductivity (EC), sodium adsorption ratio (SAR), total dissolved solids (TDS), and bicarbonate (HCO3) concentration. The output variable is the irrigation suitability classification of the water sample [43]. After training, the ANN model can then be used to predict the irrigation suitability classification of new water samples based on their input parameters. The accuracy of the model’s predictions can be evaluated by comparing the predicted irrigation suitability classification with the actual classification determined through the physical analysis of water samples [47]. The use of ANN models for predicting irrigation water quality can save time and resources by providing quick and accurate predictions of irrigation suitability without the need for extensive laboratory testing. It can also help farmers make informed decisions about crop management, including crop selection, irrigation scheduling, and fertilizer management [43,47,48,49]. However, there are also limitations to using ANN models for predicting irrigation water quality. The accuracy of the model depends on the quality and quantity of the training data used. Additionally, the model’s accuracy may decrease when applied to water samples with significant differences from the training dataset [43]. Various studies are available on the irrigation water quality modeling, however the ANN modeling are not widely attempted in India. Hence authors have the present models applied for predicting the irrigation water quality in agriculture purpose. The development of perfect models with the most accurate values helped in predicting the irrigation water quality parameters in the study area. As compared to other studies, the present work stands alone with a novel approach having significant value. In conclusion, ANN modeling has proved as a valuable tool for predicting irrigation water quality parameters and ensuring that the water is suitable for crop production. However, the model’s limitations must be considered when interpreting its results. Hence, the results of this study should be used as a complement to traditional laboratory testing rather than a replacement.

5. Conclusions

In this study, artificial neural networks models were used to predict the concentration irrigation water quality parameters in the hard rock area of Pratapgarh District. The ANN models were developed using time series data of water quality parameters as an input layer. The models were trained and validated for Na, Mg, K, CaCO3, and HCO3 concentration. Existence of a good relation in between observed and predicted outcomes was observed in the statistical performance test. In order to collect significant and reliable data on water quality parameters, the use of ANN can be an alternative model that can help significantly in water quality prediction. Furthermore, statistical performance indicators, such as, RMSE, IA, R, and MBE, were applied to assess the consistency of the development of ANN model outputs. The developed ANN models, i.e., ANN4 (3-12-1), ANN4 (4-15-1), ANN1 (4-5-1), and ANN4 (3-12-1) were found best suited for SAR, %Na, RSC, and KR water quality indicators for the study area. Based on the predicted values of RMSE, R, MBE, and IA indicators, RSC and % Na were determined to be more reliable than SAR and KR quality parameters. The proposed model provided a good fit to the empirically collected dataset in the 76 observation wells. Therefore, the developed model may be applicable to predict the groundwater suitability of ground water for irrigation in an easy manner. However, when the WQ input parameters are uncertain, as happened in the WQ datasets, ANN models may not be able to present the non-linear relationship concealed in the dataset. This model may help to develop a sustainable management plan for groundwater resources for drinking and agriculture use by responsible authorities. Furthermore, spatial maps can be developed for the proposed ANN model for greater clarity in the obtained results. This ANN model can be adopted for the early detection of WQ contamination by the local authorities. Firstly, the study only used time series data of water quality parameters as input, and the ANN models were developed based on these inputs. This means that the accuracy and reliability of the models are dependent on the quality and quantity of the input data. Therefore, the models may not be generalizable to other regions or situations where different water quality parameters or sources are present. Secondly, while the study proposed the use of the developed ANN models for the early detection of water quality contamination by local authorities, it did not address the practical implications of such a system, including the necessary resources and infrastructure required for such monitoring and detection systems.

Author Contributions

Conceptualization, C.B.P.; Methodology, V.K.G.; Software, V.K.G. and C.B.P.; Validation, V.K.G.; Formal analysis, V.K.G. and C.B.P.; Investigation, C.B.P.; Writing—original draft, V.K.G. and C.B.P.; Writing—review & editing, C.B.P., K.N.M., A.M.V., N.L.R., J.C.E. and F.A. All authors have read and agreed to the published version of the manuscript.

Funding

This research received no external funding.

Data Availability Statement

The datasets used and/or analysed during the current study are available from the first author on reasonable request.

Acknowledgments

The authors extend their appreciation to Abdullah Alrushaid Chair for Earth Science Remote Sensing Research for funding.

Conflicts of Interest

The authors declare no conflict of interest.

References

  1. Central Ground Water Board. Groundwater quality in shallow aquifers of India; Ministry of Water Resources, Govt. of India: Nagpur, India, 2010; p. 294. [Google Scholar]
  2. Gazzaz, N.M.; Yusoff, M.K.; Aris, A.Z. Artificial neural network modelling of the water quality index for Kinta River (Malaysia) using water quality variables as predictors. Pollut. Bull. 2012, 64, 2409–2420. [Google Scholar] [CrossRef] [PubMed]
  3. Wagh, V.M.; Panaskar, D.B.; Muley, A.A.; Mukate, S.V. Groundwater suitability evaluation by CCME WQI model for Kadava River Basin, Nashik, Maharashtra, India. Model. Earth Syst. Environ. 2017, 3, 557–565. [Google Scholar] [CrossRef]
  4. Keesari, T.; Ramakumar, K.L.; Chidambaram, S.; Pethperumal, S.; Thilagavathi, R. Understanding the hydro chemical behavior of groundwater and its suitability for drinking and agricultural purposes in Pondicherry area, South India–A step towards sustainable development. Groundw. Sustain. Dev. 2016, 2, 143–153. [Google Scholar] [CrossRef]
  5. Howladar, M.F. An assessment of surface water chemistry with its possible sources of pollution around the Barapukuria Thermal Power Plant Impacted Area, Dinajpur, Bangladesh. Groundw. Sustain. Dev. 2017, 5, 38–48. [Google Scholar] [CrossRef]
  6. Lakshmi, S.P.; Sankari, S.G.; Prasanna, S.M.; Madhurambal, G. Evaluation of Water Quality Suitability for Drinking using Drinking Water Quality Index in Nagapattinam district, Tamil Nadu in Southern India. Groundw. Sustain. Dev. 2017, 6, 43–49. [Google Scholar]
  7. Mukate, S.; Panaskar, D.; Wagh, V.; Muley, A.; Jangam, C.; Pawar, R. Impact of anthropogenic inputs on water quality in Chincholi industrial area of Solapur, Maharashtra, India. Groundw. Sustain. Dev. 2018, 7, 359–371. [Google Scholar] [CrossRef]
  8. Kelley, W.P. Use of saline irrigation water. Soil Sci. 1963, 95, 385–391. [Google Scholar] [CrossRef]
  9. Doneen, L.D. Water Quality for Agriculture; Department of Irrigation, University of Calfornia: Oakland, CA, USA, 1985. [Google Scholar]
  10. Kouadri, S.; Pande, C.B.; Panneerselvam, B. Prediction of irrigation groundwater quality parameters using ANN, LSTM, and MLR models. Environ. Sci. Pollut. Res. 2022, 29, 21067–21091. [Google Scholar] [CrossRef]
  11. Chen, Z.; Liu, Q.; Lian, C. Point Lane Net: Efficient End-to-End CNNs for Accurate Real-Time Lane Detection; IEEE Intelligent Vehicles Symposium: Paris, France, 2019; pp. 2563–2568. [Google Scholar] [CrossRef]
  12. Yilma, M.; Kiflie, Z.; Windsperger, A.; Gessese, N. Application of artificial neural network in water quality index prediction: A case study in Little Akaki River, Addis Ababa, Ethiopia. Model. Earth Syst. Environ. 2018, 4, 175–187. [Google Scholar] [CrossRef]
  13. Wagh, V.M.; Panaskar, D.B.; Varade, A.M. Major ion chemistry and quality assessment of the groundwater resources of Nanded tehsil, a part of southeast Deccan Volcanic Province, Maharashtra, India. Environ. Earth Sci. 2016, 75, 1–26. [Google Scholar] [CrossRef]
  14. Elbeltagi, A.; Pande, C.B.; Kouadri, S.; Islam, A.R.M.T. Applications of various data-driven models for the prediction of groundwater quality index in the Akot basin, Maharashtra, India. Environ. Sci. Pollut. Res. 2022, 22, 17591–17605. [Google Scholar] [CrossRef] [PubMed]
  15. Bouwer, H. Wastewater Reuse in Arid Area Water Reuse; Middlebrook, E.J., Ed.; Ann Arbor Science Publisher, Inc.: Ann Arbor, MI, USA, 1976; pp. 137–180. [Google Scholar]
  16. Ogunfowokan, A.O.; Obisanya, J.F.; Ogunkoya, O.O. Salinity and sodium hazards of three streams of different agricultural land use systems in Ile-Ife, Nigeria. Appl. Water Sci. 2013, 3, 19–28. [Google Scholar] [CrossRef]
  17. Gautam, V.K.; Kothari, M.; Singh, P.K.; Bhakar, S.R.; Yadav, K.K. Spatial mapping of groundwater quality using GIS for Jakham River basin of Southern Rajasthan. Environ. Conserv. J. 2022, 23, 22–32. [Google Scholar] [CrossRef]
  18. Gautam, V.K.; Kothari, M.; Singh, P.K.; Bhakar, S.R.; Yadav, K.K. Decadal groundwater level changes in Pratapgarh District of Southern Rajasthan, India. Ecol. Environ. Conserv. 2022, 28, 283–289. [Google Scholar] [CrossRef]
  19. Kadam, A.K.; Wagh, V.M.; Muley, A.A.; Umrikar, B.N.; Sankhua, R.N. Prediction of water quality index using artificial neural network and multiple linear regression modelling approach in Shivganga River basin, India. Model. Earth Syst. Environ. 2019, 5, 951–962. [Google Scholar] [CrossRef]
  20. Keskin, T.E.; Düğenci, M.; Kaçaroğlu, F. Prediction of water pollution sources using artificial neural networks in the study areas of Sivas, Karabük and Bartın (Turkey). Env. Earth Sci. 2015, 73, 5333–5347. [Google Scholar] [CrossRef]
  21. Indian Council of Agriculture Research, New Delhi. Available online: www.icar.org (accessed on 22 April 2023).
  22. Machiwal, D.; Jha, M.K.; Mal, B.C. GIS-based assessment and characterization of groundwater quality in a hard-rock hilly terrain of Western India. Environ. Monit. Assess. 2011, 174, 645–663. [Google Scholar] [CrossRef]
  23. Central Ground Water Board. Groundwater Quality in Shallow Aquifers of India; Ministry of Water Resources, Govt. of India: Nagpur, India, 2013; p. 294. [Google Scholar]
  24. Singh, P.K.; Singh, M. Technical Bulletin on Water Budgeting of Rajasthan; Agrotech Publishing House: Udaipur, India, 2020; pp. 50–60. [Google Scholar]
  25. Shafie, A.; Najah, A.; Alsulami, H.M.; Jahanbani, H. Optimized Neural Network Prediction Model for Potential Evapotranspiration Utilizing Ensemble Procedure. Water Resour. Manag. 2014, 28, 947–967. [Google Scholar] [CrossRef]
  26. Tarassenko, L. A Guide to Neural Computing Applications; Arnold Publishers: London, UK, 1998. [Google Scholar]
  27. Wang, F. The use of artificial neural networks in a geographical information system for agricultural land-suitability assessment. Environ. Plan. 1994, 26, 265–284. [Google Scholar] [CrossRef]
  28. Piramuthu, S.; Shaw, M.J.; Gentry, J.A. A classification approach using multi-layered neural networks. Decis. Support Syst. 1994, 11, 509–525. [Google Scholar] [CrossRef]
  29. Lenard, M.J.; Alam, P.; Madey, G.R. The application of neural networks and a qualitative response model to the auditor’s going concern uncertainty decision. Decis. Sci. 1995, 26, 209–227. [Google Scholar] [CrossRef]
  30. Kanellopoulos, I.; Wilkinson, G. Strategies and best practice for neural network image classification. Int. J. Remote Sens. 1997, 18, 711–725. [Google Scholar] [CrossRef]
  31. Nourani, V.; Baghanam, A.H.; Adamowski, J.; Gebremichael, M. Using self-organizing maps and wavelet transforms for space–time pre-processing of satellite precipitation and runoff data in neural network based rainfall–runoff modelling. J. Hydrol. 2013, 476, 228–243. [Google Scholar] [CrossRef]
  32. Chang, F.J.; Tsai, W.P.; Chen, H.K.; Yam, R.S.W.; Herricks, E.E. A self-organizing radial basis network for estimating riverine fish diversity. J. Hydrol. 2013, 476, 280–289. [Google Scholar] [CrossRef]
  33. Ghassan, A.A.; Aman, J. A new approach based on honeybee to improve intrusion detection system using neural network and Bees Algorithm. Software Engineering and Computer Systems. Commun. Comput. Inf. Sci. 2011, 181, 777–792. [Google Scholar]
  34. Bhange, H.N.; Mahale, D.M.; Ingle, P.M.; Singh, P.K. Prediction of Water Quality Parameters for Irrigation in Konkan Region using Artificial Neural Network Technique. J. Indian Soc. Coast. Agric. Res. 2018, 36, 122–127. [Google Scholar]
  35. Bhange, H.N.; Mahale, D.M.; Ingle, P.M.; Singh, P.K. Prediction of irrigation water quality technique in the K. Res. J. Recent Sci. 2019, 8, 12–16. [Google Scholar]
  36. Khudair, B.H.; Jasim, M.M.; Alsaqqar, A.S. Artificial neural network model for the prediction of groundwater quality. Civ. Eng. J. 2018, 4, 2959–2970. [Google Scholar] [CrossRef]
  37. Ayers, R.S.; Westcot, D.W. Water Quality for Agriculture; Irrigation and Drainage Paper 29; FAO: Rome, Italy, 1994; p. 174. [Google Scholar]
  38. Jenkins, S.H. Standard Methods for the Examination of Water and Wastewater. Water Res. 1982, 16, 1495–1496. [Google Scholar] [CrossRef]
  39. Gautam, V.K.; Kothari, M.; Singh, P.K.; Bhakar, S.R.; Yadav, K.K. Determination of geomorphological characteristics of Jakham River Basin using GIS technique. Indian J. Ecol. 2021, 48, 1627–1634. [Google Scholar]
  40. Neural Networks. Neural Networks Professional Version 2.0 CPC-X Software, Copyright: 1997-2003. A Demo Version Downloaded from the Internet. Available online: http://www.geocities.com/neuralpower (accessed on 22 March 2023).
  41. Willmott, C.J. On the validation model. Phys. Geogr. 1981, 2, 184–194. [Google Scholar] [CrossRef]
  42. Tuna, G.; Kılıçaslan, Y.; Gezer, G.; Gulez, K.; Arkoc, O.; Potirakis, S.M. ANN-Based Estimation of Groundwater Quality Using a Wireless Water Quality Network. Int. J. Distrib. Sens. Netw. 2014, 10, 458329. [Google Scholar] [CrossRef]
  43. Kouadri, S.; Elbeltagi, A.; Islam, A.R.M.T.; Kateb, S. Performance of machine learning methods in predicting water quality index based on irregular data set: Application on Illizi region (Algerian southeast). Appl. Water Sci. 2021, 11, 190–210. [Google Scholar] [CrossRef]
  44. Tian, W.; Liao, Z.; Zhang, J. An optimization of artificial neural network model for predicting chlorophyll dynamics. Ecol. Model 2017, 364, 42–52. [Google Scholar] [CrossRef]
  45. Moharir, K.; Pande, C.; Singh, S.; Choudhari, P.; Rawat, K.; Jeyakumar, L. Spatial interpolation approach-based appraisal of groundwater quality of arid regions in. Aqua J. 2019, 68, 431–447. [Google Scholar] [CrossRef]
  46. Lu, H.; Ma, X. Hybrid decision tree-based machine learning models for short term water quality prediction. Chemosphere 2020, 249, 126169. [Google Scholar] [CrossRef]
  47. Liu, P.; Wang, J.; Sangaiah, A.; Xie, Y.; Yin, X. Analysis and prediction of water quality using LSTM deep neural networks in IoT environment. Sustainability 2019, 11, 2058. [Google Scholar] [CrossRef]
  48. Pande, C.B.; Moharir, K.N.; Singh, S.K.; Dzwairo, B. Groundwater evaluation for drinking purposes using statistical index: Study of Akola and Buldhana districts of Maharashtra, India. Env. Dev. Sustain. 2020, 22, 7453–7471. [Google Scholar] [CrossRef]
  49. Pande, C.B.; Moharir, K. Spatial analysis of groundwater quality mapping in hard rock area in the Akola and Buldhana districts of Maharashtra, India. Appl. Water Sci. 2018, 8, 106. [Google Scholar] [CrossRef]
Figure 1. Location map of study area.
Sustainability 15 07593 g001
Figure 2. General structure of ANN network.
Sustainability 15 07593 g002
Figure 3. Operational Flowchart for ANN Modelling.
Sustainability 15 07593 g003
Figure 4. Comparison of Observed and Predicted SAR Value.
Sustainability 15 07593 g004
Figure 5. Scatter plot of Observed and Predicted SAR ratio for ANN4 (3-12-1) (a) Training (b) Testing.
Sustainability 15 07593 g005
Figure 6. Comparison of Observed and Predicted %Na Value.
Sustainability 15 07593 g006
Figure 7. Scatter Plot of Observed and Predicted % Na Values for ANN4 (4-15-1) (a) Training (b) Testing.
Sustainability 15 07593 g007
Figure 8. Comparison of Observed and Predicted RSC value.
Sustainability 15 07593 g008
Figure 9. Scatter plot of Observed and predicted RSC values for ANN1 (4-5-1) (a) Training (b) Testing.
Sustainability 15 07593 g009
Figure 10. Comparison of Observed and Predicted KR value.
Sustainability 15 07593 g010
Figure 11. Scatter plot of Observed and Predicted KR ratio for ANN4 (3-12-1) (a) Training (b) Testing.
Sustainability 15 07593 g011
Figure 12. Optimized ANN Network Structure for (a) SAR and (b) %Na parameter.
Sustainability 15 07593 g012
Figure 13. Optimized ANN Network Structure for (a) RSC and (b) KR parameter.
Sustainability 15 07593 g013
Table 1. Selected water quality parameters for input and output layers.
S.No.Input Layer ParameterOutput Layer Parameter
1.Na+, Ca2+, Mg2+Sodium Absorption Ratio (SAR)
2.Ca2+, Mg2+, CO32−, HCO3Residual Sodium Carbonate (RSC)
3.Na+, K+, Ca2+, Mg2+Percentage Sodium (%Na)
4.Na+, Ca2+, Mg2+, HCO3Permeability Index (PI)
5.Na+, Ca2+, Mg2+Kelly’s Ratio (KR)
Table 2. Suggested methods for Selection of Number of Hidden Neurons.
S.No.MethodsFormulas
1.Wang et al. [27]2 (I/3)
2.Piramuthu et al. [28]0.5 (I + O)
3.Lenard et al. [29]0.75 I
4.Kanellopoulos and Wilkinson [30]2 I
Where, I is a no. of input parameters, O is output parameters.
Table 3. Statistics of Water quality parameters used in the analysis.
ParametersMeanMaximumMinimumRecommend BIS/WHO Limits
pH8.178.478.016.5–8.5
EC8641834526500
Na3.195.840.94200
K0.170.730.0610
Ca2.925.581.8475
Mg2.965.851.9050
HOC33.604.792.63200
CO30.220.630.03-
All parameter values are expressed in mg/L; EC is in μS/cm and pH on scale.
Table 4. Optimized (best fit) ANN model for irrigation water quality parameter.
S.No.WQ ParameterANN Model & ArchitectureTrainingTesting
RRMSEIAMBERRMSEIAMBE
1SARANN4 (3-12-1)10.1810.011710.1610.0137
2%NaANN4 (4-15-1)11.8010.01210.7210.019
3RSCANN1 (4-5-1)10.380.990.025310.210.990.0137
4KRANN4 (3-12-1)10.170.990.001210.0410.0050
Disclaimer/Publisher’s Note: The statements, opinions and data contained in all publications are solely those of the individual author(s) and contributor(s) and not of MDPI and/or the editor(s). MDPI and/or the editor(s) disclaim responsibility for any injury to people or property resulting from any ideas, methods, instructions or products referred to in the content.

