Article

Improved Fracture Surface Analysis of Anticline Rocky Slopes Using a Modified AGA Approach: Feasibility and Effectiveness Evaluation

1
Institute of Road and Bridge Engineering, Hunan Communication Engineering Polytechnic, Changsha 410132, China
2
School of Civil Engineering, Central South University, Changsha 410075, China
*
Author to whom correspondence should be addressed.
Sustainability 2023, 15(9), 7455; https://doi.org/10.3390/su15097455
Submission received: 3 April 2023 / Revised: 26 April 2023 / Accepted: 29 April 2023 / Published: 1 May 2023
(This article belongs to the Special Issue Advances in Sustainable Geotechnical Structure and Geomaterials)

Abstract

:
This study aims to evaluate the feasibility and effectiveness of a modified adaptive genetic algorithm (AGA) with Universal Distinct Element Code (UDEC) simulation in analyzing fracture surface feature points of an anticline rocky slope. Using coordinate data from 30 fracture surface feature points, the traditional GA and modified AGA methods were compared, with the mean value of the normalized Mahalanobis distance indicating the reliability of the results. The study found that the modified AGA approach with UDEC had a significantly smaller mean value of normalized Mahalanobis distance than the traditional GA approach, demonstrating its higher accuracy and reliability in analyzing the fracture surface feature points of the rocky slope. Additionally, the research found that the location of the fracture surface of the anticline rocky slope is closely related to the inhomogeneous bulk density caused by weathering. These findings contribute to sustainability efforts by improving our understanding of the behavior of rocky slopes, informing better land management and infrastructure planning, and reducing uncertainties in predicting the behavior of rocky slopes for more sustainable infrastructure development and land management practices.

1. Introduction

Predicting failure surfaces is a critical aspect of promoting sustainability in geological engineering projects, including houses, tunnels, and bridges. Failure surface prediction is also essential in rocky slope disaster warning systems, which can help prevent potential hazards and risks to human life and the environment. However, accurately predicting failure surfaces in natural settings can be a challenging task. Therefore, this study aims to provide a more accurate method for predicting the failure surfaces of rocky slopes in natural settings. The findings from this study can aid in the development of effective slope management and maintenance practices and contribute to promoting the sustainability of infrastructure projects. To achieve this goal, this study focuses on the diverse landscapes in southwestern China to understand how natural geography, humidity, earthquakes, and strong winds affect the overall stability of rocky slopes. A coupled approach is used to investigate the complex factors that contribute to failure surface prediction. This research aims to contribute to promoting sustainable land use practices in the region, reducing the risks of natural disasters, and protecting human lives and properties along the way. However, there are several challenges associated with analyzing and predicting fracture surfaces of materials. These challenges include obtaining a representative sample of the fracture surface, as it can be complex and contain multiple features such as secondary cracks, delaminations, and voids. Analytical methods can be destructive, making it difficult to analyze the same area multiple times. Some analytical techniques require specialized equipment and expertise, which may not always be readily available. Finally, the interpretation of the results may be subjective and require skilled interpretation.
Goodman and Bray, as cited in Adhikary et al. and Hoek and Bray [1,2], conducted an extensive study on the formation and mechanism of damage in rocky slopes, classifying tipping damage into two categories: basic tipping types, such as bending tipping, rock mass tipping, and rock mass bending tipping, and secondary tipping types. Hocking and Huang [3,4] refined the damage mode of slopes using the kinematic principle without any slip forces. Liu and Chen [5] proposed a classification system that assessed the stability of rock slopes by considering geological, geometric, and environmental factors, which further improved the empirical method of the rock classification system (Raghuvanshi, 2019). The limit equilibrium method is widely used in slope stability analysis due to its easy calculation and simple principle, as cited in Ahmadi and Eslami, Hamza and Raghuvanshi, Huang, Janicak et al., Tang et al., and Yang and Zou [4,6,7,8,9,10]. However, the general research idea is to replace the natural slope’s soil inhomogeneity with soil with average properties or consider the rock slope’s inhomogeneity by separating different soils by depth. With the development of information technology, the combination of computationally large probabilistic methods and various specialized numerical software has inspired new ideas for exploring methods in rock slope stability analysis that are closer to real natural environments. Chowdhury et al. [11] further combined the probabilistic method to identify and evaluate the uncertainty among control parameters systematically. Tang et al. [9] used the S-curve model to define the spatially varying laminae of the shear strength parameters “c” and “ϕ” and the tensile strength of the rock mass to estimate the stability coefficients of inclined laminated rock masses and identify potential sliding surfaces. Alternatively, stability analysis considering weathering and the presence of natural pores inside rocky slopes has not been adequately concluded.
The traditional genetic algorithm (GA) is widely used for classical optimization problems that have complex solution spaces such as multimodal, multipeak, multiobjective planning, and dynamic planning (Refer to Figure 1 for a general graphical representation of the genetic algorithm′s process). Although the GA has strong comprehensive solving abilities on multiobjective data features, it is not as effective as specialized solvers for optimization problems based on specific data sets [12]. Therefore, when using the GA to solve specific compound optimization problems, the computation mechanism of the GA can be adjusted appropriately to improve performance. For instance, Zhang and Tian [13] used the GA to optimize the initial weights and thresholds of the BP neural network to comprehensively evaluate the failure behavior of high-strength hydrogen transmission pipelines, residual strength, and the effects of interactions between adjacent corrosion. Shahrokhabadi et al. [14] combined the GA with the natural element method (NEM) to calculate the potential sliding surface of the slope and safety factor. In such applications [15,16], adding the GA significantly affects the computational time. However, combining multiple methods can reduce the computational cost to some extent.
There are also some better solutions to the issues of complexity, premature convergence, and stochastic roaming of the genetic operations of GA [18]. For example, the computational flow of the GA can be optimized based on graph theory [19], and Markov chain theory [20,21] can enhance the GA’s ability to solve dynamic optimization problems. Additionally, Coelho [22] prevented the GA from converging to the local optimum prematurely using a new quantum behavior PSO (QPSO) with chaotic variational operators. However, despite these advancements, the GA method itself still faces issues, including the population generation pattern being too random and difficult to control, leading to suboptimal results.
Therefore, to improve the performance of predicting the fracture surface of nonhomogeneous anti-inclined rock slope, this paper optimizes the population generation mode based on the classical genetic algorithm (Figure 2 illustrates the article structure of this paper). Specifically, we enhance the initial population generation and selection mechanism of optimal individuals. The fracture model of a nonhomogeneous anti-inclined rock slope is then constructed by considering the inhomogeneous distribution of bulk density combined with limit equilibrium theory. Finally, we use the improved adaptive genetic algorithm (AGA) to solve the failure surface.

2. Materials and Methods

Meta-heuristic algorithms have emerged as a means of improving computational efficiency and finding optimal solutions. One such algorithm, GA, is a classical meta-heuristic algorithm that has been widely used since its inception. However, when combined with the damage mechanism of the toppling rock slope, the classical GA faces two major shortcomings. Firstly, generating the initial population that satisfies multidimensional complex constraints requires multiple cycles. Secondly, the genetic operation operator of the classical GA is too simplistic, resulting in premature convergence and random roaming phenomena.

2.1. Modified AGA

Regarding the initial population cycle generation model of classical GA, a modified method can be used. First, a feasible initial solution A in the multidimensional complex constraints domain is found. In other words, an initial individual is generated that satisfies the constraints. A unit vector d i = cos d i , sin d i in random directions and a sufficiently large number M are defined and given so that the vector domain consisting of A + M d i can geometrically cover the entire feasible domain composed of constraints. For a specific direction d i , if the numerical point of A + M d i is in the feasible domain, it is regarded as an individual in the initial population. If it does not satisfy the constraint, M is replaced by a random number M 1 0 ,   M . If A + M 1 d i still fails to meet the constraint, M 1 is replaced by another random number M 2 0 , M 1 until the numerical point of A + M 2 d i is in the feasible domain. By repeating the process n times, the initial population containing n individuals that meet the complex approximate conditions can be generated. This process can be described using Figure 3 and mathematical Equation (1) as follows:
Feasible   domain = i = 1 n A + M i d i
Regarding the optimization strategy of the genetic operator, in addition to defining the crossover probability P c and variation probability P m , the partial taboo search algorithm’s core idea is incorporated to optimize the optimal individual selection strategy, speeding up the search. The relationship between changing values of P c and P m can be found in Figure 4.
Crossover   :   V i = α c V i + 1 α c V j V j = ( 1 α c ) V i + α c V j  
Variance   :   V i = x i , 1 , x i , 2 , , x i , j , , x i , n x i , j = x i , j + α m x i , j m a x x i , j m i n V i = x i , 1 , x i , 2 , , x i , j , , x i , n
where x i , 1 , x i , 2 , , x i , j , , x i , n represents all of the genes of an individual; x i , j represents a gene after mutation; and V i represents the new individual after mutation.
Defining the crossover probability P c has the advantage of providing better control over the crossover rate of the population, thereby preventing premature convergence and stagnation. Additionally, the minimum crossover probability allows certain local optimal solutions to escape their domain interval and accelerate the global search process. The variance probability P m is important in determining the behavior and performance of the genetic algorithm [23] as it directly impacts the convergence rate of the algorithm. If P m is too large, the GA will resemble a random search algorithm, resulting in reduced search efficiency and a lower probability of finding the global optimal solution. Conversely, if P m is too small, the genetic diversity of the population decreases, and the GA loses its fundamental characteristics. A visualization of this process can be found in Figure 5.
The optimal individual selection mechanism incorporates elements of the forbidden search algorithm strategy. First, a specific initial solution is identified to optimize the objective function. Second, the solution vector corresponding to the optimal value is used as the center of a circle, with the minimum distance value of each direction to the boundary of the solution space serving as the maximum radius. This circle represents the neighborhood of the solution A X 1 A , Y 1 A . Third, when the current solution leaps from A to point B within the neighborhood, the direction value d i r ° of the leap is recorded in the taboo table, and the interval of this direction is defined as the forbidden direction interval. Therefore, during the next iteration at point B , no further leaps along this direction interval are permitted.
Finally, the above improvement scheme is summarized, and the algorithm flow depicted in Figure 6 is used to code the program.

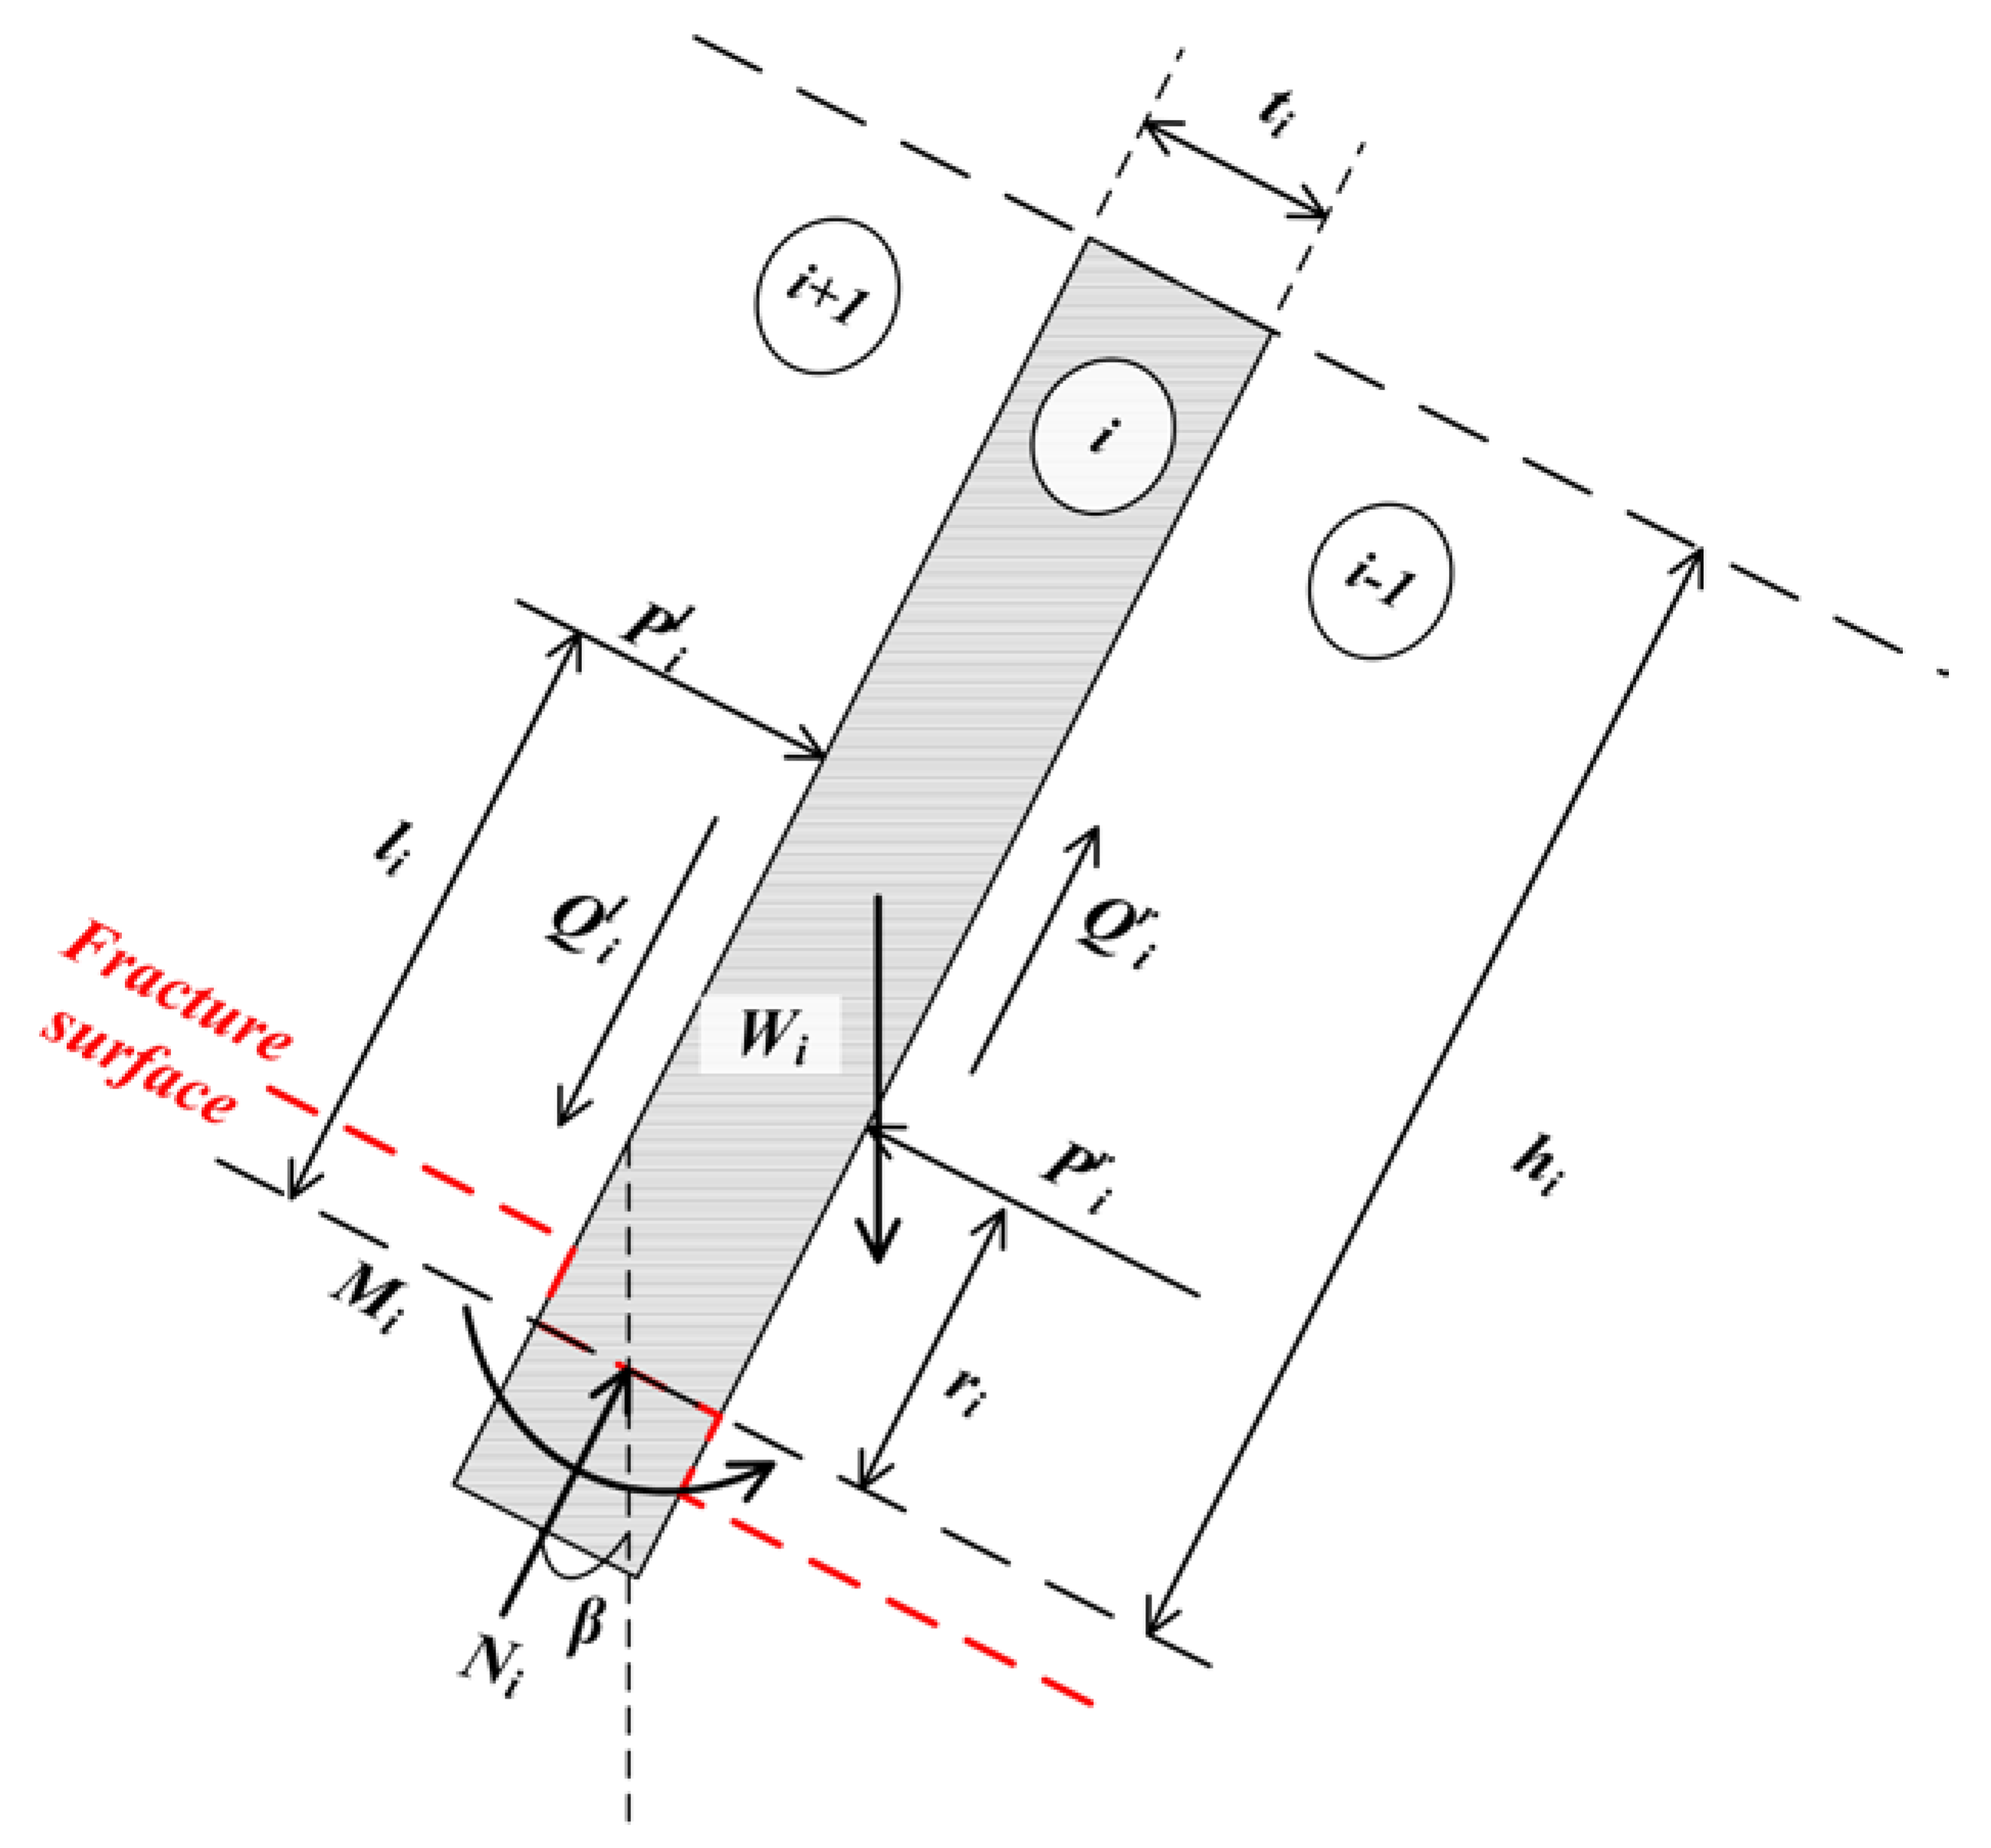
2.2. Mechanical Analysis

Neglecting the influences of physical factors, such as groundwater and temperature, the overturning of the rock slope can be modeled as a series of elongated rock columns arranged discretely [2]. According to experimentally derived equilibrium theory [24,25,26,27], when a rock formation experiences bending or tipping, equilibrium is achieved at the interface between adjacent rock layers. From this, the normal force N i and moment M i between adjacent rock columns on the base, as well as the shear force Q i in the direction perpendicular to the base, can be derived [28]. The force distribution of this can be found in Figure 7.
N i = W i cos β + Q i l Q i r W i cos β  
M i = l i P i l r i P i r t i 2 Q i l + Q i r + h i 2 W i sin β  
Q i = P i tan φ d  
where φ d denotes the friction angle of the rock mass.
To assess the stability of a rock formation subject to bending or tipping damage, the safety factor F s can be introduced. Utilizing the bending theory of cantilever beams, the maximum tensile stress σ i m a x at the bottom of the rock formation can be determined.
σ i m a x = M i I i t i 2 N i t i = σ t F s   I i = t i 3 12
where I i denotes the inertia modulus of the i t h layer and σ t is the ultimate tensile stress of the rock material.
By combining Equations (4)–(7), we can determine the normal force P i , w r acting on the right side of the rock formation when it undergoes bending and overturning.
P i , w r = P i l l i t i 2 tan φ d + W i h i 2 sin β t i 6 cos β σ t t i 2 6 F s r i + t i 2 tan φ d
The shear force S i acting parallel to the base on the rock formation can be calculated through force analysis when it is subjected to shear damage.
S i = W i sin β + P i l P i r
The principal stress σ i , n and tangential stress τ i in the cross section can be calculated using the shear force S_i parallel to the base on the rock formation, as well as other relevant parameters.
σ i , n = W i cos β t i  
τ i = P i l P i r + W i sin β t i
The instability of the rock formation occurs when the value of τ i reaches the shear strength of the intact rock. By introducing the safety factor F s , the critical value of τ i can be obtained.
τ i = σ i , n tan φ d F s + c F s
where c denotes the cohesion of the rock mass.
The normal force acting on the right side of the rock formation can be determined through relevant calculations and equations.
P i , s r = P i l + W i sin β 1 tan φ d F s tan β   c t i F s  
Considering the thrust associated with the two damage modes, we use the expression P i r = max P i , w r , P i , s r , 0 and make the following definition:
P i r < 0   the   slope   is   stable , P i r = 0   the   slope   is   in   limiting   equilibrium , P i r > 0   the   slope   is   unstable .
The force acting on the next layer is P i 1 l = P i r .

2.3. Introduction of Non-Uniformity

When considering the effects of weathering and erosion in a natural environment, the surface rock mass is vulnerable to damage and cracking, resulting in a lower bulk density compared to the deeply buried rock mass. Additionally, natural rock masses are typically characterized by the presence of pores, and the inhomogeneity of bulk density can be described through analogy with random field theory [10,27,29,30,31,32,33], where the spatial coordinate h represents the depth of the rock mass and the regionalization variable φ is defined as a function of φ h . Due to the impossibility of sampling and measuring everywhere in space, finite samples are used to generate regionalized variables. To characterize the inhomogeneity of bulk density at different depths of the rock formation, a model based on the exponential autocorrelation function in random fields [29,30] can be fitted to the data. A schematic of the heterogeneous rocks can be seen in Figure 8.
W i = A i h i φ h i d h i  
where φ h i = C 0 / C 1 l n h i + C 2 , C 0 , C 1 , C 2 can be fitted by experimental data, and A i is the cross-sectional area of the rock column.
In a two-dimensional plane, the rock body is treated as a unit area, and its gravity can be calculated using relevant equations and parameters:
W i = t i h i φ h i d h i
where t i is the width of the rock column.
The expression for the damage thrust of an inhomogeneous rock formation can be determined through relevant calculations and equations.
P i r = P i l l i t i 2 tan φ d + h i 2 sin β t i 6 cos β t i h i φ h i d h i σ t t i 2 6 F s r i + t i 2 tan φ d   P i l + sin β 1 tan φ d F s tan β t i h i φ h i d h i c t i F s

3. Results and Discussion

3.1. Verification of the Validity of the AGA Algorithm

In order to verify the accuracy of the algorithm, this paper conducted a verification using the rock slope data from the literature [28], as illustrated in Figure 9 and Table 1. To simplify the calculation process and focus solely on the correctness and robustness of the algorithm, this paper neglected physical factors such as temperature, groundwater effects, etc.
The Mahalanobis distance, which was proposed by the Indian statistician P. C. Mahalanobis [34], represents the covariance distance of the data and is an effective method for calculating the similarity of two unknown sample sets. In our study, we utilized this method to evaluate the accuracy of the AGA algorithm in predicting the fracture surface of a slope model. Specifically, we recorded the location coordinates of the experimental fracture surface and the fracture surface generated by the AGA algorithm and UDEC software using a right-angle coordinate system with the leftmost point at the bottom of the slope model as the origin. We then calculated the Mahalanobis distance between the experimental sample set and the numerical simulation sample set and subsequently normalized the results to analyze the approximation between the numerical simulation and experiment. Based on our numerical experiments, our results demonstrate that the AGA algorithm is able to accurately predict the fracture surface of the slope model, thus highlighting its value and effectiveness for engineering applications. A detailed representation of the results can be found in Figure 10.
To evaluate the accuracy of the AGA algorithm in predicting the fracture surface of a slope model, we utilized a unified coordinate system to record the coordinate sets of fracture surface locations obtained by both the UDEC simulation and the AGA algorithm. We then compared these coordinate sets with the experimental data and calculated the results, as shown in the figure above. The maximal normalized Mahalanobis distance between the modified AGA algorithm and UDEC simulation results was 0.47, while the minimum was 0.01. For the same 30 fracture surface feature point coordinates, the mean value of Mahalanobis distance between the modified AGA and UDEC simulation results was 6.68 times smaller than that between the traditional GA and UDEC. Moreover, compared with the simulation results of UDEC, the overall Mahalanobis distance fluctuation of the modified AGA was smaller than that of the traditional GA. The figure clearly indicates that the fracture surface solved by the modified AGA is more similar to that of the numerical simulation software, and the fluctuation of the difference value in each characteristic point is smaller, which verifies the effectiveness of the modified AGA algorithm. Overall, these results demonstrate the value and effectiveness of our algorithm in predicting the fracture surface of slope models, thereby providing a useful tool for engineering applications.

3.2. Multi-Dimensional Comparison of AGA and UDEC

The dynamic loading is modeled as a sinusoidal velocity with a frequency of 10   Hz , an amplitude of 2   m / s , and a duration of 0.1   s . To evaluate the response of the slope model to this dynamic loading, the velocities at the bottom and top boundaries were measured. The results, shown in the Figure 11 below, indicate that no waveform distortion occurred during propagation, suggesting that the cell size used was sufficiently small to accurately simulate wave dynamics at that frequency. Overall, these findings provide critical insight into the response of the slope model under dynamic loading conditions and highlight the importance of establishing appropriate numerical parameters to accurately capture the relevant physical phenomena.
The data analysis revealed a logarithmic bulk density random distribution chart, suggesting the presence of inhomogeneous bulk density and its relationship with the location of fracture surface feature points on the anticline rocky slope. Additionally, a logarithmic-type failure surface prediction diagram was developed using the modified adaptive genetic algorithm with Universal Distinct Element Code (UDEC) simulation as a reliable tool to predict potential failure surfaces of the slope. Furthermore, a random-type volume density distribution chart was analyzed, indicating the uneven distribution of volume density, which raises implications for slope stability and emphasizes the importance of accurate volume density measurement and analysis. Another random-type failure surface prediction diagram was developed using the modified adaptive genetic algorithm and UDEC simulation, providing a novel tool to predict and analyze potential failure surfaces of the slope. Moreover, in a comparison between the fracture surface calculations performed using the modified AGA and UDEC software under vibrational conditions for rock mass with nonuniform bulk density caused by pore presence, it was observed that the inhomogeneity of bulk density affects the shape of the fracture surface, highlighting the importance of considering this factor in numerical simulations. Overall, the results underscore the effectiveness of the modified AGA algorithm in predicting fracture surfaces of rock formations under complex loading conditions and offer important insights into the internal mechanisms governing fracture propagation in porous rock masses.
Under vibration conditions, the fracture surface calculation results in the modified AGA and UDEC shown in Figure 12. The effects of the nonhomogeneous type of bulk density on the prediction of failure surface of rocky slopes are compared. For the case of exponential inhomogeneous distribution of volume density, the displacement calculated by UDEC presents obvious layering, and its fracture surface is approximately linear. In contrast, the fracture surface calculated by AGA closely fits the rock mass region with nearly constant density, exhibiting strong nonlinearity. Moreover, the development trend of the failure surface from the middle to the top of the slope is almost identical for both methods; however, the starting fracture position at the bottom of the slope is different. This is primarily due to the AGA algorithm being optimized by assigning equal weight to every individual in each iteration, resulting in conservative calculations of the fracture location for each rock column, thereby ensuring its stability even during individual stress analysis. As a result, the depth of the rock mass fracture position causing the slope stability tends to be deeper overall, closer to the rock mass region with nearly constant density.
Under the condition of random volume density distribution, irregular fracture surface shapes appear in the calculation results of UDEC. These mutations occur mainly in the areas where the volume density transitions are most uneven. Compared with the results of UDEC, the fracture surface calculated by AGA in this situation gradually extends in a roughly linear trend, showing low similarity to the failure surface calculated by UDEC. The reason for this phenomenon is that the AGA algorithm uses the mean value theorem to replace this kind of local nonlinear mutation in the integral, while UDEC uses the method of discrete elements to solve the interaction between each element.
Based on the results obtained from the two scenarios, it can be inferred that the inhomogeneity of volume density resulting from the existence of pores in rock masses will affect the shape of the fracture surface. Meanwhile, the AGA algorithm exhibits stable results when calculating the fracture surface of the overturned rock slope and can provide a predictive result for the fracture surface incorporating the inhomogeneous distribution of volume density.

4. Conclusions

  • The modified AGA-based scheme proposed in this study contributes to sustainability in geological engineering by providing a more reliable and accurate method of predicting fracture surface feature points of rocky slopes, which can lead to more effective and sustainable slope management and maintenance practices.
  • Through a simple case study, the modified AGA approach with UDEC simulation was found to be 6.68 times more reliable than traditional GA methods, demonstrating the reliability of the calculation results and the feasibility of the modified AGA-based scheme, which can contribute to sustainable geological engineering practices.
  • Through our study, we found that natural environmental factors such as weathering play a critical role in shaping the behavior of rocky slopes. Our findings provide valuable insights for understanding the behavior of rocky slopes that are significant in promoting sustainable land use practices and ensuring the safety of both human lives and infrastructure projects.
  • We propose that the higher accuracy and reliability of the modified AGA approach can be widely applied to more complex rock structures, further advancing sustainable engineering practices. Future studies could explore the applicability of this approach to other types of rock structures and investigate its potential use in practical engineering scenarios, contributing further to sustainability in geological engineering.
  • In conclusion, the study’s findings and approach contribute significantly to promoting sustainability in geological engineering by enhancing our understanding of the behavior of rocky slopes and providing a reliable and accurate method of predicting fracture surface feature points. The application of this approach will play an essential role in designing sustainable and stable infrastructure projects, protecting human lives and properties, and preserving the environment for future generations.

Author Contributions

Conceptualization, Y.X. and D.L.; methodology, Y.X.; software, D.L.; validation, C.H., B.D. and Y.W.; formal analysis, C.H.; investigation, B.D.; resources, Y.W.; data curation, D.L.; writing—original draft preparation, Y.X.; writing—review and editing, Y.X.; visualization, D.L.; supervision, Y.W.; project administration, Y.W.; funding acquisition, Y.W. All authors have read and agreed to the published version of the manuscript.

Funding

The authors would like to acknowledge the following sources of support: the National Natural Science Foundation of China (51778633, 51308552), the China Railway Construction Corporation’s 2022 Annual Scientific and Technological Research and Development Plan and Funding Subjects (2022-C1), the Science and Technology Research and Development Plan of China Railway Corporation in 2020 (41, 243), and the 2022 degrees Guangzhou Metro Design and Research Institute Co. (KY-2022-014). This research received funding from these sources. The APC was funded by the authors.

Institutional Review Board Statement

Not applicable.

Informed Consent Statement

Not applicable.

Data Availability Statement

Data are available upon request but are limited according to relevant privacy and ethical restrictions. The datasets generated and/or analyzed during the current study are not publicly available due to the confidentiality requirements of the project; however, they are available from the corresponding author upon reasonable request.

Conflicts of Interest

The authors declare no conflict of interest.

Nomenclature

Table of Letter Symbols used in the paper
P F i r The custom right resultant force on rock failure (kN) Q i l , Q i r Shear force perpendicular to the fracture surface on both sides of the rock column (kN)
A Initial solution vector of genetic algorithm S i Shear force in the direction parallel to the rupture surface (kN)
A i Vertical profile area of the rock column ( m 2 ) t i The thickness of the rock pillars (m)
C 0 , C 1 , C 2 Parameters for the variation in bulk density of rocks with depth V i , V j Individuals without prior genetic manipulation
d i Unit direction vector V i , V j An individual after genetic manipulation
d i r Vector azimuth from the current solution to the optimal solution ° W i The gravity of the rock column (kN)
f a v g The average population adaptability x i , n The inherited genes carried by an individual
f m a x The maximum population adaptability Greek letters
h i Height of rock column above the fracture surface (m) α c , α m A random number between 0 and 1
i Rock pillars numbered β The angle of slope of rock column °
I i Denotes the inertia modulus of the i t h layer ( mm 4 ) c The cohesion of the rock mass (kPa)
l i , r i Distance from the fracture face of the point of combined action of the left and right sides of the rock pillars (m) σ i m a x The maximum tensile stress of rock (MPa)
M i A random number used to control the variation in the solution vector σ t The tensile strength of the intact rock (MPa)
M i The torque provided by the support σ i , n The normal acting on the base of the layer (MPa)
N i The support provides a vertical bearing reaction τ i The shear stresses acting on the base of the layer (MPa)
P c Crossover probability φ d Friction Angle of rock °
P c m i n The minimum crossover probability Coordinate systems
P c m a x The maximum crossover probability A X 1 A , Y 1 A The two-dimensional coordinate representation of the current optimal solution
P m Variation probabilityXOYThe global coordinate system in the outer ring center
P m m i n The minimum variation probability Abbreviations
P m m a x The maximum variation probabilityGAGenetic algorithm
P i l , P i r Combined forces on the left and right sides of the rock column (kN)AGAAdaptive genetic algorithm
P i , w r The combined force acting on the right side of a rock formation when it bends and overturns (kN)UDECUniversal Distinct Element Code
P i , s r The resultant force acting on the right side of the rock layer when a shear failure occurs (kN)
Bolded letter symbols within the table signify vector quantities

References

  1. Adhikary, D.P.; Dyskin, A.V.; Jewell, R.J.; Stewart, D.P. A study of the mechanism of flexural toppling failure of rock slopes. Rock Mech. Rock Eng. 1997, 30, 75–93. [Google Scholar] [CrossRef]
  2. Hoek, E.; Bray, J.D. Rock Slope Engineering, 3rd ed.; CRC Press: Boca Raton, FL, USA, 1981; ISBN 978-1-4822-6709-9. [Google Scholar]
  3. Hocking, G. A method for distinguishing between single and double plane sliding of tetrahedral wedges. Int. J. Rock Mech. Min. Sci. Géoméch. Abstr. 1976, 13, 225–226. [Google Scholar] [CrossRef]
  4. Huang, Y.H. Stability Analysis of Earth Slopes; Springer Science & Business Media: Berlin/Heidelberg, Germany, 2012; ISBN 978-1-4684-6602-7. [Google Scholar]
  5. Liu, Y.-C.; Chen, C.-S. A new approach for application of rock mass classification on rock slope stability assessment. Eng. Geol. 2007, 89, 129–143. [Google Scholar] [CrossRef]
  6. Ahmadi, M.; Eslami, M. A new approach to plane failure of rock slope stability based on water flow velocity in discontinuities for the Latian dam reservoir landslide. J. Mt. Sci. 2011, 8, 124–130. [Google Scholar] [CrossRef]
  7. Hamza, T.; Raghuvanshi, T.K. GIS based landslide hazard evaluation and zonation—A case from Jeldu District, Central Ethiopia. J. King Saud Univ. -Sci. 2017, 29, 151–165. [Google Scholar] [CrossRef]
  8. Janicak, P.G.; Marder, S.R.; Pavuluri, M.N. Principles and Practice of Psychopharmacotherapy; Lippincott Williams & Wilkins: Philadelphia, PA, USA, 2010; ISBN 978-1-60547-565-3. [Google Scholar]
  9. Tang, H.; Yong, R.; Eldin, M.A.M.E. Stability analysis of stratified rock slopes with spatially variable strength parameters: The case of Qianjiangping landslide. Bull. Eng. Geol. Environ. 2017, 76, 839–853. [Google Scholar] [CrossRef]
  10. Yang, X.-L.; Zou, J.-F. Stability factors for rock slopes subjected to pore water pressure based on the Hoek-Brown failure criterion. Int. J. Rock Mech. Min. Sci. 2006, 43, 1146–1152. [Google Scholar] [CrossRef]
  11. Chowdhury, R.; Flentje, P.; Bhattacharya, G. Geotechnical Slope Analysis; CRC Press: Boca Raton, FL, USA, 2009; ISBN 978-1-135-19210-5. [Google Scholar]
  12. Liu, M.; Zou, X.; Chen, Y.; Wu, Z. Performance Assessment of DMOEA-DD with CEC 2009 MOEA Competition Test Instances. In Proceedings of the 2009 IEEE Congress on Evolutionary Computation, Trondheim, Norway, 18–21 May 2009; pp. 2913–2918. [Google Scholar]
  13. Zhang, H.; Tian, Z. Failure analysis of corroded high-strength pipeline subject to hydrogen damage based on FEM and GA-BP neural network. Int. J. Hydrogen Energy 2021, 47, 4741–4758. [Google Scholar] [CrossRef]
  14. Shahrokhabadi, S.; Khoshfahm, V.; Rafsanjani, H.N. Hybrid of Natural Element Method (NEM) with Genetic Algorithm (GA) to find critical slip surface. Alex. Eng. J. 2014, 53, 373–383. [Google Scholar] [CrossRef]
  15. Bansal, M.; Goyal, A.; Choudhary, A. A comparative analysis of K-Nearest Neighbor, Genetic, Support Vector Machine, Decision Tree, and Long Short Term Memory algorithms in machine learning. Decis. Anal. J. 2022, 3, 100071. [Google Scholar] [CrossRef]
  16. Nikbakt, S.; Kamarian, S.; Shakeri, M. A review on optimization of composite structures Part I: Laminated composites. Compos. Struct. 2018, 195, 158–185. [Google Scholar] [CrossRef]
  17. Pandey, H.M.; Dixit, A.; Mehrotra, D. Genetic Algorithms: Concepts, Issues and a Case Study of Grammar Induction. In Proceedings of the CUBE International Information Technology Conference; Association for Computing Machinery, New York, NY, USA, 3 September 2012; pp. 263–271. [Google Scholar]
  18. Pandey, H.M.; Chaudhary, A.; Mehrotra, D. A comparative review of approaches to prevent premature convergence in GA. Appl. Soft Comput. 2014, 24, 1047–1077. [Google Scholar] [CrossRef]
  19. Holland, J.H. Adaptation in Natural and Artificial Systems: An Introductory Analysis with Applications to Biology, Control, and Artificial Intelligence; MIT Press: Cambridge, MA, USA, 1992; ISBN 978-0-262-58111-0. [Google Scholar]
  20. Forrest, S. Proceedings of the Fifth International Conference on Genetic Algorithms, Urbana-Champaign, IL, USA, 17–21 July 1993; Morgan Kaufmann Publishers: Burlington, MA, USA, 1993. [Google Scholar]
  21. Horn, J.; Markov, F. Chain Analysis of Genetic Algorithms with Niching. In Proceedings of the 5th International Conference on Genetic Algorithms, San Francisco, CA, USA, 1 June 1993; Morgan Kaufmann Publishers Inc.: San Francisco, CA, USA, 1993; pp. 110–117. [Google Scholar]
  22. Coelho, L.D.S. A quantum particle swarm optimizer with chaotic mutation operator. Chaos Solitons Fractals 2008, 37, 1409–1418. [Google Scholar] [CrossRef]
  23. Zhang, H.; Liu, F.; Zhou, Y.; Zhang, Z. A hybrid method integrating an elite genetic algorithm with tabu search for the quadratic assignment problem. Inf. Sci. 2020, 539, 347–374. [Google Scholar] [CrossRef]
  24. Alzo’ubi, A.; Martin, C.D.; Cruden, D. Influence of tensile strength on toppling failure in centrifuge tests. Int. J. Rock Mech. Min. Sci. 2010, 47, 974–982. [Google Scholar] [CrossRef]
  25. Kawamoto, T. The stability of slopes and underground openings against flexural toppling and their stabilisation. Rock Mech. Rock Eng. 1992, 25, 143–165. [Google Scholar] [CrossRef]
  26. Wyllie, D.C. Foundations on Rock: Engineering Practice, 2nd ed.; CRC Press: London, UK, 2014; ISBN 978-0-429-17841-2. [Google Scholar]
  27. Zheng, Y.; Chen, C.; Liu, T.; Zhang, H.; Xia, K.; Liu, F. Study on the mechanisms of flexural toppling failure in anti-inclined rock slopes using numerical and limit equilibrium models. Eng. Geol. 2018, 237, 116–128. [Google Scholar] [CrossRef]
  28. Zheng, Y.; Chen, C.; Meng, F.; Liu, T.; Xia, K. Assessing the stability of rock slopes with respect to flexural toppling failure using a limit equilibrium model and genetic algorithm. Comput. Geotech. 2020, 124, 103619. [Google Scholar] [CrossRef]
  29. Alamanis, N.; Dakoulas, P. Effects of spatial variability of soil properties and ground motion characteristics on permanent displacements of slopes. Soil Dyn. Earthq. Eng. 2022, 161, 107386. [Google Scholar] [CrossRef]
  30. Chen, L.; Zhang, W.; Chen, F.; Gu, D.; Wang, L.; Wang, Z. Probabilistic assessment of slope failure considering anisotropic spatial variability of soil properties. Geosci. Front. 2022, 13, 101371. [Google Scholar] [CrossRef]
  31. Dou, X.; Wang, R.; Li, C.; Zheng, C.; Zhou, X. Spatial distribution of soil water, plant roots, and water use pattern under different drip fertigation regimes in an apple-soybean intercropping system on the Loess Plateau, China. Agric. Water Manag. 2022, 269, 107718. [Google Scholar] [CrossRef]
  32. Jiang, S.-H.; Huang, J.; Huang, F.; Yang, J.; Yao, C.; Zhou, C.-B. Modelling of spatial variability of soil undrained shear strength by conditional random fields for slope reliability analysis. Appl. Math. Model. 2018, 63, 374–389. [Google Scholar] [CrossRef]
  33. Matérn, B. Spatial Variation; Springer Science & Business Media: Berlin/Heidelberg, Germany, 2013. [Google Scholar]
  34. De Maesschalck, R.; Jouan-Rimbaud, D.; Massart, D.L. The Mahalanobis distance. Chemom. Intell. Lab. Syst. 2000, 50, 1–18. [Google Scholar] [CrossRef]
Figure 1. Standard genetic algorithm flow chart [17].
Sustainability 15 07455 g001
Figure 2. Structural block diagram of the proposed research.
Sustainability 15 07455 g002
Figure 3. Schematic diagram of the initial population generation of the modified AGA algorithm.
Sustainability 15 07455 g003
Figure 4. Variation and crossover probability of the AGA algorithm.
Sustainability 15 07455 g004
Figure 5. Schematic diagram of the optimal population generation model of the modified AGA.
Sustainability 15 07455 g005
Figure 6. Schematic diagram of the adaptive genetic algorithm process.
Sustainability 15 07455 g006
Figure 7. Schematic diagram of the force analysis of the rock column in layer i.
Sustainability 15 07455 g007
Figure 8. Consider a rocking body with an inhomogeneous bulk density.
Sustainability 15 07455 g008
Figure 9. The comparison between the fracture surface results obtained from the Universal Distinct Element Code (UDEC) with the modified adaptive genetic algorithm (AGA) (left) and the genetic algorithm (GA) proposed by Zheng et al. [28] (right) highlights the superior performance and reliability of the modified AGA approach in analyzing fracture surface feature points of an anticline rocky slope.
Sustainability 15 07455 g009
Figure 10. The Mahalanobis distance judgment of AGA, UDEC, and GA calculation results.
Sustainability 15 07455 g010
Figure 11. Velocity waveforms at the bottom and top boundaries of the slope.
Sustainability 15 07455 g011
Figure 12. The effect of nonhomogeneous bulk density on the prediction of failure surfaces of rocky slopes.
Sustainability 15 07455 g012
Table 1. Model parameters used in the verification cases.
ParametersValues
Height   of   the   slope ,   H mm 300
Angle   of   the   slope ,   β ° 61
Angle between the normal to the joints and the horizontal direction10
Spacing   of   the   joints ,   t i mm 10
Cohesion   of   the   intact   rock ,   c MPa 1.4
Friction   angle   of   the   intact   rock ,   φ ° 37
Tensile   strength   of   the   intact   rock ,   σ t MPa 1.4
Unit   weight   of   the   intact   rock ,   γ kN / m 3 2380
Cohesion   of   the   joints ,   c d MPa 0
Friction   angle   of   the   joints ,   φ d ° 26
Disclaimer/Publisher’s Note: The statements, opinions and data contained in all publications are solely those of the individual author(s) and contributor(s) and not of MDPI and/or the editor(s). MDPI and/or the editor(s) disclaim responsibility for any injury to people or property resulting from any ideas, methods, instructions or products referred to in the content.

