Article

Can the Digital Economy Improve the Level of High-Quality Financial Development? Evidence from China

1
School of Law and Business, Wuhan Institute of Technology, Wuhan 430205, China
2
School of Management, Wuhan Textile University, Wuhan 430200, China
*
Authors to whom correspondence should be addressed.
Sustainability 2023, 15(9), 7451; https://doi.org/10.3390/su15097451
Submission received: 11 March 2023 / Revised: 22 April 2023 / Accepted: 28 April 2023 / Published: 30 April 2023

Abstract

:
Background: High-quality development has permeated all aspects of China’s economic and social development. Nevertheless, few scholars have studied high-quality financial development. Purpose: Explore the spatial spillover impact of the digital economy on high-quality financial development by adding a spatial dimension to existing studies. Methods: We construct a high-quality financial development indicator system and explore the digital economy’s impact on high-quality financial development through the spatial Durbin model. Results: The digital economy helps promote high-quality financial development with spatial spillover and feedback effects. Control variables, such as the number of employees and the degree of openness, contribute to high-quality financial development. Conclusions: The digital economy contributes significantly to high-quality financial development.

1. Introduction

High-quality development starts with high-quality economic development and gradually crosses the field of economics and penetrates all fields of social life, which embody the new development concepts of innovation, coordination, environmental responsibility, openness, and sharing [1]. Over the past few years, China’s economy has moved from a phase of rapid growth to a phase of high-quality development. In the rapid growth stage, emphasis is usually placed on speed, scale, and quantity, focusing on economic growth and increased output. In contrast, in the high-quality development stage, emphasis is placed on quality, efficiency, and sustainability, a new phase of improving quality, efficiency, and achieving sustainable development based on rapid economic growth [2].
Finance is the bloodline of the real economy. The changing state of economic development has made financial development more demanding, and it is urgent to achieve high-quality financial development. High-quality financial development covers the essence and functions of the finance industry, the establishment of a modern financial framework, the organization of the financial industry, the policies of the financial industry, global financial governance, and other essential concepts [3]. Previously, scholars have conducted many studies on high-quality economic development [4,5,6,7]. Some academics straddle the economic field, such as by studying high-quality development of agriculture, the manufacturing industry, and foreign trade [8,9,10,11]. Nevertheless, there need to be more studies on high-quality financial development.
Currently, the market structure, business philosophy, innovation, and service level of China’s financial industry cannot adapt to the requirements of high-quality development. However, it is worth noting that the emergence of the digital economy (a new form of economy in which data resources are the most critical element, current information and communication are the mainstays, and digital technology is the primary driver [12]) makes up for the shortcomings currently existing in high-quality financial development.
The digital economy makes up for the lack of high-quality financial development mainly through the following facets:
  • In optimizing the financial industry’s market structure, the integration of the digital economy and the financial system has created a new financial industry—digital finance. Digital finance has forced banks to undergo digital transformation. Banks will form an inclusive financial industry while providing a more transparent information disclosure mechanism for the capital market and optimizing financial market structure [13].
  • In terms of improving the financial industry’s business philosophy, the high penetration rate of the digital economy blurs the boundaries between financial institutions, effectively solves the problems of information asymmetry and high transaction costs faced by banks and enterprises, and improves resource utilization efficiency [14]. Ultimately, it promotes the financial industry to shift to a greener, shared, and intelligent development approach [15,16].
  • In improving the financial industry’s innovation capacity, digital resource investment will promote innovation in the financial industry by influencing information sharing and value creation [17,18]. Meanwhile, in an era where data and information are becoming companies’ central capital, companies will proactively use the digital economy for technological innovation, improving the financial industry’s ability to innovate [19].
  • In order to improve the financial industry’s service level in the digital age, companies will need to enhance their products and services and improve customer satisfaction in response to the changing digital competitive environment, thus improving the financial industry’s service levels [20].
Having analyzed the above arguments, we propose Hypothesis 1 as follows.
Hypotheses 1.
The digital economy helps promote high-quality financial development.
Existing studies generally agree on the spatial spillover nature of the digital economy. The digital economy contributes a positive spatial spillover effect on high-quality economic development [21,22,23], a negative spatial spillover effect on carbon dioxide emissions [24,25,26,27], and a positive spatial spillover effect on the upgrading of industrial structures [28,29]. The spatial spillover effect from high-quality financial development also exists. Gao et al. [30] find distinct regional differences between East and West in high-quality financial development in China, and there is spatial clustering and spillover effects. Therefore, it is necessary to include spatial distribution in our investigation and conduct empirical studies taking spatial spillover into account. We therefore propose the following position:
Hypothesis 2.
The digital economy produces spatial spillover effects that will lead to high-quality financial development.
We examine the spatial spillover effects of high-quality financial development from the digital economy by constructing a high-quality financial development indicator system. Our findings show that the digital economy helps promote high-quality financial development with spatial spillover and feedback effects. Further research shows regional heterogeneity in the digital economy’s contribution to high-quality financial development. The findings of this paper provide new ideas for achieving high-quality financial development and help to better address the shortcomings of high-quality financial development.
There are three main ways in which our study differs from previous studies: first, in the contents of the study, the spatial pattern of high-quality financial development is analyzed, and spatial econometrics are introduced to explore whether there are spatial spillover effects from the digital economy on high-quality financial development. Second, regarding research indexes, a high-quality financial development index system is constructed to more comprehensively and accurately assess the digital economy’s impact on high-quality financial development. Third, from a research perspective, we introduce each provincial-level region’s pilot free trade zone as a control variable for high-quality financial development enhances research on factors that affect high-quality financial development.

2. Methods and Data

2.1. Model Construction

Our preliminary judgment for model selection is the spatial Durbin model (SDM). The spatial Durbin model can examine the endogenous interaction effects between a provincial-level region and the exogenous interaction effects of other provincial-level regions on the first provincial-level region, which is broader than other models [31]. The model is represented as follows (1).
H Q F i t = α + ρ W i t H Q F i t + β i D E i t + γ i W i t D E i t + λ t + ε i
where H Q F i t is high-quality financial development, D E i t is the digital economy, ε i is the residual term, λ t is the time fixed effect, α is a constant variable expression, W i t is the geographic distance matrix, and d i t is the linear distance calculated in latitude and longitude between the provincial-level regions, as expressed in (2). W i t H Q F i t is a spatial lag term for high-quality financial development, and W i t D E i t is the spatial lag term for the digital economy. Among them, i and t are city and year, respectively.
W i t = 1 d i t , i t 0 , i = t
Taking the partial derivatives of both sides of the spatial Durbin model and simplifying it yields the following Equation (2).
( I ρ W ) 1 = ( I ρ W ) 1 ( β k + γ k W )
The diagonal elements of ( I ρ W ) 1 ( β k + γ k W ) represent the direct effects of the model. The non-diagonal elements of ( I ρ W ) 1 ( β k + γ k W ) are the model’s spatial spillover effects.

2.2. Main Variables

2.2.1. Explained Variable

  • Construction of the indicator system
We selected high-quality financial development (HQF) as the explained variable. High-quality development is a comprehensive development that embodies the new development concepts of innovation, coordination, environmental responsibility, openness, and sharing. Liu constructs a high-quality financial development indicator system based on this new development concept [32]. However, he should have considered the current deficiencies in China’s high-quality financial development. Therefore, based on Liu, we also introduce four aspects of market structure, business philosophy, innovation, and service level to build the index system [3]. We refine and focus on the main elements of high-quality financial development, with market structure, business philosophy, innovation capability, service level, and risk prevention as the level 1 indicators. The level 1 indicators are subdivided into seven level 2 indicators and twelve level 3 indicators, and the specific breakdown of these indicators is shown in Table 1.
  • Measurements
We select n indicators with a total of m samples and use different normalization methods for positive and negative indicators.
The normalization formula for positive indicators (4) is
y i j = x i j x m i n x m a x x m i n
The normalization formula for negative indicators (5) is
y i j = x m a x x i j x m a x x m i n
where y i j is the value of indicator j of sample i after normalization, x i j is the value of indicator j of sample i, i = 1, 2,…, m; j = 1, 2,…, n.
First, we calculate the weight, p i j (6):
p i j = y i j i = 1 m y i j
Next, we calculate the entropy value e i for the jth indicator (7):
e i = k i = 1 m p i j ln p i j k = ( ln m ) 1
Again, we calculate the information utility value h j for the jth indicator (8):
h j = 1 e j
Finally, we calculate the weight, w j , of each indicator (9):
w j = h j j = 1 n h j
The overall score z i for each sample (10) is therefore calculated thus:
z i = j = 1 n w j x i j
The overall score represents the high-quality financial development level.

2.2.2. Core Explanatory Variable

We identify the core explanatory variable as the digital economy (DE). Researchers use factor analysis, additive convolution means, the AHP-entropy weight method, and other methods to measure the digital economy [33,34,35,36]. Li and Liu build an indicator system to measure the digital economy’s development level based on three parameters: infrastructure construction, digital applications, and digital industry development [37].
We use digital industrialization, industrial digitization, and digital governance as level 1 indicators to build a digital economy index system [12]. The level 1 indicators are subdivided into seven level 2 and seventeen level 3 indicators, broken down in Table 2.

2.2.3. Control Variables

This paper introduces the following control variables based on references to existing literature.
  • The number of employees (ne). The efficient and high-quality services of financial institution employees can improve the level of operation and management of financial institutions and further enhance the operational efficiency and value of the financial industry [38]. The mobility of financial institution employees also affects the level of regional financial aggregation and, thus, the level of high-quality financial development, so the number of financial institution employees is used as an indicator.
  • The industrial structure (is). Industrial structure is an essential factor affecting the level of financial development [39]. In this paper, the ratio of total regional output value of the financial sector to total regional output value of the tertiary sector is used to express this.
  • The level of government regulation (gr). Only in countries with high governmental capacity can a low level of resistance to financial development lead to an effective increase in credit market development [40]. This paper uses fiscal spending as a share of GDP in each provincial region to reflect the local level of government regulation.
  • The degree of openness (do). Establishing a pilot free trade zone can improve the efficiency of financial services to the real economy, which is essential for high-quality financial development [41]. This measurement is the presence or absence of a pilot free trade zone in each provincial-level region. That is, regions with a pilot free trade zone have a value of 1, and regions without a pilot free trade zone have a value of 0.
  • The level of economic development (ep). Financial development is facilitated by increased demand for credit resulting from economic development and increased investment opportunities [42]. We choose the GDP per capita of each provincial-level region to reflect the level of economic development of each provincial-level region.

2.3. Variable Measures and Data Description

We use panel data from 31 Chinese provincial-level regions (excluding Hong Kong, Macau, and Taiwan, for which data are unavailable) for spatial econometric analysis. The data on the social financing scale and the proportion of direct financing in the total social financing scale are taken from the People’s Bank of China’s official website. The pilot free trade zone data is taken from the Chinese government’s website. The data regarding investment in environmental pollution control in GDP is taken from the China Environmental Statistics Yearbook in previous years. The rest of the data is taken from CSMAR databases.
In this paper, descriptive statistics of relevant variables in the model are conducted using stata16 (see Table 3). The mean value of lnHQF is −1.803, showing that the level of high-quality financial development in China needs to be improved. lnDE has a mean value of −2.514, a maximum of −0.278, and a minimum of −4.506, indicating that the digital economy varies significantly across provinces.
When choosing variables, we try to select variables with a high degree of independence from each other to minimize the problem of multicollinearity. Furthermore, we use tolerance and Variance Inflation Factor (VIF) indicators to determine whether multicollinearity exists. A smaller tolerance indicates that the other independent variables more accurately predict the indicator and that the multicollinearity is likely more severe. A tolerance of less than 0.1 indicates the presence of significant multicollinearity. The greater the VIF, the more severe the multicollinearity, and when the VIF is greater than or equal to 5, it indicates the presence of severe multicollinearity [43]. We used spss17 for the multicollinearity test; the results show that the tolerances are more significant than 0.1, and VIFs are all less than 5, indicating that the multicollinearity problem can be ignored (see Table 4).

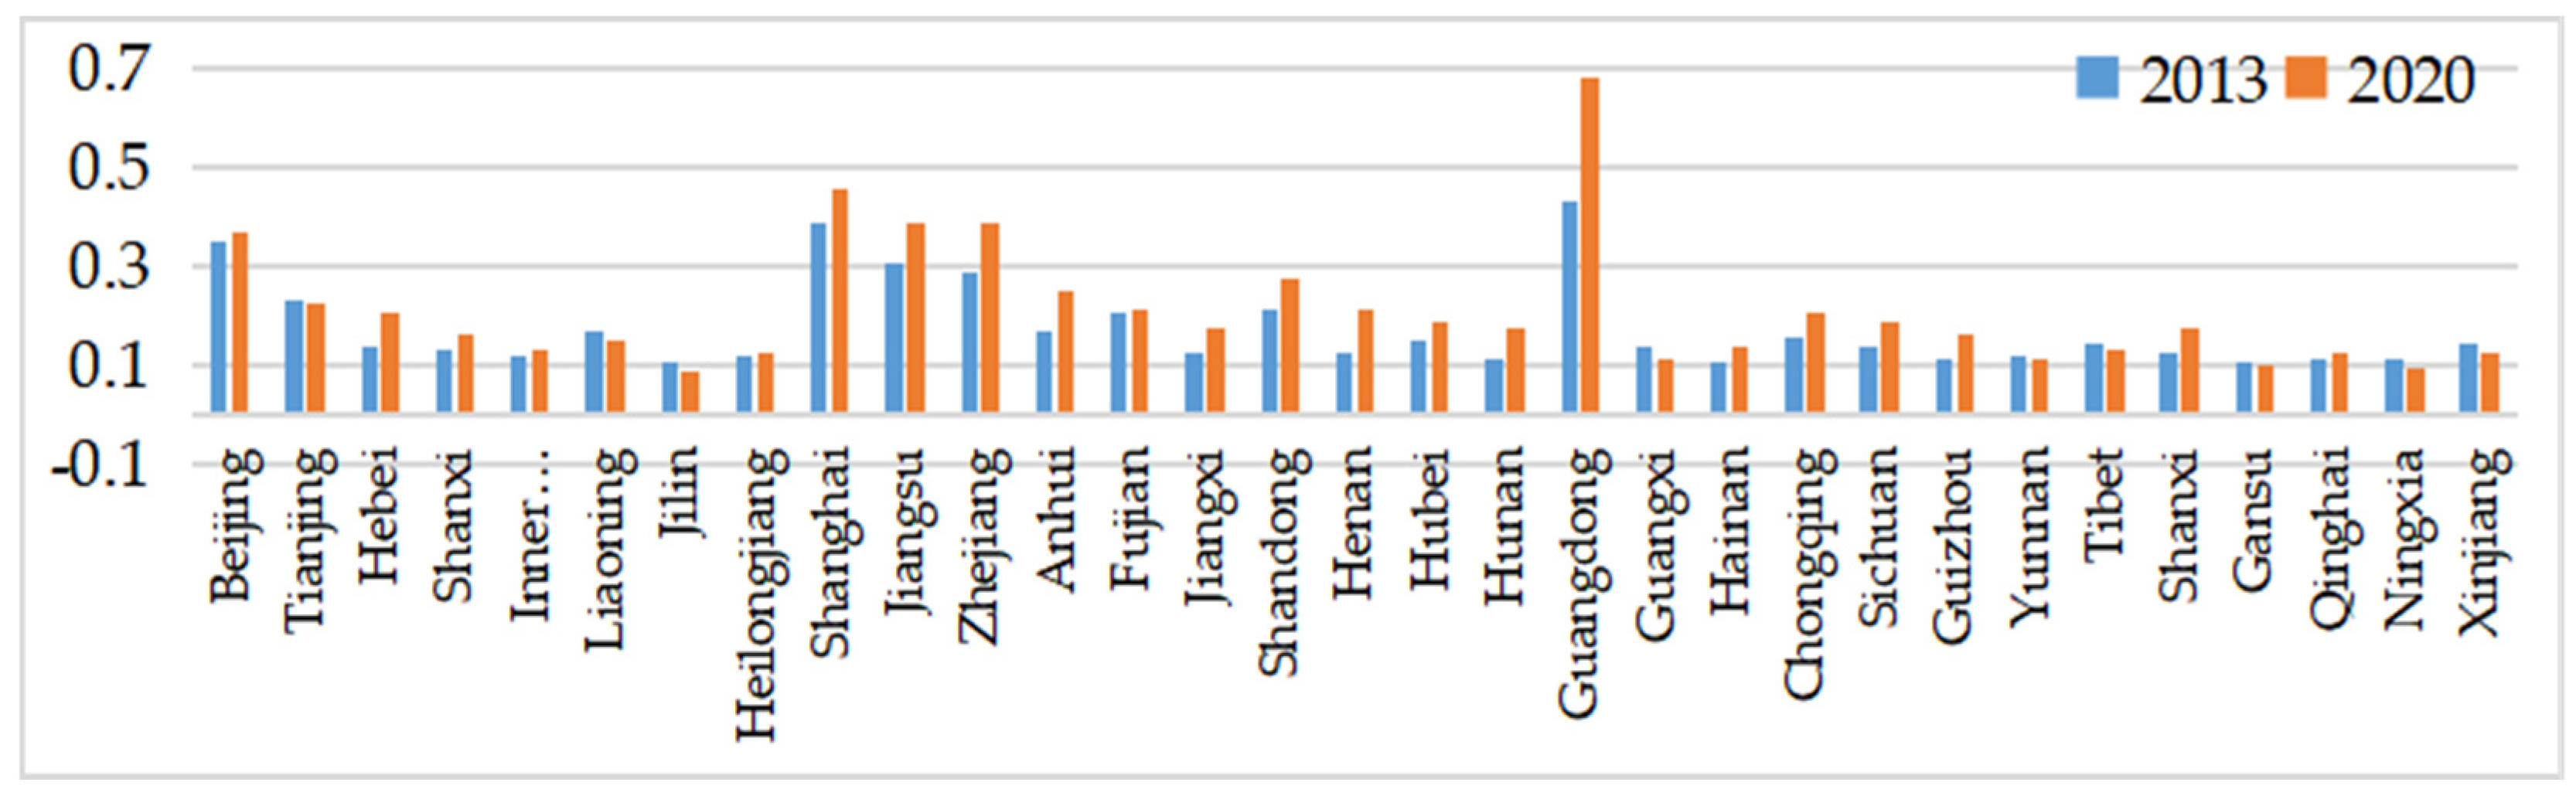
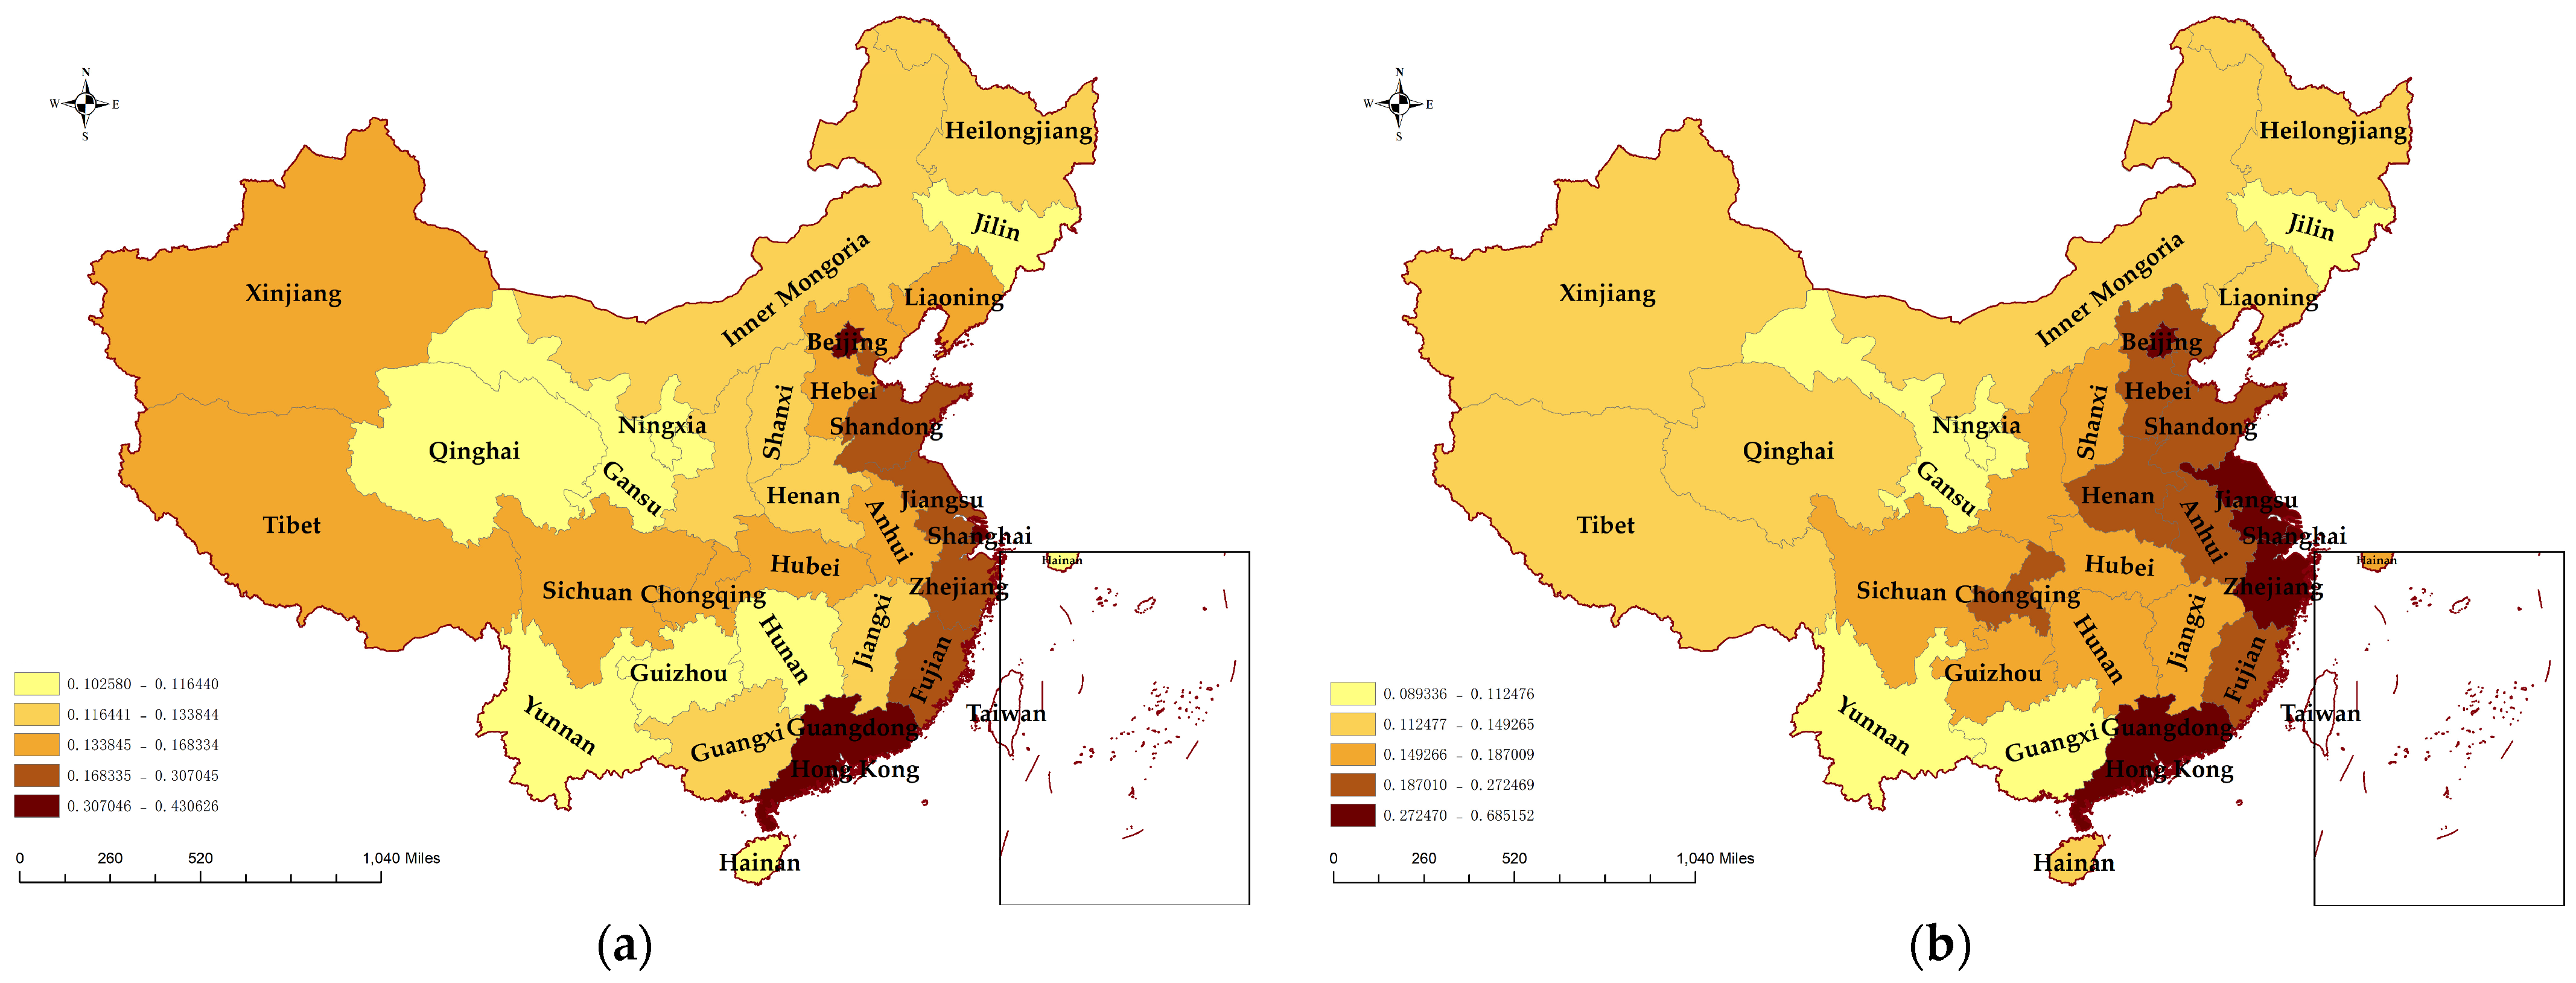
3. Analyzing the Spatial Pattern of High-Quality Financial Development

By measuring the high-quality financial development of each provincial-level region in previous years, we find that the regions with high-quality financial development are mainly concentrated in eastern coastal regions such as Beijing, Shanghai, Zhejiang, Jiangsu, and Guangzhou (Figure 1). Taking 2020 as an example, the top five provincial regions in terms of high-quality financial development in 2020 are Guangdong, Shanghai, Jiangsu, Zhejiang, and Beijing, in order. The top five provincial regions in terms of GDP in 2020 are Guangdong, Jiangsu, Shandong, Zhejiang, and Henan. High-quality financial development matches the regional economic development level, indicating that the high-quality financial development index system is reasonable.
From the viewpoint of time series change, the level of high-quality financial development of most provincial-level regions has increased to a large extent. From the perspective of regional distribution (Figure 2), the level of high-quality financial development is uneven among provincial-level regions. The eastern regions benefit from the advantages of geographical location and policy inclination, and high-quality financial development is significantly higher than in other provincial-level regions. The regional heterogeneous distribution of “strong in the east and weak in the west” is formed.

4. Empirical Results

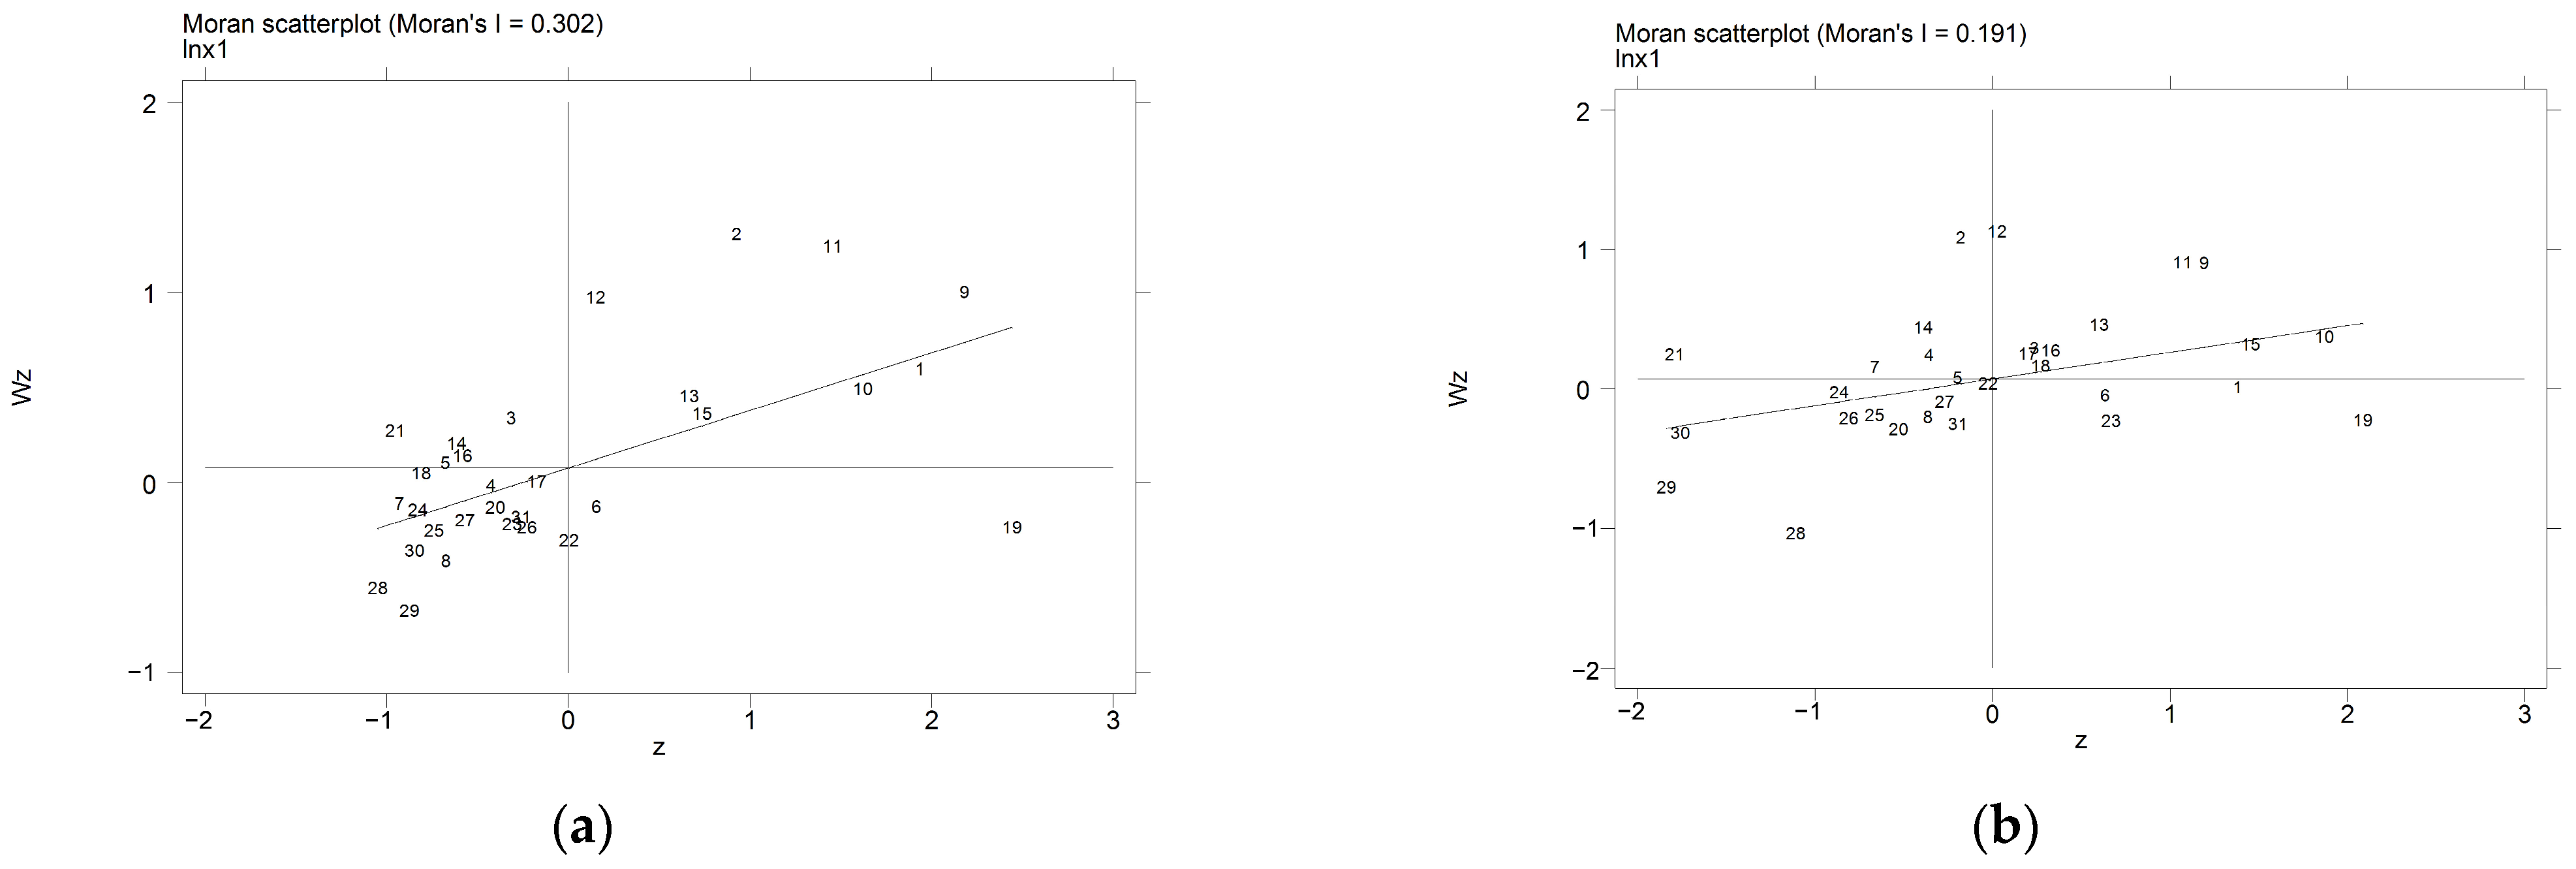
4.1. Exploratory Space Analysis

  • The global autocorrelation test
The global Moran’s I index of lnDE is more significant than zero, according to the results in Table 5. Except for the years 2015 and 2019, which pass the test at a 10% significance level, all the years pass the test at a 5% significance level. This indicates that the digital economy shows positive spatial autocorrelation throughout the time series. Moreover, this correlation increases over time. The global Moran’s I index of lnHQF is more significant than zero. They all pass the test at a 1% level of significance. This indicates that high-quality financial development has positive spatial autocorrelation.
  • The local autocorrelation test
Since the global Moran’s I index cannot describe local regions’ spatial aggregation, we use local Moran scatter plots to analyze the spatial variability between specific regions (Figure 3). Most provincial-level regions with high-quality financial development are located in quadrants one and three. The provincial-level regions in the same quadrant are also geographically adjacent, including Shanghai, Zhejiang, Jiangsu, Shandong, Beijing, and Tianjin. Moreover, the eastern region is a hot spot showing high value and high-value aggregation. In contrast, the western region is a cold spot showing low value and low-value aggregation. In Figure 3, more provincial-level regions of the digital economyare in quadrants 1 and 3 than in quadrants 2 and 4. Therefore, using a spatial econometric model for analysis in this paper is reasonable [44].

4.2. Model Selection

We refer to the methodology of Yin and Wang [45], which uses the LM and Robust LM tests to select the optimal analytical model. If LMlag and LMerror are significant, we reject the original hypothesis of using the traditional OLS model and use the spatial econometric model. Suppose Robust LMlag is significant and Robust LMerror is insignificant or less significant. In that case, we select the spatial lag model (SAR) with a lag term or the spatial Durbin model (SDM). If Robust LMerror is significant and Robust LMlag is insignificant or less significant, we use the spatial error model (SEM) with an error term or spatial Durbin model (SDM). Table 6 shows the LM test results, where both LMlag and LMerror are significant at a 1% confidence interval. It indicates that we reject the original hypothesis of using the traditional OLS model, and the spatial econometric model is selected. Robust LMlag is significant at a 1% confidence interval. However, robust LMerror is insignificant, indicating that the spatial lag model with the lag term (SAR) or spatial Durbin model (SDM) should be selected.
The LR test determines whether the SDM would degenerate into the SAR. Table 6 shows that LR’s tests are significant within a 1% confidence interval. We reject the original hypothesis that SDM will degenerate into SAR. Therefore, the model selection is SDM. Hausman test results are significant, indicating that we reject the original random effect hypothesis and use the fixed effect model.

4.3. Baseline Regression Results

Table 7 shows that the coefficient of lnDE under the main effects is positive. It passes the hypothesis test at the 1% significance level, indicating that the higher the level of digital economy development in the province, the higher the level of high-quality financial development. The coefficient of lnDE under the spatial effect (spatial lag term Wx) is positive. The initial hypothesis is rejected at the 5% significance level, indicating that the digital economy has a significant spatial effect. That is, developing the digital economy in this province also significantly contributes to high-quality financial development in neighboring provinces. Therefore, hypothesis 1 is verified to be valid.
The main effect coefficients of all control variables are positive and pass the significance test. They indicate that the number of employees, industrial structure, level of government regulation, degree of openness, and level of economic development have contributed to high-quality financial development in this province. The empirical test results are consistent with the theoretical analysis, indicating that the choice of control variables was reasonable.

4.4. Decomposition of Spillover Effects

Ignoring the interactive effects of spatial factors would underestimate the effect of the digital economy in promoting high-quality financial development. Le Sage [46] notes that measuring spatial spillovers using spatial coefficients is impossible. We refer to Le Sage to decompose the coefficients of the effects of the respective variables on high-quality financial development into the direct effect, the spatial spillover effect, and the total effect (Table 8). All effects of the digital economy pass the significance test, suggesting that the digital economy helps promote high-quality financial development with spatial spillover and feedback effects. A 1% increase in the digital economy in a provincial-level region can increase the level of high-quality financial development in this region by 0.239%, in neighboring regions by 0.449%, and in the whole country by 0.688%. We verify that hypothesis 2 holds.
Among the control variables, a 1% rise in the number of employees in a provincial region can increase high-quality financial development in that provincial region by 0.117%, reduce it in neighboring provincial regions by 0.413%, and reduce it nationally by 0.296%. A 1% growth in government regulation in a provincial region can improve high-quality financial development in that region by 0.154% and reduce in neighboring provincial regions by 0.704%. A 1% improvement in economic development in a provincial region can increase high-quality financial development by 0.446% and reduce it in neighboring provincial regions by 0.349%.

4.5. Heterogeneity Test

Due to differences in economic development, industrial layout, employees, and infrastructure, significant spatial disparities exist in the regional distribution of high-quality financial development and the digital economy in China’s provincial-level regions. Therefore, the effect may vary depending on the region and city level. Table 9 divides the 31 selected provincial regions into eastern regions (11 provincial regions) and central and western regions (20 provincial regions) and performs the same spatial econometric analysis as in the above steps.
The findings indicate that the digital economy’s impact on high-quality financial development is heterogeneous—the significant contribution of the digital economy to high-quality financial development is in the eastern regions. In contrast, the digital economy beyond the eastern regions does not affect high-quality financial development. The reason may be that the developed eastern regions have apparent advantages in terms of economic development level, openness to the outside world, innovation, and a higher understanding and acceptance of the digital economy. Thus, the effect is more significant.

5. Conclusions

At the provincial level, the digital economy and high-quality financial development have positive spatial autocorrelation. The digital economy and high-quality financial development show the spatial characteristics of “high” and “low” aggregation. The eastern region is a hot spot showing the high value and high-value aggregation of the digital economy and high-quality financial development. In contrast, the western region is a cold spot showing low value and low-value aggregation. The problem of “East is strong, and West is weak” still exists.
An essential factor in enhancing high-quality financial development is the digital economy. There is a spatial aggregation effect, a spatial spillover effect, and a feedback effect in the digital economy. The higher the degree of agglomeration of the digital economy, the more it promotes high-quality financial development in this provincial region. The improvement of the digital economy in one provincial region can, through feedback and spatial spillover effects, lead to varying degrees of improvement in the level of high-quality financial development in the provincial region and in neighboring provincial regions, thereby improving the level of high-quality financial development nationwide.
An excessive concentration of financial institution employees harms high-quality financial development in the surrounding provincial regions. The increase in the number of employees in a provincial region can increase the level of high-quality financial development in the provincial region but reduce high-quality financial development in neighboring regions and the whole country. Once the financial sector is more developed in the provincial region, the financial agglomeration phenomenon will become more prominent. There will be a “pumping machine” effect, attracting employees from financial institutions in neighboring provincial regions, thus leading to an excessive concentration of financial institution employees. The continuous outflow of employees from financial institutions in neighboring provincial regions, especially the outflow of some highly qualified employees, leads to the need for more talent support for the financial industry, thus inhibiting the high-quality financial development of the region.
The construction of the pilot free trade zone has promoted high-quality financial development. In the new development pattern, the construction of the pilot free trade zone has become a key factor in “internal attraction and outreach”. The construction of the pilot free trade zone has led to more pioneering reform measures in financial facilitation and other aspects. It has promoted high-quality financial development by increasing the degree of openness to the outside world and improving the efficiency of financial services to the real economy in many ways.
Industrial structure, government regulation, and economic development levels influence high-quality financial development. Due to the decomposition results of spatial spillover effects, industrial structure, government regulation, and economic development level are also positive influencing factors for the level of high-quality financial development of this provincial region. However, the level of government regulation and economic development in one provincial region has adverse spatial spillover effects on the level of high-quality financial development in neighboring regions.
The following aspects can be optimized by promoting high-quality financial development: first, boost the vitality of the digital economy by accelerating the building of new foundations; second, strengthen inter-regional cooperation to take full advantage of the spillover and feedback effects of the digital economy in the eastern region; third, give the pilot free trade zone greater reform autonomy in financial services to further improve the efficiency of financial services for the real economy.

Author Contributions

Conceptualization, H.Z. and X.L. (Xinyi Li); methodology, X.L. (Xinyi Li); software, X.L. (Xinyi Li); validation, H.Z.; formal analysis, X.L. (Xiaoli Li); investigation, X.L. (Xiaoli Li); resources, H.Z.; data curation, X.L. (Xinyi Li); writing—original draft preparation, X.L. (Xinyi Li); writing—review and editing, H.Z.; visualization, X.L. (Xiaoli Li); supervision, H.Z. All authors have read and agreed to the published version of the manuscript.

Funding

This research received no external funding.

Institutional Review Board Statement

Not applicable.

Informed Consent Statement

Informed consent was obtained from all subjects involved in the study.

Data Availability Statement

Not applicable.

Conflicts of Interest

The authors declare no conflict of interest.

References

  1. Huang, X.; Binqing, C.; Yalin, L. Evaluation index system and measurement of high-quality development in China. Rev. Cercet. Interv. Soc. 2020, 68, 163. [Google Scholar] [CrossRef]
  2. Jin, B. Study on the “high-quality development” economics. China Ind. Econ. 2018, 1, 163–180. [Google Scholar]
  3. Sun, Z.; Lu, C. Xi Jinping’s Outlook on High Quality Development of the Financial Industry in the New Era. Financ. Econ. Res. 2020, 6, 3–21. [Google Scholar]
  4. Liu, Y.; Liu, M.; Wang, G.; Zhao, L.; An, P. Effect of environmental regulation on high-quality economic development in China—An empirical analysis based on dynamic spatial durbin model. Environ. Sci. Pollut. Res. 2021, 28, 54661–54678. [Google Scholar] [CrossRef]
  5. Wang, R.; Wang, F. Exploring the role of green finance and energy development towards high-quality economic development: Application of spatial Durbin model and intermediary effect model. Int. J. Environ. Res. Public Health 2022, 19, 8875. [Google Scholar] [CrossRef]
  6. Lu, W.; Wu, H.; Wang, L. The optimal environmental regulation policy combination for high-quality economic development based on spatial Durbin and threshold regression models. Environ. Dev. Sustain. 2022, 1–27. [Google Scholar] [CrossRef]
  7. Chen, S. Effect of green investment on high-quality economic development in china under the new era. Front. Econ. Manag. 2021, 2, 369–376. [Google Scholar]
  8. Chi, M.; Guo, Q.; Mi, L.; Wang, G.; Song, W. Spatial distribution of agricultural eco-efficiency and agriculture high-quality development in China. Land 2022, 11, 722. [Google Scholar] [CrossRef]
  9. Yao, W.; Sun, Z. The Impact of the Digital Economy on High-Quality Development of Agriculture: A China Case Study. Sustainability 2023, 15, 5745. [Google Scholar] [CrossRef]
  10. Wang, M.; Yu, D.; Chen, H.; Li, Y. Comprehensive Measurement, Spatiotemporal Evolution, and Spatial Correlation Analysis of High-Quality Development in the Manufacturing Industry. Sustainability 2022, 14, 5807. [Google Scholar] [CrossRef]
  11. Wu, Y.; Zhang, S. Research on the evolution of high-quality development of China’s provincial foreign trade. Sci. Program. 2022, 2022, 3102157. [Google Scholar] [CrossRef]
  12. Zhang, W.; Zhao, S.; Wan, X.; Yao, Y. Study on the effect of digital economy on high-quality economic development in China. PLoS ONE 2021, 16, e0257365. [Google Scholar] [CrossRef]
  13. Wang, W.; Zhang, Y. Financial Structure, Industrial Structure Upgrading and Economic Growth—The Perspective of Technological Progress Based on Different Characteristics. Economist 2022, 2, 118–128. [Google Scholar]
  14. Laguna de Paz, J.C. Some implications of the new global digital economy for financial regulation and supervision. J. Bank. Regul. 2022, 1–10. [Google Scholar] [CrossRef]
  15. Awan, U.; Shamim, S.; Khan, Z.; Zia, N.U.; Shariq, S.M.; Khan, M.N. Big data analytics capability and decision-making: The role of data-driven insight on circular economy performance. Technol. Forecast. Soc. Chang. 2021, 168, 120766. [Google Scholar] [CrossRef]
  16. Tian, X.; Zhang, Y.; Qu, G. The Impact of digital economy on the efficiency of green financial investment in China’s provinces. Int. J. Environ. Res. Public Health 2022, 19, 8884. [Google Scholar] [CrossRef]
  17. Chen, X.; Yan, D.; Chen, W. Can the digital economy promote FinTech development? Growth Chang. 2022, 53, 221–247. [Google Scholar] [CrossRef]
  18. Wang, J.; Xie, Z.; Li, J.; Yang, D. Learning from institutional diversity to innovate: A study of Chinese exporters in digital industries. Int. J. Technol. Manag. 2021, 87, 384–411. [Google Scholar] [CrossRef]
  19. Vicente-Saez, R.; Gustafsson, R.; Martinez-Fuentes, C. Opening up science for a sustainable world: An expansive normative structure of open science in the digital era. Sci. Public Policy 2021, 48, 799–813. [Google Scholar] [CrossRef]
  20. Liu, M.; Jiang, W. Empirical Research on the Influence Mechanisms of Digital Resources Input on Service Innovation in China’s Finance Industry. Sustainability 2022, 14, 7143. [Google Scholar] [CrossRef]
  21. Ding, C.; Liu, C.; Zheng, C.; Li, F. Digital economy, technological innovation and high-quality economic development: Based on spatial effect and mediation effect. Sustainability 2022, 14, 216. [Google Scholar] [CrossRef]
  22. Shen, W.; Xia, W.; Li, S. Dynamic coupling trajectory and spatial-temporal characteristics of high-quality economic development and the digital economy. Sustainability 2022, 14, 4543. [Google Scholar] [CrossRef]
  23. Tang, L.; Lu, B.; Tian, T. Spatial correlation network and regional differences for the development of digital economy in China. Entropy 2021, 23, 1575. [Google Scholar] [CrossRef] [PubMed]
  24. Chang, X.; Li, J. Effects of the Digital Economy on Carbon Emissions in China: A Spatial Durbin Econometric Analysis. Sustainability 2022, 14, 16624. [Google Scholar] [CrossRef]
  25. Wang, J.; Luo, X.; Zhu, J. Does the digital economy contribute to carbon emissions reduction? A city-level spatial analysis in China. Chin. J. Popul. Resour. Environ. 2022, 20, 105–114. [Google Scholar] [CrossRef]
  26. Zhang, W.; Liu, X.; Wang, D.; Zhou, J. Digital economy and carbon emission performance: Evidence at China’s city level. Energy Policy 2022, 165, 112927. [Google Scholar] [CrossRef]
  27. Yi, M.; Liu, Y.; Sheng, M.S.; Wen, L. Effects of digital economy on carbon emission reduction: New evidence from China. Energy Policy 2022, 171, 113271. [Google Scholar] [CrossRef]
  28. Zhao, S.; Peng, D.; Wen, H.; Song, H.J.S. Does the digital economy promote upgrading the industrial structure of Chinese cities? Sustainability 2022, 14, 10235. [Google Scholar] [CrossRef]
  29. Guan, H.; Guo, B.; Zhang, J.J.S. Study on the impact of the digital economy on the upgrading of industrial structures—Empirical analysis based on cities in China. Sustainability 2022, 14, 11378. [Google Scholar] [CrossRef]
  30. Gao, Y.; Xu, Y.; Ji, C.; Zhong, Y. The Measurement and Characteristics of China’s Financial Industry High-quality Development. J. Quant. Tech. Econ. 2020, 10, 63–82. [Google Scholar]
  31. Elhorst, J.P. Spatial Econometrics: From Cross-Sectional Data to Spatial Panels; Springer: Berlin/Heidelberg, Germany, 2014; Volume 479. [Google Scholar]
  32. Liu, J. Research on the Evaluation of High-Quality Financial Development in The Yangtze River Economic Belt. Master’s Thesis, Chongqing Technology and Business University, Chongqing, China, 2020. [Google Scholar]
  33. Stavytskyy, A.; Kharlamova, G.; Stoica, E.A. The analysis of the digital economy and society index in the EU. TalTech J. Eur. Stud. 2019, 9, 245–261. [Google Scholar] [CrossRef]
  34. Sidorov, A.; Senchenko, P. Regional digital economy: Assessment of development levels. Mathematics 2020, 8, 2143. [Google Scholar] [CrossRef]
  35. Yang, S.; He, J. Analysis of Digital Economy Development Based on AHP-Entropy Weight Method. J. Sens. 2022, 2022, 7642682. [Google Scholar] [CrossRef]
  36. Li, K.; Kim, D.J.; Lang, K.R.; Kauffman, R.J.; Naldi, M. How should we understand the digital economy in Asia? Critical assessment and research agenda. Electron. Commer. Res. Appl. 2020, 44, 101004. [Google Scholar] [CrossRef]
  37. Li, Z.; Liu, Y. Research on the spatial distribution pattern and influencing factors of digital economy development in China. IEEE Access 2021, 9, 63094–63106. [Google Scholar] [CrossRef]
  38. Athanassopoulos, A.D. Service quality and operating efficiency synergies for management control in the provision of financial services: Evidence from Greek bank branches. Eur. J. Oper. Res. 1997, 98, 300–313. [Google Scholar] [CrossRef]
  39. Shi, S. Mechanism Analysis of the Effects of Economic Growth on Financial Development: An Empirical Analysis Based on China’s County Data. Financ. Trade Res. 2011, 2, 107–112. [Google Scholar]
  40. Becerra, O.; Cavallo, E.; Scartascini, C. The politics of financial development: The role of interest groups and government capabilities. J. Bank. Financ. 2012, 36, 626–643. [Google Scholar] [CrossRef]
  41. Wang, L.; Liu, Z.; Shi, H. The Impact of the Pilot Free Trade Zone on Regional Financial Development. China World Econ. 2022, 30, 154–184. [Google Scholar] [CrossRef]
  42. Santoli, S. The Theory of Economic Development. An Inquiry into Profits, Capital, Credit, Interest and the Business Cycle; JSTOR: New York, NY, USA, 1964. [Google Scholar]
  43. Akinwande, M.O.; Dikko, H.G.; Samson, A. Variance inflation factor: As a condition for the inclusion of suppressor variable (s) in regression analysis. Open J. Stat. 2015, 5, 754. [Google Scholar] [CrossRef]
  44. Han, F.; Sui, F. Effect of global Moran’s I and space-time permutation scanning method in Shanghai metro traffic based on ecological transportation system. Ekoloji 2019, 28, 4741–4749. [Google Scholar]
  45. Yin, H.; Wang, P. Transnational infection and spatial dependence of stock investor sentiment: Based on panel data from seven countries such as China and US. J. Ind. Eng. Eng. Manag. 2020, 34, 224–232. [Google Scholar]
  46. LeSage, J.P. An introduction to spatial econometrics. Rev. D’économie Ind. 2008, 123, 19–44. [Google Scholar] [CrossRef]
Figure 1. The level of high-quality financial development in 2013 and 2020.
Sustainability 15 07451 g001
Figure 2. Regional Distribution map of the level of high-quality financial development: (a) 2013; (b) 2020.
Sustainability 15 07451 g002
Figure 3. The Moran scatter plot in 2013: (a) High-quality financial development; (b) The digital economy.
Sustainability 15 07451 g003
Table 1. Indicator system for the explained variable (HQF).
Level 1Level 2Level 3
Market StructureFinancial Market SizeSocial financing scale increments
Financial Market EfficiencyThe incremental social financing scale/GDP
The proportion of direct financing in the total social financing scale
Year-end loan balances of financial institutions
Innovation CapacityFinancial InnovationsR&D expenditure/GDP
The proportion of financial funding for science and technology promotion
The ratio of total revenue and number of high-tech enterprises
Business PhilosophyGreen FinanceFinancial support for green development funds accounted for
Investment in environmental pollution control/GDP
Financial OpennessImport and export volume/GDP
Service LevelFinancial Information ServicesNumber of financial information service business units
Risk PreventionFinancial Risk PreventionNon-performing loan rate of financial institutions
Table 2. Indicator system for the explanatory variable (DE).
Level 1Level 2Level 3
Digital
Industrialization
CommunicationsTotal telecommunications businesses
Cell phone penetration rate
Long-distance fiber optic cable line length
Internet broadband access ports
Express business volume
Cell phone exchange capacity
Internet and Related ServicesNumber of Ipv4 addresses
Total number of CN domain names
Software and Information Technology
Services
Software business revenue
Information technology service revenue
Electronic Information ManufacturingRevenue from main businesses
Industry
Digitization
Industrial DigitalizationOperating income
Digital InnovationExpenditures on the introduction of technology
Expenditures on technical transformation
Digital
Governance
E-commerce Development LevelE-commerce procurement volume
The proportion of enterprises using e-commerce
Number of employees in the information transmission, software and information technology services sector
Table 3. Descriptive statistics.
VariableSymbolObs.MeanSd.Min.Max.
The level of high-quality financial developmentlnHQF248−1.8030.478−2.836−0.378
The digital economylnDE248−2.5140.810−4.506−0.278
The number of employeeslnne2482.7860.903−0.1084.557
The industrial structurelnis248−1.9520.238−2.723−1.343
The level of government regulationlngr248−1.3840.471−2.130.321
The degree of opennessdo24810.8990.41210.0512.013
The level of economic developmentlnep248−1.8030.478−2.836−0.378
Table 4. Multicollinearity diagnostic table.
Unstandardized CoefficientsStandardized
Coefficients
Collinearity Statistics
Model BStd. ErrorBetatSig.ToleranceVIF
1(Constant)0.0010.014 0.0610.951
lnDE0.4870.0520.5109.4130.0000.2244.468
lnne0.0020.0000.2514.6210.0000.2234.493
lnis0.2780.0950.0922.9410.0040.6701.492
lngr0.0060.0160.0120.3940.6940.6701.492
do0.0000.007−0.002−0.0550.9560.7571.321
lnep8.278 × 10−70.0000.2145.1840.0000.3842.602
Table 5. The global Moran’s I value for lnDE and lnHQF.
YearlnDEp-ValueLnHQFp-Value
20130.2100.0440.4900.000
20140.2290.0330.5370.000
20150.1780.0700.5190.000
20160.2030.0490.4960.000
20170.2050.0490.5200.000
20180.4770.0000.4700.000
20190.1800.0680.5220.000
20200.3900.0020.4350.001
Table 6. LM, LR, and Hausman tests.
Valuep-Value
LMlag40.836 ***(0.000)
Robust LMlag20.489 ***(0.000)
LMerror20.764 ***(0.000)
Robust LMerror0.418(0.518)
Hausman test28.15 ***
LR_spatial_lag26.75 ***
LR_spatial_error35.71 ***
Notes: *** represent significance at the 1% levels.
Table 7. Empirical results of spatial econometric model.
VariablesMain EffectsSpatial Effects (Wx)
lnDE0.219 ***0.239 **
(0.00)(0.01)
lnen0.136 ***−0.328 ***
(0.00)(0.00)
lnis0.161 **0.111
(0.01)(0.58)
lngr0.188 ***−0.545 ***
(0.00)(0.01)
do0.069 *0.077
(0.07)(0.46)
lnep0.462 ***−0.398 ***
(0.00)(0.00)
rho0.336 ***
(0.00)
Observations248
R-squared0.765
Number of code31
Notes: ***, **, * represent significance at the 1%, 5%, and 10% levels, respectively.
Table 8. The direct effect, the spatial spillover effect and the total effect.
VariablesDirect EffectSpatial Spillover EffectTotal Effect
lnDE0.239 ***0.449 ***0.688 ***
(0.00)(0.00)(0.00)
lnne0.117 ***−0.413 ***−0.296 **
(0.00)(0.00)(0.03)
lnis0.179 ***0.2550.433
(0.00)(0.36)(0.14)
lngr0.154 **−0.704 **−0.550
(0.02)(0.02)(0.10)
do0.074 **0.1380.212
(0.05)(0.38)(0.23)
lnep0.446 ***−0.349 *0.096
(0.00)(0.06)(0.62)
Notes: ***, **, * represent significance at the 1%, 5%, and 10% levels, respectively.
Table 9. Regional Spatial spillover effect decomposition.
VariablesEastern RegionsCentral and Western Regions
Direct EffectSpatial Spillover EffectTotal EffectDirect EffectSpatial Spillover EffectTotal Effect
lnDE0.212 ***0.408 ***0.620 ***−0.056−0.100−0.156
(0.00)(0.01)(0.00)(0.22)(0.48)(0.36)
ControlsYesYesYesYesYesYes
Notes: *** represent significance at the 1% levels, respectively.
Disclaimer/Publisher’s Note: The statements, opinions and data contained in all publications are solely those of the individual author(s) and contributor(s) and not of MDPI and/or the editor(s). MDPI and/or the editor(s) disclaim responsibility for any injury to people or property resulting from any ideas, methods, instructions or products referred to in the content.

