Article

The Impact of Industrial Intelligence on Carbon Emissions: Evidence from the Three Largest Economies

1
China-ASEAN Collaborative Innovation Center for Regional Development Co-Constructed by the Province and Ministry, Guangxi University, Nanning 530004, China
2
School of Economics, Guangxi University, Nanning 530004, China
3
School of Business, Guangxi University, Nanning 530004, China
*
Author to whom correspondence should be addressed.
Sustainability 2023, 15(7), 6316; https://doi.org/10.3390/su15076316
Submission received: 18 February 2023 / Revised: 27 March 2023 / Accepted: 5 April 2023 / Published: 6 April 2023

Abstract

:
Many studies are exploring the generated factors of carbon emissions to make a contribution to environmentally sustainable development as carbon emissions have increased by more than 5% in the past ten years. However, few investigations have considered the effects of industrial intelligence on carbon emissions. In order to discover whether the development of industrial robots will influence the environment, this paper employs the IFR data of industrial robots from 2006 to 2021 to investigate their impacts on carbon emissions in the three largest economies by using the classical linear regression model, OLS (Ordinary Least Squares), from the factors of robot installations and robot density, which are measured by ownership per thousand manufacturing people, respectively. The positive correlation coefficients of robot installation and density in the USA are 0.010 and 0.011; they are 0.185 and 0.204 in China; and 0.156 and 0.142 in Japan. To ensure the reliability of the results, we also do a robustness test and an endogeneity test by using the two-way fixed effect model, and they show the same results. The main findings of our study show that industrial intelligence can have significant positive impacts on carbon emissions in the three economies and this means that the application of industrial intelligence not only accelerates economic growth, but also causes the pressure on the environment. Moreover, the verification results also indicate that the impacts of industrial intelligence on carbon emissions are dominated by driving effects, and the higher the robot density, the stronger the driving effects on carbon emissions. Based on the findings, corresponding policy suggestions are proposed to guide governments in trimming their environment protection policies more efficiently.

1. Introduction

With the rapid development of industrialization and globalization in the past few decades, the increasing greenhouse gas (GHG) has threatened the climate and environmental quality. In 2018, three quarters of global greenhouse gases were caused by carbon dioxide and stimulate the global temperature to rise slightly; therefore, the persistent challenge for every country to maintain the sustainable development of the social–ecological environment is to reduce carbon emissions, as carbon dioxide is the main component of GHG [1]. At the end of 2015, the Paris global climate deal was signed by 195 economies at the United Nations Framework Convention on Climate Change (UNFCCC) to address climate change, and they reached a consensus that the global temperature growth should be restricted to no more than 2 ℃ within this century compared with the last [2,3]. The report of formerly British Petroleum shows that China is the largest carbon emission producer worldwide, the USA is the second emitter, and Japan ranked fifth in 2020. As they are the three largest economies, and accounting for their industrial development levels, their policies on atmosphere change and industrial structure revolutions will have extraordinary influence. To demonstrate the responsibilities and lead the way in environmental protection, the Chinese government announced their intention to achieve peak carbon emissions and carbon neutrality before 2030 and 2060, respectively, in the UNFCCC, and Japan has been aiming for carbon neutrality by the end of 2050 since the United States first proposed the concept of carbon emissions trading [4,5]. The data of the World Bank also reveals that the economies in these three countries maintain an upward tendency during this period and account for more than 40% of the global GDP although they occupy only nearly about 24% of the world population (World Bank, 2021). It is worth noting that China is the fastest growing country in terms of GDP among them, the USA is the largest one in economic aggregate, and Japan maintains a steady growth in total economic volume each year and still holds an important position in the world economy despite its share decreasing from about 8.8% in 2006 to 5.1% in 2021.
To realize the steady economic growth and carbon emission reduction dual goals, upgrading industrial structure and improving production efficiency were taken into consideration by these governments. In the past decade, robotic technologies are applied in most traditional industries to make the production process more innovative and efficient. For instance, these advanced robotic technologies not only promote production capacity and economic growth but also can solve some of the problems of food, the environment, and health [6]. Referring to the report of International Federation of Robots (IFR) [7,8,9], global industrial robot installation increased rapidly from 166 thousand units in 2011 to 571 thousand units in 2021, and this number increased over three times within this ten-year period. In addition, the report also pointed out that China, Japan, and the United States are the top three largest markets of industrial robot installations, especially in the automotive, electronics, and machinery industries [7,8,9,10,11]. Thus, we might find that intelligence manufacturing is not only changing traditional industrial production methods and participation efficiency, but also affecting the social environment and atmosphere quality to some extent. Figure 1 shows the industrial robots installation rates of the three largest economies and their shares in the world from 2006 to 2021. It is clear from Figure 1 that there is a rising trend in the application of the industrial robots in the world and the total installation quantity is growing almost every year. The robot market was briefly hit by the financial crisis which occurred in 2008, but after that it entered into a rapid growth period as the economy and global trade recovered from the crisis. From 2010 to 2021, the intelligent manufacturing industries began to develop fast because of the new automation and information technologies which emerged in the world, and this stimulates the sustained and rapid growth in the robots installation market.
As industry is the primary user of electric power, the amount of electricity consumption is rising synchronously with the increase in industrial robots adopted by the manufacturing industries. At present, global electric power is mainly generated from fossil fuels, especially the coal-fired power which accounts for more than 60% of total energy consumption used in thermal power generation [5,12]. Given the fact that the depletion of coal on such a scale can creates more CO2 emissions and the dependence of industrial production on electricity, it is worth pondering whether the adoption of robots will amplify or abate the CO2 pollution. At the same time, the mode of industrial transformation and the energy consumption structure are usually accompanied by the development of the economy, changes of supply and demand in the labor market, and the structure of regional industries [13,14,15]. Therefore, this paper intends to answer the above question by employing possible influencing factors—GDP per capita growth rate, employment ration, industrial structure, and energy consumption structure—to evaluate the impacts of industrial intelligence on carbon emissions.
Referring to the previous research which investigate the relationships between robot adoption and social development, most of them focused on production efficiency and labor markets, and there is hardly any literature that has studied the impacts on carbon emissions. We can sort them into two categories after reviewing these documents. On one hand, studies about robot adoptions are organized into the roles of robots in economic growth, production efficiency, labor market and firm revenue, etc. Fu et al. [16] used the data of seventy-four countries, including developing and developed economies, to study the correlations between the labor market and robot adoption with respect to inclusive growth. They found that robot stocks have positive impacts on both labor productivity and the employment rate. They also discovered that there is no significant influence of robots on the employment gender because both male and female laborers can benefit from it. Cette et al. [17] employed more than forty years of original data of thirty OECD countries into their study to obtain the conclusion that robot adoption is not the significant source of recovering productivity although it makes a contribution to productivity growth in a certain period. Schmidpeter and Winter-Ebmer [18] found that automation increased the career risks of employees in Austria because of their lower skills and poorer efficiency compared with robots, and it also showed out that both men and women may suffer from it strongly over time. The studies of Graetz and Michaels [19] showed that robots can not only stimulate the growth of the economy and productivity, but can also have some positive effects on the employment market at the same time. Aside for this, the results in the study found that the increasing density of industrial robots can improve average wages, albeit without revealing any significant negative effects on the total employment despite the fac that the robots severely lower the income of low-skilled labor. From the above literature review, we can notice that robotics manufacturing certainly has some impacts on different countries, regions, and groups. On the other hand, the related articles which focused on the factors which affect carbon emissions can be summed up as the following via the following list of items: economic development level, trade openness, industrial structure, energy consumption structure, and technological innovation, etc. Nguyen et al. [3] discovered that for G6 countries, economic growth, import and export scales, and capital market are cardinal drivers of carbon emissions, and CO2 emissions have a slightly negative impact on the stock market and foreign investment. Cao et al. [20] and Zheng et al. [21] carried out empirical tests in their research from the perspective of the urbanization process, and both of these studies clarified that the energy systems and energy consumption can affect regional CO2 emissions to change both the economic and the social environment, which are directly connected with the carbon emission reduction target. To mitigate climate change, industrial layouts and renewable technological innovations are vital strategies to realize green growth [1,22]. To balance the interests of economic development and the green environment, it is meaningful to construct reasonable industrial structures by expanding the tertiary industry and motivating high-tech industries. Z. Li et al. [13] analyzed the industrial structure evolutionary trend between China and Japan, which is based on the input–output mechanism by the integrated evolution model. The findings revel that the carbon emissions can be curbed by increasing the share of the tertiary industry. J. Li and Li [23] and Xie et al. [24] pointed out that renewable energy technologies and clean production technologies must be implemented in order to burn less coal, as it is still the pillar energy source for power generation in most districts in the world. In short, we cannot neglect these factors, which are indeed closely related to carbon emissions and have some impacts on climate change. Compared with the previous studies, this paper makes three contributions. First of all, this study is one of the few which analyzed the interaction between industrial intelligence and carbon emissions with respect to robots. In addition, the results which are verified in this paper can guide governments in trimming their environmental protection policies, noting the typical research objects are more instructive for reference and powerful in the economy and industrial systems. Finally, in light of the diversities in the levels of scientific and technological advancements among different countries, we verify the correlations between industrial intelligence and total CO2 emissions through two aspects—total number of installation robots and robot density (number of robots per thousand people)—to ensure the accuracy of the results.
The remainder of our paper is divided into four parts. Section 2 describes the theoretical background of our study. Section 3 presents the data sources and the model which is applied in this research. Section 4 analyzes the empirical results. Finally, Section 5 sets out the main conclusions and suggestions.

2. Theoretical Background

On the one hand, the scale of industry and the advanced degree of industrialization are essential to the economic growth and energy consumption structure in the sustainable development of the environment. On the other hand, there are various diversities of development levels among different countries such as populations, employment rate, science, and technology etc. Hence, this study verifies the impacts of increasing adoption of industrial robots on carbon emissions separately from the total amount of industrial robot installations and its density. We will take these factors—economic growth level, labor market, industrial structure, energy consumption structure—into our research consideration to investigate the influence of industrial intelligence on carbon emissions. Figure 2 presents the design and steps of this study.

2.1. Economic Growth Level

The real GDP per capita growth rate (GDPPG) in our paper is used to judge the degree of economic growth. Acheampong et al. [25] employed this variable in their study to research the relationship between financial market expansion and CO2 emission intensity. In this study, they measured economic growth levels by real GDP per capita index. Lan et al. [26] and Zheng et al. [21] used the variable of GDP per capita into their research to study how to balance economic growth and air pollution. The outcome of their study shows that the energy consumption quantity will increase with the improvement of economic development which will cause the rise of CO2 emissions worldwide. Meanwhile, Fan et al. [27] also figured out that there exists the connection between labor costs and robot stocks by analyzing the effects of high costs on the labor market in China. These results indicate that different patterns of robot adoption can have diverse impacts on firm productivity, labor productivity, labor incomes, and carbon emissions, which are closely related to GDP per capita. In any case, an extensive literature has already pointed out the symbiosis between economic growth and carbon emissions.

2.2. Labor Market

The labor market factor (EMP) is measured by the proportion of employees over the age of 15 in the total labor force. Ballestar et al. [28] analyzed more than one thousand small and medium manufacturing companies in Spain and concluded that the robot devices of enterprises have more excellent performance in improving productivity level, labor productivity, and employment rate, and expanding the relevance of multi-factor productivity components compared with non-robotized enterprises. On the contrary, Acemoglu and Restrepo [29] came up with the idea that the increasing use of robots in industries from 1990 to 2007 has already had a negative influence on the labor market in the USA. They estimate that employment rate can be reduced by 0.18% to 0.34% and wages can be reduced by 0.25% to 0.5% when adding one robot for per thousand employees. Although different studies reveled opposing views in the previous research, the more flexible movement and efficient robots have indeed had a non-negligible impact on the labor market.

2.3. Industrial Structure

The industrial structure (INDS) is judged by the percentage of the total output value of the secondary industry in GDP, owing to the reason that it is the major energy consumption industry. According to the characteristics of industrial structure, the government could make a contribution to achieving the goal of reducing carbon emissions by restructuring the secondary industry or increasing the occupation of the tertiary industry due to the fact that the former is mainly related to manufacturing production and the latter with service provision. T. Yang and Wang [14] and Zheng et al. [21] took the same view that properly adjusting the industrial structures between these two trades can lessen carbon emissions effectively. Therefore, it is essential to incorporate this variable into our research.

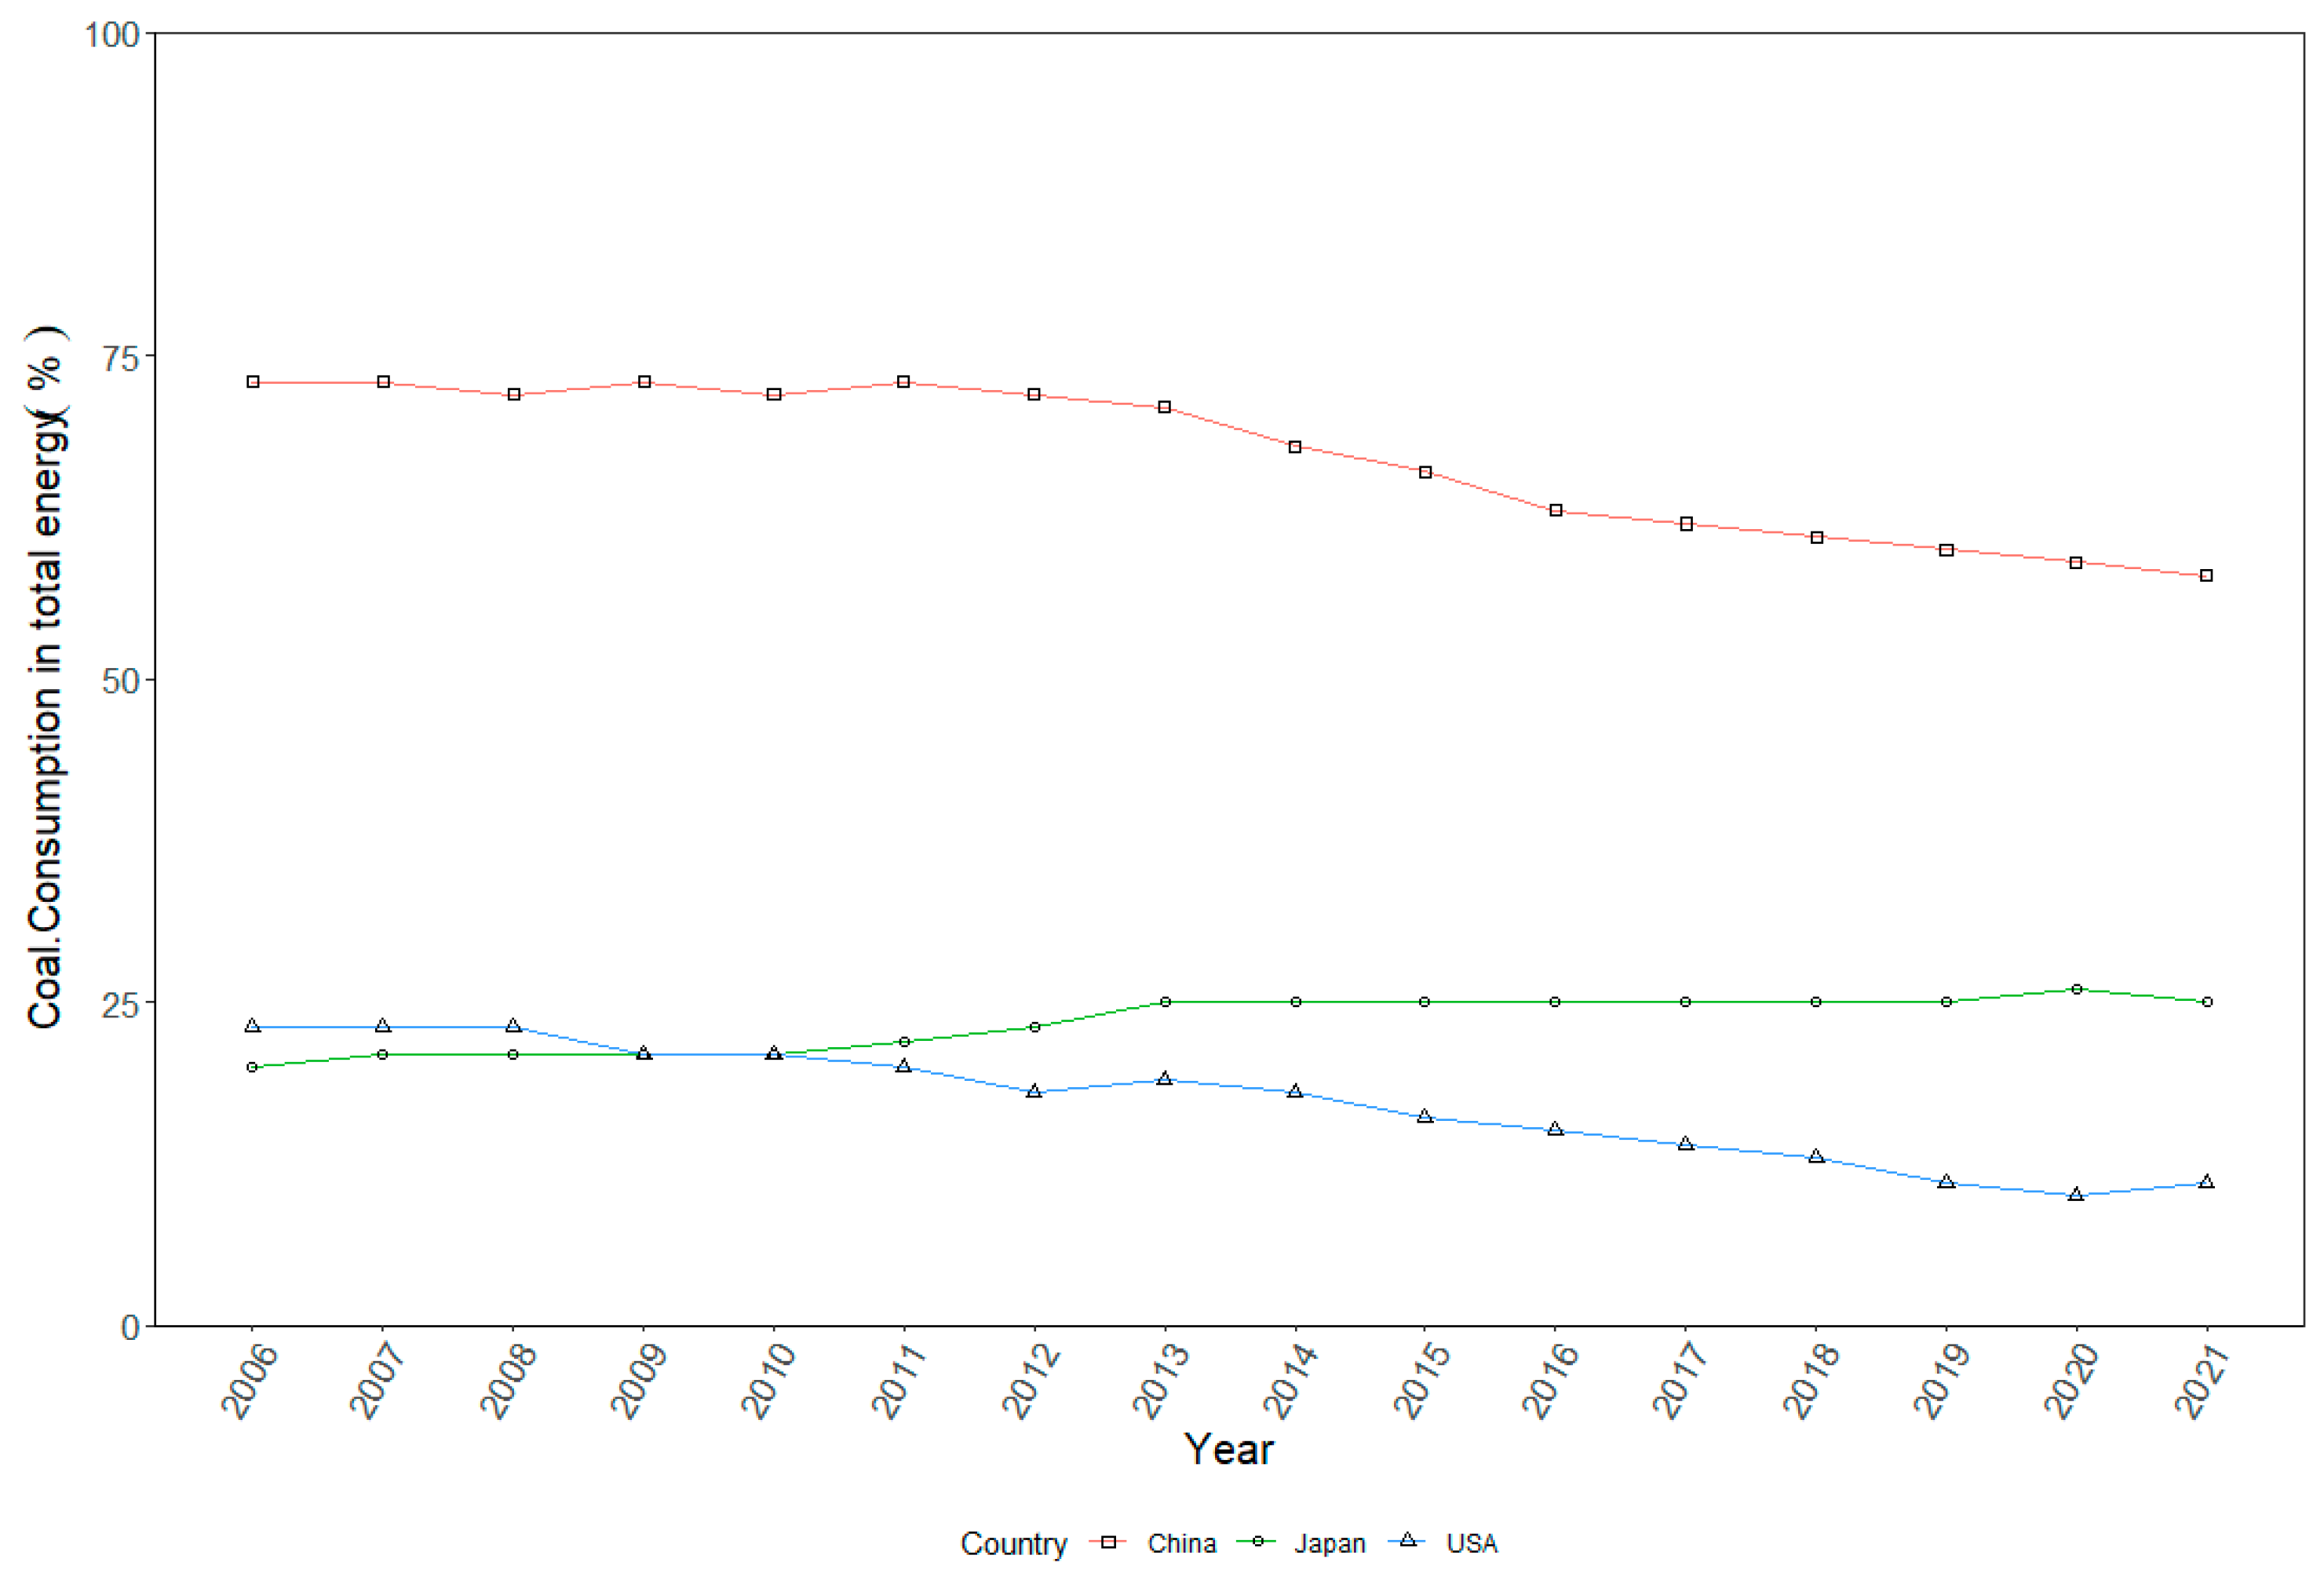
2.4. Energy Consumption Structure
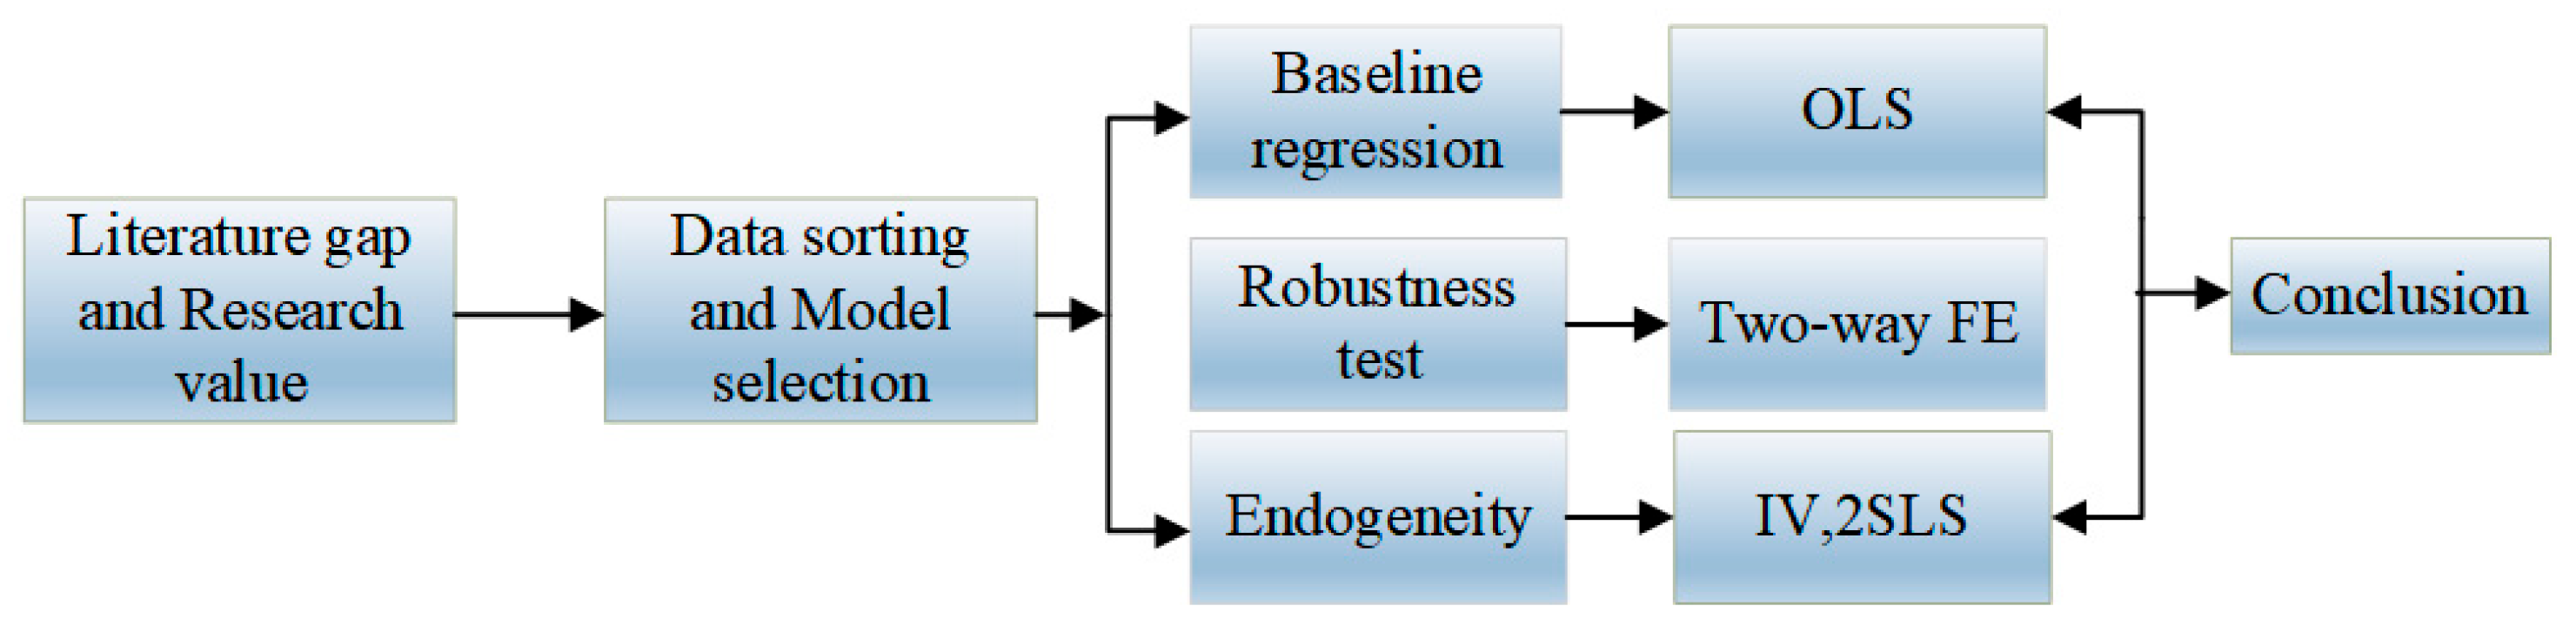
Energy consumption structure (COALP) is measured by the ratio of coal consumption to total energy consumption. It is well known that coal is still used widely in social production as a fossil fuel although new energy technologies have been evolving constantly. Many studies have pointed out that coal is the main cause of GHG. The districts dominated by coal resources are facing problems and they should plan new energy policies and invest in new energy technologies to achieve the carbon emission target as coal, as a natural energy resource, can release more GHG than oil [23]. We find that the energy structure can be reflected in the carbon emissions; coal consumption occupied 84.1% of the total energy in China but only 47.2% in the USA because the latter used more natural gas and nuclear energy [30]. Indubitably, energy consumption structure is one of the contributors that cannot be ignored in environmental sustainable development. Figure 3 presents the proportion of coal consumption in the total energy consumption of the three largest economies from 2006 to 2021. From the chart, two phenomena could be observed: the first, it shows that the energy consumption structures are changing in the USA and China as the consumption of coal has been decreasing year by year from 2011, but the circumstances in Japan are basically unchanged and even rises slightly; the second, the energy consumption in China is dominated by coal, and it is meaningful for the government of China to optimize the energy consumption structure and formulate reasonable policies on climate protection.

3. Methodology

3.1. Model and Variables
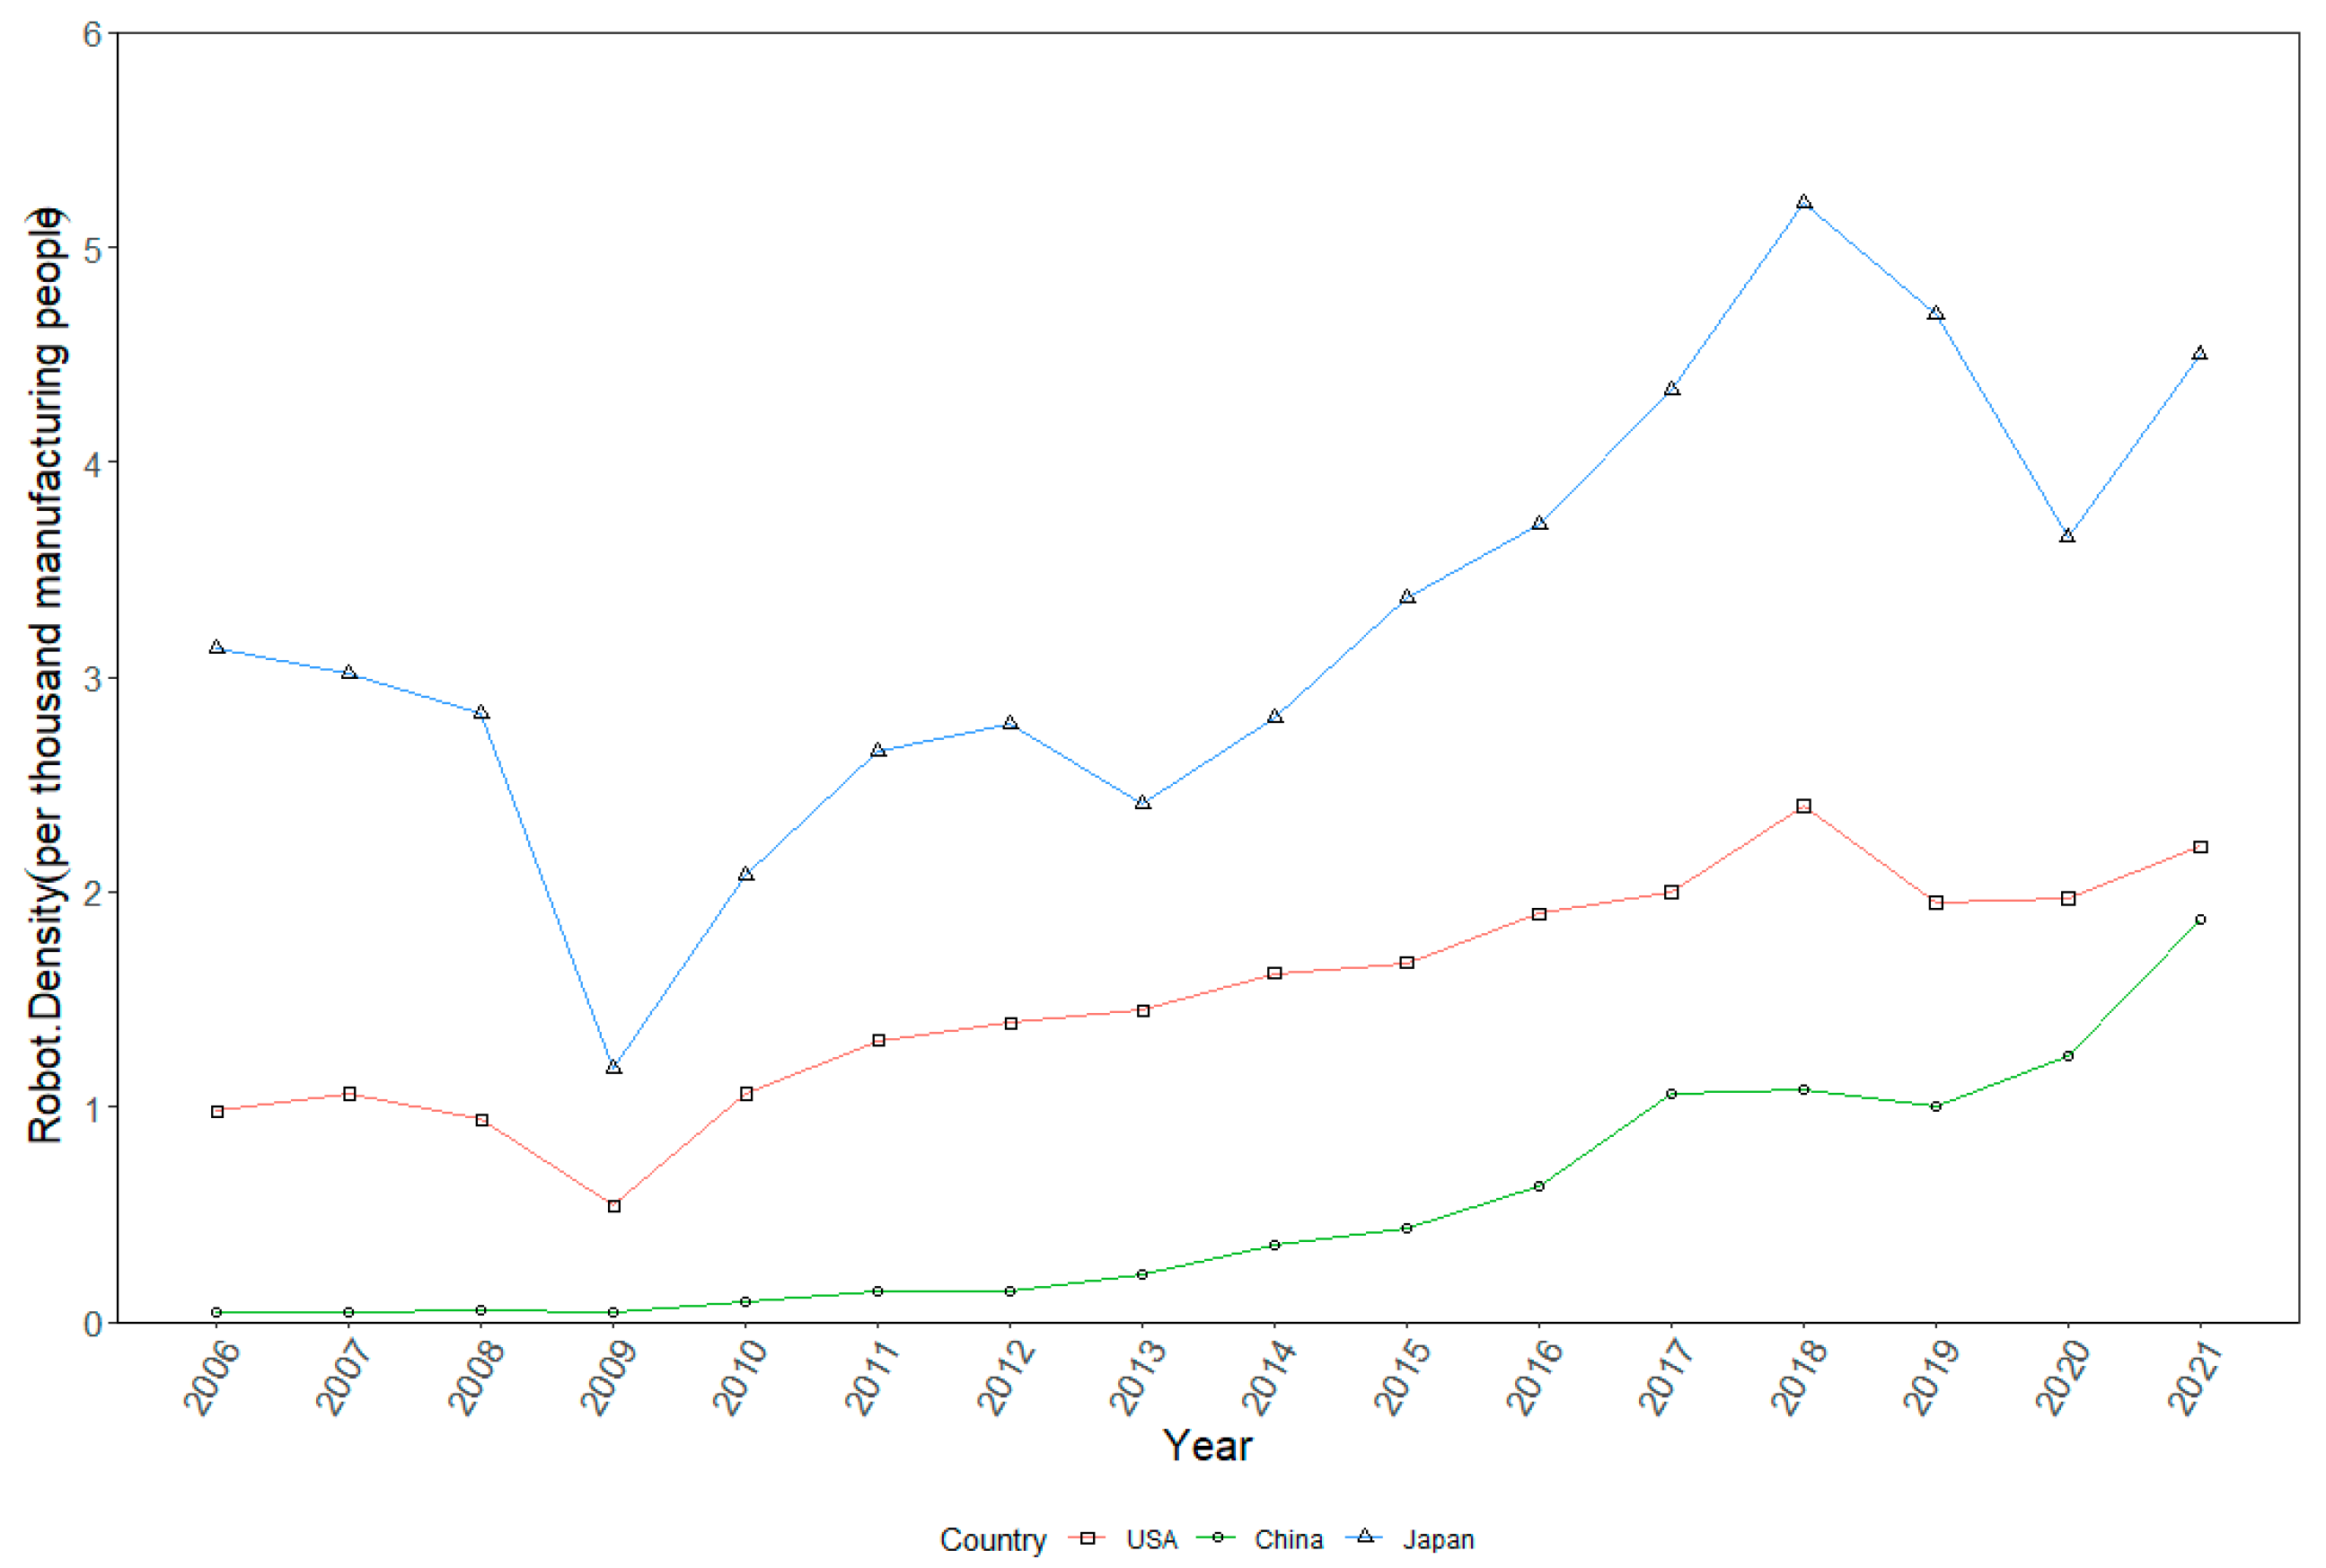
In order to verify the impacts of robot adoption on carbon emissions in the three largest economies, we employ the amount of industrial robot installation as the independent variable and incorporate some control variables—GDDPPC, EMP, INDS, COALP—into our regression model, which we derived from the previous literature (see above). The dependent variable is carbon emission. The most classical and commonly used method to select a “best fit” line for a set of data to estimate the unknown parameters is the OLS technique, which aims to minimize the square distance between the estimated and observed values. At the same time, referring to the studies of Graetz and Michaels [19,31], they introduced the OLS model to analyze the effects of industrial robots density on the labor market in European countries. Meanwhile, some researchers applied OLS or DOLS models to evaluate the carbon creation factors bearing on environmental pollution and forecast the effects of carbon emission reduction policies in the USA and other European economies [1,3,25]. Consequently, we select the OLS regression model in our investigation. Our regression model equations are as follows:
LN Yct = α0 + α1 × LN robotsct + α2 × controlsct + εct
LN Yct = β0 + β1 × LN ROBOTDct + β2 × controlsct + ε’ct
where Yct is the observed variable of total amount of CO2 emissions in country c in year t. In order to avoid heteroscedasticity problems, we take the logarithmic forms of carbon emissions (LNCE), robot installation quantity (LNrobots), and robot density (LNROBOTD) to replace the aggregate value. controlsct are the control variables, comprising economic growth, employment rate, industrial structure, and energy consumption structure, which are derived from the previous research. We define the GDP per capita growth rate as economic growth (GDPPG), total employees to the total working age (aged over 15) population as total employment rate (EMP), the percentage size of the secondary industry as industrial structure (INDS), and the ratio of coal consumption to total energy consumption as energy consumption structure (COALP). Equation (1) is the model for estimating the impacts of robot installations on carbon emissions; Equation (2) is for evaluating the effects of robot density on carbon emissions.
Moreover, the residual tests of the data will be introduced into our study to eliminate the interference of heteroscedasticity on the OLS model results. According to the theoretical hypothesis, the stability of the model should be based on the rules of zero mean error and the same variance. The hypothesis will be held when the observed residual values are in an irregular scattered distribution with zero axis as the average level. At the same time, the normal distribution tests of the data are needed before the regression verification. The data should follow a normal distribution to ensure the reliability of our experimental results. We will use the Q–Q (Quantile–Quantile) normality tests to check it; these have been applied widely to present the testing data distribution in previous studies [24]. The detection results of the variables used in robot installations and robot density are expressed in Figure 4a,b. The trends by which the red curves move around the zero axis can prove that the residual hypothesis could be held in both of these graphs. From the two Q–Q pictures, the traces of the data points almost obey the straight line in the plots, and these mean that the variables of robot installations and robot density are consistent with the normal distributions. Thus, it is appropriate to apply the OLS regression model to our study after the above data verifications.

3.2. Data Sources

This paper focuses on the impact of industrial intelligence on carbon emissions in the USA, China, and Japan, and we employ the relevant data from 2006 to 2021 to verify this influence. The main data source of industrial robots is from the International Federation of Robotics (IFR), which contains robotic information from many national robot relevant organizations, such as the Robotic Industries Association (RIA) in the USA, the Chinese Robot Industry Alliance (CRIA) in China, the Japanese Robot Association (JARA) in Japan, and so on. The increasing trend of robot adoptions globally from the IFR data in recent years is easy to observe. The IFR reports that the total global industrial robots stock was over three million units in 2021, and it increases two-fold within this ten year-period compared with the increase in 2008. The aggregate robot installations in the USA, China, and Japan share about a half of the world quantity, and most of them are widely applied in the automotive, electronics, and machinery industries. The industrial robot usage in China maintained a sustained increase as its economic grew from only a 2% share of the world in 2006 to 35% in 2021. The share in the USA declines slightly from 16% in 2006 to 10.5% in 2021, but the quantity is growing steadily. The share in Japan is opposite to the situation in China because both of total quantity and share have decreased during this period; the occupation decreases from 24% to only 13% in 2021. In summary, China has a rapid growth in both aggregation and share in the world; the USA demonstrates a steady increase in quantity, but not in share; Japan has neither the advantages in aggregation nor in occupation. Our second main data sources are the World Bank and the International Labor Organization (ILO). The World Development Indicators data of the World Bank provide total populations, GDP growth rates, and GDP per capita growth rates. The ILO contributes total employment rates and other data which relate to the labor force worldwide. Moreover, we also obtain the data of coal consumption proportions and secondary industry occupations from the U.S. Energy Information Administration (EIA), which can provide various data which relate to energy consumption and carbon emissions. This unified data collection method grants the conclusion guiding and reference significance for policy-makers.
Table 1 presents the variables which are introduced into our regression models. Some interesting phenomena expressed in the data can be observed. First, although China owns the largest installation quantity, but the density of robot installation in Japan is much higher than the other two. Second, the industrial structures and the coal consumption rates are worth noting. In China, the GDP of the secondary industry accounts for nearly half of the total, and the coal consumption rate is greater than that of the other two economies (the average figure is almost 70%). This means that fast economic growth and the expansion of the secondary industry in this region are driven by coal energy, as they are in a country with rich coal resources. As a developing country with the largest population in the world, the real GDP per capita in China is the lowest among these three countries, although it has a high GDP growth.

4. Empirical Results

4.1. Carbon Emissions and Total Industrial Robot Adoption

Table 2 presents the empirical results concerning the effects of the total amount of robot installations on carbon emissions in the USA, China, and Japan. It tells us that the significant results only appear in China and Japan, not in the USA. The positive coefficients of LNrobots in the results mean that a 1% increase in robot installations results in roughly a 0.19% increase in carbon emissions in China and a 0.16% increase in Japan. Although these impacts, which we can see from the testing results, are relatively slight, they do indeed indicate the positive and driving effects of robots on carbon emissions. It is easy to understand that China has the maximum coefficient among the three because of its largest robot stock and installation in recent years. Why does Japan obtain a similar correlation coefficient to China when it is not the country with the largest robot installations? It can be explained by the fact that Japan dominated the robot stocks in the past few decades as it is one of the most powerful countries in the high-tech manufacturing fields, especially in automobile manufacturing and the electronics industry. These traditional automation manufacturing industries are closely related to energy-intensive consumption and emit GHG to a great extent.
Although the strategy of industry 4.0 was put forward a few years ago, it still needs time to make some improvements and upgrade on traditional industrial transformation. From Figure 1, we notice that China replaced Japan as the largest country in robot installation in 2013, and the transformation and upgrading of industrialization cannot catch up with the pace of such rapid industrial development. This also implies that China needs some time to update its industrial structure and construct a new intelligent manufacturing system to reduce the consumption of fossil fuels. Therefore, new technologies which can promote industrial transformation and reduce carbon emissions effectively should be implemented, especially renewable energy technologies and new manufacturing system technologies, and we should know all of these will take time to achieve their target. This finding is consistent with Jin et al. [32]; they point out in their study the truth that the development of manufacturing industries will still release a great quantity of GHG due to high energy consumption characteristics, and the new manufacturing systems, including new manufacturing processes, materials technologies, and product designs, can promote the transformation of traditional industries and realize the carbon emission reduction in the future. Except for this, the results also informed us that the positive influences of robot adoption on CO2 emissions exist in all three countries, and the strong correlations are verified in China and Japan; that is to say, the applications of robots show a driving effect on carbon emissions and the intelligent manufacturing cannot reduce carbon emissions, at least for now. To ensure the accuracy of the experimental results, we further carry on the research to test the correlations between robot density and CO2 emissions in these three economies.

4.2. Carbon Emissions and Industrial Robot Density

Figure 1 illustrates the fact that China is the country with the largest robot installations in the world since it transcends Japan after 2012. However, this condition is quite different from the perspective of robot density. Figure 5 expresses the robot density curves of the three largest economies. From the graph, it can clearly be observed that Japan is the country with the largest number of robots per thousand manufacturing employees among the three countries and it has been in the advantageous state for a long time compared with other two. Conversely, the robot density is at a low level constantly in China despite it having the largest total robot adoptions. It is obvious to see the robot density is rising with the expansion of the manufacturing industry in this country, and this makes it play an indispensable role in the global industrial chain. The robot density in the United States is at the second highest among the three countries, and it shows a steady upward trend.
We employ variables of robot density into Equation (2) to verify the correlations of robot density and carbon emissions, and the results are shown in Table 3. Positive results appear in all of the three countries, which are same with the installation test, and the results of China and Japan demonstrate that the robot adoptions make greater contributions to carbon emissions. The positive coefficients of LNROBOTD in the table mean that 1% robot density growth can increase roughly 0.01% carbon emissions in the USA. Compared with the slight influence in the USA, the impact in China and Japan is out of ordinary. The coefficients of China and Japan are larger than the USA, and a 1% robot density rise can increase carbon emission by about 0.2 and 0.14%. Many studies have pointed out the fact that more robots can improve production efficiency and economic growth, but these tendencies are unsustainable when the adoption of robots reaches a critical point [33]. This can explain that the robot adoptions and robot density in Japan are at a high level, but the increase in its economy cannot maintain the synchronous growth. In addition, the low carbon emission efficiency in China can be caused by the low level of management and technology in industry compared with the other two [34]. In any case, the results exactly prove that robot adoption can promote CO2 emissions in all of the three countries and this finding is consistent with the discovery of our test on the robot installations. In addition, the empirical results reveal that higher robot density may lead to greater carbon emissions. As the robot density in Japan is much larger than that in the USA, and the estimation outcomes in the table also show this tendency synchronously, the robot density in Japan have more positive effects on Carbon dioxide emissions. It is interesting to observe that the robot density in the USA is much larger than that of China, but the impact of it on carbon emissions is smaller than that of China. The reason for this phenomenon is the difference in energy structure between these two countries. Fossil energy has made a great contribution to the rapid development of economy in China in the past twenty years, and coal resources are the main contributor to this growth in terms of energy. The coal consumption rate in Table 1 shows that coal accounts for about 67.3% of total energy consumption, and this figure is only 17.3% in the USA. These different energy structures bring about the differences in carbon emissions, although China is the one with the smallest robots per thousand employees. Figure 3 demonstrates that the coal consumption rate in China is higher than those in the USA and Japan. Z. Li et al. [13] also clarified this view in their research when they investigate the influence of industrial structures on carbon emissions in China and Japan; they concluded that diversified energy structures will produce different carbon emission effects because coal is the energy with higher GHG emissions than oil and gas, and coal consumption plays the vital role in carbon emissions [35].
Consequently, it can be summarized from the experimental results that industrial intelligence can have a positive and driving influence on carbon emissions in all of the three countries, and it is more likely to cause carbon dioxide pollution with the higher density of robots based on the existing energy and industrial structures.

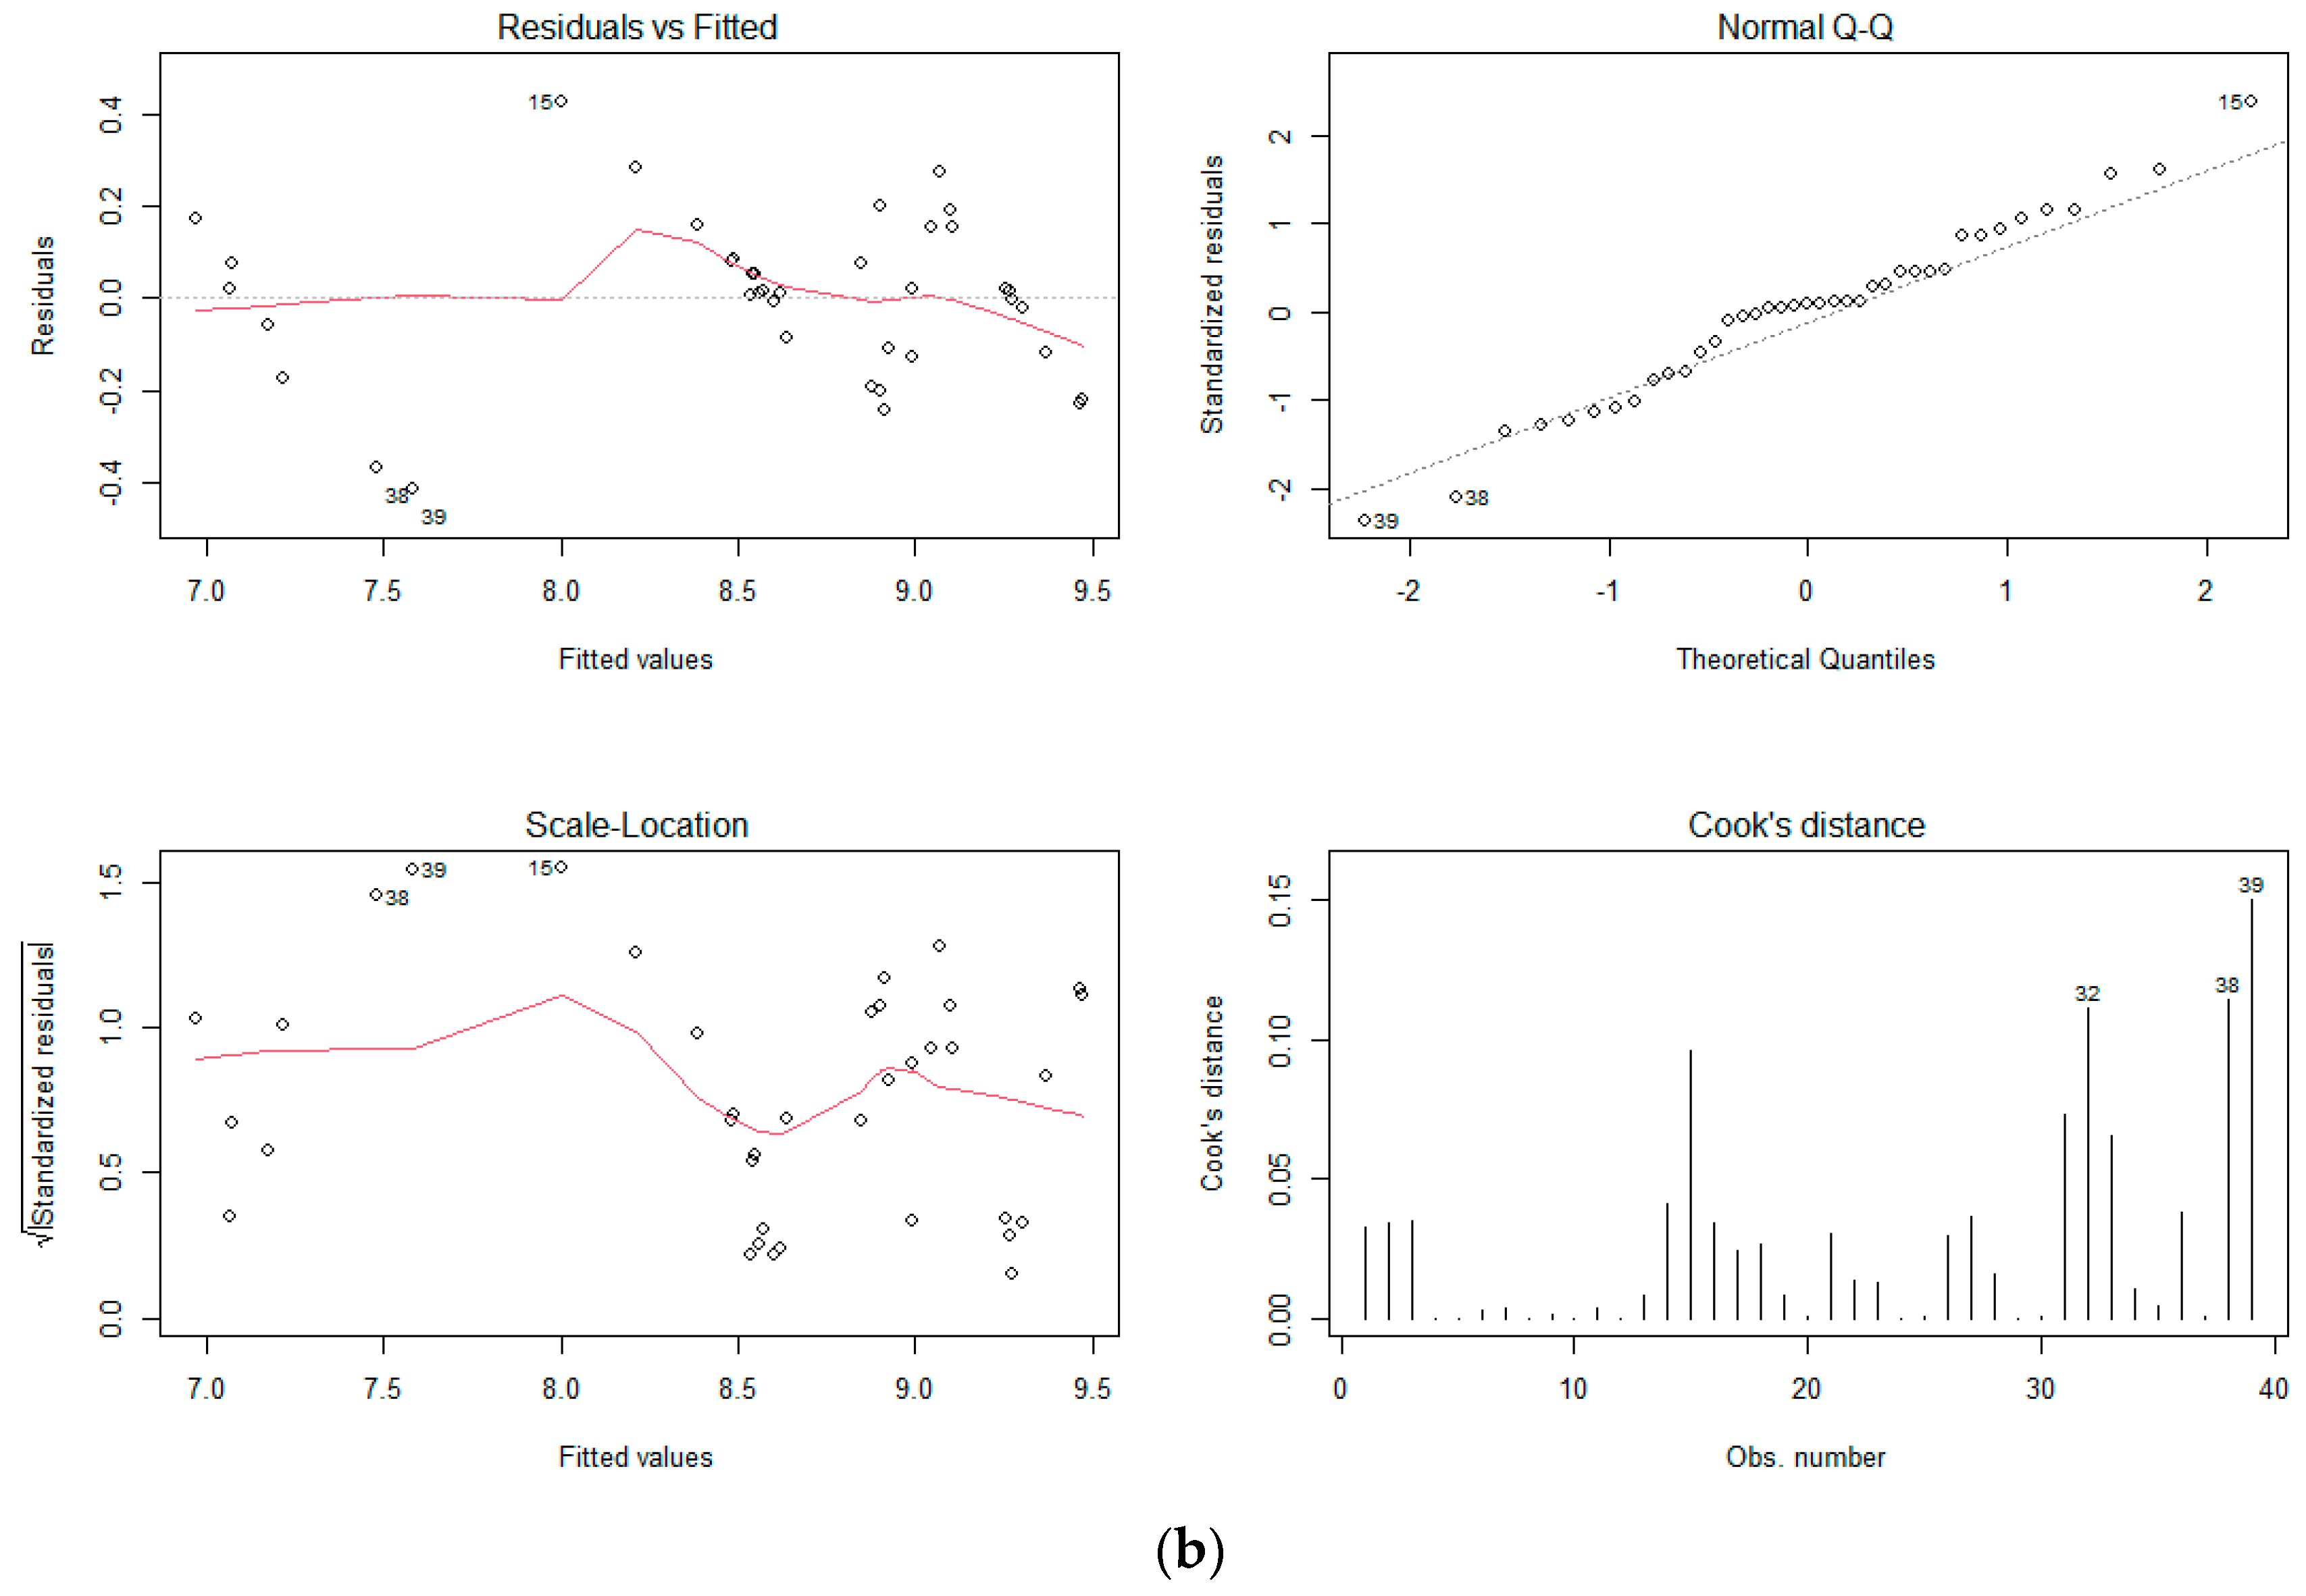
4.3. Robustness Test

In order to eliminate the impacts of countries and time on the results, we introduce the two-way fixed effect model to do the robustness tests. We will check the correlations between the robot and carbon emissions from both the directions of aggregation and density of robots. The regression model equations are as follows:
LNYct = a0 + a1 × LNrobotsct + a2 × controlsct + uc + vt + εct
LNYct = b0 + b1 × LNROBOTDct + b2 × controlsct + uc + vt + εct
where Yct is the observed variables of CO2 emissions in country c in year t. In order to avoid heteroscedasticity problems, we take the logarithmic form of robots installation to replace the total value. controlsct are the control variables—i.e., economic growth, employment rate, industrial structure, and energy consumption structure—which may have some impacts on the experimental results. uc and vt are country c time t fixed effects.
The results presented in Table 4 reveal that both of the robot installations and robot density can have strong significant and positive effects on the carbon emissions, and this supports the above verification results directly.

4.4. Endogeneity: IV Estimation

In order to exclude the influence of the characteristics of the selected samples on the robot installation, we introduce the instrument variable (IV)—which was calculated by the number of world installation robots minus that of each country—into the model by using the 2SLS method. The regression model equation is as follows:
Yct = c0 + c1 × LNIV + c2 × controlsct + uc + vt + εct.
From the results presented in Table 5, we could find that the correlation between IV and robots is strongly significant and negative in the first stage, and this can be explained by the fact that the adoption of robots among the world is competitive. In the second stage, we once again proved that the robots could have positive effects on the carbon emissions, and this also supports the above verification results.

5. Conclusions

The investment of a large number of robots in industries is accompanied by the increase in power consumption, and the destruction dealt by power generation energy to the environment has simultaneously attracted more and more social attention. There is no doubt that the combustion of fossil fuels, including oil, natural gas, and coal, can emit a lot of GHG. This makes it meaningful to study the relationships between the application of robots and carbon dioxide emissions with a view towards protecting climate quality. Owing to the fact that robots are the dispensable part of the automation manufacturing industries, this paper verifies the impacts of robots on carbon emissions from the perspectives of robot installations and robot density. First, the main finding of our study shows that robot adoptions can have strongly significant positive impacts on the total volume of carbon emissions in China and Japan, and these positive effects also appear in all three economics. Thus, the application of robots is a stimulus on carbon emissions. Moreover, the verification results also indicate that the current impacts of industrial intelligence on carbon emissions are dominated by driving effects, and the driving effects will be more significant with higher robot density. Last but not least, the energy and industry structures may interfere with the carbon emissions results. The energy consumption in China is dominated by coal, and greater proportions of oil and natural gas are expended in the USA and Japan. Considering that industrial production requires electricity, the coal resources or fossil fuels can be replaced by renewable energy. Alternatively, we can make efforts to change the energy structures to achieve carbon emission reduction targets. The industry structure is also a critical factor with respect to carbon emissions in China, and the secondary industry also accounts for a large proportion. This paper has certain reference value, because the researching objects are powerful economic and industrial systems, and their environmental and industrial strategies can affect the world’s climate improvement. Hence, some suggestions are proposed based on the study results. On one hand, governments should guide industrial investment to balance industrial structure when they adopt robots to develop industrial intelligence. On the other hand, it is also necessary to adjust the energy structure to promote environmental development while developing the economy and promoting industrial development.
Nevertheless, there are some limitations in our research. For one thing, this paper verifies the significant positive correlations between robot adoption and carbon emissions, but whether improving industrial manufacturing processes can increase production efficiency to reduce carbon emissions is not taken into account. For another, although it has been verified that the energy structures will have some impacts on carbon emissions, whether renewable and clean energy can ensure economic growth while improving environmental quality is unclear. We can further investigate these problems and clarify the transmission mechanisms between industrial intelligence and climate change.

Author Contributions

Conceptualization, X.Z.; data curation, methodology and software, H.Z.; writing—original draft preparation, H.Z.; writing—review and editing, H.Z. and X.Z.; project administration, X.Z.; funding acquisition, X.Z. All authors have read and agreed to the published version of the manuscript.

Funding

This research was funded by the Special Research Fund of China-ASEAN Collaborative Innovation Center for Regional Development Co-constructed by the Province and Ministry and Development Program of the Ministry of Education for Changjiang Scholars and Innovative Teams: CWZD201510; Key Research Base of Humanities and Social Sciences in Guangxi Universities “Guangxi Development Research Strategy Institute”: 2022GDSIYB16.

Institutional Review Board Statement

Not applicable.

Informed Consent Statement

Not applicable.

Data Availability Statement

Not applicable.

Conflicts of Interest

The authors declare no conflict of interest.

References

  1. Yang, H.; Shahzadi, I.; Hussain, M. USA carbon neutrality target: Evaluating the role of environmentally adjusted multifactor productivity growth in limiting carbon emissions. J. Environ. Manag. 2021, 298, 113385. [Google Scholar] [CrossRef]
  2. Dai, H.-C.; Zhang, H.-B.; Wang, W.-T. The impacts of U.S. withdrawal from the Paris Agreement on the carbon emission space and mitigation cost of China, EU, and Japan under the constraints of the global carbon emission space. Adv. Clim. Chang. Res. 2017, 8, 226–234. [Google Scholar] [CrossRef]
  3. Nguyen, D.K.; Huynh, T.L.D.; Nasir, M.A. Carbon emissions determinants and forecasting: Evidence from G6 countries. J. Environ. Manag. 2021, 285, 111988. [Google Scholar] [CrossRef] [PubMed]
  4. An, Y.; Zhou, D.; Yu, J.; Shi, X.; Wang, Q. Carbon emission reduction characteristics for China’s manufacturing firms: Implications for formulating carbon policies. J. Environ. Manag. 2021, 284, 112055. [Google Scholar] [CrossRef]
  5. Dou, Y.; Zhao, J.; Malik, M.N.; Dong, K. Assessing the impact of trade openness on CO2 emissions: Evidence from China-Japan-ROK FTA countries. J. Environ. Manag. 2021, 296, 113241. [Google Scholar] [CrossRef] [PubMed]
  6. Rampersad, G. Robot will take your job: Innovation for an era of artificial intelligence. J. Bus. Res. 2020, 116, 68–74. [Google Scholar] [CrossRef]
  7. Guerry, M.; Bieller, S.; Mueller, C.; Kraus, W. IFR Press Conference 24th September 2020 Frankfurt. International Federation of Robotics, IFR, (September). 2020. Available online: https://ifr.org/ifr-press-releases/news/record-2.7-million-robots-work-in-factories-around-the-globe (accessed on 5 October 2021).
  8. Marina, B.; Bieller, S.; Mueller, C.; Kraus, W.; Susanne, B. ‘World Robotics 2022’. IFR. September 2022. Available online: https://ifr.org (accessed on 30 October 2022).
  9. Guerry, M.; Bieller, S.; Mueller, C.; Kraus, W.; Susanne, B. ‘World Robotics 2021’. IFR. October 2021. Available online: https://ifr.org (accessed on 30 October 2022).
  10. Lin, B.; Wu, W.; Song, M. Industry 4.0: Driving factors and impacts on firm’s performance: An empirical study on China’s manufacturing industry. Ann. Oper. Res. 2019, 1–21. [Google Scholar] [CrossRef]
  11. Dekle, R. Robots and industrial labor: Evidence from Japan. J. Jpn. Int. Econ. 2020, 58, 101108. [Google Scholar] [CrossRef]
  12. Wu, P.; Song, Y.; Zhu, J.; Chang, R. Analyzing the influence factors of the carbon emissions from China’s building and construction industry from 2000 to 2015. J. Clean. Prod. 2019, 221, 552–566. [Google Scholar] [CrossRef]
  13. Li, Z.; Sun, L.; Geng, Y.; Dong, H.; Ren, J.; Liu, Z.; Tian, X.; Yabar, H.; Higano, Y. Examining industrial structure changes and corresponding carbon emission reduction effect by combining input-output analysis and social network analysis: A comparison study of China and Japan. J. Clean. Prod. 2017, 162, 61–70. [Google Scholar] [CrossRef] [Green Version]
  14. Yang, T.; Wang, Q. The nonlinear effect of population aging on carbon emission-Empirical analysis of ten selected provinces in China. Sci. Total. Environ. 2020, 740, 140057. [Google Scholar] [CrossRef]
  15. Jung, J.H.; Lim, D.-G. Industrial robots, employment growth, and labor cost: A simultaneous equation analysis. Technol. Forecast. Soc. Chang. 2020, 159, 120202. [Google Scholar] [CrossRef]
  16. Fu, X.; Bao, Q.; Xie, H.; Fu, X. Diffusion of industrial robotics and inclusive growth: Labour market evidence from cross country data. J. Bus. Res. 2021, 122, 670–684. [Google Scholar] [CrossRef]
  17. Cette, G.; Devillard, A.; Spiezia, V. The contribution of robots to productivity growth in 30 OECD countries over 1975–2019. Econ. Lett. 2021, 200, 109762. [Google Scholar] [CrossRef]
  18. Schmidpeter, B.; Winter-Ebmer, R. Automation, unemployment, and the role of labor market training. Eur. Econ. Rev. 2021, 137, 103808. [Google Scholar] [CrossRef]
  19. Graetz, G.; Michaels, G. ‘Robots at Work’. Rev. Econ. Stat. 2018, 100, 753–768. [Google Scholar] [CrossRef] [Green Version]
  20. Cao, R.; Huang, G.; Chen, J.; Li, Y. A fractional multi-stage simulation-optimization energy model for carbon emission management of urban agglomeration. Sci. Total. Environ. 2021, 774, 144963. [Google Scholar] [CrossRef]
  21. Zheng, X.; Wang, R.; Du, Q. How does industrial restructuring influence carbon emissions: City-level evidence from China. J. Environ. Manag. 2020, 276, 111093. [Google Scholar] [CrossRef]
  22. Zhang, M.; Yang, Z.; Liu, L.; Zhou, D. Impact of renewable energy investment on carbon emissions in China—An empirical study using a nonparametric additive regression model. Sci. Total. Environ. 2021, 785, 147109. [Google Scholar] [CrossRef]
  23. Li, J.; Li, S. Energy investment, economic growth and carbon emissions in China—Empirical analysis based on spatial Durbin model. Energy Policy 2020, 140, 111425. [Google Scholar] [CrossRef]
  24. Xie, Z.; Wu, R.; Wang, S. How technological progress affects the carbon emission efficiency? Evidence from national panel quantile regression. J. Clean. Prod. 2021, 307, 127133. [Google Scholar] [CrossRef]
  25. Acheampong, A.O.; Amponsah, M.; Boateng, E. Does financial development mitigate carbon emissions? Evidence from heterogeneous financial economies. Energy Econ. 2020, 88, 104768. [Google Scholar] [CrossRef]
  26. Lan, J.; Malik, A.; Lenzen, M.; McBain, D.; Kanemoto, K. A structural decomposition analysis of global energy footprints. Appl. Energy 2016, 163, 436–451. [Google Scholar] [CrossRef]
  27. Fan, H.; Hu, Y.; Tang, L. Labor costs and the adoption of robots in China. J. Econ. Behav. Organ. 2021, 186, 608–631. [Google Scholar] [CrossRef]
  28. Ballestar, M.T.; Díaz-Chao, Á.; Sainz, J.; Torrent-Sellens, J. Knowledge, robots and productivity in SMEs: Explaining the second digital wave. J. Bus. Res. 2020, 108, 119–131. [Google Scholar] [CrossRef]
  29. Acemoglu, D.; Restrepo, P. Robots and Jobs: Evidence from US Labor Markets. J. Political Econ. 2020, 128, 2188–2244. [Google Scholar] [CrossRef] [Green Version]
  30. Chen, J.; Shi, Q.; Shen, L.; Huang, Y.; Wu, Y. What makes the difference in construction carbon emissions between China and USA? Sustain. Cities Soc. 2019, 44, 604–613. [Google Scholar] [CrossRef]
  31. Davis, C. Robots at work. Lancet 2006, 368, 358. [Google Scholar] [CrossRef]
  32. Jin, M.; Tang, R.; Ji, Y.; Liu, F.; Gao, L.; Huisingh, D. Impact of advanced manufacturing on sustainability: An overview of the special volume on advanced manufacturing for sustainability and low fossil carbon emissions. J. Clean. Prod. 2017, 161, 69–74. [Google Scholar] [CrossRef]
  33. Sequeira, T.N.; Garrido, S.; Santos, M. Robots are not always bad for employment and wages. Int. Econ. 2020, 167, 108–119. [Google Scholar] [CrossRef]
  34. Li, J.; Cheng, Z. Study on total-factor carbon emission efficiency of China’s manufacturing industry when considering technology heterogeneity. J. Clean. Prod. 2020, 260, 121021. [Google Scholar] [CrossRef]
  35. Jiang, W.; Sun, Y. Which is the more important factor of carbon emission, coal consumption or industrial structure? Energy Policy 2023, 176, 113508. [Google Scholar] [CrossRef]
Figure 1. Robot installations from 2006 to 2021: World, the USA, China, Japan, and others. (Source: IFR, https://www.ifre.com, accessed on 20 October 2021).
Sustainability 15 06316 g001
Figure 2. Research flow chart.
Sustainability 15 06316 g002
Figure 3. Proportion of coal consumption in total energy from 2006 to 2021: the USA, China, and Japan. (Source: EIA, https://www.eia.gov, accessed on 20 October 2021).
Sustainability 15 06316 g003
Figure 4. (a) Normality graph of variables regarding robot installations. (b) Normality graph of variables regarding robot installation density.
Sustainability 15 06316 g004aSustainability 15 06316 g004b
Figure 5. Robot installation density (units per thousand manufacturing employees) from 2006 to 2021: the USA, China, and Japan. (Author’s calculation).
Sustainability 15 06316 g005
Table 1. Descriptive statistics (2006–2021).
VariableDefinitionSourceObs.MeanObs.MeanObs.Mean
USAChinaJapan
RobotsIndustrial robot stock (unit)IFR1625,1011677,0191635,161
LNrobotsLog(robot installation)IFR1610.061610.571610.41
LNCELog(carbon emissions)EIA168.59169.18167.09
EMPTotal employment rate (%)World Bank1658.981666.551658.10
INDSSecondary industry share (%)World Bank1619.181643.061628.31
COALPCoal consumption rate (%)EIA1617.251667.251623.44
GDPPCGDP per capita (Current US $)World Bank1655,3301669471640,487
GDPPGGDP per capita growth rate (%)World Bank161.02167.78160.43
Robot DensityRobots per thousand people IFR and ILO161.53160.53163.27
CO2 emissionsCO2 (million metric tons)EIA165356.26169688.84161199.89
Table 2. Carbon emissions and industrial robot installations (2006–2021).
LNCE
USAChinaJapan
LNrobots0.0100.185 ***0.156 **
(0.022)(0.030)(0.056)
EMP0.014 *** −0.041 −0.058 ***
(0.004)(0.024)(0.016)
COALP1.342 ***3.856 *** −0.501
(0.317)(1.149)(0.699)
GDPPG0.004 *−0.002−0.001
(0.002)(0.013)(0.005)
INDS−0.001−0.006−0.006
(0.012)(0.020)(0.016)
Notes: Estimated coefficients are accompanied by robust standard errors in parentheses. Asterisks denote statistical significance: * p < 0.1; ** p < 0.05; *** p < 0.01 indicate statistical significance at 10%, 5%, and 1% levels, respectively.
Table 3. Carbon emissions and industrial robot installation density (2006–2021).
LCEN
USAChinaJapan
LNROBOTD0.0110.204 ***0.142 *
(0.023)(0.032)(0.065)
EMP0.015 ***−0.041−0.056 **
(0.004)(0.023)(0.018)
COALP1.353 ***4.428 ***−0.706
(0.316)(1.147)(0.805)
GDPPG0.004 *0.001−0.001
(0.002)(0.013)(0.006)
INDS−0.001 −0.008−0.002
(0.012)(0.019)(0.017)
Notes: Estimated coefficients are accompanied by robust standard errors in parentheses. Asterisks denote statistical significance: * p < 0.1; ** p < 0.05; *** p < 0.01 indicate statistical significance at 10%, 5%, and 1% levels, respectively.
Table 4. CO2 emissions and industrial robot installations and robot density (2006–2021).
LNCE
LNrobots0.269 ***
(0.053)
LNROBOTD 0.271 ***
(0.059)
EMP−0.012 −0.002
(0.017)(0.018)
COALP0.6610.227
(0.646)(0.665)
GDPPG0.0160.013
(0.013)(0.014)
INDS0.025 0.030
(0.017)(0.018)
Notes: Estimated coefficients are accompanied by robust standard errors in parentheses. Asterisks denote statistical significance: *** p < 0.01 indicates statistical significance at 1% level.
Table 5. Endogenous test: CO2 emissions and industrial robot installations in other countries.
First StageSecond Stage
LNrobotLNCE
IV−3.584 ***
(0.657)
LNrobot 1486.975 ***
(164.107)
EMP0.02473.264
(0.030)(50.592)
COALP0.2605100.067 ***
(0.889)(1746.478)
GDPPG−0.060 **−100.197 **
(0.023)(42.995)
INDS−0.0080.362
(0.022)(50.886)
Individual Fixed EffectsYesYes
Time Fixed EffectsYesYes
Notes: Estimated coefficients are accompanied by robust standard errors in parentheses. Asterisks denote statistical significance: ** p < 0.05; *** p < 0.01 indicate statistical significance at 5%, and 1% levels, respectively.
Disclaimer/Publisher’s Note: The statements, opinions and data contained in all publications are solely those of the individual author(s) and contributor(s) and not of MDPI and/or the editor(s). MDPI and/or the editor(s) disclaim responsibility for any injury to people or property resulting from any ideas, methods, instructions or products referred to in the content.

