Article

Multinational Corporations and Technological Innovation Development of China’s High-Tech Industries: A Heterogeneity-Based Threshold Effect Analysis

1
College of Economics and Management, Shandong University of Science and Technology, Qingdao 266590, China
2
School of Economics and Management, Beijing Jiaotong University, Beijing 100044, China
*
Author to whom correspondence should be addressed.
Sustainability 2023, 15(9), 7089; https://doi.org/10.3390/su15097089
Submission received: 1 April 2023 / Revised: 18 April 2023 / Accepted: 20 April 2023 / Published: 23 April 2023

Abstract

:
Technological innovation of multinational corporations (MNC) is an important engine to drive the world’s scientific and technological progress, which plays an important role in the sustainable development of global innovation. With China’s high-tech industry from 2009 to 2020 as the research sample, this study empirically analyzes the impact of MNCs’ two-stage innovation on the innovation efficiency of China’s high-tech industry through the perspective of base regression, threshold effect, and regional heterogeneity. It was found that MNC research and development (R&D) efficiency and achievement transformation efficiency have a positive impact on the innovation efficiency of high-tech industries in China, with nonlinear features and regional heterogeneity. This study provides an empirical basis for the efficient use of MNC’s innovative resources and the sustainable development of China’s high-tech industry.

1. Introduction

On 1 April 1985, the Chinese Patent Law came into force. In that year, overseas MNCs applied for a total of 6925 invention patents at the World Intellectual Property Organization (WIPO) and 4493 invention patents at the China Intellectual Property Office, with the number of patent applications in China accounting for 64.88% of the number of international patent applications. Thereafter, MNCs’ patent applications in China have largely maintained a continuous growth trend. As of 31 December 2021, MNCs have filed a total of 2,387,029 invention patents in China, with a CAGR of 10.39%. The cumulative number of invention patents filed at WIPO is 38,809,636, representing a CAGR of 9.50%. MNCs’ patent applications in China are growing faster than international patents. On the one hand, this indicates that MNCs recognize China’s IP innovation environment, and on the other hand, it indicates that MNCs are increasingly inclined to establish overseas R&D bases and conduct innovation activities in China.
MNCs are not only an important engine for promoting the sustainable development of innovation and a key force for global scientific and technological progress, but are also a major carrier of global innovation resources [1]. According to the theory of technological innovation and technology diffusion, MNCs can directly enrich China’s innovation resources by bringing the world’s advanced innovation concepts and management experience to China. The resulting competitive effect also prompts China to pay more attention to industrial front-end technology development, core technology research and development, and patented technology reserves, which have an important impact on China’s economy, technology, management, and institutions [2]. Meanwhile, China proposes to build a new development pattern with a major domestic circulation and a dual domestic and international circulation to promote each other. This means that the internal circulation is the dominant one, the external circulation is the empowering one, and the double circulation is the smooth one, which is the pattern of development and the characteristic of the future stage of the era. The important role of MNCs in promoting the sustainable development of innovation in China has been highlighted, which has put new demands on the direction of innovation utilization by MNCs.
High-tech industry is a national strategic emerging industry and a key layout area to promote the high-quality development of the country’s technology and economy. The innovation capability of high-tech industry is an important evaluation criterion to measure whether a country has international competitive advantages and can be among the ranks of strong intellectual property rights countries [3]. According to the endogenous growth theory, the innovation activities of MNCs in China inevitably have an impact on Chinese high-tech companies that can directly participate in the global innovation network of MNCs. Currently, research on the innovation efficiency of MNCs in China’s high-tech industry is mainly conducted from the perspective of international technology spillover. While international technology spillover is mainly measured by indicators such as MNC R&D investment [4], the number of MNC patents [5], and foreign direct investment [6], there are fewer studies that use MNC innovation efficiency as an entry point.
In order to make up for the shortcomings of existing studies, this study empirically investigates the impact of two-stage innovation of MNCs’ science and technology R&D and achievement transformation on the innovation efficiency of China’s high-tech industry based on the theoretical basis of technology innovation theory, technology diffusion theory, endogenous growth theory, and innovation value chain theory, with the aim of promoting the sustainable development of China’s innovation system. Moreover, whether the effect has non-linear and heterogeneous features is explored in depth to provide theoretical support for improving the innovation efficiency of high-tech industries in China. The main contributions of this paper are the following. (1) The innovation value chain is used as an entry point to divide the innovation process of MNCs into science and technology research and development stage and achievement transformation stage. It dynamically reveals the efficiency of resource allocation for MNC innovation and opens new horizons for MNC technology innovation research. (2) The mechanism of the role of MNC innovation on the innovation efficiency of China’s high-tech industry is systematically revealed through the perspective of base regression, threshold effect, and regional heterogeneity. Methods and tools for research on MNCs and China’s regional innovation development have been enriched to provide support and advice for China’s sustainable technological and economic development.
The remainder of the paper is organized as follows. Section 2 reviews the relevant literature, mainly describing studies related to high-tech industries and MNCs. Section 3 provides the study design, develops the empirical model, and sets the main variables. Section 4 presents empirical evidence to reveal the impact of the two-stage innovation of technological R&D and achievement transformation of MNCs on the innovation efficiency of high-tech industries in China through the perspective of base regression, threshold effects, and regional heterogeneity, as well as a robustness test. Section 5 provides a discussion based on the model results. Finally, conclusions and recommendations are provided in Section 6.

2. Literature Review

Currently, there are fewer studies on the impact of innovation efficiency of MNCs on high-tech industries, and the relevant studies mainly focus on the impact of innovation efficiency of high-tech industries, R&D investment of MNCs, and R&D investment of MNCs on regional innovation in China.

2.1. Innovation Efficiency of High-Tech Industries

Research on the efficiency of innovation in high-tech industries has focused on two aspects: the measurement of the efficiency of innovation and the influence factors of high-tech industries. In terms of innovation efficiency measures, scholars have mainly used the DEA model to measure the innovation efficiency of high-tech industries by constructing an input–output indicator system. Zhang (2019) divided the innovation process of China’s high-tech industries into upstream R&D and downstream commercialization processes and measured the efficiency of innovation in both stages using a network DEA model [7]. Deng (2020) measured the green R&D efficiency and green achievement transformation efficiency of high-tech industries using the DEA method in consideration of the environmental pollution in the innovation process of high-tech industries [8]. Lin (2021) measured the innovation efficiency of China’s high-tech industries from three perspectives, province, region, and industry, and found that the innovation efficiency of high-tech industries was highest in all eastern regions of China [9]. Ji (2022) used the DEA model to measure the innovation efficiency of China’s high-tech industries and carved the spatial clustering characteristics of innovation efficiency through Moran’s index and local indicators [10]. In terms of factors influencing innovation efficiency in high-tech industries, Xu (2019) found that human capital and industrial structure are beneficial in enhancing innovation performance of high-tech SMEs [11]. Deng (2019) argued that government R&D subsidies and intellectual property protection would have complementary effects on China’s pharmaceutical manufacturing industry [12]. Chen (2020) conducted an in-depth analysis of the factors influencing the innovation efficiency of high-tech industries by using a spatial econometric model and found that government support, the level of openness to the outside world, and industrial structure can have different degrees of influence on the innovation efficiency of high-tech industries [13]. Duan (2021) found that cross-country knowledge spillovers have a positive effect on the quality of innovation of China’s high-tech industries [14]. Yang (2022) confirmed that policy, economy, society, and technology are all important factors influencing the development of innovation in high-technology industries [15].

2.2. R&D Investment of MNCs

Research on MNCs has focused on the motivation, location choice, and organizational model of MNC R&D investment globalization. In terms of MNCs’ motives for globalizing R&D investment, Bas and Sierra (2002) summarized four types of MNCs’ motives for globalizing R&D, including technology tracking, home base development, home base expansion, and market seeking [16]. Dunning (2008) classified R&D globalization motives into four types, such as efficiency-seeking, market-seeking, resource-seeking, and strategic asset-seeking, based on the characteristics of MNCs’ foreign investments [17]. It has also been argued that in cases where the home country is the source of innovation and the host country has weak innovation capabilities, MNCs’ overseas R&D is influenced by the internationalization of production [18] and international R&D activities are undertaken to reduce production costs [19]. Related studies have shown that MNCs are increasingly diversifying the location of their R&D investments. The factors influencing location choice mainly include the market size [20], market potential [21], R&D cost [22], information and communication technology level [23], and intellectual property protection level [24] of the host country. Moreover, the policy environment of the host country has an impact on the location choice of overseas MNCs and can affect the innovation performance of their subsidiaries [25]. The restructuring of the organizational structure of R&D investments by MNCs facilitates the efficiency of their innovative R&D [26]. According to the resource allocation mode, MNC R&D globalization organizational models can be divided into three types of organizational models, such as the global center model, global specialization model, and global integration model [27]. According to the location of MNCs’ overseas R&D institutions, they are classified into organizational models such as center-periphery type, multi-regional competence center type, and global network organization type [28]. There are five R&D organization models, including silo-centered, open-centered, multi-centered decentralized, center-edge, and network-collaborative, based on geographical characteristics and spatial relevance [29].

2.3. Impact of MNCs on Innovation Efficiency in Host Countries

The paths of MNC spillover effects mainly include the demonstration effect [30], competition effect [31], personnel mobility effect [32], and association effect [33]. With regard to the study of the impact of MNCs on the innovation efficiency of host countries, scholars have proposed the following main ideas. The first is that R&D by MNCs has a positive effect on the innovation efficiency of the host country. Ghebrihiwet (2019) found that technological innovation by MNCs can be effective in promoting regional knowledge flows and improving the technological innovation environment. This creates an incentive for local firms to increase their R&D investments, thus positively influencing the host country innovation system [34]. Gouranga (2020) concluded that MNCs can contribute to the optimization of the structure and function of the host country’s innovation system through knowledge spillovers [35]. It has also been argued that there is a significant positive impact of R&D investment by MNCs on both innovation capacity and technological progress in host countries [36,37,38]. The second is that research and development by MNCs has a negative impact on regional innovation capacity. In global competition, MNCs enjoy strong market competitiveness and technological advantage. According to the monopoly dominance theory, direct R&D investments by MNCs in host countries have a “crowding-out effect” on local innovation, squeezing out the market share of local firms, which has a negative spillover effect on regional innovation in host countries [39,40]. The third is the negligible role of research and development by MNCs in regional innovation. Lau et al. (2015) argued that MNCs do not have spillover effects on host country innovation [41]. Tzeng (2018) concluded that local firms are not able to absorb the spillover effects from MNCs [42].
In summary, there have been few studies on the impact of MNC innovation on the innovation efficiency of high-tech industries in China. Few studies have analyzed the dynamic relationship between MNC innovation and the innovation efficiency of China’s high-tech industries from the perspective of non-linearity and regional heterogeneity, and there is a particular lack of empirical studies on the spillover effects of MNC innovation value chains on the innovation efficiency of China’s high-tech industries. Based on this, this study divides the innovation activities of MNCs into two phases: technological R&D and transformation achievements, from the perspective of the innovation value chain. We empirically analyze the impact of the nonlinear dynamics of two-stage innovation by MNCs on the innovation efficiency of China’s high-tech industries. It is expected to serve as a reference for the implementation of China’s innovation-driven development strategy and intellectual property rights strategy, as well as for the high-quality development of technological innovation in countries around the world.

3. Study Design

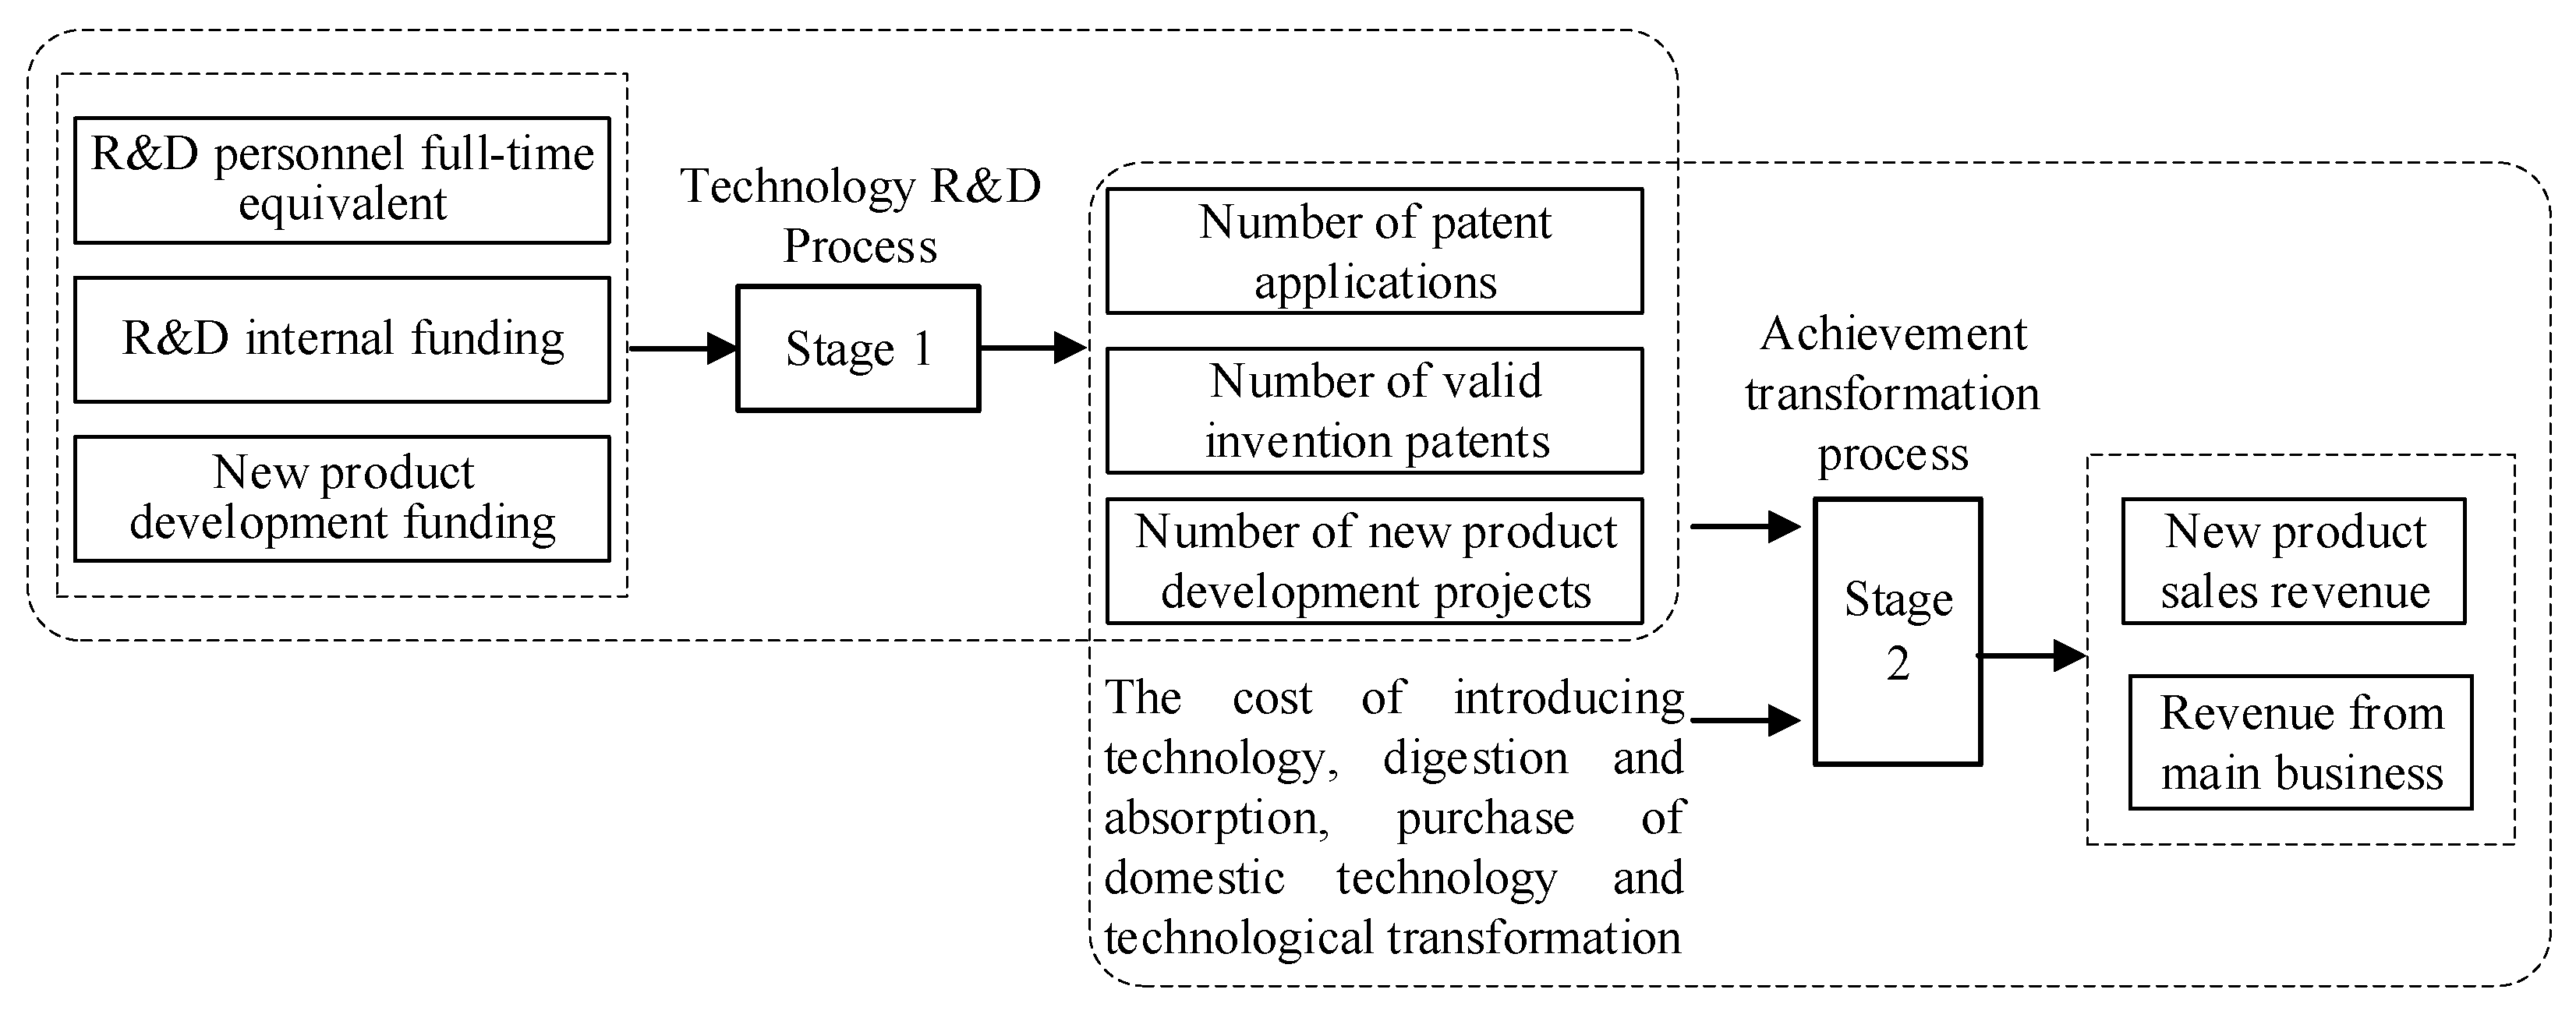
3.1. Mechanism Analysis

From the theory of innovation value chain, it is clear that innovation is a value chain transfer process, which passes from the input of innovation factors to the output of innovation results, and finally to the commercialization and marketing of the R&D achievements. The innovation activities of MNCs can be divided into two phases, namely, the R&D phase, which is the transformation from the input of R&D resources to the output of knowledge, information, and technology, and the transformation from the input of technology to the output of products, production, and markets. At the stage of technological R&D, China’s high-tech industry acquires the spillover technology of MNCs through R&D resource sharing, personnel mobility, and dry learning, and absorbs and transforms it to form the innovation spillover diffusion effect, improving its own R&D level and innovation efficiency. The absorptive capacity of high-tech industries is key in this process. The stronger the absorption and digestion capacity of high-tech industries, the better the technological spillover effect of MNCs’ technological research and development. In turn, a large technology gap leads to greater difficulties in absorbing and higher costs of imitation innovation, which weakens the effect of spillover from technological R&D by MNCs to high-tech industries. The production, sales, and operational activities of MNCs in China are conducive to the optimal allocation of innovation resources of China’s high-tech industries during the transition phase of achievements. China’s high-tech industries can gain advanced international production technology and management experience, thereby contributing to the efficiency of their own innovation. However, the “crowding-out effect” caused by the innovative products of MNCs, which may crowd out the market share of China’s high-tech industries, may inhibit the upgrading effect of MNC innovations. Based on this, the following hypotheses are proposed in this study.
Hypothesis 1: 
MNC innovation has an impact on the innovation efficiency of China’s high-tech industry.
Hypothesis 2: 
The impact of MNC innovation on the innovation efficiency of China’s high-tech industry has linear characteristics.
Hypothesis 3: 
The impact of MNC innovation on the innovation efficiency of China’s high-tech industry has non-linear characteristics.

3.2. Model Setting

3.2.1. Baseline Regression Model

The innovation efficiency of China’s high-tech industries (IEC) was selected as the explanatory variable, and R&D efficiency of MNCs (REM) and transformation efficiency of MNCs’ achievements (TEM) as the core explanatory variables. A benchmark regression model for the impact of MNC innovation on the innovation efficiency of China’s high-tech industries was constructed, as shown in Model 1 and Model 2. Where i is the region, t is the time, X is the set of control variables, α is the constant term, and ε i t is the error term.
Model 1:
I E C i t = α + β R E M i t + γ X i t + ε i t
Model 2:
I E C i t = α + β T E M i t + γ X i t + ε i t

3.2.2. Threshold Regression Model

This study uses the panel threshold model proposed by Hansen [43] to examine the non-linear relationship between MNC innovation and the innovation efficiency of China’s high technology industries. The essence of a panel threshold model is to find one or more thresholds for the explanatory variables, divide them into intervals based on the thresholds, and observe changes in the relationship between the explanatory and non-explained variables within the intervals. The form of the one-panel threshold regression model is as follows.
(1)
Single threshold panel model.
Y i t = α + β 1 X i t × I ( Z i t δ ) + β 2 X i t × I ( Z i t > δ ) + γ M i t + ε i t
(2)
Double threshold panel model.
Y i t = α + β 1 X i t × I ( Z i t δ 1 ) + β 2 X i t × I ( δ 1 < Z i t δ 2 ) + β 3 X i t × I ( Z i t > δ 2 ) + γ M i t + ε i t
(3)
Triple threshold panel model.
Y i t = α + β 1 X i t × I ( Z i t δ 1 ) + β 2 X i t × I ( δ 1 < Z i t δ 2 ) + β 3 X i t × I ( δ 2 < Z i t δ 3 ) + β 4 X i t × I ( Z i t > δ 3 ) + γ M i t + ε i t
where Z is the threshold variable, is the threshold value, and I (*) is the indicator function. I is 1 when the condition in the brackets is satisfied and 0 when it is not. From the Hansen setting, it is possible to estimate the parameters of the model and derive the sum of the residuals of the squares given a threshold value. The closer to the true value, the smaller the sum of the residuals of the squares. Therefore, the true threshold can be found by setting different thresholds. Hansen used the spacer method to obtain the true value.

3.3. Indicator Selection and Data Sources

(1)
Explanatory variables
IEC is measured by the ultra-efficient SBM model, with reference to Wang (2022) [44]. Based on provincial input–output data, the full-time equivalent R&D personnel, internal R&D funding, and new product development funding of domestic and state-owned Chinese enterprises were selected as input indicators. The number of patent applications and valid inventions, as well as new product sales revenue, are used as output indicators to measure the innovation efficiency of high-tech industries in different Chinese provinces [45].
(2)
Core explanatory variables
The explanatory variables are REM and TEM, which are measured using the ultra-efficient network SBM model, with reference to Liu (2022) [46]. As shown in Figure 1, the number of new product development projects, the number of patent applications, and the number of valid invention patents and other scientific research results are generated by investing initial resources such as R&D personnel full-time equivalents, internal R&D funding, and new product development funding at the stage of technological R&D, as well as intermediate outputs [47]. In addition to the intermediate output, expenditure on technology introduction, digestion and absorption, purchase of in-country technology, and technology transformation are also inputs in the transformation achievement stage [48]. These inputs generate productivity through market mechanisms, resulting in product benefits and economic efficiency. Therefore, new product sales revenue and main operating income were selected as output indicators for the achievement transformation phase. R&D spending is a flow indicator that takes time to accumulate in order to have an impact, so the relevant capital investment indicator is expressed in terms of shares. Internal R&D funding, new product development funding, and non-R&D input metrics were first deflated to 2009 price levels based on the R&D price index, and then a 15% depreciation rate was selected to calculate the calendar year stock levels based on the perpetual inventory method. For the second-stage output measure, revenue from sales of new products and revenue from major operations, the ex-factory price index for industrial products was used to convert to constant 2009 price levels. The efficiency of R&D in science and technology and the efficiency of the transformation of achievements by MNCs in China are both the core explanatory variables and the threshold variables in this study.
(3)
Control variables
A review of the literature shows that the efficiency of innovation in high-tech industries in China is also affected by other factors, so these variables need to be controlled. In this study, the following provincial-level control variables are introduced into the econometric model. (1) The rating of economic development (RED), which reflects the state and potential of a region’s economic development. GDP per capita is used as a proxy variable to measure the rating of economic development [49]. (2) Human capital (HC), which can affect the efficiency of technological innovation both directly and indirectly by affecting the ability of innovation agents to learn, absorb, and digest new technologies externally. HC is expressed as the ratio of the number of researchers to the number of employed people [50]. (3) Government support (GS); the higher the government support, the more conducive the enthusiasm is of innovation subjects to carry out innovation activities. In this study, the proportion of government funding in R&D grants is used to indicate the level of government support [51]. (4) Industrial structure (IS), where innovation activity is dependent on industrial agglomeration. IS is measured as the share of tertiary sector output in regional GDP. (5) Opening up to the outside world (OP), which is conducive to improving the efficiency of external exchanges and accumulation of resource factors, has a significant impact on science and technology innovation. This study uses the ratio of total exports and imports to regional GDP to express OP [52]. (6) Intellectual property protection (IPP), which is an effective guarantee against malicious infringement of knowledge and technology, contributes to the innovation-driven effect. This study uses the share of technology market transactions to regional GDP to express IPP [53].
(4)
Sample selection and data sources
The measurement of innovation efficiency of China’s high-tech industries and MNC innovation is based on provincial multi-input and multi-output data, and 30 provinces in China, excluding Tibet, are selected for the study considering the completeness and availability of data. Meanwhile, in order to examine regional heterogeneity, the 30 provinces in the sample are divided into three regions, eastern, central and western, by combining the division method of the China Bureau of Statistics. The eastern region specifically includes Beijing, Fujian, Guangdong, Hainan, Hebei, Jiangsu, Liaoning, Shandong, Shanghai, Tianjin, and Zhejiang. The central region includes Anhui, Henan, Heilongjiang, Hubei, Hunan, Jilin, Jiangxi, and Shanxi provinces. The western region comprises Guangxi, Guizhou, Shaanxi, Sichuan, Yunnan, Chongqing, Inner Mongolia, Gansu, Qinghai, Ningxia, and Xinjiang. The data was obtained from the “China Statistical Yearbook”, the “China High Technology Industry Statistical Yearbook”, the “China Industrial Statistical Yearbook”, and the statistical yearbooks of various provinces. The period 2009–2020 was chosen as the research period for this paper as the statistical method of the “China High Technology Statistical Yearbook” changed after 2008.

4. Empirical Results

4.1. Descriptive Statistics

This study used panel data for 30 Chinese provinces and cities from 2009 to 2020 for empirical analysis, excluding Hong Kong, Macao, Taiwan, and Tibet. In order to obtain a clearer picture of the distribution of the data for each variable, all variables were subjected to descriptive statistics, as shown in Table 1.

4.2. Measurement of Innovation Efficiency of China’s High-Tech Industries

The results of the measurement of the innovation efficiency of China’s high-tech industries from 2009 to 2020 are shown in Table 2. Compared with 2009, the innovative efficiency gains in 2020 are 34.4 percent in the eastern region, 27.7 percent in the central region, 11.5 percent in the western region, and 27.1 percent for the country as a whole, which is a more significant efficiency gain.

4.3. Correlation Test

The presence of two or more highly correlated explanatory variables in a panel regression model can lead to inaccurate parameter estimates and affect the regression effect, so this section performs Pearson’s correlation test on the explanatory variables. The results of the tests are shown in Table 3.
As can be seen from Table 3, the absolute values of the correlation coefficients of the core explanatory variables, the R&D efficiency of MNCs, and the efficiency of achievement transformation are less than 0.5, indicating that their correlations are weak and there is no multicollinearity problem. Among the control variables, only the result between government support and industry structure is greater than 0.5, while all other correlation coefficients are less than 0.5 in absolute value. To ensure the accuracy of the regression results, the variance inflation factor (VIF) continued to be used to continue the multicollinearity test on the explanatory variables, and the test results are shown in Table 4. The VIF values of both the core explanatory and control variables are less than 10, which means that there is no multicollinearity problem among the explanatory variables.

4.4. Baseline Regression

After the F-test and Hausman test, two models with R&D efficiency and achievement transformation efficiency of MNCs as core explanatory variables were selected as fixed effect models for empirical analysis, and the regression results are presented in Table 5.
As can be seen from Table 5, models (1a) and (2a) test the direct effect of MNC innovation on the innovation efficiency of China’s high-technology industry. It shows that the efficiency of technological R&D and the transformation efficiency of achievements of MNCs have a significant positive effect on the innovation efficiency of China’s high-tech industries, with estimated coefficients of 0.881 and 0.354, respectively, and are significant at least at the five percent level. After adding a series of control variables, the results are shown in models (1b) and (2b). It can be seen that the estimated impact of MNC innovation on the innovation efficiency of high-tech industries in China remains robust, with estimated coefficients of 0.352 and 0.154, respectively, and is significant at least at the five percent level. Only the values are reduced compared to before the inclusion of the control variables. The effect of R&D efficiency of MNCs on the innovation efficiency of high-tech industries in China is more pronounced with or without the inclusion of control variables. The main reason for this is that the spillover of technology from the R&D of MNCs is more likely to stimulate the learning and imitation effect of China’s high-tech industry, thus promoting the rapid upgrading of the level of technology. The transformation of the achievements of MNCs has somewhat compressed the development space of the local high-tech industry market, resulting in a lower promotion effect than in the R&D phase of science and technology. Based on the above results, the conclusion of Hypothesis 1 is valid.

4.5. Panel Threshold Model Regression

(1)
Threshold effect test and threshold value estimation
In this study, panel threshold estimation is conducted by using Hansen’s “self-help method” to obtain the p-value corresponding to the test statistic by repeated sampling 500 times. We test whether there is a threshold effect of MNCs’ efficiency in R&D and conversion on China’s high-tech industry. As shown in Table 6, the R&D efficiency of MNCs and the efficiency of achievement transformation pass a single threshold significance test with threshold values of 0.429 and 0.111, respectively.
(2)
Results analysis of the threshold regression
We empirically analyze threshold models for R&D efficiency and outcome transformation efficiency of MNCs, respectively, and present the parameter estimation results in Table 7.
From the second column of Table 7, it can be seen that when the value of R&D efficiency of MNCs is below 0.429, it plays a positive role in the innovation efficiency of China’s high-tech industry, with an impact coefficient of 0.194, which is significantly positive. When the R&D efficiency of MNCs is greater than 0.429, the impact factor is 0.038, which still plays a role in boosting the innovation efficiency of China’s high-tech industries, but this role is weakened. It shows that when the R&D efficiency of MNCs is less than a certain level, it is beneficial for the innovation development of China’s high-tech industries, but as the R&D efficiency of MNCs continues to increase, the promotion effect is weakened instead. This is mainly because as R&D innovation efficiency increases in MNCs and high-tech industries, there is less room for technological innovation. It is difficult to find new areas to generate breakthrough innovation in the short term, and increased competitive pressure has undermined the spillover effect of MNCs on the innovation of China’s high-tech industries.
From the fourth column of Table 7, it can be seen that when the transformation efficiency achieved by MNCs is below 0.111, it has a positive impact on the innovation efficiency of China’s high-tech industry, with an impact coefficient of 0.102, which is significantly positive. When the transformation efficiency of MNCs is greater than 0.111, the impact coefficient is 0.038, which still has a facilitating effect on the innovation efficiency of high-tech industries, but the effect becomes weaker. It shows that when the transformation efficiency of MNC achievements is less than a certain level, it is favorable for the innovation efficiency of high-tech industries, but above this level, the promotion effect is weakened. There are limits to the impact of the transformation efficiency achieved by MNCs on the innovation efficiency of China’s high-tech industries. The main reason is that when the innovative products of MNCs enter the Chinese market, they activate the Chinese market dynamics and generate the “catfish effect”, which promotes high-tech enterprises to enhance technological innovation and transformation. However, the market has limited and restricted characteristics, and the saturation of the regional market weakens the influence of MNCs on the innovation efficiency of high-tech industries. Based on the above results, the conclusion of Hypothesis 3 is valid, and Hypothesis 2 is not.

4.6. Analysis of Regional Heterogeneity

4.6.1. Basic Regression Analysis of Regional Heterogeneity

China is a vast country with wide disparities in regional development, resulting in significant differences in economic, institutional, and innovation environments in different parts of the country. To more accurately measure the impact of MNC innovation on the innovation efficiency of high-tech industries in China, the study sample was divided into three regions, namely eastern, central, and western, for regional heterogeneity analysis. The results of the basic regression measures are shown in Table 8.
As can be seen from the estimation results in Table 8, the estimated coefficient of the R&D efficiency of MNCs on the innovation efficiency of high-tech industries in the eastern, central, and western regions is 0.345, 0.399, and 0.108, respectively, which has a significant positive effect. This boost had the most significant impact on high-tech industries in the central region, followed by the eastern region, and the smallest effect in the western region. The main reason is that the central region is in the phase of innovation-driven economic development, is more sensitive to innovative technology and management concepts brought by MNCs, and is more proactive in learning. The eastern region as a whole is in the process of moving from imitation innovation-driven to independent innovation-driven economic development mode, and is less sensitive than the central region to the overall demonstration effect of R&D innovation by MNCs. Compared with the eastern and central regions, the western region has a large gap in economic development level and human capital, and a limited capacity to absorb and learn. As a result, it is less affected by the R&D innovations of MNCs.
The transformation efficiency achieved by MNCs has contributed significantly to the innovation efficiency of high-tech industries in the eastern, central, and western regions, but the magnitude of the impact varies. From the viewpoint of the effect, the impact coefficient of the transformation efficiency of the MNCs’ achievements on the innovation efficiency of high-tech industries in the eastern, central, and western regions is 0.196, 0.188, and 0.098, respectively, with the eastern region being the most significantly affected, the central region the second, and the western region the lowest. The main reason is that MNCs are mainly engaged in innovation development to adapt to local market needs, while the eastern region has a high degree of marketization, a higher level of research and innovation, and is more sensitive to market information and changes in market factors. It is easier for high-tech industries in the east to absorb and acquire explicit and tacit knowledge disseminated by MNCs, and to increase their own development and research innovation capacity, which is conducive to improving the innovation efficiency of high-tech industries in the east. The central region lags behind the eastern region in terms of economic development level, marketization and absorption, and digestion capacity. Therefore, the western region suffers from a weaker effect of the action than the eastern region.

4.6.2. Panel Threshold Analysis of Regional Heterogeneity

From the perspective of regional heterogeneity, whether there is a threshold effect of R&D efficiency and achievement transformation efficiency of MNCs on China’s high-tech industry is tested, and the test results are shown in Table 9. In terms of R&D stages, the efficiency of R&D in the science and technology of MNCs in the eastern region passed the single threshold test with a threshold value of 0.573. The central region passed the single threshold test with a threshold value of 0.412. The western region does not pass the threshold test, which indicates that there is no threshold effect in the western region. In terms of the stage of achievement transformation, the efficiency of achievement transformation of MNCs in the eastern region passed the single threshold test, with a threshold value of 0.054. The central and western regions do not pass the threshold test, which indicates that there is no threshold effect.
The regression results of the threshold model for R&D efficiency and achievement transformation efficiency of MNCs are shown in Table 10 for the innovation efficiency of high-tech industries in China under regional heterogeneity.
As can be seen from Table 10, from the R&D stage, when the R&D efficiency of MNCs in science and technology in the eastern region is less than 0.573, its influence coefficient on the innovation efficiency of China’s high-tech industry is 0.292, which means that the R&D efficiency of MNCs has a positive influence on the innovation efficiency of China’s high-tech industry. The impact coefficient is 0.088 when the R&D efficiency of MNCs is greater than 0.573, when the boost to the innovation efficiency of high-tech industries in China is weakened. When the R&D efficiency of MNCs in the central region is less than 0.412, it has an impact coefficient of 0.181 on the innovation efficiency of China’s high-tech industry, indicating that it has a facilitating effect on the innovation efficiency of China’s high-tech industry. In terms of achievement transformation stage, when the transformation efficiency of the achievements of MNCs in the eastern region is less than 0.054, it has an impact coefficient of 0.261 on the innovation efficiency of China’s high-tech industry, indicating that it plays a role in promoting the innovation efficiency of China’s high-tech industry. The impact coefficient is 0.029 when the transformation efficiency achieved by MNCs is greater than 0.054 when it has a facilitating effect on the innovation efficiency of China’s high-tech industries, but the effect gradually decreases.

4.7. Robustness Test

4.7.1. Replacement Variable Indicators

To ensure the robustness of the above findings, the explanatory variable was replaced, and the amounts of patents granted for inventions in the Chinese high-tech industry was chosen as the explanatory variable. The regressions are performed with R&D efficiency and achievement transition efficiency of MNCs as explanatory variables, respectively. The results of the regression analysis are shown in Table 11, which shows that the R&D efficiency of MNCs and the efficiency of achieving transformation have a significantly positive effect on technological innovation of China’s high-tech industries. This is consistent with the results of the aforementioned benchmark regression, and the findings are relatively robust.

4.7.2. Instrumental Variables Method

To prevent the problem of endogeneity of the core explanatory variables that leads to inaccurate estimation results, the instrumental variables method is used to re-estimate the effect of the core explanatory variables on the innovation efficiency of China’s high-tech industries, and the core explanatory variables are selected with a lag of one to three periods as the instrumental variables. The test results are shown in Table 12, which shows that after overcoming the endogeneity problem, the impact of the core explanatory variables on the innovation efficiency of high-tech industries in China is all significantly positive, at least at the 10% level. This is consistent with the regression results above, so the findings are well robust.

5. Discussion

(1)
The MNC innovation has an impact on the innovation efficiency of China’s high-tech industry.
Enterprises can enhance their own innovation capabilities through the demonstration effect, correlation effect, contagion effect, and personnel mobility effect generated by MNCs’ innovation, with the help of their learning, absorption, and transformation capabilities [34]. From the point of view of the innovation value chain, innovation activities of MNCs in the R&D and results transformation phases accelerate the flow and concentration of innovation factors. This promotes the stable development of the regional innovation system and helps improve the regional innovation environment, which has a positive impact on the innovation of China’s high-tech industries. The higher the innovation efficiency of MNCs in the R&D stage, the more it is conducive to learning, absorption, and transformation in high-tech industries with strong knowledge acquisition capabilities, which helps to improve the problem of insufficient internal innovation resources [14]. However, the goal of technological innovation is to work towards obtaining the desired economic benefits from the market. The R&D institutions set up by MNCs are also mainly engaged in innovation activities tailored to local market needs, with more emphasis on commercialization and marketing of results. As a result, MNCs strengthen their innovation cooperation with China’s high-tech industries in the phase of innovation achievement transformation to better familiarize themselves with, and more quickly join, the regional innovation environment, industrial development network, and consumer demand market. This reduces the gap with the transformation capabilities of high-tech industries and promotes the spread and diffusion of explicit and tacit knowledge, which in turn has an impact on the innovation of China’s high-tech industries.
(2)
The impact of MNC innovation on the innovation efficiency of China’s high-tech industries has non-linear characteristics.
In the early days of MNCs entering the Chinese market, there was a large gap between China’s high-tech industry and MNCs in developed countries in terms of the level of technological innovation. Therefore, it is not necessary for high-tech industries to have a high level of learning and absorption capacity to bring into play the spillover effect of MNCs, which in turn promotes the development of regional innovation levels. With the continued expansion of MNCs, China’s high-tech industry has also continued to optimize its structure. The technology gap between China’s high-tech industries and MNCs is gradually narrowing. The demonstration effect and the imitation effect brought by MNCs are weakened to maintain their technological leadership, and MNCs do not allow China’s high-tech industries access to their cutting-edge core technologies. This leads to a reduction in the usefulness of technology spillovers from MNC innovation, which cannot significantly boost the innovation capacity of China’s high-tech industries and may even inhibit the development of high-quality innovation levels. This also leads to the fact that the impact of MNCs on China’s high-tech industry is not a simple linear relation but has more complex non-linear features.
(3)
The impact of MNC innovation on the innovation efficiency of China’s high-tech industries is characterized by regional heterogeneity.
From a geographical point of view, the economic statuses of different regions of China are at different stages of development, especially, the economic development levels of China’s eastern, central, and western regions vary widely. Influenced by various factors such as geographic location, innovation environment, and talent pool, the learning and absorption capacity of China’s high-tech industry varies from region to region. This also leads to differences in the extent to which high-tech industries in different regions are affected by the spillover effects of MNCs. The eastern region has better infrastructure than the central and western regions [54], and also has an advantage over the central and western regions in terms of the level of intellectual property protection, human capital, and openness to the outside world. Some provinces in the central and western regions are more backward in terms of infrastructure and have a relatively low level of opening-up and marketization, although the innovation environment in the central and western regions has been improved by the “Rise of Central China”, “Western Development”, and “One Belt, One Road” strategic policies. The talent pool has also been growing. With the advantages of lower-priced raw materials, location, labor, and various national preferential policies, more and more MNCs are being attracted to choose the central and western regions as their R&D investment bases [55,56,57]. However, there is still a large gap between the central, western regions, and the eastern regions, which makes the role of innovation efficiency of MNCs in different regions on the innovation efficiency of China’s high-tech industries heterogeneous in character.

6. Conclusions and Recommendations

6.1. Conclusions

Based on the technology innovation theory, technology diffusion theory, endogenous growth theory, and innovation value chain theory, this study employs the super-efficient network SBM model, fixed-effects model, and panel threshold model to empirically investigate the impact of the two-stage innovation of MNCs’ R&D and achievement transformation on the innovation efficiency of China’s high-tech industry. Moreover, it is explored in depth whether the effect is characterized by nonlinearity and heterogeneity. The conclusions of the study are specified as follows.
(1)
There are significant differences in the effects of both R&D efficiency and achievement transformation efficiency of MNCs on the innovation efficiency of China’s high-tech industries, and there is also heterogeneity in the effects on the innovation efficiency of high-tech industries in different regions. From the perspective of the innovation value chain, MNCs have a positive contribution to the innovation efficiency of China’s high-tech industry in both the R&D stage (0.352) and the achievement transformation stage (0.154). From the perspective of regional heterogeneity, R&D efficiency of MNCs has a positive impact on high-tech industries in the eastern (0.345), central (0.399), and western (0.108) regions of China, with the central region being the most significantly affected. The effect of the transformation efficiency of MNCs’ achievements on high-tech industries in the eastern (0.196), central (0.188), and western (0.098) regions of China is positive, with the eastern region being the most significantly affected.
(2)
There is a threshold effect of both R&D efficiency and achievement transformation efficiency of MNCs on the innovation efficiency of China’s high-tech industries, and the difference is obvious in different regional scopes. There is a single threshold effect for the R&D efficiency of MNCs in the eastern and central regions of China, and no threshold effect in the western regions. There is a single threshold effect for the transition efficiency achieved by MNCs in all the eastern regions, and no threshold effect in all the central and western regions.

6.2. Recommendations

(1)
Improve the quality of the introduction of MNCs
As China’s economic development moves into a new normal, the traditional sloppy growth approach cannot provide a sustainable driver for economic growth. Promoting high-quality economic development has become an inevitable choice to achieve leapfrogging progress, and improving the quality of MNCs introduced is an important driving force to achieve high-quality economic development. The government can develop criteria for judging the quality of MNCs and enrich the types of MNCs introduced based on their country of origin, R&D category, and investment scale, combined with China’s own production factor allocation and industrial structure.
(2)
Improve the absorption and learning ability of China’s high-tech industry
The need for China’s high-tech industry to enhance its technology absorption capacity is not only a requirement to improve its competitiveness, but also to cope with the harsh external environment. A strong absorptive capacity is the basis for mimicking and reinventing the knowledge and skills of MNCs. Strategies to improve the technology absorption capacity of China’s high-tech industries include emphasizing research and development activities and enhancing knowledge management, creating a favorable innovation climate, and focusing on the accumulation and management of external social capital.
(3)
Enhance the independent innovation capability of China’s high-tech industries
With the rise and spread of trade protectionism in the developed world, it has become more difficult to introduce advanced technologies. Moreover, the consumption of Chinese residents is gradually changing from materialistic to service-oriented, and the traditional model of importing overseas technology can no longer meet the rising consumption demand. China’s high-tech industry should improve its independent innovation capacity in an all-round way, while enhancing its technology absorption capacity. Strategies to improve the independent innovation capability of China’s high-tech industry mainly include continuously increasing the supply of innovation factors, strengthening the guiding role of the government, building an innovation regulatory and policy system, and optimizing the intellectual property protection system.

6.3. Limitations and Prospects

There are still some limitations in this study. (1) this study empirically analyzes the impact of MNC innovation on the innovation efficiency of China’s high-tech industries using provincial data based on the availability of data. Future research can expand the empirical research objects, for example, it can be carried out from the perspective of the impact of MNC innovation on innovation of Chinese universities and research institutions, but also from cities, high-tech parks, and industries, which can help to better test the effect of MNCs on the innovation of China’s regions and make the research conclusions more reasonable, scientific, and comprehensive. (2) This study uses a fixed effects model and a panel threshold model to analyze the effects of MNC innovation under the assumptions of spatial homogeneity and spatial independence. Future research will explore the evolution characteristics and role effects of MNC innovation from a spatial perspective, and deeply explore the local effects and spatial spillover effects of MNC innovation on the innovation efficiency of China’s local high-tech industries.

Author Contributions

Conceptualization, Y.K. and H.C.; methodology, Y.K.; software, K.L.; formal analysis, Y.K.; investigation, H.X.; resources, K.L.; data curation, Y.K.; writing—original draft preparation, Y.K.; writing—review and editing, Y.K. and K.L.; visualization, K.L. and H.X.; supervision, H.C.; project administration, H.C.; funding acquisition, H.C. All authors have read and agreed to the published version of the manuscript.

Funding

This research was funded by Natural Science Foundation of Shandong Province (ZR2021MG018).

Institutional Review Board Statement

Not applicable.

Informed Consent Statement

Not applicable.

Data Availability Statement

All data that support the findings of this study are available from the corresponding author upon reasonable request.

Conflicts of Interest

The authors declare no conflict of interest.

References

  1. Liu, A.; Fu, S. Study on the dynamic process of RKT in MNEs from the aspect of network evolutionary game. Clust. Comput. 2019, 22, S8415–S8427. [Google Scholar] [CrossRef]
  2. Wei, Z.; Nguyen, Q.T.K. Local responsiveness strategy of foreign subsidiaries of Chinese multinationals: The impacts of relational-assets, market-seeking FDI, and host country institutional environments. Asia Pac. J. Manag. 2020, 37, 661–692. [Google Scholar] [CrossRef]
  3. Xiao, W.; Kong, H.; Shi, L.; Boamah, V.; Tang, D. The impact of innovation-driven strategy on high-quality economic development: Evidence from China. Sustainability 2022, 14, 4212. [Google Scholar] [CrossRef]
  4. Chen, X.; Liu, X.; Gong, Z.; Xie, J. Three-stage super-efficiency DEA models based on the cooperative game and its application on the R&D green innovation of the Chinese high-tech industry. Comput. Ind. Eng. 2021, 156, 107234. [Google Scholar] [CrossRef]
  5. He, Y.; Gan, S.; Xiao, L. Can foreign suppliers act as “innovation springboards” for firms? Evidence from China. Res. Int. Bus. Financ. 2021, 56, 101353. [Google Scholar] [CrossRef]
  6. Feng, W.; Li, J. International technology spillovers and innovation quality: Evidence from China. Econ. Anal. Policy 2021, 72, 289–308. [Google Scholar] [CrossRef]
  7. Zhang, B.; Luo, Y.; Chiu, Y.-H. Efficiency evaluation of China’s high-tech industry with a multi-activity network data envelopment analysis approach. Socio-Econ. Plan. Sci. 2019, 66, 2–9. [Google Scholar] [CrossRef]
  8. Deng, Q.; Zhou, S.; Peng, F. Measuring green innovation efficiency for China’s high-tech manufacturing industry: A network DEA approach. Math. Probl. Eng. 2020, 2020, 8902416. [Google Scholar] [CrossRef]
  9. Lin, S.; Lin, R.; Sun, J.; Wang, F.; Wu, W. Dynamically evaluating technological innovation efficiency of high-tech industry in China: Provincial, regional and industrial perspective. Socio-Econ. Plan. Sci. 2021, 74, 100939. [Google Scholar] [CrossRef]
  10. Ji, Y.; Wang, Z. Impact of local living environment on innovation efficiency of high-tech industries in China: A spatial analysis. Environ. Sci. Pollut. Res. 2022, 29, 73563–73576. [Google Scholar] [CrossRef]
  11. Xu, J.; Li, J. The impact of intellectual capital on SMEs’ performance in China Empirical evidence from non-high-tech vs. high-tech SMEs. J. Intellect. Cap. 2019, 20, 488–509. [Google Scholar] [CrossRef]
  12. Deng, P.; Lu, H.; Hong, J.; Chen, Q.; Yang, Y. Government R&D subsidies, intellectual property rights protection and innovation. Chin. Manag. Stud. 2019, 13, 363–378. [Google Scholar] [CrossRef]
  13. Chen, H.; Lin, H.; Zou, W. Research on the regional differences and influencing factors of the innovation efficiency of China’s high-tech industries: Based on a shared inputs two-stage network DEA. Sustainability 2020, 12, 3284. [Google Scholar] [CrossRef]
  14. Duan, Y.; Liu, S.; Cheng, H.; Chin, T.; Luo, X. The moderating effect of absorptive capacity on transnational knowledge spillover and the innovation quality of high-tech industries in host countries: Evidence from the Chinese manufacturing industry. Int. J. Prod. Econ. 2021, 233, 108019. [Google Scholar] [CrossRef]
  15. Yang, J. An empirical study evaluating the symbiotic efficiency of China’s provinces and the innovation ecosystem in the high-tech industry. Complexity 2022, 2022, 1391415. [Google Scholar] [CrossRef]
  16. Le Bas, C.; Sierra, C. ‘Location versus home country advantages’ in R&D activities: Some further results on multinationals’ locational strategies. Res. Policy 2002, 31, 589–609. [Google Scholar] [CrossRef]
  17. Dunning, J.H.; Lundan, S.M. Multinational Enterprises and the Global Economy, 2nd ed; Edward Elgar: Cheltenham, UK, 2008. [Google Scholar]
  18. Narula, R.; Dunning, J.H. Multinational enterprises, development and globalization: Some clarifications and a research agenda. Oxf. Dev. Stud. 2010, 38, 263–287. [Google Scholar] [CrossRef]
  19. Squicciarini, M.P.; Voigtlaender, N. Human Capital and Industrialization Evidence from the Age of Enlightenment. Q. J. Econ. 2015, 130, 1825–1883. [Google Scholar] [CrossRef]
  20. Schmiele, A. Intellectual property infringements due to R&D abroad? A comparative analysis between firms with international and domestic innovation activities. Res. Policy 2013, 42, 1482–1495. [Google Scholar] [CrossRef]
  21. Dachs, B.; Kinkel, S.; Jaeger, A. Bringing it all back home? Backshoring of manufacturing activities and the adoption of Industry 4.0 technologies. J. World Bus. 2019, 54, 101017. [Google Scholar] [CrossRef]
  22. Kumar, N. Determinants of location of overseas R&D activity of multinational enterprises: The case of US and Japanese corporations. Res. Policy 2001, 30, 159–174. [Google Scholar] [CrossRef]
  23. Wong, K.N.; Goh, S.K. Outward FDI, merchandise and services trade new evidence from Singapore. J. Bus. Econ. Manag. 2013, 14, 276–291. [Google Scholar] [CrossRef]
  24. Branstetter, L.; Fisman, R.; Foley, C.F.; Saggi, K. Does intellectual property rights reform spur industrial development? J. Int. Econ. 2011, 83, 27–36. [Google Scholar] [CrossRef]
  25. Liu, X.; Gao, L.; Lu, J.; Lioliou, E. Environmental risks, localization and the overseas subsidiary performance of MNEs from an emerging economy. J. World Bus. 2016, 51, 356–368. [Google Scholar] [CrossRef]
  26. Palmisano, S.J. The globally integrated enterprise. Foreign Aff. 2006, 85, 127–136. [Google Scholar] [CrossRef]
  27. Chiesa, V. Managing the internationalization of R&D activities. IEEE Trans. Eng. Manage. 1996, 43, 7–23. [Google Scholar] [CrossRef]
  28. Brockhoff, K. Internationalization of Research and Development; Springer Science & Business Midia: Berlin, Germany, 1998. [Google Scholar]
  29. von Zedtwitz, M.; Gassmann, O. Market versus technology drive in R&D internationalization: Four different patterns of managing research and development. Res. Policy 2002, 31, 569–588. [Google Scholar] [CrossRef]
  30. Shen, J.H.; Wang, H.; Lin, S.C.C. Productivity gap and inward FDI spillovers: Theory and evidence from China. China World Econ. 2021, 29, 24–48. [Google Scholar] [CrossRef]
  31. Mariotti, S.; Marzano, R. The effects of competition policy, regulatory quality and trust on inward FDI in host countries. Int. Bus. Rev. 2021, 30, 101887. [Google Scholar] [CrossRef]
  32. Zhang, F.Q.; Wang, Y. Science and technology resource allocation, spatial association, and regional innovation. Sustainability 2020, 12, 694. [Google Scholar] [CrossRef]
  33. Elkemali, T. Uncertainty and financial analysts’ optimism: A comparison between high-tech and low-tech European firms. Sustainability 2023, 15, 2270. [Google Scholar] [CrossRef]
  34. Ghebrihiwet, N. FDI technology spillovers in the mining industry: Lessons from South Africa’s mining sector. Resour. Policy 2019, 62, 463–471. [Google Scholar] [CrossRef]
  35. Das, G.G.; Drine, I. Distance from the technology frontier: How could Africa catch-up via socio-institutional factors and human capital? Technol. Forecast. Soc. 2020, 150, 119755. [Google Scholar] [CrossRef]
  36. Sultana, N.; Turkina, E. Foreign direct investment, technological advancement, and absorptive capacity: A network analysis. Int. Bus. Rev. 2020, 29, 101668. [Google Scholar] [CrossRef]
  37. Ma, T.; Cao, X. FDI, technological progress, and green total factor energy productivity: Evidence from 281 prefecture cities in China. Environ. Dev. Sustain. 2022, 24, 11058–11088. [Google Scholar] [CrossRef]
  38. Agan, B.; Balcilar, M. On the determinants of green technology diffusion: An empirical analysis of economic, social, political, and environmental factors. Sustainability 2022, 14, 2008. [Google Scholar] [CrossRef]
  39. Lew, Y.K.; Liu, Y. The contribution of inward FDI to Chinese regional innovation: The moderating effect of absorptive capacity on knowledge spillover. Eur. J. Int. Manag. 2016, 10, 284–313. [Google Scholar] [CrossRef]
  40. Kim, M.; Choi, M.J. R&D spillover effects on firms’ export behavior: Evidence from South Korea. Appl. Econ. 2019, 51, 3066–3080. [Google Scholar] [CrossRef]
  41. Marco, L.C.K.; Steve, Y.F.; Zhang, Z.; Vincent, L.K.K. Determinants of innovative activities: Evidence from Europe and Central Asia Region. Singap. Econ. Rev. 2015, 60, 1550004. [Google Scholar] [CrossRef]
  42. Tzeng, C.-H. How domestic firms absorb spillovers: A routine-based model of absorptive capacity view. Manag. Organ. Rev. 2018, 14, 543–576. [Google Scholar] [CrossRef]
  43. Hansen, B.E. Threshold effects in non-dynamic panels: Estimation, testing, and inference. J. Econom. 1999, 93, 345–368. [Google Scholar] [CrossRef]
  44. Wang, J.; Zhao, M. Evaluation of regional university technology transfer performance in China based on super-efficiency SBM. Int. J. Technol. Manag. 2022, 90, 54–77. [Google Scholar] [CrossRef]
  45. Boeing, P.; Eberle, J.; Howell, A. The impact of China’s R&D subsidies on R&D investment, technological upgrading and economic growth. Technol. Forecast. Soc. 2021, 174, 121212. [Google Scholar] [CrossRef]
  46. Liu, P.Z.; Zhang, L.Y.; Tarbert, H.; Yan, Z.Y. Analysis on Spatio-Temporal characteristics and influencing factors of industrial green innovation efficiency-from the perspective of innovation value chain. Sustainability 2022, 14, 342. [Google Scholar] [CrossRef]
  47. Zou, L.; Zhu, Y.W. Universities’ scientific and technological transformation in China: Its efficiency and influencing factors in the Yangtze River Economic Belt. PLoS ONE 2021, 16, e0261343. [Google Scholar] [CrossRef]
  48. Wang, X.L.; Liu, Y.; Chen, L.D. Innovation efficiency evaluation based on a two-stage DEA Model with Shared-Input: A case of Patent-Intensive industry in China. IEEE Trans. Eng. Manag. 2021, 70, 1808–1822. [Google Scholar] [CrossRef]
  49. Khan, S.U.; Cui, Y. Identifying the impact factors of sustainable development efficiency: Integrating environmental degradation, population density, industrial structure, GDP per capita, urbanization, and technology. Environ. Sci. Pollut. Res. 2022, 29, 56098–56113. [Google Scholar] [CrossRef]
  50. Sun, X.L.; Li, H.Z.; Ghosal, V. Firm-level human capital and innovation: Evidence from China. China Econ. Rev. 2020, 59, 101388. [Google Scholar] [CrossRef]
  51. Pan, J.D.; Lin, G.B.; Xiao, W. The heterogeneity of innovation, government R&D support and enterprise innovation performance. Res. Int. Bus. Finance 2022, 62, 101741. [Google Scholar] [CrossRef]
  52. Wang, Q.Y.; Zhang, M.; Wang, W.W. Analysis of the impact of foreign direct investment on urbanization in China from the perspective of “circular economy”. Environ. Sci. Pollut. Res. 2021, 28, 22380–22391. [Google Scholar] [CrossRef]
  53. Wan, Q.C.; Yuan, L.; Xu, Y. Impact of intellectual property protection on the innovation efficiency in China’s hi-tech industry. Technol. Anal. Strateg. 2023, 35, 107–122. [Google Scholar] [CrossRef]
  54. Leng, C.; Ma, W.; Tang, J.; Zhu, Z. ICT adoption and income diversification among rural households in China. Appl. Econ. 2020, 52, 3614–3628. [Google Scholar] [CrossRef]
  55. Zhang, Y. The regional disparity of influencing factors of technological innovation in China: Evidence from high- tech industry. Technol. Econ. Dev. Econ. 2021, 27, 811–832. [Google Scholar] [CrossRef]
  56. Balcilar, M.; Usman, O.; Agan, B. On the connectedness of commodity markets: A critical and selective survey of empirical studies and bibliometric analysis. J. Econ. Surv. 2022, 1–40. [Google Scholar] [CrossRef]
  57. Balcilar, M.; Usman, O.; Ike, G.N. Investing green for sustainable development without ditching economic growth. Sustain. Dev. 2022, 31, 728–743. [Google Scholar] [CrossRef]
Figure 1. Two-stage input-output process of innovation of MNCs.
Sustainability 15 07089 g001
Table 1. Descriptive statistics of variables.
VariablesSymbolSample SizeMeanMinimumMaximumStandard Deviation
Innovation efficiency of China’s high-tech industriesIEC3600.5160.1031.4790.246
R&D efficiency of MNCsREM3600.4300.0032.7590.395
transformation efficiency of MNCs’ achievements TEM3600.3570.0011.5950.361
rating of economic developmentRED3603.2900.27715.2742.543
Human CapitalHC3600.0280.0020.0820.018
Government supportGS3600.6300.0550.7310.180
Industrial structureIS3600.4260.2290.8820.092
OpennessOP3600.3940.0173.5610.521
Intellectual property protectionIPP3602.0550.5733.4920.599
Table 2. Measurement of innovation efficiency of China’s high-tech industries from 2009 to 2020.
YearEastern RegionCentral RegionWestern RegionNational
20090.5900.4580.2790.441
20100.5610.5610.2750.456
20110.6500.5230.3250.497
20120.6870.5430.3680.532
20130.7370.5460.3050.528
20140.7320.5090.2910.511
20150.7490.5290.3430.541
20160.7480.5480.3030.532
20170.7360.5720.3080.535
20180.7470.5490.3010.531
20190.7800.5170.3090.537
20200.7910.5850.3110.560
Average value0.7090.5370.3090.516
Table 3. Correlation test for variables.
REMTEMREDHCGSISOPIPP
REM1
TEM−0.3261
RED0.3870.2411
HC0.264−0.242−0.2851
GS0.2840.030.5430.2531
IS−0.2280.0670.450.0670.7271
OP−0.1130.0770.142−0.2930.3590.1361
IPP0.389−0.313−0.3370.354−0.529−0.404−0.1931
Table 4. VIF test for explanatory variables.
VariablesREMTEMREDHCGSISOPIPP
VIF1.361.321.691.613.612.751.271.76
Table 5. Impact results of MNC innovation on the innovation efficiency of China’s high technology industries.
YearModel 1Model 2
Mode 1aMode 1bMode 2aMode 2b
REM0.881 **0.352 **
(2.41)(1.40)
TEM 0.354 **0.154 **
(0.25)(0.61)
RED 0.009 ** 0.010 *
(0.42) (0.65)
GS 0.733 ** 0.729 **
(2.15) (0.31)
HC 0.024 * 0.025 *
(2.13) (2.15)
IS −0.391 ** −0.418 **
(−0.88) (−0.95)
OP 0.490 * 0.409 *
(1.72) (1.84)
IPP 0.152 * 0164 *
(0.65) (0.63)
C0.545 ***0.0260.545 ***0.042 *
(1.96)(0.15)(2.30)(0.20)
R-sq0.55100.50010.73210.5792
Note: ***, **, * denote significant at the 1%, 5% and 10% levels, respectively, with t-values in parentheses.
Table 6. Threshold estimation results.
VariablesThreshold Typep-ValueThreshold Value95% Confidence Interval
REMSingle threshold0.05670.429[0.409, 0.439]
TEMSingle threshold0.03670.111[0.110, 0.117]
Table 7. Threshold regression results.
VariablesREMVariablesTEM
REM_10.194 ***TEM_10.102 **
(1.67)(2.82)
REM_20.038 **TEM_20.038 **
(0.05)(2.37)
RED0.009 ***RED0.018 ***
(0.24)(0.48)
GS0.026GS0.026 *
(0.80)(0.8)
HC0.023 *HC0.024 *
(0.50)(0.48)
IS−0.005 **IS−0.004 ***
(−0.11)(−0.10)
OP0.064 *OP0.064 *
(1.41)(1.44)
IPP0.022 *IPP0.024 *
(0.66)(1.02)
R-sq0.382R-sq0.379
Note: ***, **, * denote significant at the 1%, 5% and 10% levels, respectively, with t-values in parentheses.
Table 8. Basis regression results of regional heterogeneity.
VariablesModel 1Model 2
Eastern RegionCentral RegionWestern RegionEastern RegionCentral RegionWestern Region
REM0.345 **0.399 *0.345 **
(0.83)(3.38)(0.83)
TEM 0.196 **0.188 *0.098 *
(0.57)(1.02)(0.17)
RED0.075 ***0.015 ***0.038 **0.084 *0.023 ***0.034 **
(0.75)(0.38)(1.01)(1.63)(0.56)(0.84)
GS0.544 *0.555 *1.769 ***0.562 *0.393 *1.715 ***
(2.51)(0.68)(2.48)(0.47)(0.46)(2.40)
HC0.148 **0.071 *0.173 *0.150 ***0.127 *0.157 **
(1.12)(0.66)(1.70)(2.05)(1.13)(1.53)
IS−0.368 *−1.033 *−0.305−0.055 *−1.144−0.059
(−0.60)(−1.37)(−0.28)(−0.11)(−1.41)(−0.06)
OP0.747 *1.881 *1.0980.574 *1.2951.488
(0.63)(1.22)(0.53)(0.47)(2.11)(0.59)
IPP0.3110.962 *0.066 *0.347 *1.117 **0.015 *
(0.32)(3.75)(0.18)(1.64)(4.20)(0.04)
C0.262 *0.447 *1.035 *0.1790.434 **1.718
(0.67)(0.50)(1.97)(1.90)(0.48)(1.77)
R-sq0.64640.51100.45210.61550.61490.5445
Note: ***, **, * denote significant at the 1%, 5% and 10% levels, respectively, with t-values in parentheses.
Table 9. Estimated results of regional heterogeneity thresholds.
VariablesRegionThreshold Typep-ValueThreshold Value95% Confidence Interval
REMEastern regionSingle threshold0.04000.573[0.566, 0.575]
Central regionSingle threshold0.02330.412[0.342, 0.429]
TEMEastern regionSingle threshold0.07330.054[0.051, 0.054]
Table 10. Regression results of regional heterogeneity threshold.
VariablesEastern RegionCentral RegionVariablesEastern Region
REM_10.292 **0.181 **TEM_10.261 **
(1.35)(2.94)(2.21)
REM_20.088 *0.030 *TEM_20.029 *
(1.76)(0.51)(−0.61)
RED0.001 ***0.093 ***RED0.136 *
(0.60)(0.17)(0.63)
GS0.109 **0.165 **GS0.049 ***
(0.82)(0.70)(1.16)
HC0.097 *0.343 *HC0.081 *
(1.00)(0.33)(0.83)
IS−0.043 **−0.044 **IS−0.148 ***
(−0.97)(−0.59)(−1.16)
OP0.058 *0.222 *OP0.078 *
(0.90)(0.69)(1.15)
IPP0.0160.009 **IPP0.016 *
(0.96)(0.44)(0.96)
R-sq0.1870.140R−sq0.340
Note: ***, **, * denote significant at the 1%, 5% and 10% levels, respectively, with t-values in parentheses.
Table 11. Robustness test of substitution variables.
VariablesModel 1Model 2
REM0.475 **
(0.99)
TEM 0.111 **
(1.24)
C0.082 **0.143 *
(3.17)(1.30)
Control variablesControlControl
Number of observations360360
R-sq0.14150.1332
Note: **, * denote significant at the 5% and 10% levels, respectively, with t-values in parentheses.
Table 12. Regression results of instrumental variable method.
VariablesModel 1Model 2
REM0.378 *
(1.18)
TEM 0.155 ***
(2.05)
C0.060 ***0.029 **
(1.97)(2.48)
Control variablesControlControl
Number of observations360360
R-sq0.27830.1987
Note: ***, **, * denote significant at the 1%, 5% and 10% levels, respectively, with t-values in parentheses.
Disclaimer/Publisher’s Note: The statements, opinions and data contained in all publications are solely those of the individual author(s) and contributor(s) and not of MDPI and/or the editor(s). MDPI and/or the editor(s) disclaim responsibility for any injury to people or property resulting from any ideas, methods, instructions or products referred to in the content.

