Article

Content Variation and Potential Runoff Loss Risk of Nutrients in Surface Water of Saline-Alkali Paddy in Response to the Application of Different Nitrogen Fertilizer Types

1
Key Laboratory of Songliao Aquatic Environment, Ministry of Education, Jilin Jianzhu University, Changchun 130118, China
2
Key Laboratory of Wetland Ecology and Environment, Northeast Institute of Geography and Agroecology, Chinese Academy of Sciences, Changchun 130102, China
3
College of Resources and Environment, University of Chinese Academy of Sciences, Beijing 100049, China
4
Jilin Provincial Engineering Center of CWs Design in Cold Region & Beautiful Country Construction, Changchun 130102, China
5
School of Life Sciences, Northeast Normal University, Changchun 130021, China
*
Author to whom correspondence should be addressed.
These authors contributed equally to this work.
Sustainability 2023, 15(9), 7040; https://doi.org/10.3390/su15097040
Submission received: 6 March 2023 / Revised: 14 April 2023 / Accepted: 20 April 2023 / Published: 22 April 2023
(This article belongs to the Topic Hydrology and Water Resources in Agriculture and Ecology)

Abstract

:
As the saline-alkali paddy area continues to grow, the nutrient (e.g., nitrogen (N) and phosphorus (P)) runoff loss is becoming more serious in the world. The N-fertilizer application affects the nutrient runoff loss risk in paddy. Selecting suitable fertilizer types to reduce nutrient loss is beneficial to agricultural sustainability. However, the effects of N-fertilizer application in saline-alkali paddy are not clear. This study measured the N and P concentration of surface water in saline-alkali paddy, using various N—fertilizer treatments (i.e., urea (U), urea with urease—nitrification inhibitors (UI), organic–inorganic compound fertilizer (OCF), carbon—based slow—release fertilizer (CSF), and no N fertilization (CK)). Based on the structural equation model, both phosphate (PO43−-P) and total−P (TP) concentrations had a positive influence on total-N (TN) concentration regardless of N−fertilizer types applied. Potential risks of ammonia—N (NH4+—N) and nitrate—N (NO3—N) runoff losses were reduced in UI treatment, but the TN and TP losses were increased. At the panicle-initiation fertilizer stage, the NO3−N, TN, and TP concentrations in CSF and OCF treatments were lower than U. The CSF application can control the TP runoff loss risk during the rice-growing season. UI should not be suggested for the control of nutrient runoff loss in saline-alkali paddy.

1. Introduction

In recent years, the method of planting crops on saline-alkali lands to improve the property of saline-alkali soil has become increasingly common, but it has also brought about some agricultural pollution problems [1,2]. Especially in paddy fields, saline-alkali soil, typically with high salinity and/or high pH, can cause the nitrogen (N) content in the soil to be lower than that in non-saline-alkali soil, which requires more nutrient input to ensure a high yield. According to the statistics of the Food and Agriculture Organization of the United Nations (FAO) [3], the average seasonal N application rate adopted in China was 225 kg/ha, which was higher than the optimum N rate of 200 kg/ha suggested by Ju et al. (2009) [4], the optimum N rate calculated from the average of economic N rates from field experiments. A large amount of N has been lost due to the excessive and/or unreasonable application of N fertilizers, resulting in a series of environmental problems (e.g., nonpoint source pollution) [5,6]. The prevention and control of agricultural nonpoint source pollution have become an important environmental problem in the world [7,8]. More than 60% of surface water environmental problems are caused by agricultural activities in China [9]. An important source of agricultural nonpoint source pollution is the loss of N, phosphorus (P), and other nutrients from paddy fields [8,9]. Properties of saline-alkali soil (e.g., high salinity and pH) would cause N loss and phosphate recalcitrance [10]. Although P is not easy to lose from water, the improvement measures (e.g., drainage and salt washing after the reclamation of paddy fields) will aggravate the soil P loss via runoff in paddy fields [11]. At present, the area of saline-alkali paddy fields is expanding all over the world, and the degree of soil salinization is rising [8]. Therefore, the N and P losses from saline-alkali paddy fields have also attracted much attention.
Runoff loss is one of the main pathways of N and P losses in paddy fields [5,9]. Since the 1990s, N and P runoff losses from farmland have increased by 46% and 30%, respectively, resulting in an increasing nutrient (e.g., N and P) export to surrounding water bodies, thereby posing a threat to the aquatic ecosystems [12]. Fertilization intensity, fertilization types, and annual precipitation have effects on N and P runoff losses in paddy fields [5,11]. The application of fertilizer can increase the N and P concentration of saline-alkali paddy water; the potentiality of N and P runoff losses from the paddy soils owing to different fertilization types has not been investigated clearly. In addition, there is a coupling relationship between N and P [9]. The application of N fertilizers can stimulate the P release in the soil. In the process of topdressing, it will stir the topsoil of the paddy fields to release P in the soil, which will change the P concentration in the surface water. The concentrations of N and P in surface water can serve as an indirect indicator of potential nutrient runoff loss risk in paddy fields [9], as they are direct sources of nutrients in surface runoff [13]. Thus, it is of great significance to study the changes in N and P concentrations in surface water after fertilization for the prevention and control of N and P runoff losses in paddy fields.
Due to the complexity of N and P pollutants along the surface runoff, crop growth, and development and regionality, although the studies on the loss factors of N and P via surface runoff in paddy fields have been reported, the study on the control of field fertilization on the pollution runoff loads of N and P is still in the exploratory stage [5,8,9]. Zhao et al. [14] found that applications of organic and organic–inorganic compound fertilizers (OCF) reduced the N loss by 21.86% and 30.41%, respectively, compared with urea (U). Cui et al. [9] believed that the application of organic fertilizer could effectively reduce N loss but increase P loss. The studies on N and P losses via surface runoff are mainly based on non-saline-alkali paddy fields [5,14], while there are few studies on the saline-alkali paddy fields in Northeast China. Due to the unique properties of the saline-alkali soil, the response of different N—fertilizer types to N and P losses in saline-alkali paddy fields may be different from non-saline-alkali paddy fields. Therefore, this study set five treatments with different N—fertilizers to study the effect of nutrient runoff loss risk in saline-alkali paddy fields. The main objectives of this study were: (1) to explore the dynamic changes in various N and P forms in surface water of saline-alkali paddy fields under different N—fertilizer applications, and (2) to clarify the effect of N—fertilizer types on the potential risks of N and P runoff losses. This study will provide a theoretical reference for the sustainable development of the rice planting industry and provide an efficient strategy for formulating reasonable nonpoint source pollution control in saline-alkali paddy fields.

2. Materials and Methods

2.1. Experimental Design and Operation

Fifteen paddy mesocosms were established in a mobile intelligent canopy. The size of each mesocosm was 64 cm length × 49 cm width × 36 cm height, which was set up by the polyethylene material. This experiment was operated from 31 May to 15 October 2021, with a daily temperature of 2–30 °C and a relative humidity of 46–99%. The saline-alkali paddy soil used in this study was randomly collected from nine saline-alkali paddy fields (45°34′18–33′′ N, 123°54′25–42′′ E) in Baicheng City, Western Jilin Province, China. The physical and chemical properties of saline-alkali paddy soil are described in Table S1 of Supplementary Materials.
Five N−fertilizer treatments, with three replicates per treatment, were carried out in fifteen paddy mesocosms at the basal fertilizer (BF) stage. There were four treatments with different N fertilizers, i.e., U, urea with urease-nitrification inhibitors (i.e., 1% N-(N-butyl)thiophosphoric triamide (NBPT) and 1% 3,4-dimethylpyrazole phosphate (DMPP), refer to UI), OCF and carbon (C) based slow-release fertilizer (refer to CSF), and one treatment without additional N fertilizer as control (refer to CK). The organic–inorganic compound fertilizer (OCF) has 12% N and 3% K2O, containing 20% organic matter, which comes from Chinese herbal materials. The carbon-based slow-release fertilizer has a proportion of N, P2O5, and K2O with 24:8:10, containing 10% biochar. At the BF stage, these N−fertilizer types used were selected by the field investigation in Western Jilin, China. Urea was used at tillering fertilizer (TF) and panicle-initiation fertilizer (PIF) stages. The total N fertilizers were applied at 200 kg N/ha (i.e., 6.27 g N/mesocosm), which was consistent with the actual amount of N fertilizer applied by local farmers in all treatments (excluding CK); the ratio of three N—fertilizer application ratios with of BF, TF, and PIF was 5:3:2. Table 1 describes the specific application of different N fertilizers in each treatment. Along with the N fertilizer applied at the BF stage, ammonium phosphate (18% N and 46% P2O5) and potassium sulfate (50% K2O) were employed as phosphate and potash fertilizers before rice transplanting, respectively. The total phosphate and potash fertilizers during the entire rice−growing season were 70 kg P2O5/ha (i.e., 2.20 g P2O5/mesocosm) and 90 kg K2O/ha (i.e., 2.82 g K2O/mesocosm), respectively. The selections of N, phosphate, and potash fertilizers were based on the field survey of saline-alkali paddy fields in Western Jilin Province, China. The BF was mixed completely with the collected saline-alkali paddy soil on 30 May 2021, and then each mesocosm was initiated flooded. Dongdao 4 (Oryza sativa L.), a saline-alkali-resistant rice variety, was transplanted into all paddy mesocosms on 31 May 2021. The same agricultural management, including irrigation, was performed in all paddy mesocosms. Each paddy mesocosm was regularly irrigated with the same amount of water, which was maintained at a water depth of 3–5 cm by intermittent irrigation before crop harvesting. In this study, no precipitation occurred, and insecticides and pesticides were not applied during the whole experiment period.

2.2. Sampling and Chemical Analyses of Surface Water

During the 137-day experiment, the sampling was conducted in a total of 34 days, including Day 0, 1, 3, 5, 7, and 10 at each initial fertilization and every 5–7 days thereafter. The fertilization dates of BF, TF, and PIF were 30 May, 13 June, and 10 August 2021, respectively. A 100 mL polyethylene sampling bottle was used to collect the surface water sample from each mesocosm on each sampling day. Surface water samples collected from all treatments were tested for electrical conductivity (EC) and pH using a quality analyzer (Bante ™, Shanghai, China). The concentrations of ammonia—N (NH4+—N), nitrite—N (NO2—N), nitrate-N (NO3—N), total—N (TN), phosphate (PO43−—P), and total-P (TP) concentrations were analyzed via the automatic chemical analyzer (Mode Smartchem 200, Italy).

2.3. Statistical Analysis

All experimental data were graphically interpreted using Origin 2021 software (OriginLab Corporation, Northampton, MA, USA). Statistical analysis was performed using SPSS 22.0 software (IBM Corporation, New York, NY, USA). All experimental data were reported as means and standard deviations of three independent replicates (mean ± SD). The result of the one-way analysis of variance (ANOVA) was used to determine the significance of the difference between treatments. Levene’s test was used to test the homogeneity of variances, and the least significant difference (LSD) was used to perform the multiple comparisons of mean values. A p-value less than or equal to 0.05 was considered significant in all analyses. The correlation between N and P in water parameters was described using Pearson correlation analysis. Principal component analysis (PCA) with the correlation matrix was also carried out with Origin 2021 software. The variables used in PCA were the values of pH and EC and the concentrations of NH4+—N, NO2—N, NO3—N, TN, PO43—P, and TP. Amos 24.0 software (AMOS IBM, USA) was utilized to conduct a structural equation model (SEM).

3. Results

3.1. EC and pH of Surface Water in Saline-Alkali Paddy Fields

The EC and pH values in surface water of all treatments had a violent fluctuation trend during the entire rice-growing season (Figure 1). At the BF stage, the highest average EC value in surface water was observed in OCF treatment, followed by CSF, UI, U, and CK treatments. Compared to CK (1.07 ± 0.55 mS/cm), the EC values in UI (1.67 ± 0.98 mS/cm), OCF (1.89 ± 1.15 mS/cm), and CSF (1.70 ± 0.70 mS/cm) treatments demonstrated a statistically significant (p < 0.05) increase, respectively. The average EC values at the TF stage were CK < OCF < U < CSF < UI, and at PIF stage were CK < U < CSF < OCF < UI. The UI treatment at both TF and PIF stages had significantly (p < 0.05) higher average EC values than all the other four treatments. The average pH values at the BF stage were CK < CSF < UI < U < OCF, at the TF stage were U < CK < OCF < CSF < UI, and the UI treatment (8.57 ± 0.38) at the TF stage had a statistically significant (p < 0.05) higher pH value than U (8.24 ± 0.43) and CK (8.31 ± 0.25) treatments, respectively. At the PIF stage, the average pH values were U < CSF < CK < OCF < UI and the UI treatment had a significant (p < 0.05) higher average pH value than all the other four treatments. The average pH value in OCF treatment (8.53 ± 0.38) was significantly (p < 0.05) higher than U (8.16 ± 0.33) and CSF (8.18 ± 0.29), respectively.

3.2. Dynamic Changes in Different N Forms in Surface Water as Rice Grows

Regardless of the N—fertilizer types, the NH4+—N concentrations in surface water of all N—fertilizer treatments were higher than CK (Figure 2a). At the BF stage, the changing trend of NH4+—N concentration showed a gentle fluctuation, and the average NH4+—N concentrations were CK < UI < CSF < U < OCF. The OCF treatment was found to be significantly (p < 0.05) different from all the other four treatments in the average NH4+—N concentrations. The NH4+—N concentrations in surface water of all N—fertilizer treatments exhibited an increase–decrease trend after applying TF and PIF, respectively. At the TF stage, the peak values of all N—fertilizer treatments occurred from Day 3 to Day 5 after fertilizer application (i.e., from 16 to 18 June 2021). The average NH4+−N concentrations were CK < UI < U < OCF < CSF. The CSF, OCF, and U treatments had significant (p < 0.05) differences with UI and CK treatments, respectively. At the PIF stage, the peak values of all N—fertilizer treatments occurred from Day 1 to Day 5 after fertilizer application (i.e., from 10 to 14 August 2021), and the average NH4+—N concentrations were CK < UI < OCF< CSF < U. The difference in the average NH4+—N concentrations between CK and all N—fertilizer treatments was significant (p < 0.05) (Table 2).
For all N—fertilizer treatments, the concentrations of both NO2—N and NO3−N in surface water were decreased gradually over time in all N-fertilizer treatments at the BF stage (Figure 2b,c). At the BF stage, the average NO2—N and NO3—N concentrations in all N—fertilizer treatments were higher than CK. At TF and PIF stages, both NO2—N and NO3—N concentrations in surface water of most N—fertilizer treatments (except UI) had an increase–decrease trend, which was the same as NH4+—N. As shown in Table 2, the U, CSF, and OCF treatments at the TF stage had significantly (p < 0.05) higher average NO2—N and NO3—N concentrations than UI and CK treatments, respectively (Table 2). At the PIF stage, the average concentrations of both NO2—N and NO3—N followed the order of CK < UI < OCF < CSF < U, respectively. Therein, the U and CSF treatments of average NO2—N and NO3—N concentrations were significantly (p < 0.05) greater than UI and CK, respectively.
The variation trend of TN concentrations in surface water of all treatments was consistent with NH4+—N during the entire rice—growing season (Figure 2d). The peak values of all N-fertilizer treatments occurred from Day 0 to Day 7 after TF application (i.e., from 13 to 20 June 2021) and on Day 1 after PIF application (i.e., 10 August 2021). At the BF stage, the highest average TN concentration was found in UI treatment in surface water, followed by CSF, OCF, U, and CK treatments. At the TF stage, the average TN concentrations were CK < U < CSF< OUF < UI (Table 2). The highest average TN concentrations at both BF and TF stages were observed in UI treatment, and the differences between UI and the other four treatments were significant (p < 0.05). At the PIF stage, the average TN concentrations were CK < OCF < CSF< U < UI; therein, UI treatment had higher average TN conventions than CK and OCF, respectively.

3.3. Concentrations of PO43−—P and TP in Surface Water

The change trends of PO43−—P concentrations in surface water of all N—fertilizer treatments are shown in Figure 3a. At the BF stage, the changes in PO43−—P concentrations in UI and OCF treatments were greatly influenced compared with U and CSF, respectively. At both BF and TF stages, the average PO43−—P concentrations were CK < CSF < U < OCF < UI, and the UI and OCF treatments had significant (p < 0.05) differences with U, CSF, and CK treatments, respectively. At the PIF stage, the UI treatment (0.19 ± 0.16 mg/L) had a significant (p < 0.05) higher average PO43−—P concentration compared with OCF (0.11 ± 0.12 mg/L), U (0.07 ± 0.07 mg/L), and CK (0.07 ± 0.08 mg/L), respectively. During the entire rice-growing season, all N-fertilizer treatments had higher TP concentrations than CK in surface water (Figure 3b). At the BF stage, the highest average TP concentration was observed in UI treatment, followed by OCF, U, CSF, and CK treatments, and the UI treatment was found to be significantly different (p < 0.05) from all the other four treatments. At both TF and PIF stages, the average TP concentrations were all CK < CSF < OCF < U < UI. The average TP concentration in the surface water of UI treatment (0.98 ± 1.01 mg/L) at the TF stage was significantly (p < 0.05) increased with CSF (0.31 ± 0.23 mg/L), OCF (0.46 ± 0.49 mg/L) and CK (0.25 ± 0.22 mg/L), respectively.

3.4. Correlation Analysis between N and P in Surface Water of Saline-Alkali Paddy Fields

During the entire rice−growing season, the correlation coefficients between EC, pH, and the concentrations of various N and P forms in surface water were changed by applying different N fertilizers in saline-alkali paddy fields, and some directions were converted (Figure 4). Moreover, the positive correlation intensity between pH and EC in all N-fertilizer treatments was increased compared with CK. The negative correlation intensity between pH and TP was reduced. Compared with CK treatment, the negative correlation between EC and NH4+—N concentration was converted to a positive correlation by different N-fertilizer applications, with the intensities of UI < OCF < U < CSF. There was a positive correlation between NH4+—N and TN concentrations in all treatments, with UI < CK < U < OCF < CSF intensities. Compared with CK treatment, the negative correlation between NO2—N and NO3—N concentrations was turned into a positive correlation by applying different N fertilizers, with the intensities of UI < OCF < U < CSF. There was a positive correlation between NO3—N and PO43−—P concentrations with UI < CSF < CK < OCF <U intensities. The positive correlation intensities between PO43−—P and TP concentrations were CK < U < CSF < OCF < UI.
The results of PCA clearly showed the variations in EC, pH, and various N and P forms in surface water of saline-alkali paddy ecosystems with different N—fertilizer applications, and the first and second principal components jointly explained 41.9–52.8% (Figure 5). In the first and second principal components, for CK treatment (Figure 5a), there was a higher correlation between pH and NO2—N compared with the other indices, while EC had a higher correlation with TN. For U treatment (Figure 5b), pH had a higher correlation with NO2—N, NO3—N, and PO43−—P, while EC had a higher correlation with NH4+—N, TN, and TP, respectively. For UI treatment (Figure 5c), pH had no higher correlation with all indices, while EC had a higher correlation with NH4+—N and TN. For OCF treatment (Figure 5d), pH and EC had higher correlations with NH4+—N, NO2—N, and TN, respectively. For CSF treatment (Figure 5e), pH had a higher correlation with NO2—N and NO3—N, while EC had a higher correlation with NH4+—N, TN, PO43—P, and TP.

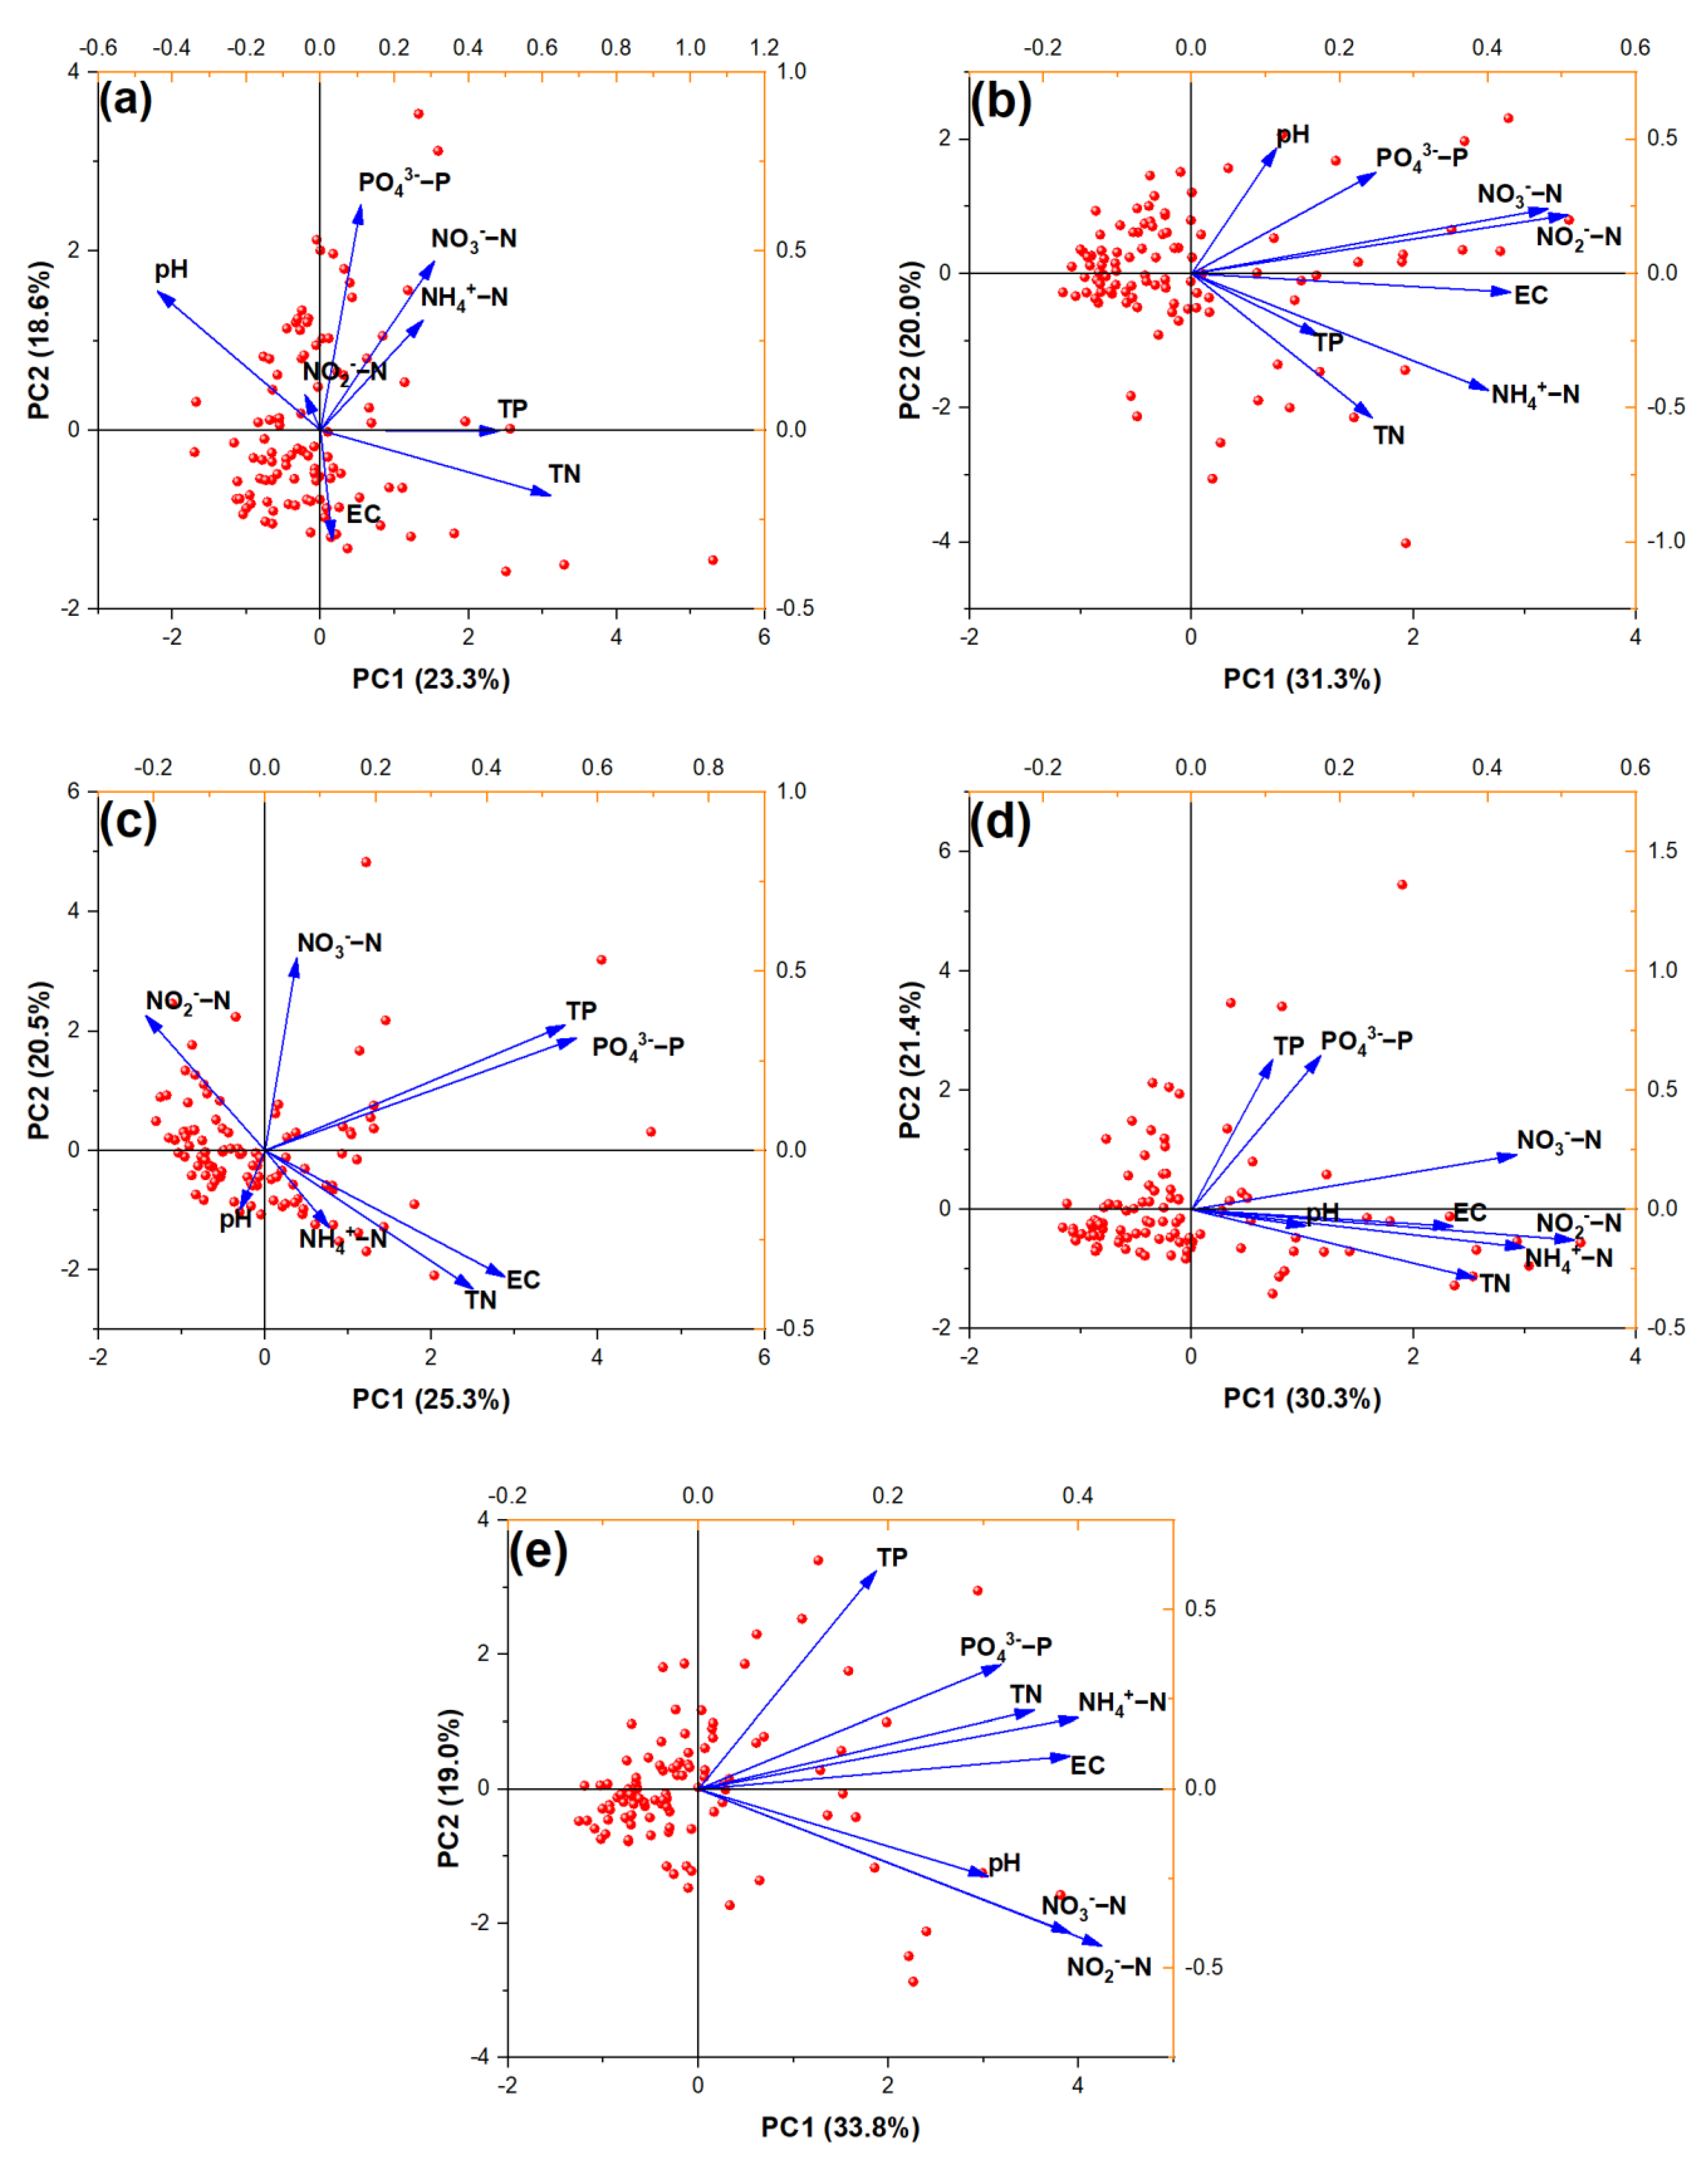
3.5. Multiple Interaction Pathways among NH4+-N, TN, and Physiochemical Parameters

To further understand causal relationships among NH4+—N, TN, and physiochemical parameters in surface water of saline-alkali paddy fields during the entire rice—growing season, regardless of the N—fertilizer types, the interaction model among detected factors was established (Figure 6). Based on the SEMs, pH presented a significant negative influence on NH4+—N (β = −2.054, p < 0.01) and TP (β = −0.151, p < 0.05), respectively. On the other hand, a significant positive influence was observed on NO2−—N (β = 0.177, p < 0.01) and PO43−—P (β = 0.084, p < 0.05). For EC, a significant positive influence was observed on NH4+—N (β = 1.652, p < 0.001), NO2—N (β = 0.143, p < 0.001), TN (β = 19.172, p < 0.001), PO43−—P (β = 0.079, p < 0.001), and TP (β = 0.087, p < 0.01), respectively, while a significant negative influence (β = −0.148, p < 0.001) was observed on NO3—N. For NH4+—N, there was a significant positive influence (β = 3.366, p < 0.001) on TN. The NO2—N had a significant positive influence (β = 2.144 and 1.285, p < 0.001) on NH4+-N and NO3—N, while a significant negative influence on PO43−—P (β = −0.128, p < 0.001) and TP (β = −0.141, p < 0.05), respectively. For NO3-N, there was a significant positive pathway on NH4+—N (β = 0.667, p < 0.05), PO43−—P (β = 0.078, p < 0.001), and TP (β = 0.057, p < 0.05), respectively. The PO43−-P presented a significant positive influence (β = 1.151, p < 0.001) on TP. Meanwhile, TP had a significant positive (β = 0.954, p < 0.05) pathway on NH4+—N.

4. Discussion

The runoff caused by drainage is one of the ways of nutrient (e.g., N and P) loss during the rice-growing season [15,16]. The main reason for agricultural nonpoint source pollution is N and P returning to the surface water with runoff [9]. The N and P concentrations in the surface water of paddy fields determine the nutrient supply level of rice growth [17,18]. The paddy field is in the state of soaking for a long time after fertilization. During rainfall and/or over−irrigation, the surface water in paddy fields is usually discharged randomly, which not only causes the runoff loss of nutrients but also increases the potential risk of agricultural nonpoint source pollution [5,19,20,21]. Thus, the study on the dynamic characteristics of N and P in surface water is significant for clarifying the law of N and P runoff losses in paddy fields to protect the surface water environment.
The dynamic changes in N and P concentrations in surface water of paddy fields can reflect the adsorption and/or fixed saturation of nutrients by the paddy soil [22]. Most N fertilizers are easily transported to adjacent water bodies with rainfall and/or artificial irrigation runoff due to their high solubility in flooded paddy fields. Based on statistical data, about 7% of the N fertilizer utilized within Chinese agricultural practices is lost via surface runoff and subsurface leaching [23]. In addition, the concentrations of TP and PO43−−P in surface runoff were significantly correlated with the respective P forms in the field ponding water [24]. Therefore, the N and P concentrations in surface water can reflect the potential of nutrient loss from paddy fields. Fertilizers are the main source of N and P in the surface water of paddy fields. During the initial stage of fertilization, the N and P losses in paddy fields are significantly higher than those in unfertilized fields [9]. In this study, after just fertilization, regardless of the fertilization stages, the concentrations of various N and P forms in the surface water of paddy fields were increased compared with CK (Figure 2 and Figure 3), indicating a potential risk of nutrient loss at the beginning of each fertilization stage. Application of suitable fertilizer types, reasonable control of fertilization amount, and improvement of the fertilizer utilization rate of crops are necessary measures to reduce nutrient loss via runoff in paddy fields [25,26,27]. Moreover, as the fertilizers with the largest amount, the rational selection of N−fertilizer types is the key to controlling the N loss via runoff in paddy fields [25]. Due to the physiological response of plants, the supply of N can increase the absorption and utilization of P by plants [28]. NH4+−N can promote the absorption of P by rice and the transport of P to the aboveground tissues, while the P absorbed by rice is mainly accumulated in the root system when NO3−N is applied [28]. Thus, the selection of N fertilizer also plays an important role in improving the P absorption capacity of crops and avoiding the risk of P runoff loss in paddy fields. Compared with non−saline-alkali paddy fields, the soil physicochemical properties and biological processes of saline-alkali paddy fields are vulnerable to the negative effects of high salinity and pH, resulting in more nutrient loss via runoff [29,30]. The interaction and relationship between N and P in the surface water of saline-alkali paddy fields are also influenced by the N—fertilizer types (Figure 4 and Figure 5). Therefore, selecting the appropriate N fertilizer for application is the key to controlling the N and P losses via runoff in saline-alkali paddy fields.
The concentrations of various N forms in the surface water of saline-alkali paddy fields were normally high in the initial stage of each fertilization stage and gradually decreased to a low value by the end of each fertilization stage, regardless of the types of N fertilizer applied (Figure 2). This result is almost similar to Xue et al. [21], who reported the highest N concentration mainly occurred from Day 0 to Day 10 after applying N fertilizers and then declined to a low value after 10 days. Both NH4+−N and NO3−N are the main forms of N loss via runoff in paddy fields, which are the available N that can be directly used by rice [8,17]. The concentrations of both NH4+−N and NO3−N in the surface water of paddy fields are affected by the N−fertilizer types, which can affect the N content of rice growth supplied by paddy soil. For the UI treatment of this study, the application of UI can inhibit the U hydrolysis and promote crop growth [31,32]; thus, the average NH4+—N concentration in surface water of UI treatment at each fertilization stage was observed to be lower than U treatment (Figure 2a). At both TF and PIF stages, the average NO3—N concentrations in UI treatment were significantly (p < 0.05) reduced compared with U (Figure 2c). These results suggested that the potential risks of NH4+−N and NO3−N runoff losses in saline-alkali paddy fields can be effectively controlled by the addition of inhibitors. Meanwhile, the concentrations of NO3−N in OCF and CSF treatments at the initial stage of topdressing (i.e., on Day 0 to Day 20 of TF and PIF stages) were lower than U, and the average NO3−N concentrations in OCF and CSF treatments at both TF and PIF stages were reduced compared with U (Figure 2c). Furthermore, both CSF and OCF applications significantly (p < 0.05) decreased the average NO3−N concentrations in surface water at the PIF stage, which proved that both OCF and CSF have the potential to reduce the risk of NO3−N runoff loss in saline-alkali paddy fields at the PIF stage.
TN is the sum of soluble−N and granular−N in the surface water of paddy fields, so the TN loss via runoff is the largest among different N forms [8]. Effectively controlling the TN runoff loss is one of the main tasks to effectively control the N loss in paddy fields. The TN concentration in the surface water of paddy fields is affected by N−fertilizer types, fertilization methods and fertilizing times, etc. [9,33]. In this study, regardless of N−fertilizer types, the average TN concentration at the BF stage by the deep placement of N fertilizer was lower than those at topdressing stages (i.e., TF and PIF stages) using the throwing method (Figure 2d). This result revealed that the deep placement of N fertilizers can effectively control TN loss via runoff in paddy fields, which was consistent with Min et al. [33]. Regardless of fertilization stages, the application of UI increased the average TN concentration compared with all the other treatments (Figure 2d). However, the average NH4+−N, NO2—N, and NO3−N concentrations in surface water of UI treatment were all lower than all the other N-fertilizer treatments at the topdressing stages (Figure 2a–c). These results indicated that the UI addition can increase the risk of TN runoff loss in saline-alkali paddy fields, and organic-N accounted for the main contribution. The reasons for these results may be as follows: (1) for UI treatment, the urease inhibitor (i.e., NBPT) can effectively inhibit the hydrolysis of U and control the speed of U conversion to NH4+—N, so the U as organic—N remains in the soil may be directly dissolved in surface water of paddy fields [31,32]; (2) after the nitrification process was inhibited by the nitrification inhibitor (i.e., DMPP) in UI treatment, U can remain in the paddy soil in the form of NH4+-N for a long time, avoiding the appearance of high NO2−N and NO3−N concentrations, and reducing the runoff losses of both NO2−N and NO3−N [34,35]; (3) the addition of inhibitors reduces the activity of relevant functional microorganisms (e.g., nitrifying bacteria) and enzymes (e.g., urease), and even leads to their death [35,36], which may cause the increase in organic−N in saline-alkali paddy fields. Therefore, although the UI application can effectively control the risk of inorganic-N (i.e., NH4+−N, NO2—N, and NO3—N) loss via runoff, there is a serious potential risk of TN runoff loss.
The loss of P, which is one of the necessary nutrients for rice growth, occurs mainly in the form of dissolved P via surface runoff in paddy fields [37]. The PO43−−P and TP concentrations in the surface water of saline-alkali paddy fields showed remarkable variation among the different N-fertilizer treatments (Figure 3). Regardless of the fertilization stages, the average PO43−−P and TP concentrations in the surface water of UI treatment were also higher than all the other N-fertilizer treatments (Figure 3), which was consistent with the result of TN (Figure 2d). Based on the SEMs, both PO43−—P and TP concentrations in surface water had a positive influence on TN concentration regardless of N−fertilizer types applied at the BF stage (Figure 6). Meanwhile, the TN concentration in the surface water of UI treatment positively correlated with TP (Figure 4c). These results indicated that the UI application also has the potential risk of P loss via surface runoff in saline-alkali paddy fields. The PO43−—P and TP concentrations in surface water can promote the increase in TN concentration, thus simultaneously causing the risk of TN runoff loss. For OCF treatment, the average PO43−—P and TP concentrations were decreased with increasing fertilization times. Therein, the average TP concentration in OCF treatment at the BF stage was higher than U, while the average TP concentrations at TF and PIF stages were lower than U. These results indicated that the application of OCF can increase the P concentration in surface water of saline-alkali paddy fields in the early rice-growing season and generate a potential risk of P runoff loss, which are similar to the results of Zanon et al. [16] and Cui et al. [9]. For CSF treatment, the application of CSF can control the dissolution rate of nutrients so that the nutrient release rate of fertilizer is consistent with the nutrient absorption law of crops, thus improving crop nutrient use efficiency and reducing the risk of nutrient loss [38,39]. In this study, regardless of the fertilization stages, the average TP concentration in CSF treatment was reduced compared with U (Figure 3b), indicating that CSF can control the potential risk of P runoff loss in saline-alkali paddy fields. In summary, CSF is a better choice for avoiding the potential risk of P loss via runoff in saline-alkali paddy fields during the entire rice—growing season, but UI should not be suggested for the control of P runoff loss.

5. Conclusions

This study investigated the dynamic characteristics of different forms of N and P concentrations in surface water of saline-alkali paddy fields under different N−fertilizer applications and revealed their potential risk of nutrient loss via runoff. Based on the SEMs, there was a direct and/or indirect relationship among various forms of N and P in saline-alkali paddy fields. The N-fertilizer types can affect the interaction and relationship between N and P in the surface water of saline-alkali paddy fields, resulting in different potential risks of N and P losses via surface runoff. Comprehensively considering the average concentrations and variation laws of N and P in each fertilization stage, the application of UI can effectively control the potential risks of NH4+—N and NO3—N losses via surface runoff, but increase the risks of TN and TP losses, indicating that UI is not suitable in saline-alkali paddy fields for controlling nutrient loss via runoff. The OCF application increased the N and P concentrations in surface water of saline-alkali paddy fields at the BF stage, thus enhancing the potential risk of nutrient loss via surface runoff compared with U. Meanwhile, OCF had a good potential to control N and P runoff losses at PIF stage. CSF is a good choice to control the risk of TP loss via runoff in saline-alkali paddy fields regardless of the fertilization stages and has an effective potential for controlling the risk of N runoff loss at the PIF stage.

Supplementary Materials

The following supporting information can be downloaded at https://www.mdpi.com/article/10.3390/su15097040/s1, Table S1: The physical and chemical properties of saline-alkali soil used in this study.

Author Contributions

Conceptualization, J.L., X.W. and Y.X.; methodology, J.L., X.W. and Y.X.; formal analysis, J.L. and X.W.; investigation, J.L., X.W. and S.H.; resources, H.Z. and Y.X.; writing—original draft preparation, J.L. and X.W.; writing—review and editing, Y.X. and A.Z.; supervision, H.Z.; project administration, Y.X.; funding acquisition, H.Z. All authors have read and agreed to the published version of the manuscript.

Funding

This study was supported by the Excellent Youth Foundation of Jilin Province, China (No. 20230101361JC), the Strategic Priority Research Program of the Chinese Academy of Sciences (No. XDA28040102), the CAS Interdisciplinary Innovation Team Project (No. JCTD-2020-14), and the Youth Innovation Promotion Association, CAS (No. 2017274 and No. Y2021068).

Institutional Review Board Statement

Not applicable.

Informed Consent Statement

Not applicable.

Data Availability Statement

Data is available on request.

Acknowledgments

We would like to thank the editors and reviewers for their helpful comments and suggestions.

Conflicts of Interest

The authors declare no conflict of interest.

References

  1. Chi, C.M.; Zhao, C.W.; Sun, X.J.; Wang, Z.C. Reclamation of saline-sodic soil properties and improvement of rice (Oriza sativa L.) growth and yield using desulfurized gypsum in the west of Songnen Plain, northeast China. Geoderma 2012, 187-188, 24–30. [Google Scholar] [CrossRef]
  2. Huang, L.H.; Liang, Z.W.; Suarez, D.L.; Wang, Z.C.; Wang, M.M.; Yang, H.Y.; Liu, M. Impact of cultivation year, nitrogen fertilization rate and irrigation water quality on soil salinity and soil nitrogen in saline-sodic paddy fields in Northeast China. J. Agric. Sci. 2015, 154, 632–646. [Google Scholar] [CrossRef]
  3. FAO. FAO FAOSTAT. 2017. Available online: http://www.fao.org/faostat/en/#home (accessed on 7 February 2023).
  4. Ju, X.T.; Xing, G.X.; Chen, X.P.; Zhang, S.L.; Zhang, L.J.; Liu, X.J.; Cui, Z.L.; Yin, B.; Christie, P.; Zhu, Z.L.; et al. Reducing environmental risk by improving N management in intensive Chinese agricultural systems. Proc. Natl. Acad. Sci. USA 2009, 106, 3041–3046. [Google Scholar] [CrossRef] [PubMed]
  5. Zhang, S.; Zhang, G.; Wang, D.; Liu, Q.; Xu, M. Investigation into runoff nitrogen loss variations due to different crop residue retention modes and nitrogen fertilizer rates in rice-wheat cropping systems. Agric. Water Manag. 2021, 247, 106729. [Google Scholar] [CrossRef]
  6. Zhao, Z.; Cao, L.; Sha, Z.; Deng, J.; Lv, W. Impacts of fertilization optimization on N loss from paddy fields: Observations and DNDC modeling case study in Shanghai, China. Soil Tillage Res. 2020, 199, 104587. [Google Scholar] [CrossRef]
  7. Xiang, C.; Wang, Y.; Liu, H. A scientometrics review on nonpoint source pollution research. Ecol. Eng. 2017, 99, 400–408. [Google Scholar] [CrossRef]
  8. Xu, Y.; Su, B.; Wang, H.; He, J.; Yang, Y. Analysis of the water balance and the nitrogen and phosphorus runoff pollution of a paddy field in situ in the Taihu Lake basin. Paddy Water Environ. 2020, 18, 385–398. [Google Scholar] [CrossRef]
  9. Cui, N.; Cai, M.; Zhang, X.; Abdelhafez, A.A.; Zhou, L.; Sun, H.; Chen, G.; Zou, G.; Zhou, S. Runoff loss of nitrogen and phosphorus from a rice paddy field in the east of China: Effects of long-term chemical N fertilizer and organic manure applications. Glob. Ecol. Conserv. 2020, 22, e01011. [Google Scholar] [CrossRef]
  10. Liu, Z.; Shang, H.; Han, F.; Zhang, M.; Li, Q.; Zhou, W. Improvement of nitrogen and phosphorus availability by Pseudoalteromonas sp. during salt-washing in saline-alkali soil. Appl. Soil Ecol. 2021, 168, 104117. [Google Scholar] [CrossRef]
  11. Liu, J.; Ouyang, X.; Shen, J.; Li, Y.; Sun, W.; Jiang, W.; Wu, J. Nitrogen and phosphorus runoff losses were influenced by chemical fertilization but not by pesticide application in a double rice-cropping system in the subtropical hilly region of China. Sci. Total Environ. 2020, 715, 136852. [Google Scholar] [CrossRef]
  12. Hou, X.; Zhou, F.; Leip, A.; Fu, B.; Yang, H.; Chen, Y.; Gao, S.; Shang, Z.; Ma, L. Spatial patterns of nitrogen runoff from Chinese paddy fields. Agr. Ecosyst. Environ. 2016, 231, 246–254. [Google Scholar] [CrossRef]
  13. Ruan, S.; Zhuang, Y.; Zhang, L.; Li, S.; Chen, J.; Wen, W.; Zhai, L.; Liu, H.; Du, Y. Improved estimation of nitrogen dynamics in paddy surface water in China. J. Environ. Manag. 2022, 312, 114932. [Google Scholar] [CrossRef] [PubMed]
  14. Zhao, Z.; Yue, Y.; Sha, Z.; Li, C.; Deng, J.; Zhang, H.; Gao, M.; Cao, L. Assessing impacts of alternative fertilizer manage-ment practices on both nitrogen loading and greenhouse gas emissions in rice cultivation. Atmos. Environ. 2015, 119, 393–401. [Google Scholar] [CrossRef]
  15. Yu, Y.; Xu, J.; Zhang, P.; Meng, Y.; Xiong, Y. Controlled irrigation and drainage reduce rainfall runoff and nitrogen loss in paddy fields. Int. J. Environ. Res. Public Health 2021, 18, 3348. [Google Scholar] [CrossRef]
  16. Zanon, J.A.; Favaretto, N.; Democh Goularte, G.; Dieckow, J.; Barth, G. Manure application at long-term in no-till: Effects on runoff, sediment and nutrients losses in high rainfall events. Agric. Water Manag. 2020, 228, 105908. [Google Scholar] [CrossRef]
  17. Ishii, S.; Ikeda, S.; Minamisawa, K.; Senoo, K. Nitrogen cycling in rice paddy environments: Past achievements and future challenges. Microbes Environ. 2011, 26, 282–292. [Google Scholar] [CrossRef] [PubMed]
  18. Wang, K.; Onodera, S.-i.; Saito, M.; Okuda, N.; Okubo, T. Estimation of phosphorus transport influenced by climate change in a rice paddy catchment using SWAT. Int. J. Environ. Res. 2021, 15, 759–772. [Google Scholar] [CrossRef]
  19. Peng, S.; Yang, S.; Xu, J.; Gao, H. Field experiments on greenhouse gas emissions and nitrogen and phosphorus losses from rice paddy with efficient irrigation and drainage management. Sci. China Technol. Sci. 2011, 54, 1581–1587. [Google Scholar] [CrossRef]
  20. Sun, C.; Chen, L.; Zhu, H.; Xie, H.; Qi, S.; Shen, Z. New framework for natural-artificial transport paths and hydrological connectivity analysis in an agriculture-intensive catchment. Water Res. 2021, 196, 117015. [Google Scholar] [CrossRef]
  21. Xue, L.; Yu, Y.; Yang, L. Maintaining yields and reducing nitrogen loss in rice–wheat rotation system in Taihu Lake region with proper fertilizer management. Environ. Res. Lett. 2014, 9, 115010. [Google Scholar] [CrossRef]
  22. Zhang, Q.; Fang, L.; Jian, Z.; Ling, M. Changes in concentrations of N and P in surface water of paddy field and its pollution assessment in Karst Hilly Areas. Chin. Agric. Sci. Bull. 2021, 28, 63–67. [Google Scholar]
  23. Zhu, Z.; Sun, B. Study on the agricultural non-point pollution control in China. Environ. Prot. 2008, 8, 4–6. [Google Scholar]
  24. Liu, J.; Zuo, Q.; Zhai, L.; Luo, C.; Liu, H.; Wang, H.; Liu, S.; Zou, G.; Ren, T. Phosphorus losses via surface runoff in rice-wheat cropping systems as impacted by rainfall regimes and fertilizer applications. J. Integr. Agric. 2016, 15, 667–677. [Google Scholar] [CrossRef]
  25. Hou, P.; Jiang, Y.; Yan, L.; Petropoulos, E.; Wang, J.; Xue, L.; Yang, L.; Chen, D. Effect of fertilization on nitrogen losses through surface runoffs in Chinese farmlands: A meta-analysis. Sci. Total. Environ. 2021, 793, 148554. [Google Scholar] [CrossRef] [PubMed]
  26. Husain, A.; Muneer, M.A.; Wu, F.; Yin, G.-F.; Shen, S.Z.; Wang, F.; Li, Y.; Zhang, K.-Q. Application of optimum N through different fertilizers alleviate NH4+-N, NO3-N and total nitrogen losses in the surface runoff and leached water and improve nitrogen use efficiency of rice crop in Erhai Lake Basin, China. Commun. Soil Sci. Plan. 2019, 50, 716–738. [Google Scholar] [CrossRef]
  27. Shi, X.; Hu, K.; Batchelor, W.D.; Liang, H.; Wu, Y.; Wang, Q.; Fu, J.; Cui, X.; Zhou, F. Exploring optimal nitrogen management strategies to mitigate nitrogen losses from paddy soil in the middle reaches of the Yangtze river. Agric. Water Manag. 2020, 228, 105877. [Google Scholar] [CrossRef]
  28. Li, B.; Wang, S.; Feng, H.; Xu, G. Effects of nitrogen forms on root morphology and phosphate uptake in rice. Chin. J. Rice Sci. 2008, 22, 665–668. [Google Scholar]
  29. She, D.; Fei, Y.; Liu, Z.; Liu, D.; Shao, G. Soil erosion characteristics of ditch banks during reclamation of a saline/sodic soil in a coastal region of China: Field investigation and rainfall simulation. Catena 2014, 121, 176–185. [Google Scholar] [CrossRef]
  30. Yuan, R.X.; Ye, J.Q.; Wang, Z.H.; Liu, J.S. Dynamic variation characteristics of phosphorus in paddy field runoff in saline land and its potential environmental effect. Meteorol. Environ. Res. 2011, 2, 72–75. [Google Scholar]
  31. Cantarella, H.; Otto, R.; Soares, J.R.; Silva, A.G.B. Agronomic efficiency of NBPT as a urease inhibitor: A review. J. Adv. Res. 2018, 13, 19–27. [Google Scholar] [CrossRef]
  32. Yang, G.; Ji, H.; Sheng, J.; Zhang, Y.; Feng, Y.; Guo, Z.; Chen, L. Combining Azolla and urease inhibitor to reduce ammonia volatilization and increase nitrogen use efficiency and grain yield of rice. Sci. Total Environ. 2020, 743, 140799. [Google Scholar] [CrossRef] [PubMed]
  33. Min, J.; Sun, H.; Wang, Y.; Pan, Y.; Kronzucker, H.J.; Zhao, D.; Shi, W. Mechanical side-deep fertilization mitigates ammonia volatilization and nitrogen runoff and increases profitability in rice production independent of fertilizer type and split ratio. J. Clean. Prod. 2021, 316, 128370. [Google Scholar] [CrossRef]
  34. Li, H.; Chen, X.; Liu, C.; Wang, S.; Guo, B.; Li, N.; Jin, Y.; Fu, Q.; Liang, X. Effect of various doses of 3,4-dimethylpyrazole phosphate on mineral nitrogen losses in two paddy soils. J. Soils Sediments 2020, 20, 3825–3834. [Google Scholar] [CrossRef]
  35. Liu, C.; Zhang, Y.; Liu, H.; Liu, X.; Ren, D.; Wang, L.; Guan, D.; Li, Z.; Zhang, M. Fertilizer stabilizers reduce nitrous oxide emissions from agricultural soil by targeting microbial nitrogen transformations. Sci. Total Environ. 2022, 806, 151225. [Google Scholar] [CrossRef] [PubMed]
  36. Florio, A.; Maienza, A.; Dell’Abate, M.T.; Stazi, S.R.; Benedetti, A. Changes in the activity and abundance of the soil microbial community in response to the nitrification inhibitor 3,4-dimethylpyrazole phosphate (DMPP). J. Soils Sediments 2016, 16, 2687–2697. [Google Scholar] [CrossRef]
  37. Zhang, H.; Cao, Z.; Wang, G.; Zhang, H.; Wong, M.H. Winter runoff losses of phosphorus from paddy soils in the Taihu Lake Region of South China. Chemosphere 2003, 52, 1461–1466. [Google Scholar] [CrossRef] [PubMed]
  38. Bakshi, S.; Banik, C.; Laird, D.A.; Smith, R.; Brown, R.C. Enhancing biochar as scaffolding for slow release of nitrogen fertilizer. ACS Sustain. Chem. Eng. 2021, 9, 8222–8231. [Google Scholar] [CrossRef]
  39. Jien, S.-H.; Wang, C.-C.; Lee, C.-H.; Lee, T.-Y. Stabilization of organic matter by biochar application in compost-amended soils with contrasting pH values and textures. Sustainability 2015, 7, 13317–13333. [Google Scholar] [CrossRef]
Figure 1. The EC (a) and pH (b) values in surface water of different N−fertilizer treatments during the rice-growing season. BF (blue background): basal fertilizer stage; TF (yellow background): tillering fertilizer stage; PIF (green background): panicle-initiation fertilizer stage. Data presented as mean ± standard deviation (n = 3).
Sustainability 15 07040 g001
Figure 2. Concentrations of NH4+—N (a), NO2—N (b), NO3—N (c), and TN (d) in surface water of saline-alkali paddy fields with different N-fertilizer treatments during the rice-growing season. BF (blue background): basal fertilizer stage; TF (yellow background): tillering fertilizer stage; PIF (green background): panicle—initiation fertilizer stage. Data presented as mean ± standard deviation (n = 3).
Sustainability 15 07040 g002
Figure 3. Concentrations of PO43−—P (a) and TP (b) in surface water of different N—fertilizer treatments during the rice-growing season. BF (blue background): basal fertilizer stage; TF (yellow background): tillering fertilizer stage; PIF (green background): panicle—initiation fertilizer stage. Data presented as mean ± standard deviation (n = 3).
Sustainability 15 07040 g003
Figure 4. Correlations of pH, EC, and various forms of N and P in surface water of saline-alkali paddy fields with different N-fertilizer applications ((a): CK, (b): U, (c): UI, (d): OCF, and (e): CSF) during the entire rice—growing season (n = 102). * and ** represent significance at p < 0.05 and 0.01, respectively.
Sustainability 15 07040 g004
Figure 5. Principal component analysis (PCA) of N and P indices in surface water of saline-alkali paddy fields with different N-fertilizer application ((a): CK, (b): U, (c): UI, (d): OCF, and (e): CSF) during the entire rice—growing season (n = 102).
Sustainability 15 07040 g005
Figure 6. Simplified structural equation models (SEMs) representing hypothesized causal relationships among NH4+—N, TN, and physiochemical parameters in surface water of saline-alkali paddy fields during the entire rice-growing season. *, ** and *** represent the significant levels of p < 0.05, 0.01, and 0.001, respectively. Chi-Square: the difference between the expected covariance matrix and the covariance matrix of the data; P: the significance of fit index; GFI: the goodness of fit index; CFI: the Bentler’s comparative fit index; RMSEA: the root mean square error of approximation. The numbers on the arrows indicate the strength of the relationships between variables and are used to analyze causal relationships.
Sustainability 15 07040 g006
Table 1. Application of N fertilizer at different stages in each treatment.
TreatmentsBasal Fertilizer Stage (BF)Tillering Fertilizer Stage (TF)Panicle-Initiation Fertilizer Stage (PIF)Total N Amount
(kg N/ha)
N-Fertilizer TypesAmount
(kg N/ha)
Other N SourceAmount
(kg N/ha)
N-Fertilizer TypesAmount
(kg N/ha)
N-Fertilizer TypesAmount
(kg N/ha)
CKAmmonium phosphate (18% N and 46% P2O5)27.4027.40
UUrea (46%)72.6027.40Urea60Urea40200
UIUrea (46%) with 1% NBPT and 1% DMPP72.6027.40Urea60Urea40200
OCFOrganic–inorganic compound fertilizer (12% N and 3% K2O)72.6027.40Urea60Urea40200
CSFC-based slow-release fertilizer (N:P2O5:K2O = 24:8:10)83.5016.50Urea60Urea40200
Table 2. The average concentrations of various N forms in surface water of saline-alkali paddy fields with different N fertilizers.
TreatmentsN FormsBF Stage (mg/L)TF Stage (mg/L)PIF Stage (mg/L)
CKNH4+—N0.38 ± 0.310.21 ± 0.170.16 ± 0.22
NO2—N0.03 ± 0.040.07 ± 0.070.07 ± 0.08
NO3—N1.26 ± 0.950.58 ± 0.550.44 ± 0.26
TN3.62 ± 1.413.44 ± 1.804.51 ± 4.13
UNH4+—N1.09 ± 0.884.22 ± 5.606.29 ± 11.32
NO2—N0.06 ± 0.071.10 ± 1.270.27 ± 0.44
NO3—N1.44 ± 1.122.11 ± 1.871.26 ± 1.23
TN6.16 ± 2.9545.58 ± 47.2652.40 ± 109.58
UINH4+—N0.60 ± 0.341.11 ± 0.834.73 ± 6.43
NO2—N0.06 ± 0.100.12 ± 0.160.11 ± 0.14
NO3—N1.62 ± 1.610.53 ± 0.520.62 ± 0.34
TN15.02 ± 12.20125.89 ± 149.8663.32 ± 98.96
OCFNH4+—N1.93 ± 1.714.55 ± 5.935.77 ± 8.42
NO2—N0.08 ± 0.100.81 ± 1.100.19 ± 0.20
NO3—N1.53 ± 1.561.37 ± 1.340.83 ± 0.60
TN6.63 ± 4.8349.54 ± 54.5628.31 ± 45.80
CSFNH4+—N0.89 ± 0.664.49 ± 5.886.15 ± 10.96
NO2—N0.09 ± 0.100.59 ± 0.580.22 ± 0.22
NO3—N1.88 ± 1.641.63 ± 1.940.91 ± 0.55
TN8.77 ± 4.7346.85 ± 54.6032.15 ± 71.15
Disclaimer/Publisher’s Note: The statements, opinions and data contained in all publications are solely those of the individual author(s) and contributor(s) and not of MDPI and/or the editor(s). MDPI and/or the editor(s) disclaim responsibility for any injury to people or property resulting from any ideas, methods, instructions or products referred to in the content.

