Article

Mitigating Low-Frequency Oscillations and Enhancing the Dynamic Stability of Power System Using Optimal Coordination of Power System Stabilizer and Unified Power Flow Controller

1
Department of Electrical and Computer Engineering, Dilla University, Dilla P.O. Box 419, Ethiopia
2
Department of Electrical and Computer Engineering, Hawassa University, Hawassa P.O. Box 5, Ethiopia
3
Engineering Research and Innovation Group, Universidad Internacional Iberoamericana, Campeche C.P. 24560, Mexico
4
Department of Project Management, Universidad Internacional Iberoamericana, Campeche C.P. 24560, Mexico
5
College of Engineering and Technology, American University of the Middle East, Egaila 54200, Kuwait
6
Department of Electrical and Electronic Engineering Technology, Faculty of Engineering and the Built Environment, University of Johannesburg, Johannesburg P.O. Box 524, South Africa
7
Power System Planning Division, Rajasthan Rajya Vidyut Prasaran Nigam Ltd., Jaipur 302005, India
8
Department of Project Management, Universidad Europea del Atlántico, C/Isabel Torres 21, 39011 Santander, Spain
9
Department of Project Management, Fundación Universitaria Internacional de Colombia, Bogotá 111311, Colombia
*
Authors to whom correspondence should be addressed.
Sustainability 2023, 15(8), 6980; https://doi.org/10.3390/su15086980
Submission received: 20 January 2023 / Revised: 2 April 2023 / Accepted: 10 April 2023 / Published: 21 April 2023

Abstract

:
The integration of a flexible alternating current transmission system (FACTS) and a power system stabilizer (PSS) can increase dynamic stability. This paper presents the enhancement of power system dynamic stability through the optimal design of a power system stabilizer and UPFC using an ant lion optimization (ALO) technique to enhance transmission line capacity. The gained damping ratio, eigenvalue and time domain results of the suggested ALO technique were compared with a base case system, ALO-based PSS and ALO-based PSS-UPFC to test the effectiveness of the proposed system in different loading cases. Eigenvalues gained from an ant lion approach-based UPFC with a PSS and a base case system are compared to examine the robustness of the ALO method for various loading conditions. Thus, this paper addresses the mechanism regarding the power system dynamic stability of transmission lines by integrating the optimal size of a PSS and UPFC into the power system. Therefore, the main contribution of this manuscript is the optimal coordination of a power system stabilizer, power oscillation damper and unified power flow using ant lion optimization for the mitigation of low-frequency oscillation.

1. Introduction

Power system instability restricts the normal operation of a system, which influences the security and economics of the system. Furthermore, the integration of a far-end power system provides low-frequency oscillation with a frequency limit of 0.1–0.3 Hz. If the oscillations are not treated early, it will lead to system instability or complete blackout, though the expansion and application of a UPFC for a power system had exposed promising results to improve the transmission line capability. Currently, numerous FACTS devices have been presented and implemented in practical power systems, such as UPFCs and other devices. The organized application of a PSS equipped with a UPFC ensures power system stability and suppresses LFO during a disturbance. The proper amendment of PSS and UPFC parameters controls their efficacy for dynamic stability in transmission lines for power system stability [1]. Little or huge trouble in power systems affects the steady-state process of power systems and leads to system instability [2]. The key motives of system instability are the imbalance between load and generation. Currently, a large load connected to the farthest end of transmission lines enforces the transmission of a large amount of power via extended transmission lines and leads to LFO [3].
The integration of a large number of bulk renewable energy sources, along with a conventional generation system, incorporates various controllers into the system, such as maximum power point controllers, battery charging and discharging controllers and microgrid controllers. The interaction of these controllers with the existing system controllers, such as power system stabilizers (PSSs), creates some negative impacts on the system. Therefore, the optimal coordination of various controllers in a system is very important from the point of view of the stable operation of a system.

1.1. Related Work

Numerous academics have conducted research on LFO damping. The design of the damping and internal controllers of UPFCs in relation to LFO damping was studied by the authors in [2]. The improvement of a power system’s dynamic stability utilizing a STATCOM and FLC-based stabilizer was discussed in [3]. Researchers looked at the coordinated design of a PSO-based multi-machine power system stabilizer and TCSC damping controller in [4]. The use of a unified power flow controller to control power flow and boost bus voltage in a power transmission system was studied by the authors in [5]. The authors examined the effects of the UPFC settings on power flow in a power system in [6]. The authors of [7] described the use of a unified power flow controller to increase the capacity of active power flow in a power system utilizing an IEEE 14 bus system. The damping of low-frequency oscillations in a linked power system was described in [8]. A critical analysis of the function of unified power flow regulation in voltage power transfer was offered by the authors in [9]. In [10], authors described how using several damping controllers based on PSS and the UPFC improved the performance of power system stability. The improvement of power system dampening using TCSC and controller design based on genetic algorithms was discussed in [11]. The author of [12] presented the unified power flow controller’s damping function. The effect of a UPFC-based damping controller on the dynamic stability of the Iraqi power network was discussed by the authors in [13]. The best multi-objective design of robust power system stabilizers using evolutionary algorithms was given in [14]. In [15], authors described the dynamic performance of the 48-pulse GTO thyristor-based interline unified power flow controller (IUPFC) system. An adaptive UPFC-based stabilizer for damping low frequency oscillation was presented by the authors in [16]. The authors of [17] described how support vector regression improved the PSS-UPFC installed power system’s stability. Particle swarm optimization was used by the authors of [18] to create an output feedback UPFC controller for dampening electromechanical oscillations. Using the firefly method, authors in [19] demonstrated the best tuning for a unified power flow controller to reduce inter-area oscillations in a multi-machine system. In [20], authors described a STATCOM controller design that dampens low frequency oscillations in the power system using a modified shuffling frog leaping algorithm. The authors of [21] described the positioning and use of STATCOM-storage for improving the voltage stability of power systems with integrated wind farms. The stability study and dynamic performance improvement of an autonomous microgrid utilizing an adaptive fuzzy PI controller were published in [22]. The author of [23] described improving the dynamical properties of a fuzzy control.

1.2. Research Gaps

The weakness of the above literature is that the stability of the system is maintained by conventional PSSs and conventional unified power flow controllers. Ref. [17] presented a coordinated design of a power system stabilizer and unified power flow controller but did not use any controller for the UPFC. Ref. [18] described the improvement of a power system stabilizer and unified power flow controller used in a power system using both statistical and testing datasets to check the efficiency of the system in different loading conditions.

1.3. Contribution of the Manuscript

The key aids of this manuscript are:
  • The optimal coordination of a power system stabilizer, power oscillation damper and unified power flow controller is proposed using ant lion optimization for low-frequency oscillation mitigation;
  • The controllers are optimally sized and placed using ALO;
  • The tuning parameters of the controller are optimally computed;
  • A detailed comparative analysis to show the dominance of the ALO-coordinated UPFC-PSS system over the existing literature is presented. Comparative analysis is presented on the performance characteristics, such as the damping ratio and eigenvalue analysis.
A detailed comparative analysis to show the dominance of the ALO-coordinated UPFC-PSS system over the existing literature is presented. Comparative analysis is presented on the performance characteristics, such as the damping ratio and eigenvalue analysis.
The superiority of the proposed ALO-based UPFC-PSS system over the others was confirmed through the presented minimum damping ratio and eigenvalue analysis, along with the time domain representations of the power system states with a properly sized damping controller. In the proposed system, the power oscillation damping controller parameters were optimally sized using ALO to produce electrical torque in the phase with speed deviation using a phase compensation technique, which meets the proposed objective function. Therefore, the ALO-based optimal sizing of the PSS and UPFC makes this manuscript superior to the other papers due to the proper sizing and installation of a power system oscillation damping controller on the UPFC.

1.4. Aims of the Manuscript

The main aims of this manuscript are to mitigate low-frequency oscillations and enhance the dynamic stability of a power system using the optimal coordination of a power system stabilizer and unified power flow controller. The specific tasks of the manuscript are described as follows:
  • To collect and analyze the necessary data from different sources;
  • To obtain the synchronous machine rotor angle value, rotor speed deviation and DC-link voltage;
  • To ensure the size of the power oscillation damping controller is a properly sized damping controller;
  • To perform eigenvalue and time domain analyses.

1.5. Scope of the Study

This manuscript is concerned with mitigating low-frequency oscillations and enhancing the dynamic stability of a power system using the optimal coordination of a power system stabilizer and a unified power flow controller. This problem will be solved by maintaining the rotor angle of a synchronous machine in stable or optimum conditions or minimizing low-frequency oscillation by employing ALO. This study is limited to the simulation of a Tana Beles 400 kV transmission network with optimally placed and sized UPFC system components and power system stabilizer and performs a mathematical analysis. In addition, this paper provides eigenvalue and time domain analyses to determine the maximum overshoot and settling time of power system states.

1.6. Methodology

The document is structured as follows: Section 1 discusses the introduction of the manuscript; Section 2 discusses the modeling of the system applied in this paper; Section 3 discusses the methodology of the completed manuscript; and Section 4 discusses the results, followed by the conclusion.

2. Modeling of Proposed System

Synchronous generator small signal analysis, excitation system model, PSS and UPFC are momentarily presented. This paper is composed of mathematical modeling of synchronous generator, transmission line, power system stabilizer and UPFC. Figure 1 presents the overall diagram of SMIBs of the considered network [4].

2.1. Modeling of Synchronous Generator

The single line diagram of synchronous machine described by the classical model with reactance and resistance included is shown in Figure 2 below [5].
The terminal current It in the above generator model presented in [5] can be obtained from terminal voltage and bus voltage:
I t ~ = E t ~ E B ~ R E + j X E
E ~ = E t ~ + ( R a + j X d ) I t ~
The complex power behind the transient reactance can be described as:
S = P + j Q = E ~ I t ~
S = E E B X T S i n δ + j E ( E E B c o s δ ) X T
In pu,
T e = p e = E E B X T s i n δ
To linearize rotor angle of the system, the equation provides new representation as expressed by considering various loading conditions given by δ = δ 0 :
T e = T e δ δ = E E B X T c o s δ 0 ( δ )
The equation in pu is represented in equations below:
p ω r = 1 2 H ( T m T e K D ω r )
p δ = ω 0 ω r
Linearizing the above equation and rearranging the new equation are obtained as follows:
p ω r = 1 2 H ( T m K s δ K D ω r )
K s = ( E E B X T ) c o s δ 0
The following equations are obtained in vector matrix form as follows:
p δ = ω 0 ω r
d d t ω r δ = K D 2 H K s 2 H ω 0 0 ω r δ + 1 2 H 0 T m
This is the form: x ˙ = A x + b u
The characteristics are:
S 2 + K D 2 H S + K s 2 H ω 0 = 0
The overall formula with s-operator is:
S 2 + 2 ζ ω n S + ω n 2 = 0
Undamped natural frequency can be described as:
ω n = K s ω 0 2 H r a d / s
The damping ratio is obtained as:
ζ = 1 2 K D 2 H ω n = 1 2 K D K s 2 H ω 0
Eigenvalues are gained from Equation (16):
λ 1 , λ 2 = ζ ω n ± j ω n 1 ζ 2
The damped frequency is:
ω d = ω n 1 ζ 2
where Ks is synchronizing torque coefficient, KD is damping torque coefficient, H is inertia constant, ω r is ( ( ω r ω 0 ) / ω 0 ), δ is rotor angle deviation, and ω 0 = 2 π f 0 , f 0 = 50 H z ).

2.2. Modeling of Excitation System

To excite field winding of generator, DC power is used. Furthermore, excitation system performs control and protective functions necessary for the efficient control of field current. The protective function ensures the ability to restrict generator excitation system and other devices [6]. Figure 3 presents the excitation system with power system stabilizer.

2.3. Power System Stabilizer

PSS is used to increase system stability by controlling the excitation system. It affords supplementary control signal to enhance damping torque of generator. To enhance capability of avoiding system LFO, power system stabilizer uses rotor speed ( ω ), frequency ( f ), accelerating power ( P m P e ), electrical power ( P e ) and combination of input signals. T w is the washout time. T1–T4 represent time constants [7].

2.3.1. Optimal Parameter of PSS

Figure 4 below involves a gain block ( K P S S ) , Tw and lead lag time constant [8].
Time constant is chosen between 0.01 and 1 s. The time constant T 1 T 4 and gain K P S S are optimally selected using ALO algorithm [8].

2.3.2. PSS Model

The techniques of integrating excitation system into power system stability enhancement are shown in Figure 5 below.

2.4. Modeling of UPFC

A UPFC is a flexible device that has the capability to tune control parameters, such as V, X and δ , between two buses. UPFC has two VSC, series and shunt converters interconnected with DC-link capacitor. The single line diagram of UPFC of SMIBs is shown in Figure 6 below.
Excitation transformer and boosting transformer are connected with UPFC in the transmission line. The VSC B or SSSC is used to inject series voltage with boosting transformer (BT), which is connected in series with TL, while VSC E (STATCOM) is used to absorb (supply) real power that supports VSC B as needed. There are four parameters of UPFC which are m E , m B , δ E   a n d   δ B , where δ E and δ B are the phase angle of E T and B T , respectively, and m E and m B are the amplitude modulation ratio of E T and B T , respectively.

2.4.1. Mathematical Model of SMIB with UPFC

The model of UPFC with damping controller is presented in Figure 7 [10] below, where N; can be m E , m B , δ E and δ B , which are input parameters for UPFC.
Figure 8 [11] represents UPFC with damping controller and DC voltage regulator.

2.4.2. Non Linear Dynamic form of UPFC

From Figure 8 above, the non-linear equation describes the characteristics of UPFC with three phase excitation and boosting current [12].
The shunt converter current can be described as:
d i E a d t d i E b d t d i E c d t = r E l E 0 0 0 r E l E 0 0 0 r E l E i E a i E b i E c m E V d c 2 l E cos ω t + δ E cos ω t + δ E 120 0 cos ω t + δ E + 120 0 + 1 l E 0 0 0 1 l E 0 0 0 1 l E v E t a v E t b v E t c
The series converter current can be described as:
d i B a d t d i B b d t d i B c d t = r B l B 0 0 0 r B l B 0 0 0 r B l B i B a i B b i B c m B V d c 2 l B cos ω t + δ B cos ω t + δ B 120 0 cos ω t + δ B + 120 0 + 1 l B 0 0 0 1 l B 0 0 0 1 l B v B t a v B t b v B t c
DC-link capacitor voltage can be:
d v d c d t = m E 2 C d c cos ω t + δ E cos ω t + δ E 120 0 cos ω t + δ E + 120 0 T i E a i E b i E c + m B 2 C d c cos ω t + δ B cos ω t + δ B 120 0 cos ω t + δ B + 120 0 T i B a i B b i B c
where V E t , i E , r E and l E are voltage, current, resistance and inductance of ET, respectively, while V B t , i B , r B and l B are for BT, respectively; and C d c , V d c are capacitance and voltage of DC link, respectively. The voltage equation of UPFC can be [12]:
v E t d v E t q = 0 x E x E 0 i E d i E q + m E v d c c o s δ E 2 m E v d c s i n δ E 2
v B t d v B t q = 0 x B x B 0 i B d i B q + m B v d c c o s δ B 2 m B v d c s i n δ B 2
d v D C d t = 3 m E 4 C D C c o s δ E s i n δ E i E d i E q + 3 m B 4 C D C c o s δ B s i n δ B i B d i B q
where V E , X E   a n d   i E , and V B , X B and i B are voltage, reactance and current of ET and BT, respectively. V D C and C D C are DC-link voltage capacitance. Equations below show non-linear model of UPFC [12]:
δ ˙ = ω b ( ω 1 )
ω ˙ = 1 M ( P m P e D ( ω 1 ) )
E q ˙ = 1 T d 0 ( E f d E q i d ( x d x d ) )
E ˙ f d = 1 T a ( k a v ˙ r e f v t E f d )
V d c ˙ = 3 m E 4 C d c I E d s i n δ E + I E q c o s δ E + 3 m B 4 C d c ( I B d s i n δ B + I B q c o s δ B )
Real power balance equation of UPFC is shown below:
R e V B I B V E I E = 0
where δ is rotor angle, ω and ωb are rotor speed and synchronous speed, P m and P e are mechanical and electrical power, D is damping coefficient, and M inertia E f d ,   E ˙ q and E q are the field, internal voltage and transient of the generator, respectively.
P e = V t d i d + V t q
The terminal voltage V t is:
V t = V t d 2 + V t q 2
V t q = E q x d i d
V t d = v d x t i q = x q i q
V t q = v q + x t i d = E q x d i d = E q x d i d
where v d = V b s i n δ , v q = V b c o s δ , i d = E q V b c o s δ x d and i q = V b s i n δ x d .
In addition, v t d , v t q and i d ; i q   v d ; and v q are d and q axes components of terminal voltage V t .

2.4.3. Linear Model of UPFC

The linear form of UPFC is given by [13]:
δ = ˙ ω b ω
ω ˙ = 1 M ( P m P e D ω )
E q ˙ = 1 T d 0 E f d E q i d x d x d
E f d ˙ = 1 T a ( k a v t E f d )
V ˙ d c = K 7 δ + K 8 E q K 9 V d c + K c e m E + K c δ e δ E + K c b m B + K c δ b δ B
The terminal voltage is [13]:
V t = K 5 δ + K 6 E q + K v d V d c + K v e m E + K v δ E δ E + K v b m B + K v δ b δ B
where
P e = K 1 δ + K 2 E q + K p d v D C + K p e m E + K p δ e δ E + K p b m B + K p δ b δ B
E q = K 4 δ + K 3 E q + K q d v D C + K q e m E + K q δ e δ E + K q b m B + K q δ b δ B
K p d , K p e , K p δ e , K p b , K p δ b , K q d , K q e , K q δ e , K q b , K q δ b , K v d , K v e , K v δ e , K v b , K v δ b , K c e , K c δ e , K c b   a n d   K c δ b are constants, and K 1   t o   K 9 are system coefficients. In state space, the power system can be represented as:
X ˙ = A X + B U
where X is state vector, and U is control vector:
X = [ δ ω E q E f d V d c ] T , and U = [ U P s s m E δ E m B δ B ] T (42)
Matrices A and B are represented, as shown below [13]:
A = 0 ω b 0 0 0 K 1 M D M K 2 M 0 K p d c M K 4 T d 0 0 K 3 T d 0 1 T d 0 K qdc T d 0 K A K 5 T A 0 K A K 6 T A 1 T A K A K Vdc T A K 7 0 K 8 0 K 9
B = 0 0 0 0 0 0 K P E M K P δ E M K P B M K P δ B M 0 K q E T d 0 K q δ E T d 0 K q B T d 0 K q δ B T d 0 K A T A K A K V q E T A K A K V δ E T A K A K V B T A K A K V δ B T A 0 K C E K C δ E K C B K C δ B
where m E , m B , δ E and δ B are input signals of UPFC.
The DC-link capacitor voltage δ E is [13]:
δ E = K d p + K d I s ω + K d c p + K d c I s V d c r f V d c K s 1 + s T s
where K d p is controller proportional gain, and k S is proportional gain of SSSC.

2.4.4. Dynamic Form of DC-Link Capacitor

The active power maintained in the capacitor is given by:
P d c = P s h P s e
where the shunt power and series power are given by:
P s h = V s h d i s h d V s h q i s h q ,   P s e = V s e d i s e d V s e q i s e q   and   P d c = I D C V d c
Dc-link capacitor current is given by:
i d c = C d d t V d c
where P s e , P s h and P d c are real power of series, shunt converter and DC-link capacitor, respectively.
C V d c d d t V d c = d d t V d c 2 = 2 C { V s h d i s h d V s h q i s h q V s e d V s e d V s e q i s e q }

2.4.5. PSS and UPFC Controllers

The structure of PSS used is lead-lag controller, which is described as:
u p s s = K s T w 1 + s T w 1 + s T 1 1 + s T 2 1 + s T 3 1 + s T 4 ω
Figure 9 below shows the UPFC with damping controller and PSS:
In this case, ∆u is either m E , m B , δ E or δ B . Figure 10 presents the UPFC controller with POD and DC voltage regulator.

3. Methodology

This section discusses the methodology utilized in this research.

3.1. Ant Lion Optimization Technique

For the optimal parameter computation, ant lion optimization technique was utilized in this work.

3.2. Objective Function

Damping factor as an objective function is given by (J1) [15]:
J 1 = i = 1 N P ( σ 0 σ i ) 2
Damping ratio as second objective function (J2):
J 2 = i = 1 N P ( ζ 0 ζ i ) 2
The general objective function J3 is given by [15]:
J 3 = J 1 + α J 2
J 3 = i = 1 N P ( σ 0 σ i ) 2 + α i = 1 N P ( ζ 0 ζ i ) 2

Constraint Equation

Minimize J subject to controller gain:
K m i n K K m a x
Phase-compensating time constants [15]:
T 1 m i n T 1 T 1 m a x
T 2 m i n T 2 T 2 m a x
T 3 m i n T 3 T 3 m a x
T 4 m i n T 4 T 4 m a x
where NP is the number of operating points, and ζ i is damping ratio of i t h eigenvalues, respectively. Table 1 presents the typical range of constraint parameters of PSS.
Figure 11a presents the objective function J1 that carries out eigenvalues to the left side of the j ω axis, and Figure 11b shows objective function J2, which restricts maximum overshoot. Figure 11c shows the combination of the above two objective functions.

3.3. Optimal Sizing of Power System Stabilizer

T1–T4 and controller gain K P S S are properly sized using ALO techniques. Table 2 presents the optimal values of PSS using ALO. Figure 12 presents the structure of PSS.
The optimal method used here is ant lion optimization technique, and the parameter values of power system stabilizer and unified power flow controller with optimal tuning are used. Therefore, the eigenvalue analysis method and time domain simulation method are used to obtain damping ratio, damping factor, maximum overshoot and settling time of the system, respectively.

3.4. Design of UPFC Supplementary Controllers

Optimal design of PSS parameters was used to obtain quick responses and attain normal operation of the system [16]. The input was speed deviation, while the output was stabilized [17]. Optimal parameters were selected to achieve maximum damping efficiency using ALO [18]. The transfer function of POD controller is given by:
H s = 14.265 10 s 1 + 10 s 1 + 0.01968 s 1 + 0.3608 s 1 + 0.1544 s 1 + 0.4632 s
The above transfer function of POD controller in Equation (61) is designed for damping of low-frequency oscillation of Tana Beles 400 kV transmission line, but it may not be universal as all the parameters are tuned based on the data obtained from Tana Beles power plant.

4. Simulation Results and Discussion

The eigenvalue simulation and time domain analyses were carried out for power system stability enhancement.

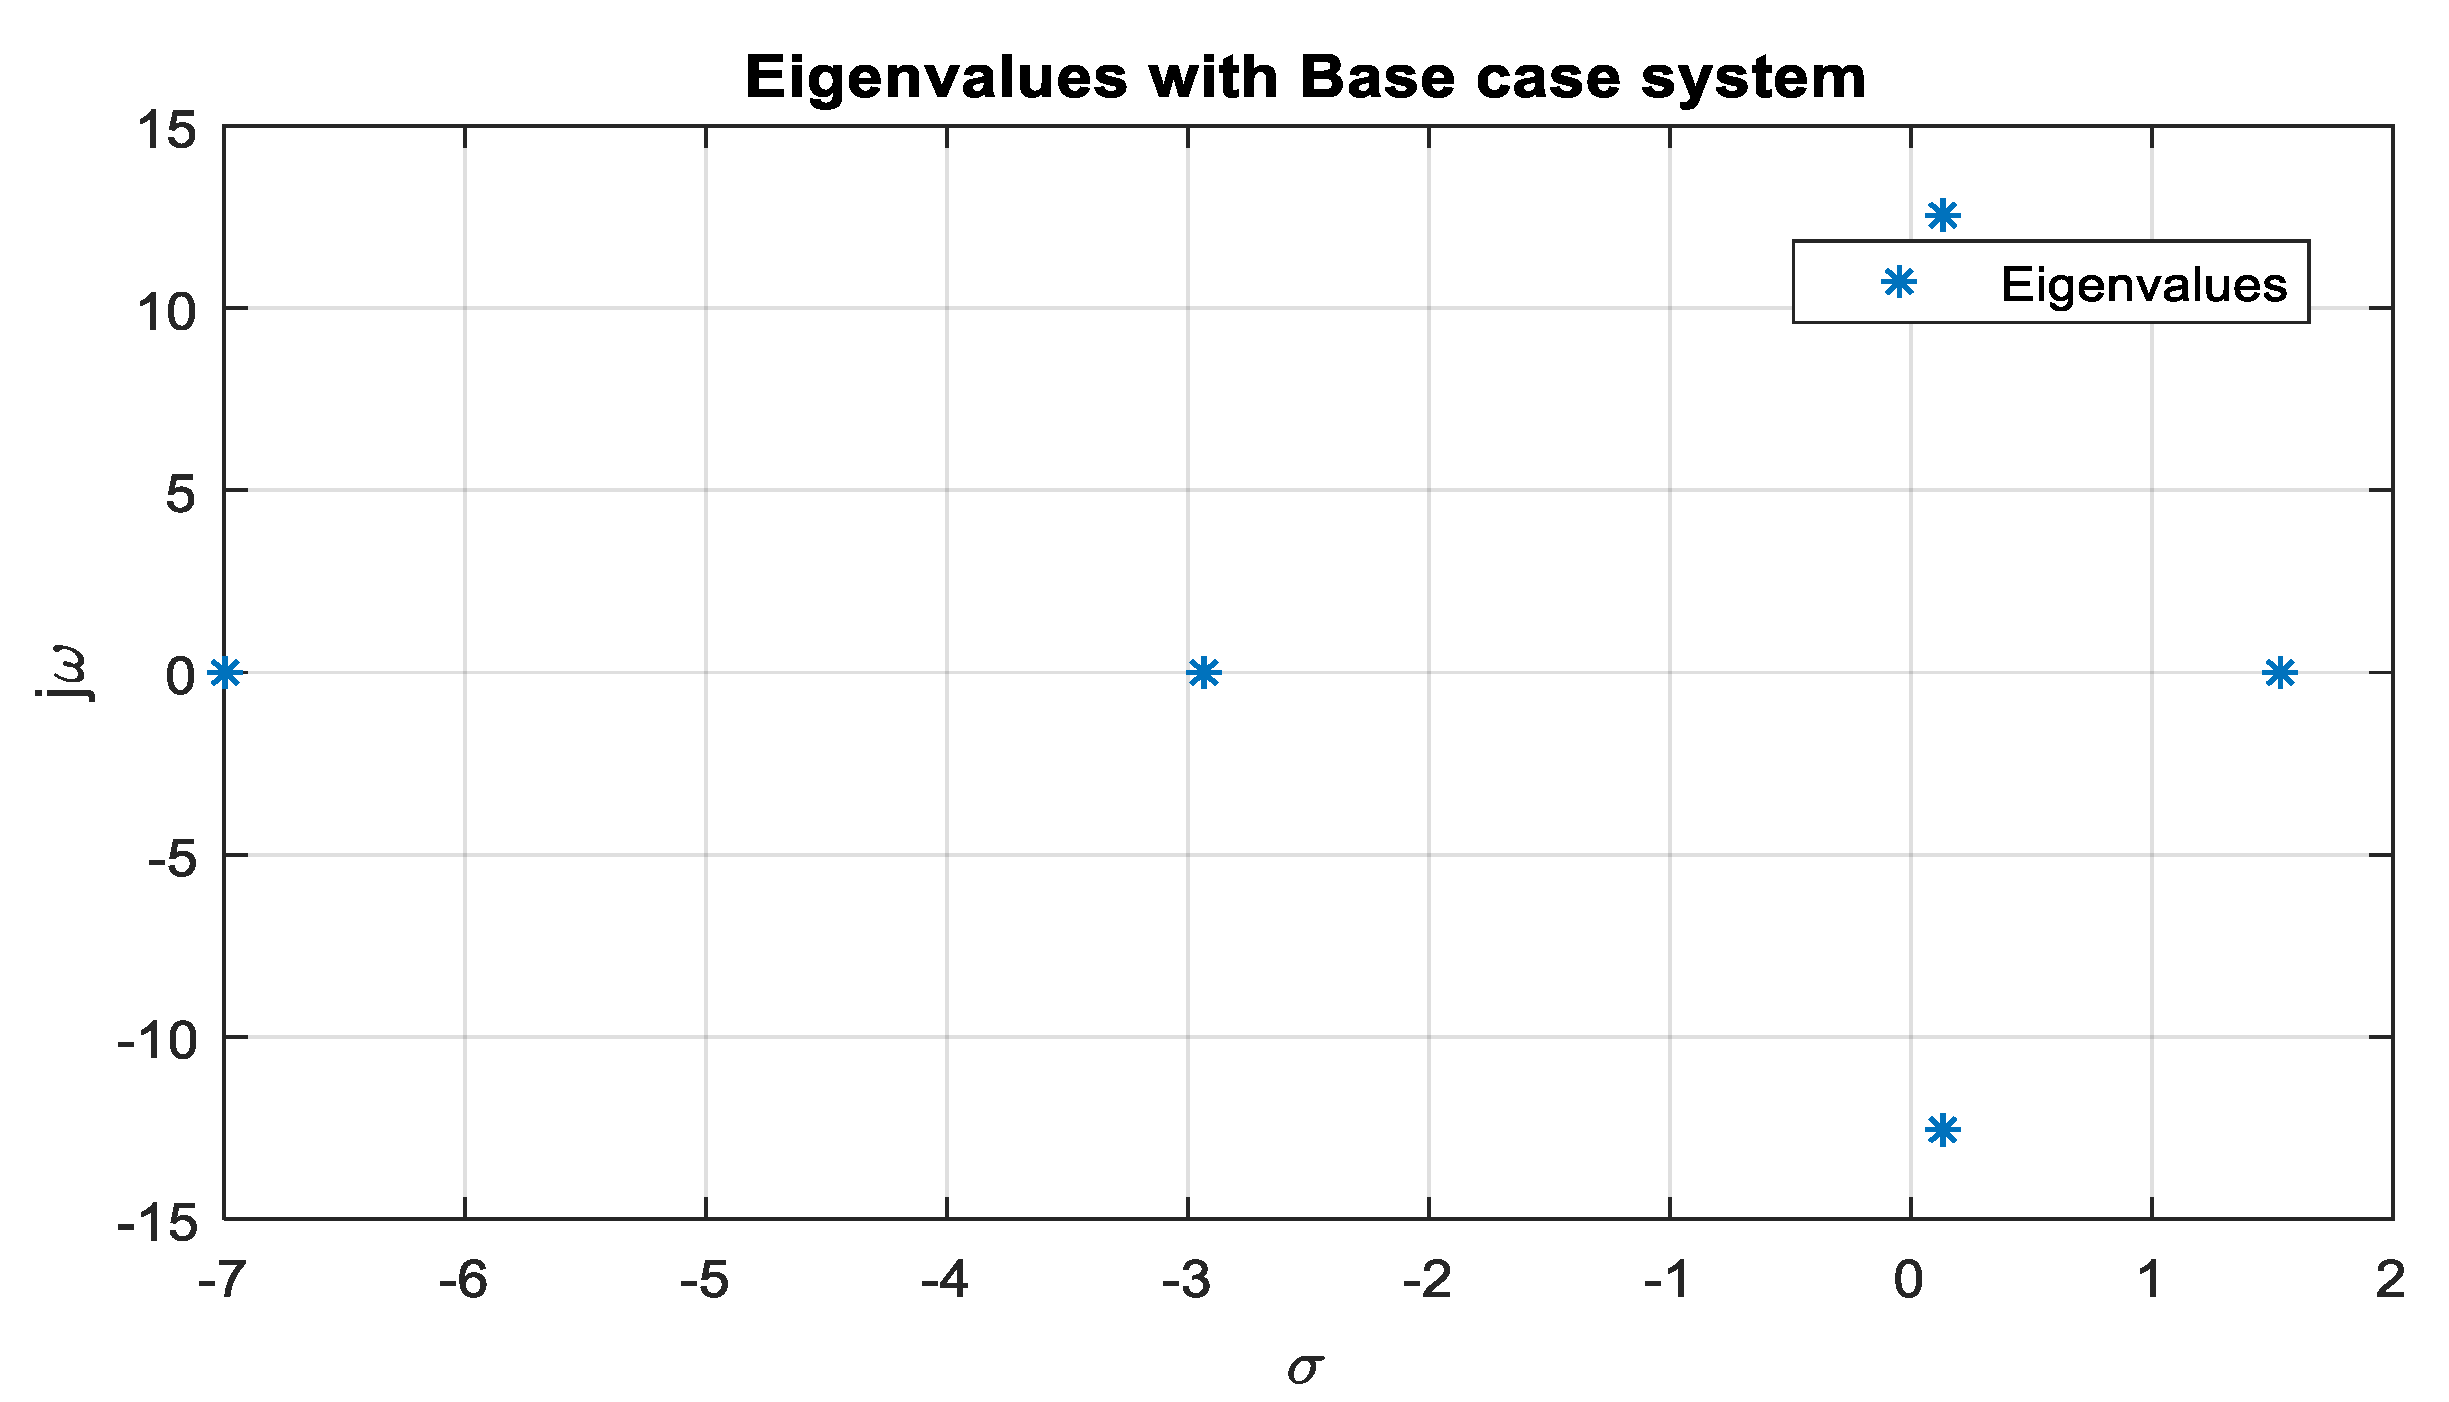
4.1. Eigenvalue Analysis and Minimum Damping Ratio (MDR)

The system is stable if and only if, all the eigenvalues are located on the left of the jw axis, otherwise the system is unstable. To obtain better controller eigenvalues, MDRs of the different loading conditions were compared for the following figures:
Figure 13, Figure 14 and Figure 15 below show the eigenvalues of the base case in normal, light and heavy operating conditions, respectively, which are located on the right of the j ω plane. Therefore, the system is not stable. Figure 13 shows the eigenvalues in normal operating conditions in which the first three eigenvalues (indicated in bold) are positive before the PSS and UPFC are placed into the system In Figure 14 eigenvalues in light loading conditions are presented, while Figure 15 shows the eigenvalues in heavy operating conditions in which the first three eigenvalues are positive, but the magnitude of the eigenvalues is different, as indicated in Table 3 below.
Figure 16, Figure 17 and Figure 18 present the eigenvalues when the PSS is used in the system, which are located on the right of the j ω axis. Therefore, the system is unstable.
Figure 19, Figure 20 and Figure 21 describe the eigenvalues with the PSS-UPFC in different operating conditions. These figures are clearly presented in Table 4 above with their specific locations of eigenvalues.

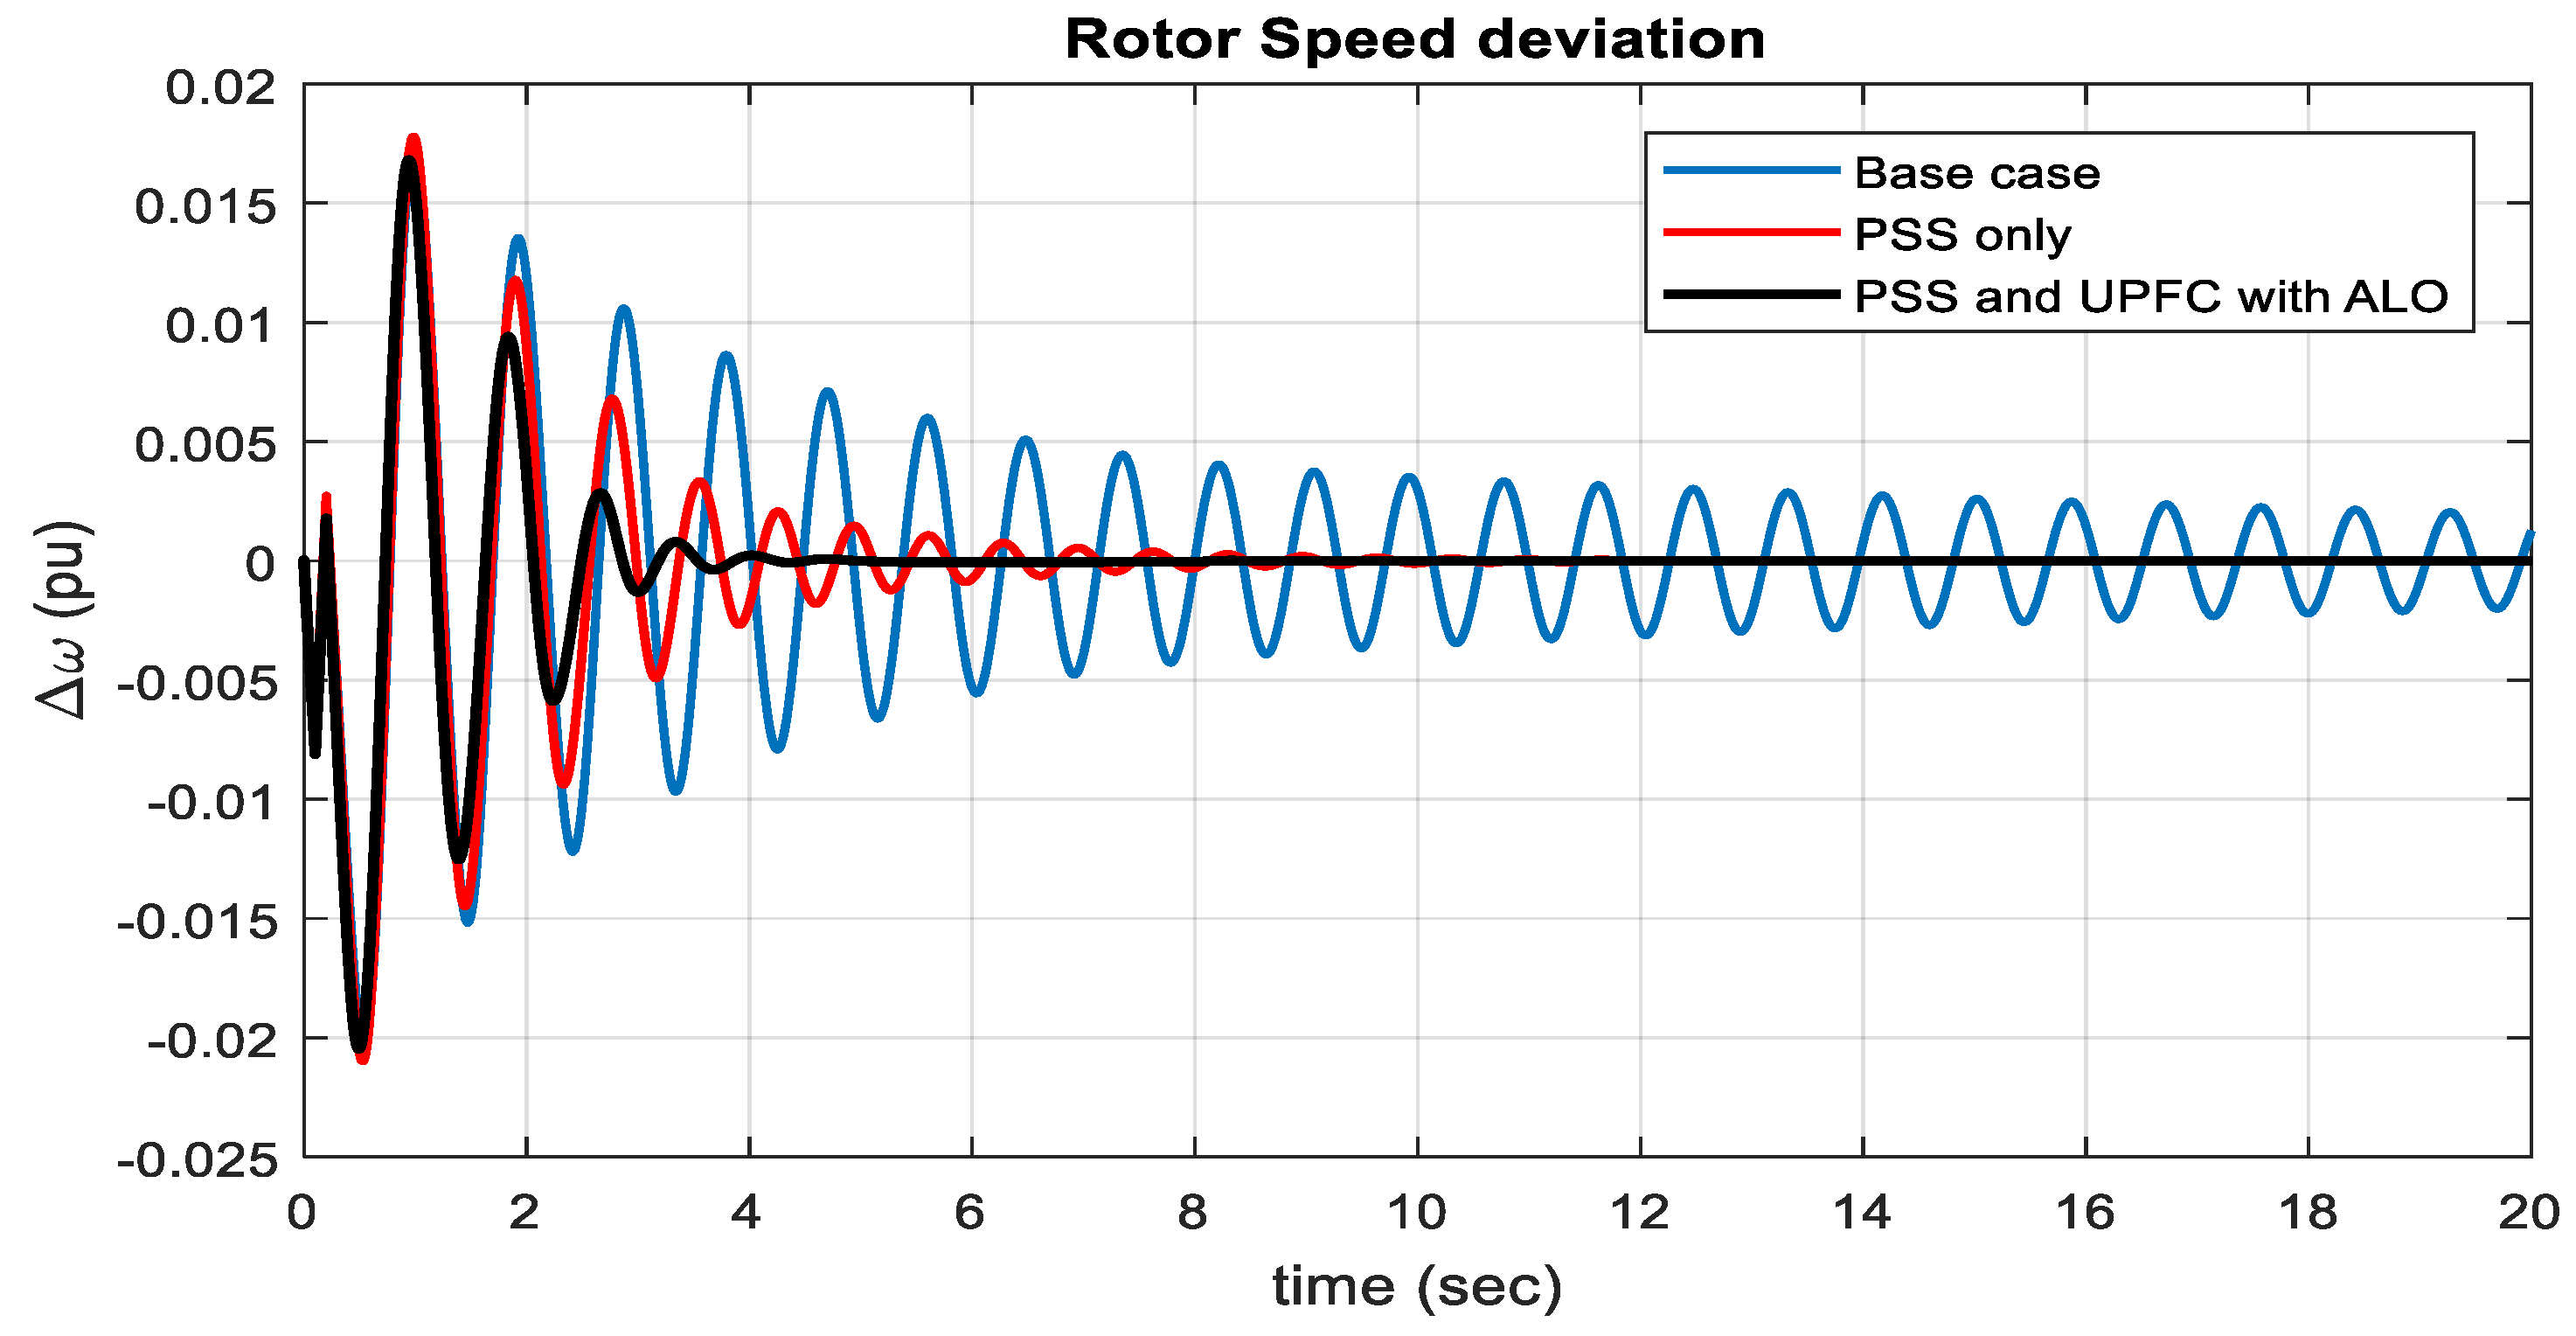
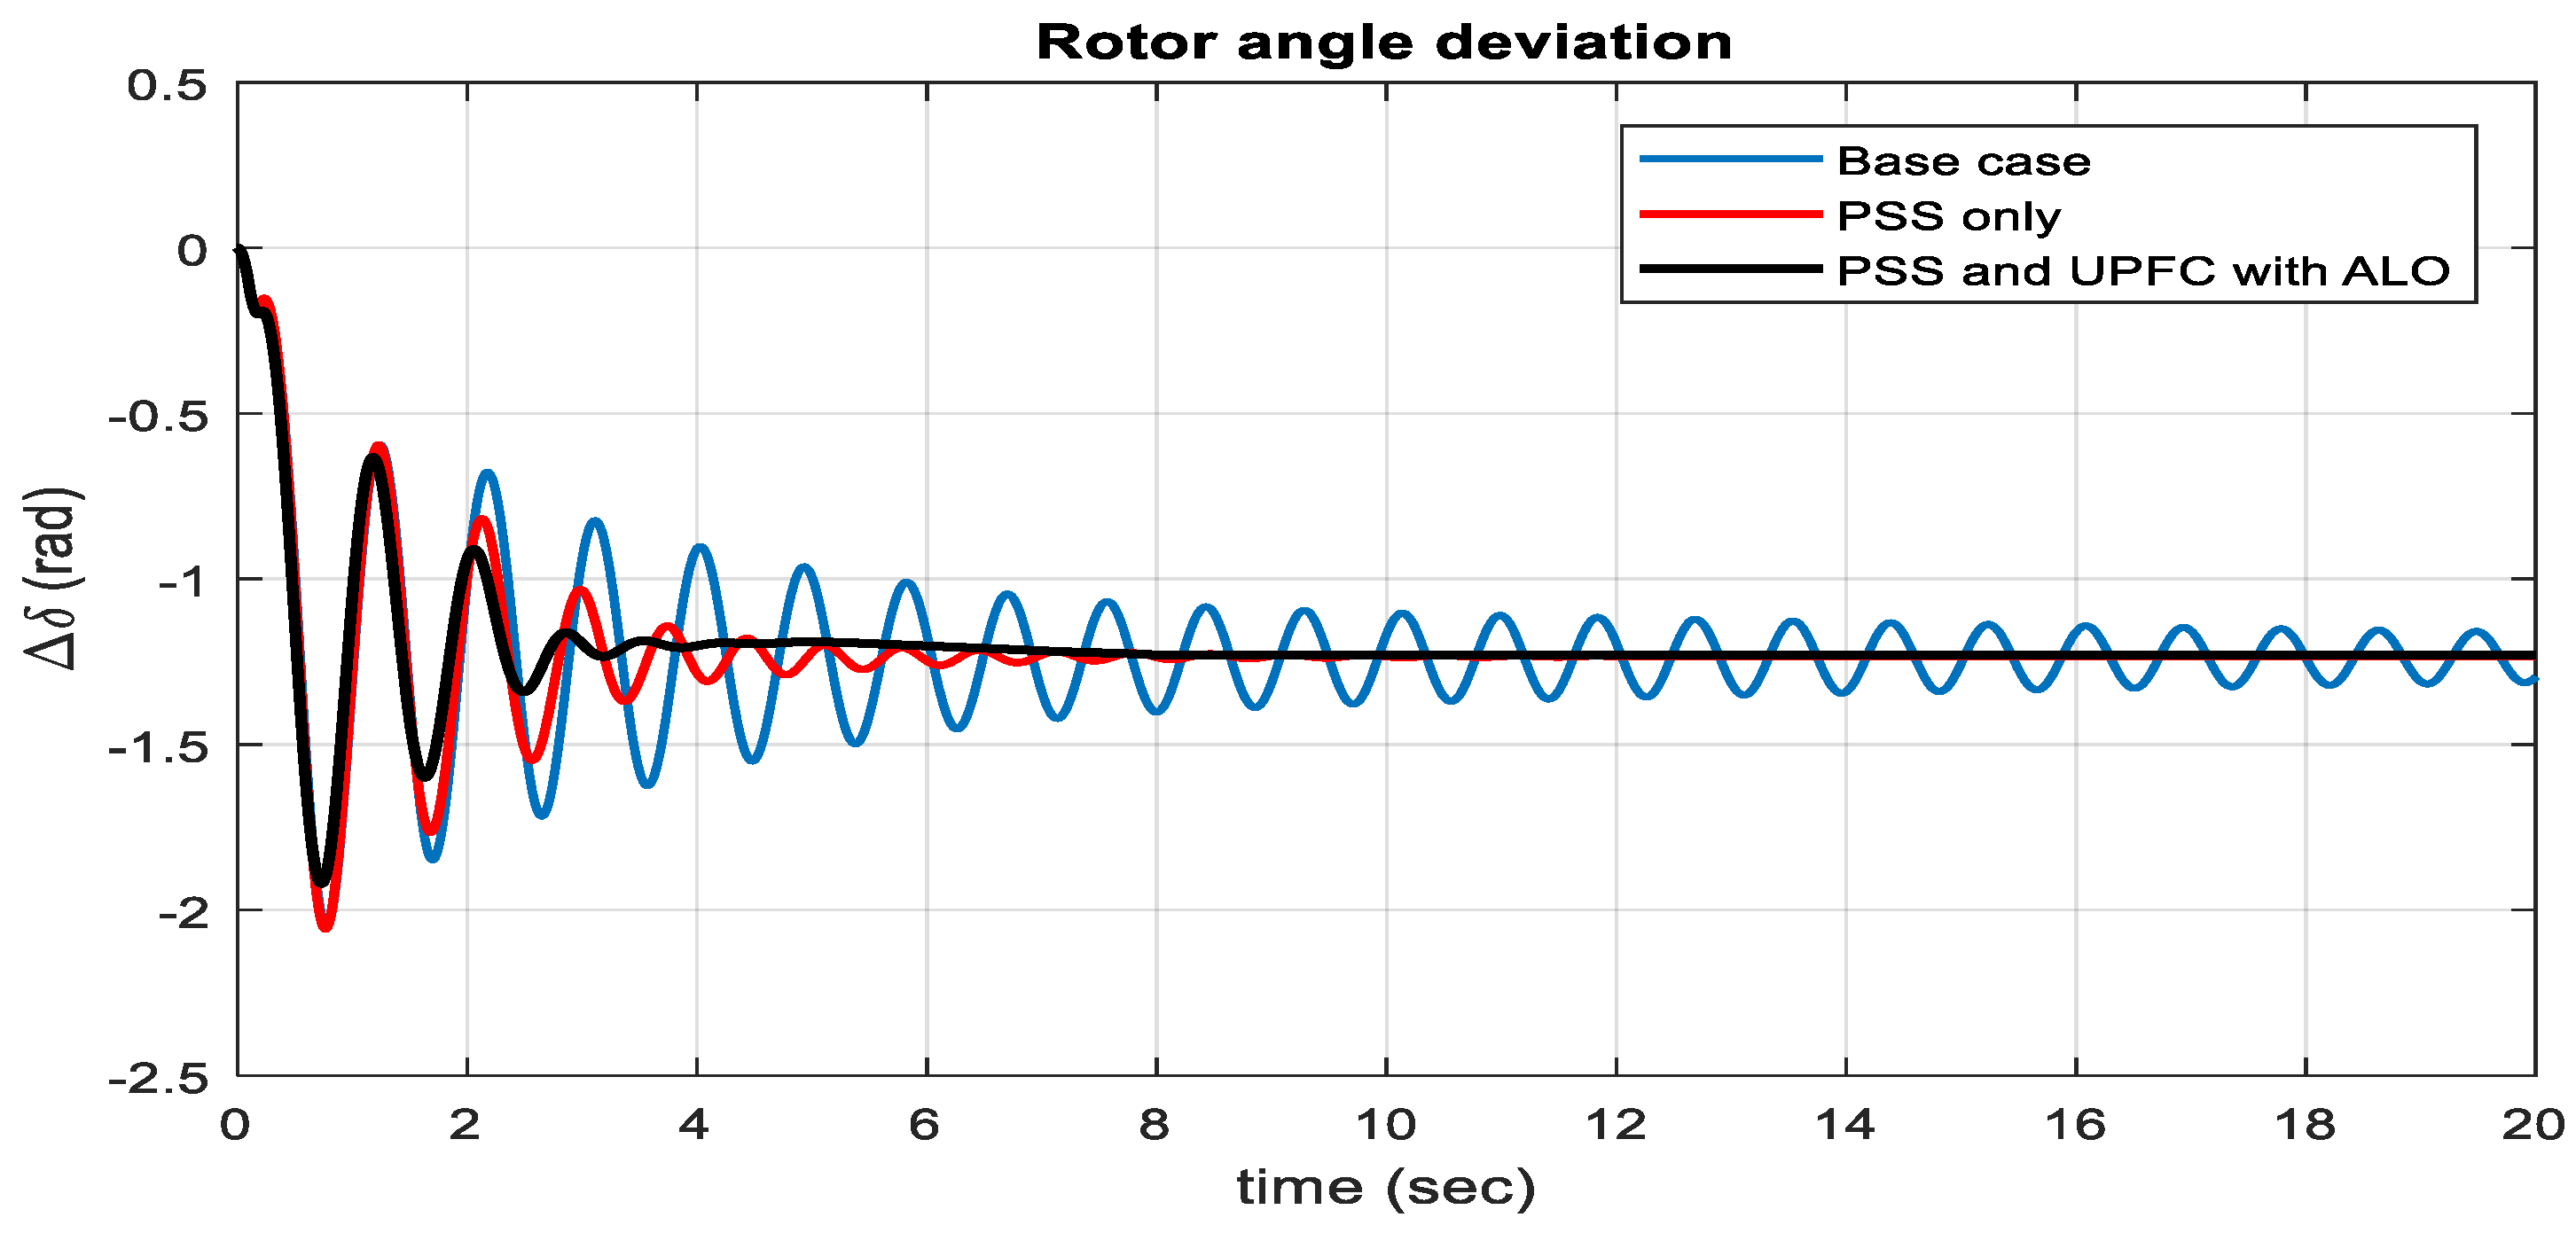
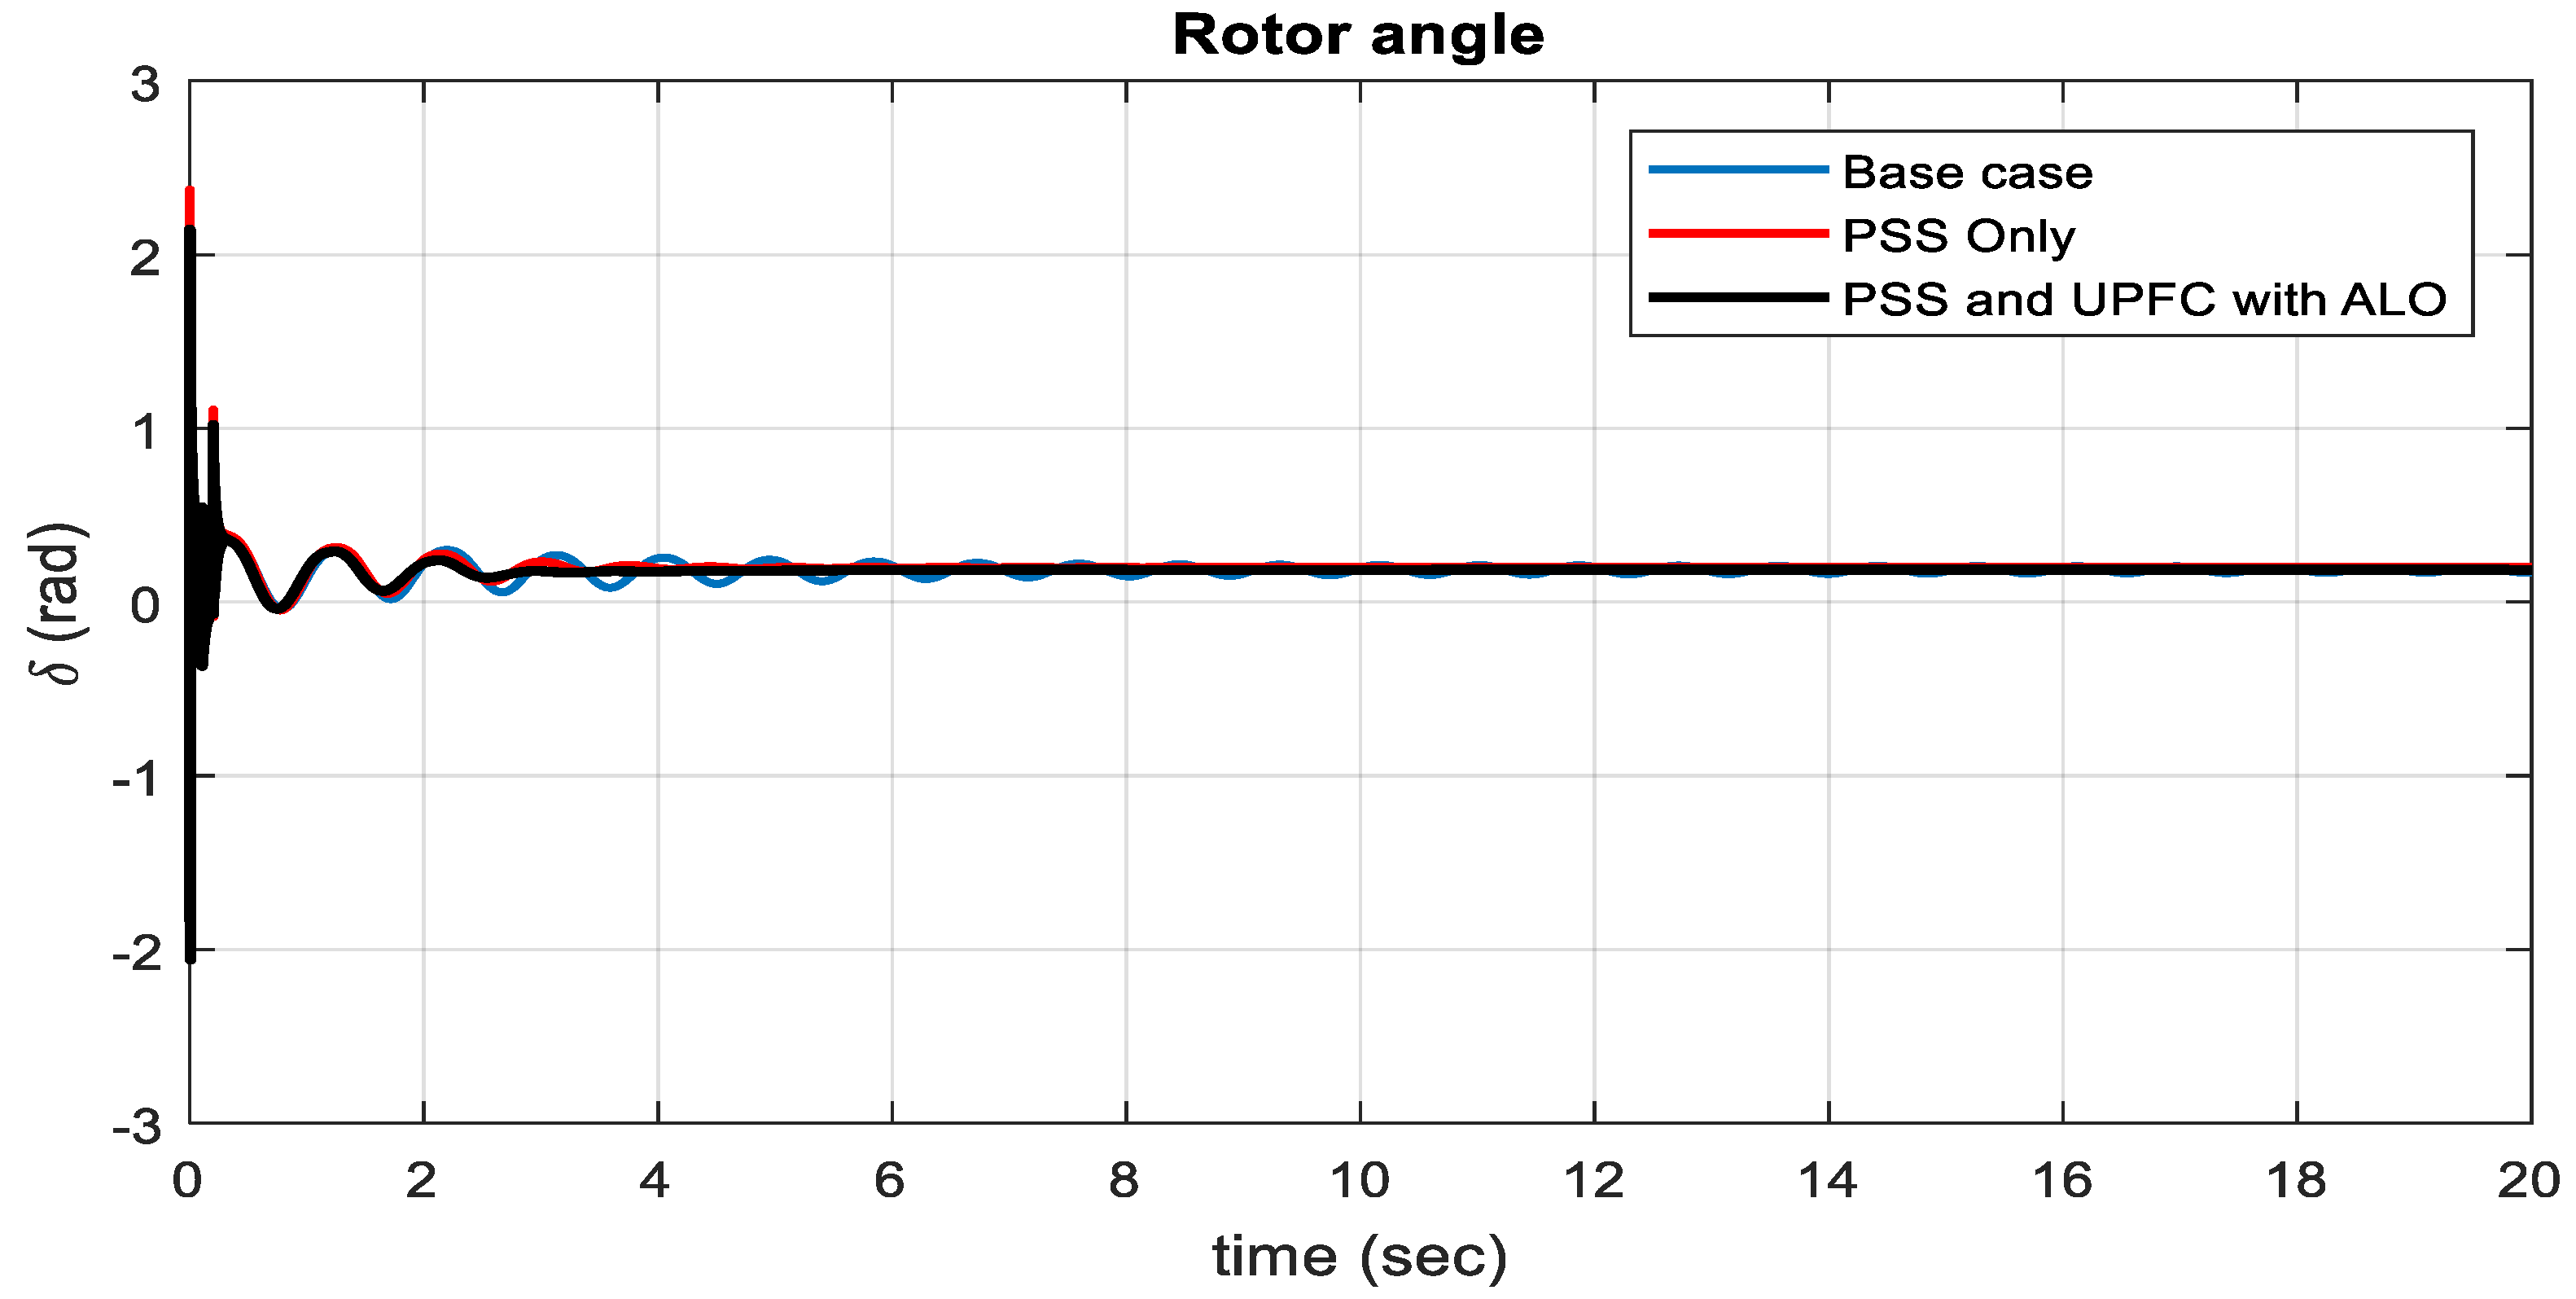
4.2. Time Domain Analysis

This section presents the time domain analysis of the optimally coordinated PSS and UPFC integrated system.

4.2.1. PSS and UPFC Parameters

Table 4 presents the optimal parameters of the POD controller using algorithms. ALO has relatively robust controller parameters compared to GA, TLBO and PSO.
The recorded average time to optimally tune the PSS parameters was approximately 15.531407, 19.4363, 106.3817 and 203.4058 s for ALO, GA, PSO and TLBO, respectively. Consequently, the average time required to tune the parameters of the PSS-UPFC optimized by ALO was 15.531407 s, which is pretty small and indicates real-time implementation of the ALO-developed model in the power system, and the proposed method is fast, which confirms the superiority of the developed method.

4.2.2. Simulation Results of UPFC

Figure 22 and Figure 23 describe the results of the UPFC parameters.
From Figure 24, the results present slight oscillations due to the shunt converter controlling the DC-link voltage efficiently. The aim of the low-frequency oscillation study was to attain stability and clear fault disturbances. Figure 25 presents the positive voltage (a), real power (b) and reactive power of each bus (c).

4.2.3. Simulation Results Using Different Techniques

The comparison of different optimization methods and the simulation results of the proposed ALO-based PSS and UPFC controller show better efficiency for the damping of LFO compared to the base case model and GA, PSO and TLBO methods. The UPFC controller can effectively damp out LFO when the ALO method is applied. Table 5 presents values which are illustrated in Figure 26, Figure 27 and Figure 28 shown below. In Table 5 below, the maximum overshoot and settling time of the ALO optimization technique are more accurate than and superior to the remaining techniques. The simulation results clearly explain how this optimization technique is more advantageous than the remaining techniques.
Figure 26 above shows that the speed deviation of the proposed ALO technique has less maximum overshoot and settling time than the other remaining techniques. Therefore, the ALO technique is superior to damp out low-frequency oscillation compared to the GA, TLBO and PSO applied methods.
Figure 27 above shows that the angle deviation of the proposed ALO technique has less maximum overshoot and settling time than the other applied methods. Therefore, the proposed ALO technique takes less time for the damping of LFO and attains a steady-state system.
From Figure 28 above, the proposed ALO provides good results in terms of reducing the variations of LFO and presents the robustness of the system.

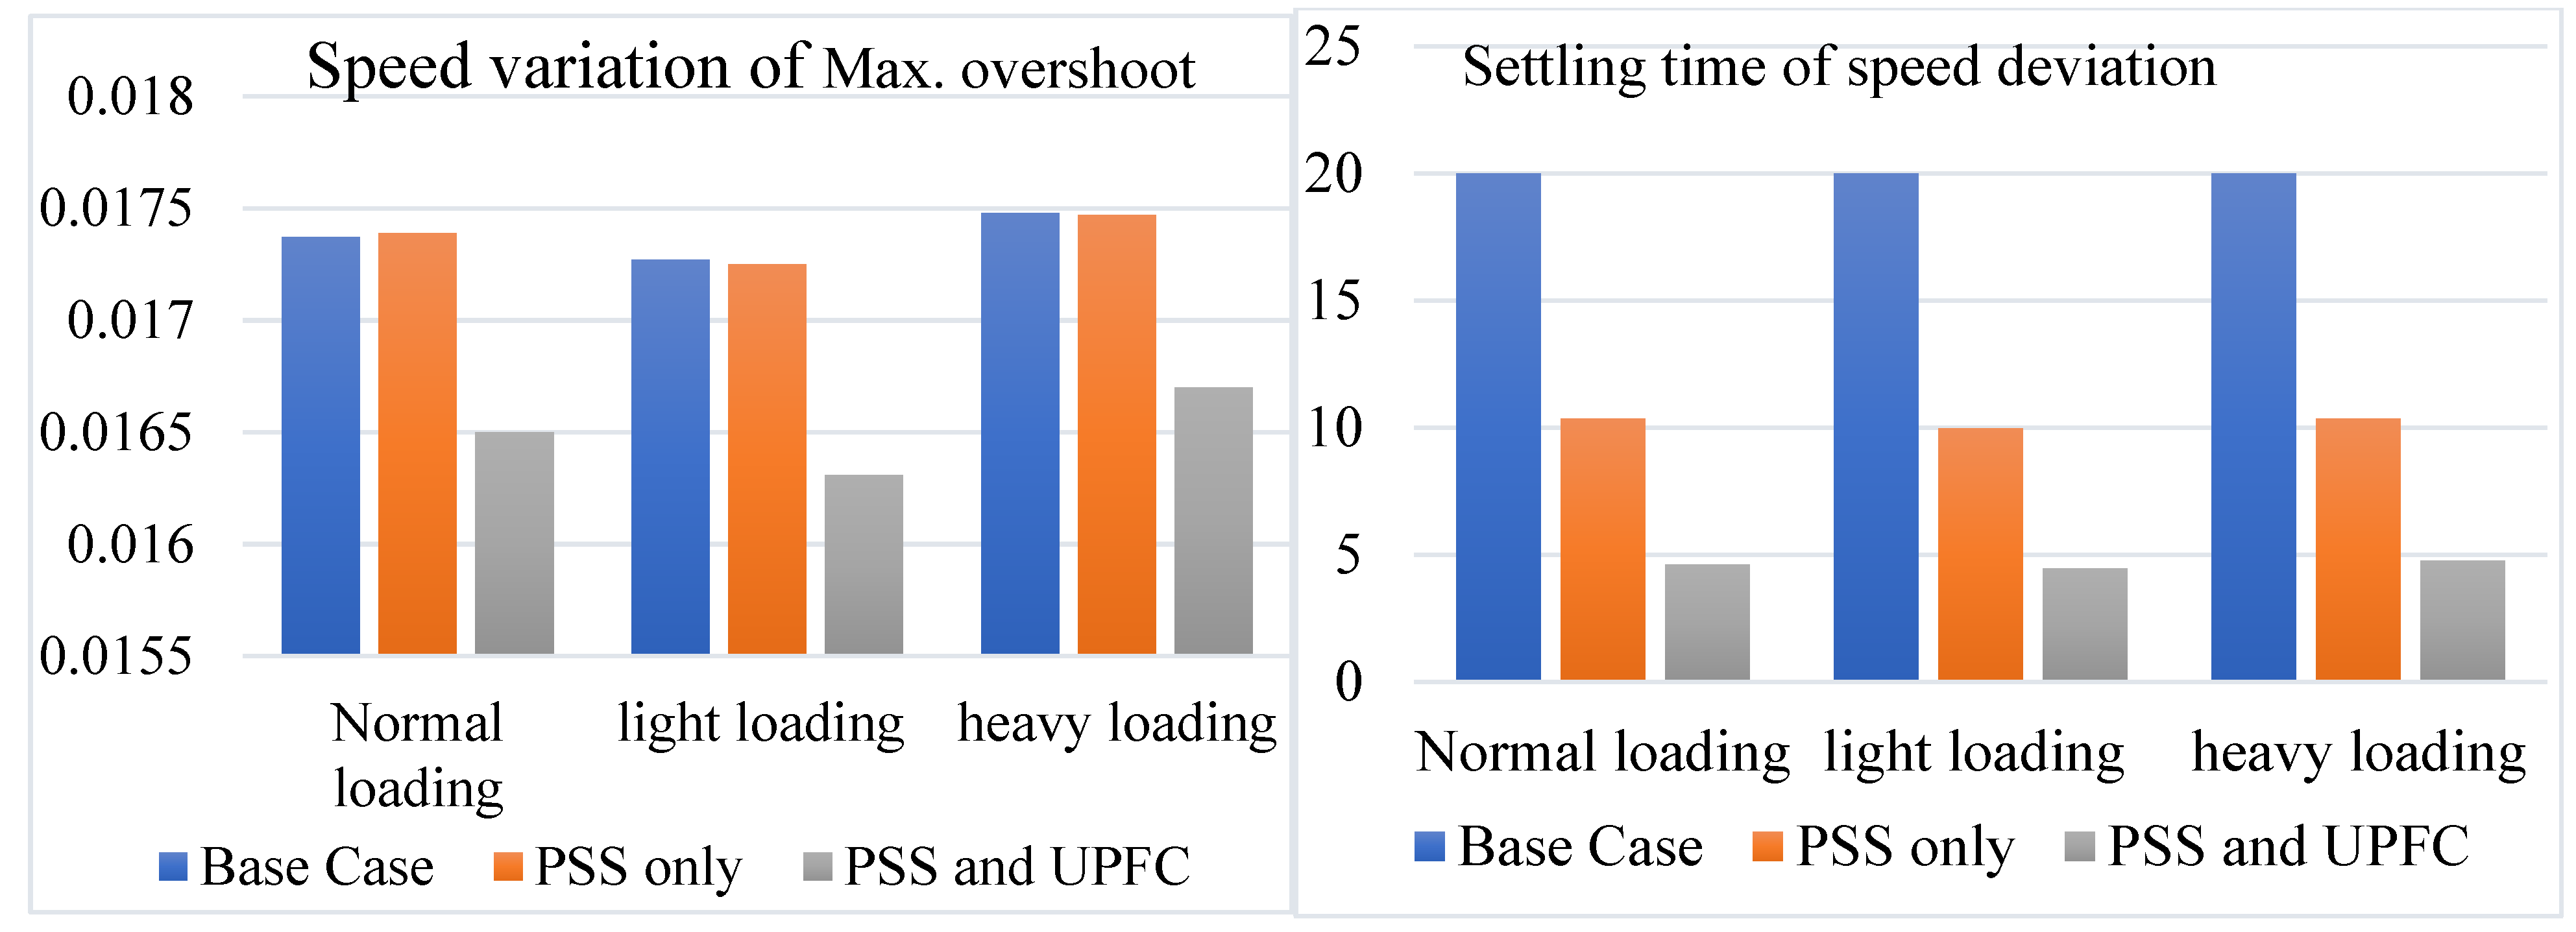
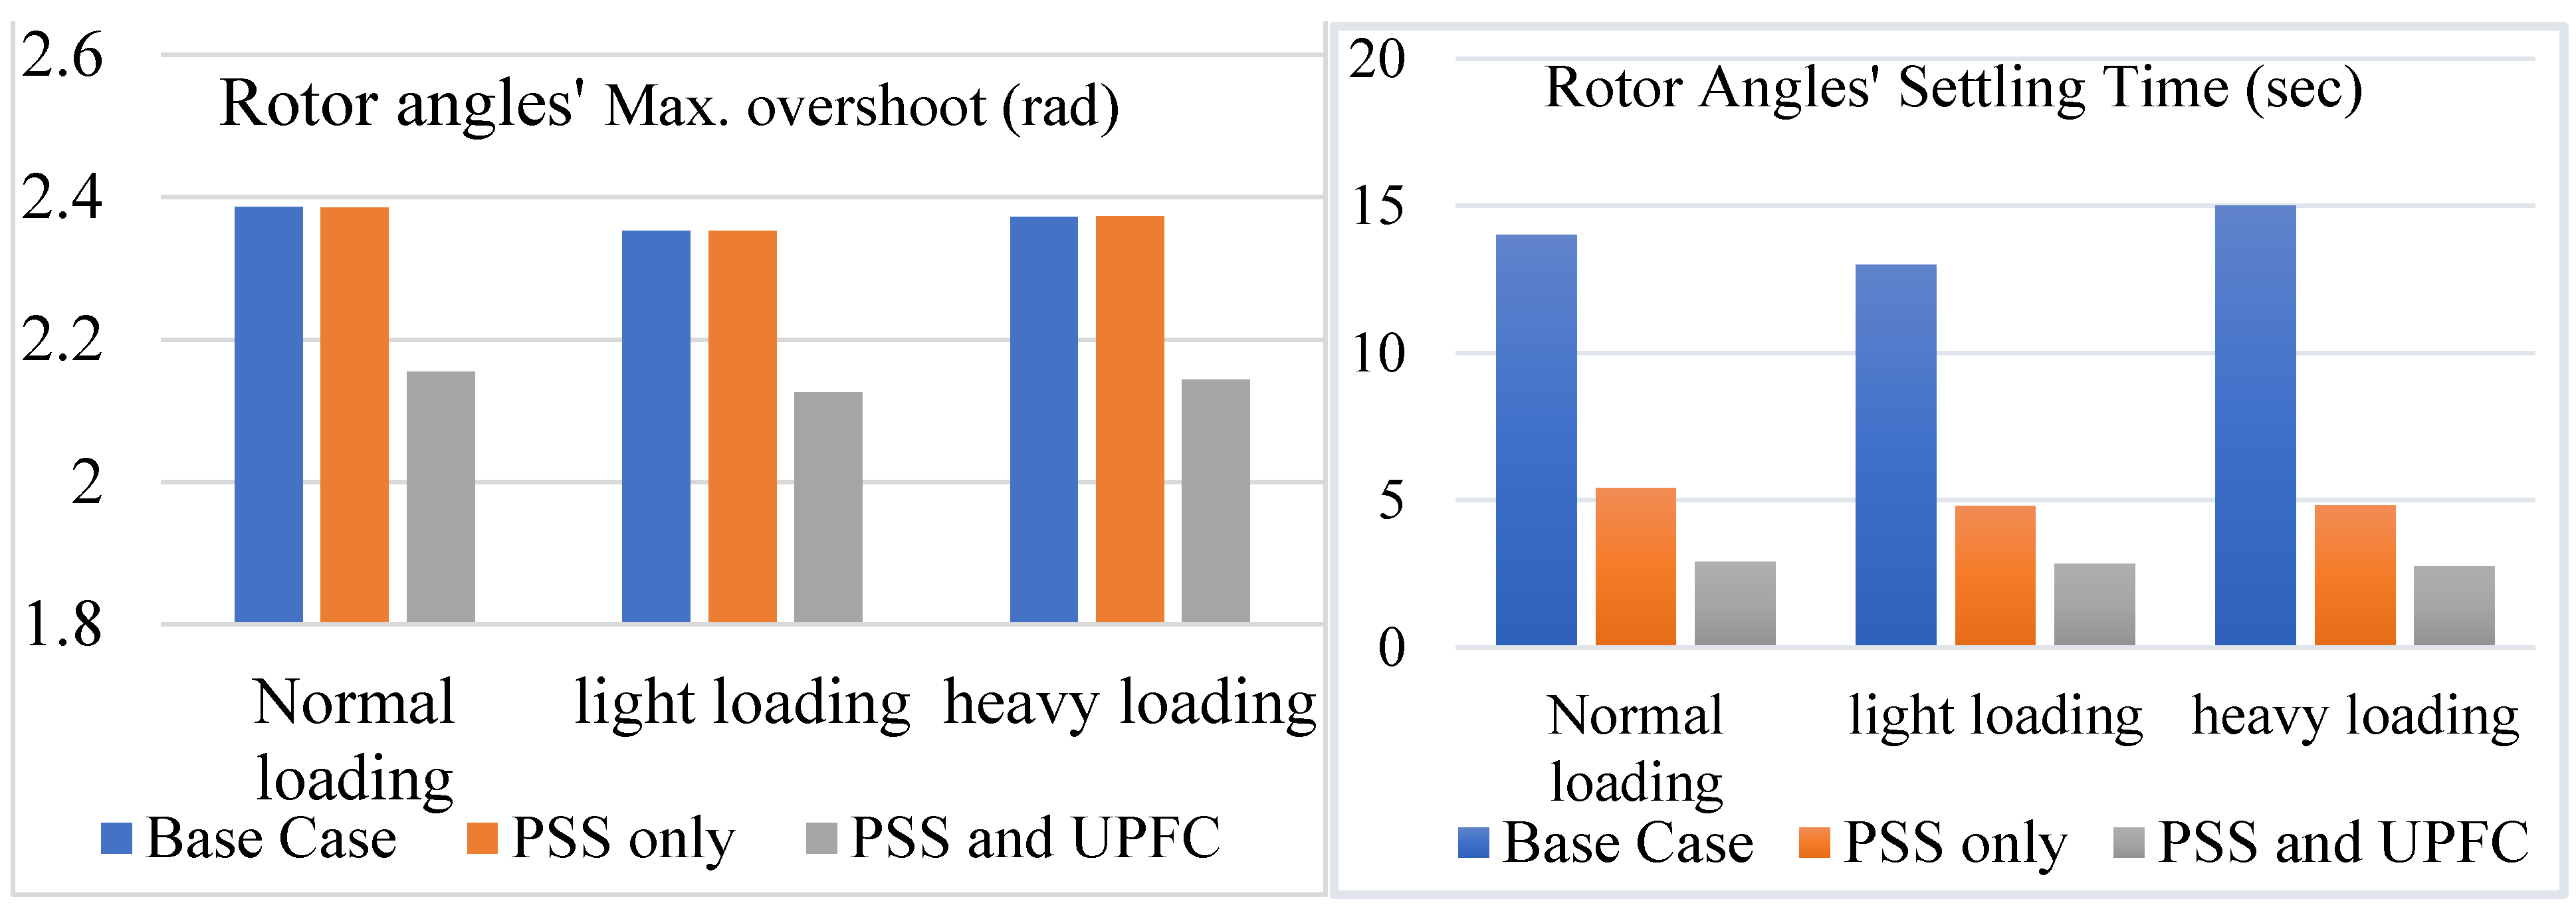
4.3. Simulation Results in Different Loading Conditions

As the operating load is continuously varying, it is significant to examine the disparity of loading conditions on the efficiency of the system. The different power system states, such as speed deviation, angle deviation and the rotor angle, were used with the base case system, PSS and UPFC PSS system. Three different scenarios, such as normal, light and heavy loading conditions, were considered for comparison.

4.3.1. Simulation Results in Normal Operating Conditions

A simulation in normal loading conditions was performed to compare the efficiency of the ALO-based PSS and UPFC with the base case system. From the results shown below, the oscillations do not effectively dampen the oscillation for the base case system. Table 6 presents the power system states in normal operating conditions.
Figure 29 above shows the speed deviations demonstrated with the base case, PSS only and UPFC-PSS in normal operating conditions. Due to little oscillation of the generator turbine, the maximum overshoot varies from 0.08 to 5.45% and the settling time from 49.25 to 78.54% for the PSS only and ALO-based PSS-UPFC, respectively. Figure 30 presents the rotor angle deviation of the system in normal operating conditions.
The rotor angle deviation in the base case is oscillatory and takes a long duration for power system stability enhancement, but the UPFC is coordinated with the PSS, and the system damps out the LFO. When the angle deviation is exposed to a change in angle, then the power is exposed to P , and the system is unstable. Figure 31 presents the rotor angle of the base case and the PSS with the UPFC under normal loading.
The settling time of the PSS and the PSS-UPFC was 64.13 and 82.35%, and the maximum overshoot was 0.17 and 11.35%, respectively. When compared to the base case, the ALO-based PSS-UPFC controller can effectively stabilize the system under the perturbation existing in the system.

4.3.2. Simulation Results in Heavy Operating Conditions

The proposed PSS with the UPFC controller at a rapid load increment was chosen as a disruption in heavy operating conditions. Table 7 presents the power system states in heavy operating conditions.
In Figure 32 above, due to little perturbation of the generator turbine, the overshoot is 0.0173, 0.0172 and 0.0162 pu, and the settling time is 20, 10.24 and 4.67 s for the base case, PSS and ALO-based PSS with the UPFC, respectively. Therefore, the rotor speed deviation of the ALO-based PSS-UPFC controller improves power system stability effectively compared to the base case and PSS controller in heavy operating conditions. Figure 33 presents the angle deviation in heavy operating conditions.
The angle deviation of the system in the base case is oscillatory, but when the UPFC-PSS is used, the system diminishes the oscillations and attains a steady state. Therefore, using an ALO-based UPFC damping controller improves power system stability effectively. When a deviation in the rotor angle is exposed to a negative change, the machine attains a steady state. Figure 34 presents the rotor angle of the base case and the PSS with the UPFC under heavy loading.
Based on the angle stability, the machine achieves inter-area mode or inter-area oscillation. Subsequently, δ decreases after a maximum value then the machine reaches its normal value. Using PSS has a settling time of 69.3%, and the ALO-based PSS-UPFC has a settling time of 83.1%.

4.3.3. Simulation Results in Light Operating Conditions

A rapid change in load is considered as a disturbance. Table 8, shown below, represents the overshoot and settling time in light operating conditions.
Figure 35 above is due to the perturbation of the generator turbine in which the maximum overshoot of speed deviation changes from 0.0172, 0.0171 and 0.0160 pu and a settling time of 20, 9.87 and 4.24 s for the base case, PSS only and PSS-UPFC, respectively. Generally, the speed deviation of the proposed system presents improved damping when compared to the base case and PSS-only controller. Figure 36 presents the rotor angle deviation in light operating conditions.
When the rotor angle deviation is exposed to a change in the angle then the active power is exposed to a change in power, and the machine is not stable, but the angle the machine achieves is its normal value. Figure 37 presents the rotor angle of the base case and the PSS with the UPFC in light loading conditions.
The rotor angle is about 2.25, 2.24 and 2.12 rad with the base case, PSS only and PSS-UPFC, respectively. Generally, during light loading conditions, the proposed system has better-damping behavior to improve power system stability under disturbance. In general, if the settling time is more, the power system stability improvement is less. Therefore, the simulation results reveal that the fine-tuning of the damping controllers demonstrates their superiority over the improper sizing of the base case system.

4.4. General Description of Results

Figure 28, Figure 31 and Figure 34 show the maximum overshoot and settling time of speed deviation in normal, heavy and light loading conditions. The figures look similar, but the magnitude of the maximum overshoot and settling time is different. The above Table 6, Table 7 and Table 8 clearly show the magnitude of the maximum overshoot and settling time of normal, heavy and light loading conditions, respectively.
In addition, Figure 29, Figure 32 and Figure 35 show the maximum overshoot and settling time of rotor angle deviation in normal, heavy and light loading conditions. The figures also look similar, but the magnitude of the maximum overshoot and settling time is different. The above Table 6, Table 7 and Table 8 also clearly show the magnitude of the maximum overshoot and settling time of rotor angle deviation in normal, heavy and light loading conditions, respectively.
Further, Figure 30, Figure 33 and Figure 36 show the maximum overshoot and settling time of the rotor angle in normal, heavy and light loading conditions. The figures also look similar, but the magnitude of the maximum overshoot and settling time is different. The above Table 6, Table 7 and Table 8 also clearly show the magnitude of the maximum overshoot and settling time of the rotor angle in normal, heavy and light loading conditions, respectively. Generally to know the difference between all these figures, carefully observe the magnitude of the maximum overshoot and settling time from the above tables.

4.5. Simulation Results Comparison

Figure 38 and Figure 39 present the maximum overshoot and settling time in numerous operating conditions.
Figure 38 and Figure 39 show the maximum overshoot and settling time of the speed deviation and rotor angle in normal, heavy and light loading conditions. These figures look similar, but the magnitude of the maximum overshoot and settling time is different. To identify the difference between Figure 38 and Figure 39, clearly observe the magnitude of the maximum overshoot and settling time.

5. Conclusions

The proposed PSS-UPFC approach was quite compatible to investigate dynamic stability in terms of the presented results. Moreover, the proposed technique needs a very small tuning time to estimate the main parameters of the objective functions provided. Thus, the robustness, efficiency and convergence criteria of the system have established that the applied technique improves dynamic stability. In addition, heftiness analysis was carried out by changing the operating conditions. The efficiency of the proposed PSS-UPFC controller for system stability was confirmed using the Tana Beles 400 kV line. As the Tana Beles 400 kV transmission line is sensitive to low-frequency oscillation, this method is applied to maintain the stability of the Ethiopian power system. The time domain and eigenvalue analyses present the robustness of the proposed PSS and UPFC system. Generally, when the PSS-UPFC is used for power system stability, a maximum overshoot of 12.67% and settling time of 79.8% improvement is obtained, but when only the PSS is used, the maximum overshoot is 1.78%, and a settling time of 48.15% improvement is made. This means that when we use the PSS-UPFC, the stability of the power system is improved by 12.67% maximum overshoot, and a 79.8% improvement is made for the settling time. However, for the PSS, the maximum overshoot is improved by only 1.78%, and the settling time is improved by only 48.15%.

6. Recommendation

It is strongly recommended that the northwest region of the Ethiopian power system should use a UPFC to reduce low-frequency oscillations and related problems to minimize system instability. Using a UPFC at the Bahir Dar substation is important for damping out the LFO caused by the number of overloaded lines. Additionally, very little research has been undertaken in the area of designing a control system and operation of UPFC. The main difficulty in using a UPFC is the complexity of its controller. Therefore, researchers should do a lot to reduce the complexity of its controller and recommend power companies to use.

Author Contributions

Conceptualization, E.S. and B.K.; methodology, E.S. and B.K.; software, E.S. and B.K.; validation, E.S. and B.K.; formal analysis, E.S. and B.K.; investigation, E.S., B.K., I.B., B.N., N.K., A.A., O.P.M. and A.E.P.B.; resources, E.S., B.K., I.B., B.N., N.K., A.A., O.P.M. and A.E.P.B.; data curation, E.S. and B.K.; writing—original draft preparation, E.S. and B.K.; writing—review and editing, E.S. and B.K.; visualization, E.S. and B.K.; supervision, B.K.; project administration, E.S., B.K., I.B., B.N., N.K., O.P.M. and A.E.P.B. All authors have read and agreed to the published version of the manuscript.

Funding

This research received no external funding.

Data Availability Statement

Data are not shared.

Acknowledgments

Authors would like to thank their universities for providing support.

Conflicts of Interest

The authors declare no conflict of interest.

References

  1. Kundur, P. Power System Stability and Control, 1st ed.; McGraw Hill: New York, NY, USA, 1994. [Google Scholar]
  2. Bayu, E.S.; Khan, B.; Ali, Z.M.; Alaas, Z.M.; Mahela, O.P. Mitigation of Low-Frequency Oscillation in Power Systems through Optimal Design of Power System Stabilizer Employing ALO. Energies 2022, 15, 3809. [Google Scholar] [CrossRef]
  3. Shahgholian, G.; Movahedi, A.; Faiz, J. Coordinated design of TCSC and PSS controllers using VURPSO and Genetic algorithms for multi-machine power system stability. Int. J. Control. Autom. Syst. 2014, 13, 398–409. [Google Scholar] [CrossRef]
  4. Yadav, M.; Soni, A. Improvement of power flow and voltage stability using unified power flow controller. In Proceedings of the 2016 International Conference on Electrical, Electronics, and Optimization Techniques (ICEEOT), Chennai, India, 3–5 March 2016; pp. 4056–4060. [Google Scholar] [CrossRef]
  5. Parhizgar, N.; Roopaei, M.; Esfandiar, P.; Dehghani, Z. Analysis of unified power flow controller (UPFC) parameters on power flow in power system. Aust. J. Basic Appl. Sci. 2011, 5, 703–710. [Google Scholar]
  6. Patil, S.; Mahajan, P.K. A Review on Implementation of UPFC for improvement of active power flow capability in power system using IEEE 14 bus system. Int. Res. J. Eng. Technol. 2017, 4, 542–547. [Google Scholar]
  7. Khodabakhshian, A.; Hooshmand, R.; Sharifian, R. Power system stability enhancement by designing PSS and SVC parameters coordinately using RCGA. In Proceedings of the 2009 Canadian Conference on Electrical and Computer Engineering, St. John’s, NL, Canada, 3–6 May 2009; pp. 579–582. [Google Scholar] [CrossRef]
  8. Thu, W.M.; Lin, K.M. Mitigation of Low Frequency Oscillations by Optimal Allocation of Power System Stabilizers: Case Study on MEPE Test System. Energy Power Eng. 2018, 10, 333–350. [Google Scholar] [CrossRef]
  9. Singla, C.R.; Rana, P. A critical study on the role of unified power flow control in voltage power transfer. In Proceedings of the 2016 3rd International Conference on Computing for Sustainable Global Development (INDIACom), New Delhi, India, 16–18 March 2016; pp. 3132–3135. [Google Scholar]
  10. Hussain, A.N.; Malek, F.; Rashid, M.A.; Malek, M.F.H.A. Performance improvement of power system stability by using multiple damping controllers based on PSS and the UPFC. Int. J. Eng. Technol. 2013, 5, 3257–3269. [Google Scholar]
  11. Alam, M.S.; Shafiullah, M.; Hossain, M.I.; Hasan, M.N. Enhancement of power system damping employing TCSC with genetic algorithm based controller design. In Proceedings of the 2015 International Conference on Electrical Engineering and Information Communication Technology (ICEEICT), Savar, Dhaka, Bangladesh, 21–23 May 2015; pp. 21–23. [Google Scholar]
  12. Wang, H. Damping function of unified power flow controller. IEE Proc. Gener. Transm. Distrib. 1999, 146, 81–87. [Google Scholar] [CrossRef]
  13. Hassan, L.H.; Moghavvemi, M.; Mohamed, H.A.F. Impact of UPFC-based damping controller on dynamic stability of Iraqi power network. Sci. Res. Essays 2011, 6, 136–145. [Google Scholar]
  14. Abdel-Magid, Y.L.; Abido, M.A. Optimal Multi objective Design of Robust Power System Stabilizers Using Genetic Algorithms. IEEE Trans. Power Syst. 2003, 18, 1125–1132. [Google Scholar] [CrossRef]
  15. Prasad, K.H.; Tirumalaiah, S. Dynamic Performance of the Interline Unified Power Flow Controller (IUPFC) System Using 48-Pulse GTO Thyristor. Citeseer 2014, 1, 13–22. [Google Scholar]
  16. Banaei, M.R.; Hashemi, A. An adaptive UPFC based stabilizer for damping of low frequency oscillation. J. Electr. Eng. Technol. 2010, 5, 197–208. [Google Scholar] [CrossRef]
  17. Shahriar, M.S.; Shafiullah, M.; Rana, M.J. Stability enhancement of PSS-UPFC installed power system by support vector regression. Electr. Eng. 2017, 100, 1601–1612. [Google Scholar] [CrossRef]
  18. Shayeghi, H.; Shayanfar, H.A.; Jalilzadeh, S.; Safari, A. Design of output feedback UPFC controller for damping of elec-tromechanical oscillations using PSO. Energy Convers. Manag. 2009, 50, 2554–2561. [Google Scholar] [CrossRef]
  19. Utami, R.S.; Abu-Siada, A.; Suwarno; Hariyanto, N.; Djalal, M.R.; Hartono, J. Optimal Tuning of Unified Power Flow Controller Using Firefly Algorithm to Improve Damping of Inter-Area Oscillations in Multi-Machine System. In Proceedings of the 2020 2nd International Conference on Smart Power & Internet Energy Systems (SPIES), Bangkok, Thailand, 15–18 September 2020; pp. 436–441. [Google Scholar] [CrossRef]
  20. Haghshenas, M.; Hajibabaee, M.; Ebadian, M. Controller Design of STATCOM Using Modified Shuffled Frog Leaping Algorithm for Damping of Power System Low Frequency Oscillation. Int. J. Mechatron. Electr. Comput. Technol. 2016, 6, 2786–2799. [Google Scholar]
  21. Jalali, A.; Aldeen, M. Placement and operation of STATCOM-storage for voltage stability enhancement of power systems with embedded wind farms. In Proceedings of the 2016 IEEE Innovative Smart Grid Technologies-Asia (ISGT-Asia), Melbourne, VIC, Australia, 28 November–1 December 2016; pp. 948–953. [Google Scholar] [CrossRef]
  22. Vigneysh, T.; Kumarappan, N. Stability analysis and dynamic performance enhancement of autonomous microgrid using adaptive fuzzy PI controller. In Proceedings of the 2017 IEEE Congress on Evolutionary Computation (CEC), Donostia, Spain, 5–8 June 2017; pp. 1199–1206. [Google Scholar] [CrossRef]
  23. Vantsevitch, V. Enhancement of Dynamical Characteristics of a Fuzzy Control. In Proceedings of the 2018 IEEE International Conference on Fuzzy Systems (FUZZ-IEEE), Rio de Janeiro, Brazil, 8–13 July 2018; pp. 1–8. [Google Scholar]
Figure 1. One-line representation of the overall transmission line with UPFC.
Sustainability 15 06980 g001
Figure 2. Classical model of synchronous generator.
Sustainability 15 06980 g002
Figure 3. Excitation system with PSS.
Sustainability 15 06980 g003
Figure 4. Block diagram of PSS.
Sustainability 15 06980 g004
Figure 5. Power system stabilizer with AVR block [2].
Sustainability 15 06980 g005
Figure 6. Single line diagram of UPFC.
Sustainability 15 06980 g006
Figure 7. UPFC with damping controller.
Sustainability 15 06980 g007
Figure 8. UPFC with damping controller and DC voltage regulator.
Sustainability 15 06980 g008
Figure 9. UPFC with damping controller.
Sustainability 15 06980 g009
Figure 10. Damping controller and DC-voltage regulator equipped with UPFC.
Sustainability 15 06980 g010
Figure 11. Location of objective function [2].
Sustainability 15 06980 g011
Figure 12. Structure of PSS using ALO.
Sustainability 15 06980 g012
Figure 13. Eigenvalues in normal loading conditions.
Sustainability 15 06980 g013
Figure 14. Eigenvalues in light loading conditions.
Sustainability 15 06980 g014
Figure 15. Eigenvalues in heavy loading conditions.
Sustainability 15 06980 g015
Figure 16. Eigenvalues with PSS only in normal operating conditions.
Sustainability 15 06980 g016
Figure 17. Eigenvalues with PSS only in light operating conditions.
Sustainability 15 06980 g017
Figure 18. Eigenvalues with PSS only in heavy operating conditions.
Sustainability 15 06980 g018
Figure 19. Eigenvalues with PSS-UPFC in normal operating conditions.
Sustainability 15 06980 g019
Figure 20. Eigenvalues with PSS-UPFC in light operating conditions.
Sustainability 15 06980 g020
Figure 21. Eigenvalues with PSS-UPFC in heavy operating conditions.
Sustainability 15 06980 g021
Figure 22. Modulation index of series ( m B ) and shunt converter ( m E ).
Sustainability 15 06980 g022
Figure 23. Phase angle of series ( δ B ) and shunt converter ( δ E ).
Sustainability 15 06980 g023
Figure 24. DC-link capacitor voltage.
Sustainability 15 06980 g024
Figure 25. (a) Voltage, (b) active and (c) reactive power using UPFC.
Sustainability 15 06980 g025aSustainability 15 06980 g025b
Figure 26. Overshoot and settling time of speed deviation [2].
Sustainability 15 06980 g026
Figure 27. Overshoot and settling time of rotor angle deviation [2].
Sustainability 15 06980 g027
Figure 28. Overshoot and settling time of rotor angle.
Sustainability 15 06980 g028
Figure 29. Speed deviation of the system in normal loading conditions.
Sustainability 15 06980 g029
Figure 30. Rotor angle deviation under normal loading.
Sustainability 15 06980 g030
Figure 31. Rotor angle of base case and PSS with UPFC under normal loading.
Sustainability 15 06980 g031
Figure 32. Generator rotor speed deviation in heavy operating conditions.
Sustainability 15 06980 g032
Figure 33. Angle deviation in heavy operating conditions.
Sustainability 15 06980 g033
Figure 34. Rotor angle of base case and PSS with UPFC in heavy operating conditions.
Sustainability 15 06980 g034
Figure 35. Rotor speed deviation in light operating conditions.
Sustainability 15 06980 g035
Figure 36. Angle deviation in light operating conditions.
Sustainability 15 06980 g036
Figure 37. Rotor angle of base case and PSS with UPFC at light loading.
Sustainability 15 06980 g037
Figure 38. Time domain simulation of rotor speed deviation.
Sustainability 15 06980 g038
Figure 39. Time domain simulation of rotor angle.
Sustainability 15 06980 g039
Table 1. Power system stabilizer parameter limits.
ParametersT1T2T3T4K
Lower bound0.010.010.010.010.01
Upper bound111120
Table 2. Optimal values of PSS.
ParametersKTwT1T2T3T4
Values14.265100.019680.36080.15440.4632
Table 3. Eigenvalues of base case system in different operating conditions.
Operating ConditionNormal LoadingLight LoadingHeavy Loading
Eigenvalues for base case system+0.1527 + 9.1627i−7.0589 + 0.0000i+0.1320 + 12.5527i
+0.1527 − 9.1627i+1.5345 + 0.0000i+0.1320 − 12.5527i
+1.4242 + 0.0000i+0.1156 + 5.1410i+1.5318 + 0.0000i
−6.9972 + 0.0000i+0.1156 − 5.1410i−6.9952 + 0.0000i
−2.8657 + 0.0000i−2.8400 + 0.0000i−2.9339 + 0.0000i
Eigenvalues for PSS and UPFC Controller−0.2655 + 7.2754i−0.2616 + 4.1837i−0.2701 + 10.1023i
−0.2655 − 7.2754i−0.2616 − 4.1837i−0.2701 − 10.1023i
−2.5097 + 2.447i−2.5210 + 2.4518i−2.5038 + 2.4946i
−2.5097 − 2.447i−2.5210 − 2.45181i−2.5038 − 2.4946i
−0.0154 + 0.000i−0.0007 + 0.0000i−0.0182 + 0.0000i
Table 4. PSS and UPFC-POD parameters using different approaches.
Parameters
Algorithm
KTwT1T2T3T4Sizing Time
(s)
ALO6.5396100.117890 0.600620.315860.6667515.531407
GA8.0538100.0202610. 916120. 990060. 181719.4363
PSO13.0739100.5068480.04137080.787130.8195106.3817
TLBO9.0307100.957540.390320.277620.22551203.4058
Table 5. The comparison of different optimization methods for power system states.
Maximum OvershootSettling Time (s)
ConventionalGAPSOTLBOALOConventionalGAPSOTLBOALO
ω 0.01830.01820.01810.01800.0166206.9811.8714.454.6
δ −2.166−1.933−1.934−1.931−1.862206.269.7412.223.92
δ 2.15062.18932.19352.19582.1936203.24.857.762.74
Table 6. Power system states in normal operating conditions.
Power System StatesOvershootSettling Time (s)
Base CasePSS OnlyPSS and UPFCBase CasePSS
Only
PSS-UPFC
ω   ( p u ) 0.01720.01710.01612010.24.17
δ   ( r a d ) −2.016−2.017−1.8820 10.254.01
δ   ( r a d ) 2.262.252.05125.172.77
Table 7. Power system states in heavy operating conditions.
System StatesMaximum OvershootSettling Time (s)
Base CasePSS OnlyPSS-UPFCBase CasePSS OnlyPSS-UPFC
ω   ( p u ) 0.01730.01720.01622010.244.67
δ   ( r a d ) −2.03−2.02−1.8220 10.314.13
δ   ( r a d ) 2.362.352.1111.24.292.5
Table 8. System states in light operating conditions.
System StatesMaximum OvershootSettling Time (s)
Base CasePSS OnlyPSS-UPFCBase CasePSS OnlyPSS-UPFC
ω   ( p u ) 0.01720.01710.0160209.874.24
δ   ( r a d ) −2.015−2.012−1.761208.034.01
δ   ( r a d ) 2.252.242.12104.62.72
Disclaimer/Publisher’s Note: The statements, opinions and data contained in all publications are solely those of the individual author(s) and contributor(s) and not of MDPI and/or the editor(s). MDPI and/or the editor(s) disclaim responsibility for any injury to people or property resulting from any ideas, methods, instructions or products referred to in the content.

