
A Study of the Impact of Cultural Characteristics on Consumers’ Behavioral Intention for Mobile Payments: A Comparison between China and Korea


Abstract
:1. Introduction
2. Literature Review
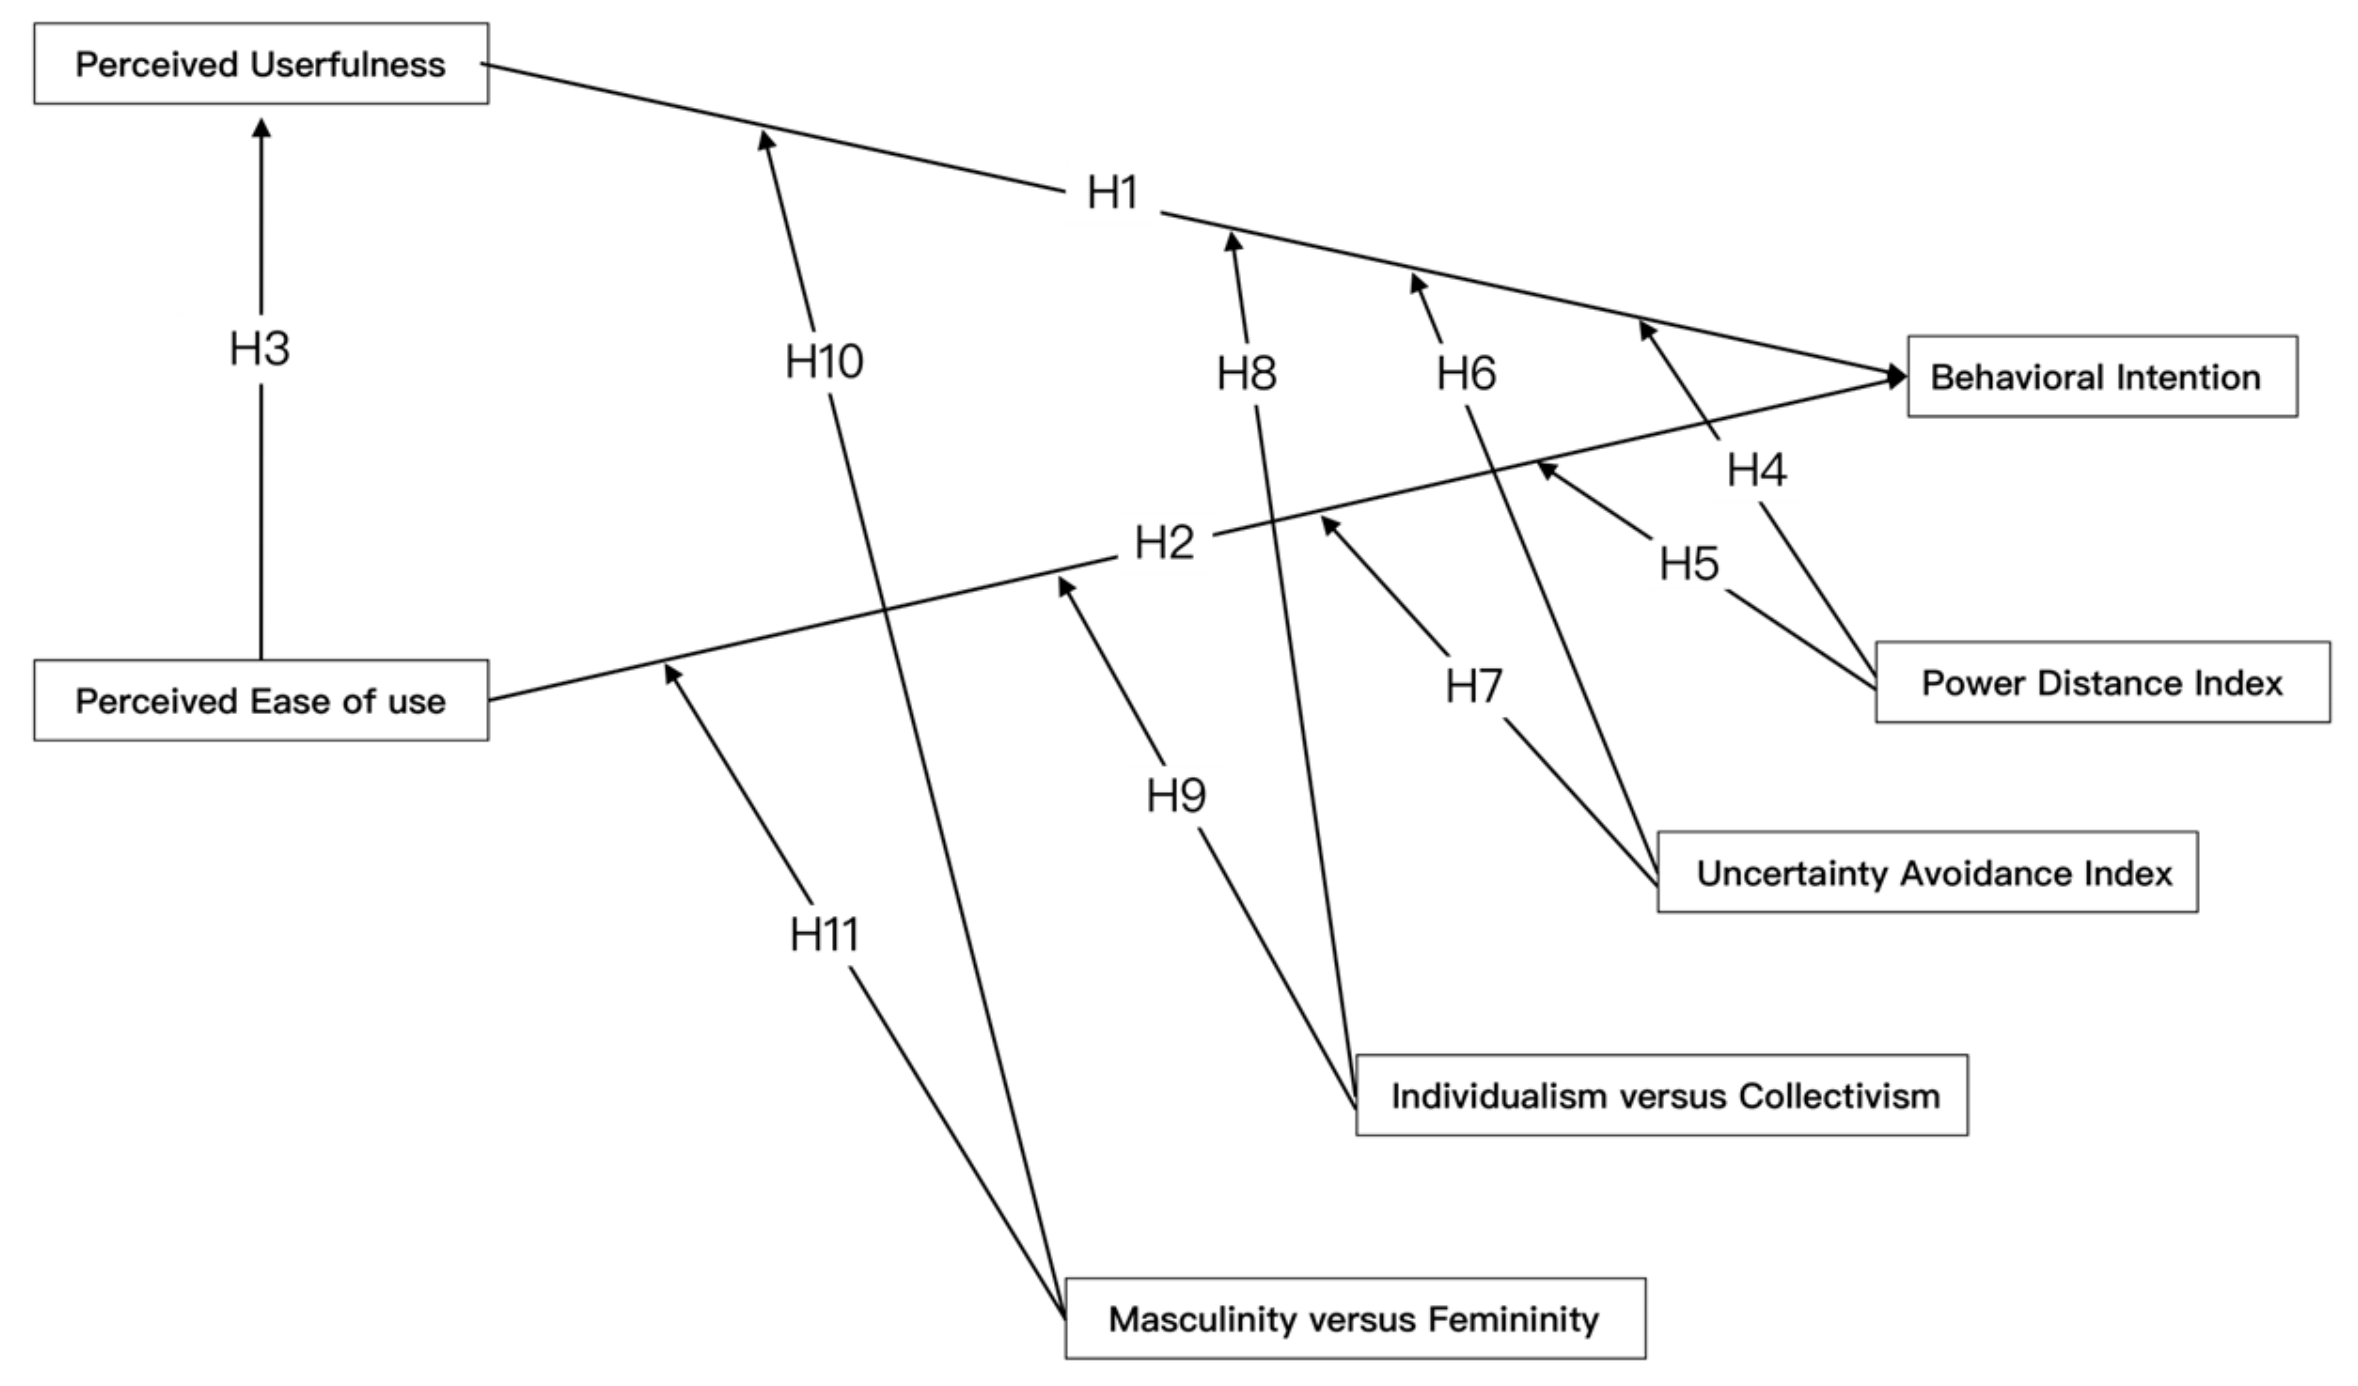
2.1. Theoretical Model and Research Hypothesis
2.2. Research Model
3. Research Design and Methodology
3.1. Questionnaire Collection
3.2. Sample Population Distribution
3.3. China and Korea Payment Information Survey
3.4. Questionnaire Reliability
3.5. Questionnaire Validity
3.6. Comparison of Chinese and Korean National Cultures
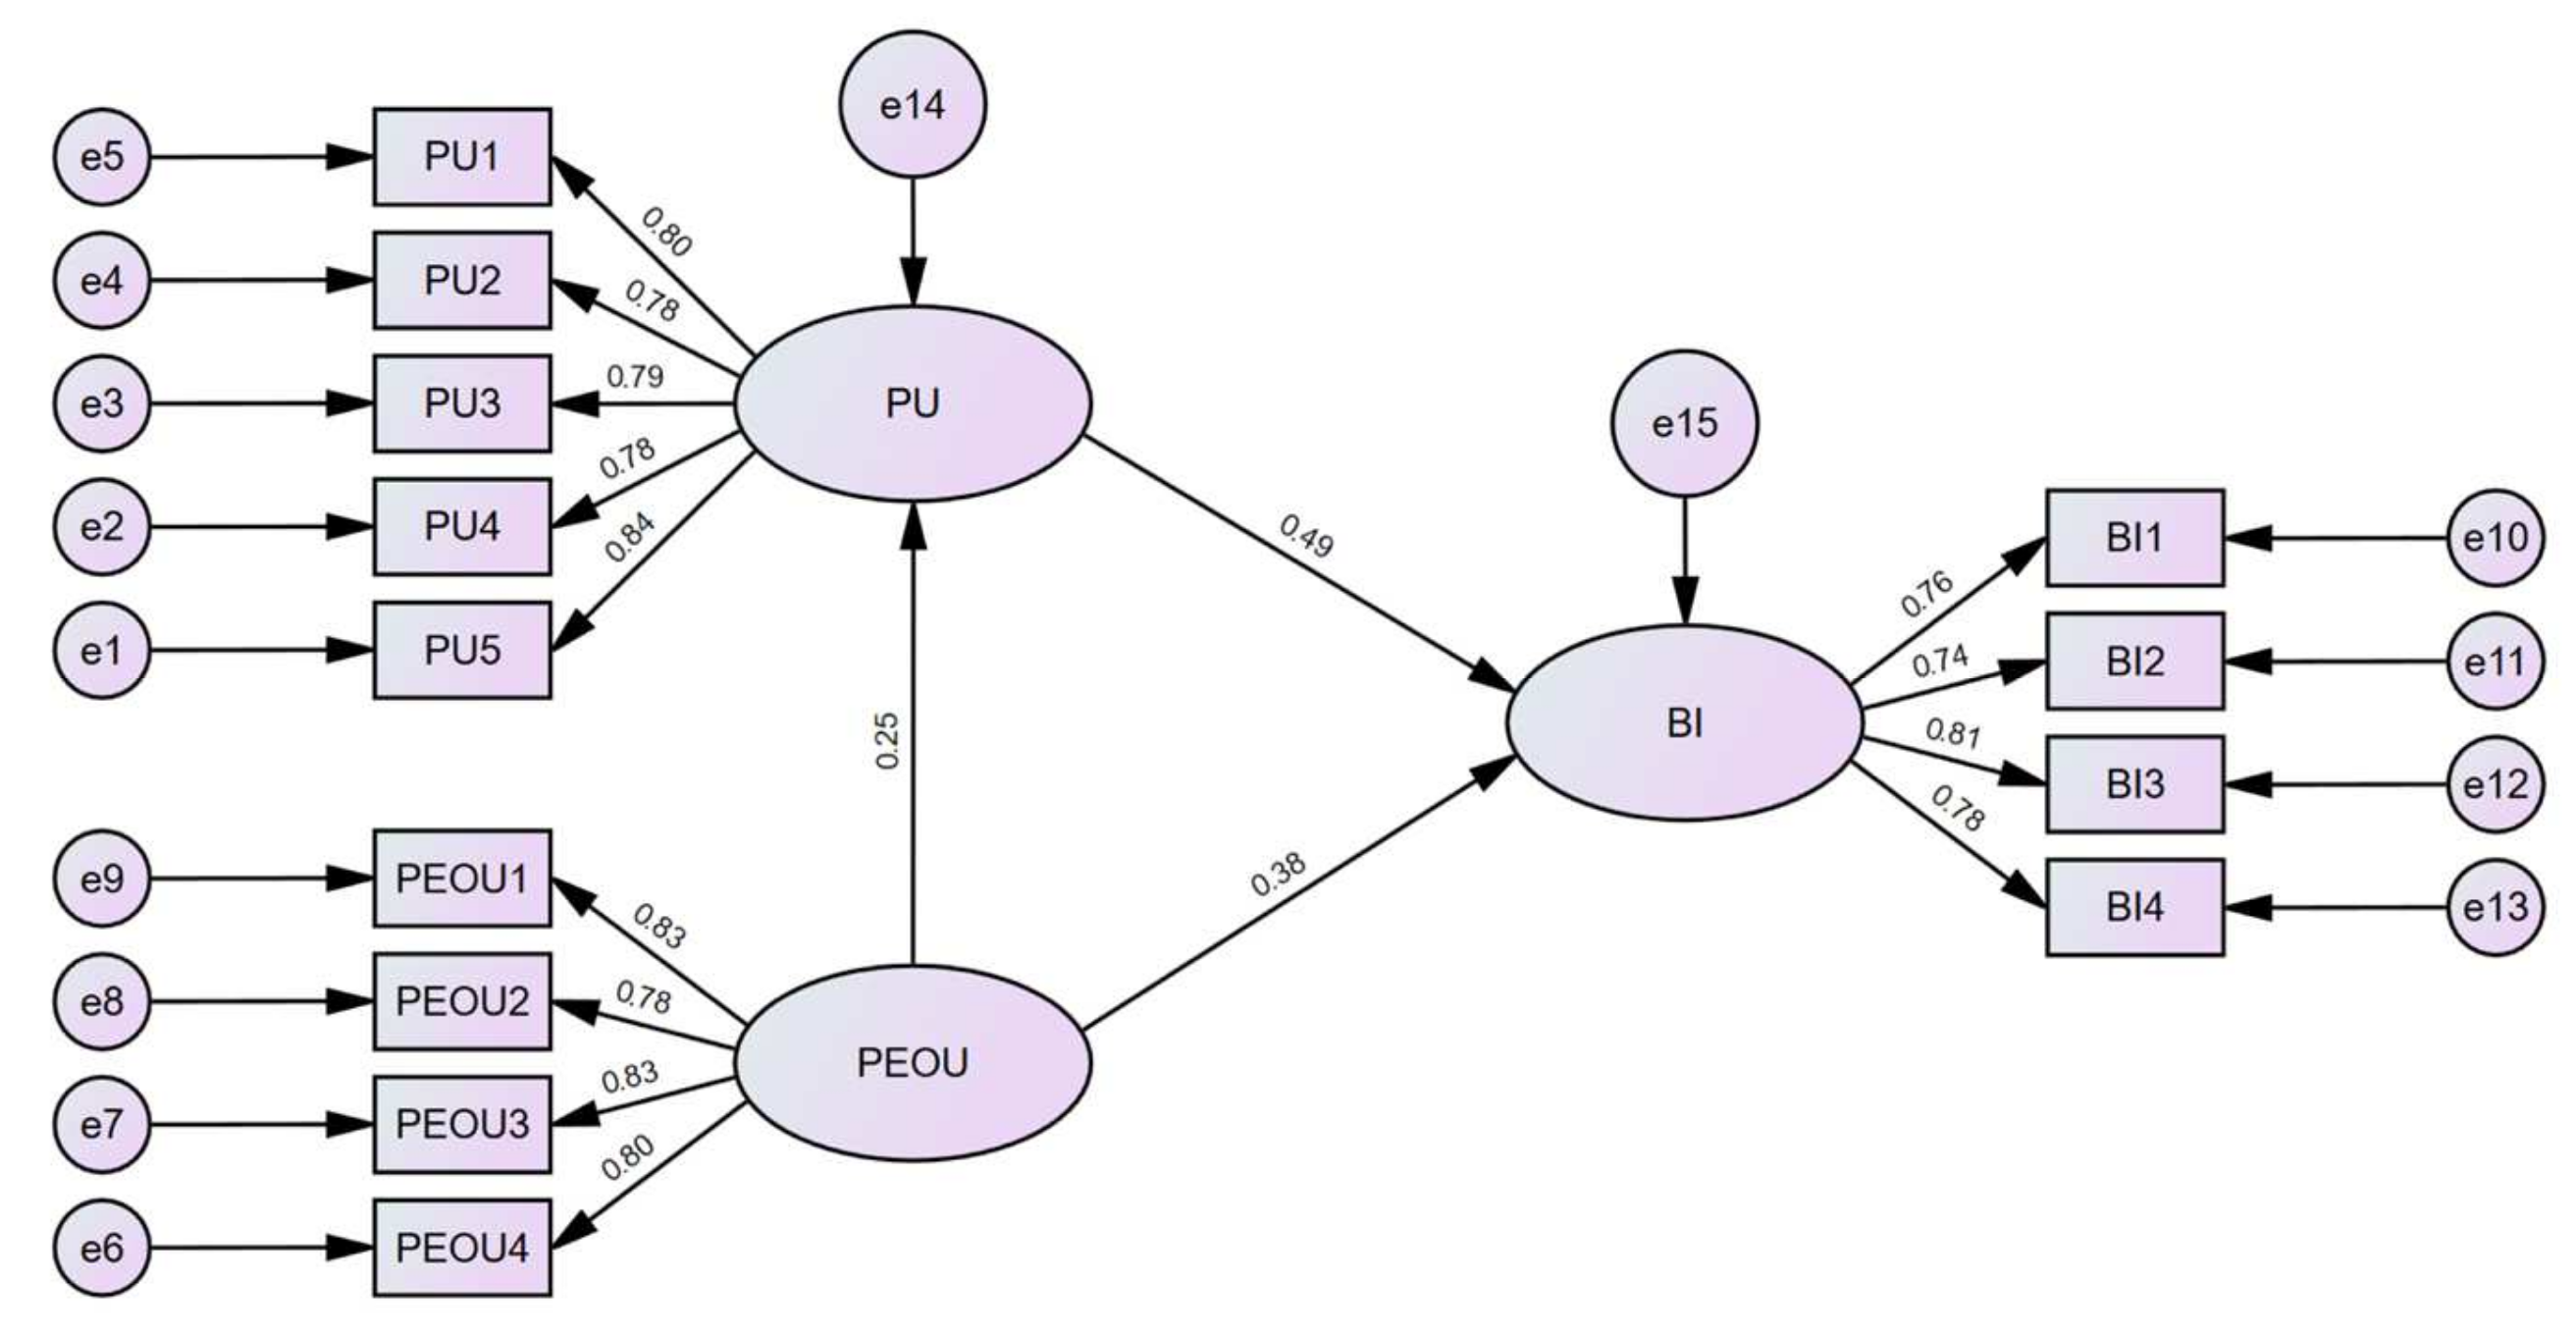
3.7. Validating Model Assumptions
3.8. Cultural Variable Moderation Effect Test
4. Discussion
5. Conclusions
Author Contributions
Funding
Institutional Review Board Statement
Informed Consent Statement
Data Availability Statement
Conflicts of Interest
References
- Ngai, E.W.; Gunasekaran, A. A review for mobile commerce research and applications. Decis. Support Syst. 2007, 43, 3–15. [Google Scholar] [CrossRef]
- Shankar, A.; Datta, B. Factors affecting mobile payment adoption intention: An Indian perspective. Glob. Bus. Rev. 2018, 19 (Suppl. 3), S72–S89. [Google Scholar] [CrossRef]
- The 50th Statistical Report on China’s Internet Development. Available online: https://www.cnnic.cn/NMediaFile/2022/0926/MAIN1664183425619U2MS433V3V.pdf (accessed on 16 February 2023).
- The Trend and Innovation Strategies of Business Model for Mobile Internet in China (2023–2028). Available online: https://bg.qianzhan.com/report/detail/920be30cf2904af8.html (accessed on 9 February 2023).
- Questionnaire on Mobile Payment User Usage in 2022. Available online: https://www.djyanbao.com/report/detail?id=3395099&from=search_list (accessed on 21 January 2023).
- Mobile payments in South Korea—Statistics & Facts. Available online: https://www.statista.com/topics/8307/mobile-payments-in-south-korea/#topicOverview (accessed on 22 January 2023).
- Kakao Pay Prospectus. Available online: https://kakaopaysec.com/product/productNotice/dynamicBoardPageDetail.do?id=4476 (accessed on 18 February 2023).
- Wiseapp Samsung Pay. Available online: https://www.wiseapp.co.kr/app/detail/625df001d4cf8dc6365179be0512685c/?tabType=usage (accessed on 20 January 2023).
- The Korea Economic Daily. Available online: https://www.hankyung.com/economy/article/202302066021i (accessed on 18 February 2023).
- Digital Payments Report 2021. Available online: https://www.statista.com/study/41122/fintech-report-digital-payments/ (accessed on 18 February 2023).
- Davis, F.D. Perceived usefulness, perceived ease of use, and user acceptance of information technology. MIS Q. 1989, 13, 319–340. [Google Scholar] [CrossRef]
- Quan, W.; Moon, H.; Kim, S.S.; Han, H. Mobile, traditional, and cryptocurrency payments influence consumer trust, attitude, and destination choice: Chinese versus Koreans. Int. J. Hosp. Manag. 2023, 108, 103363. [Google Scholar] [CrossRef]
- Vărzaru, A.A.; Bocean, C.G.; Rotea, C.C.; Budică-Iacob, A.F. Assessing antecedents of behavioral intention to use mobile technologies in e-commerce. Electronics 2021, 10, 2231. [Google Scholar] [CrossRef]
- Lian, J.W.; Li, J. The dimensions of trust: An investigation of mobile payment services in Taiwan. Technol. Soc. 2021, 67, 101753. [Google Scholar] [CrossRef]
- Abu-Taieh, E.M.; AlHadid, I.; Abu-Tayeh, S.; Masa’deh, R.E.; Alkhawaldeh, R.S.; Khwaldeh, S.; Alrowwad, A.A. Continued intention to use of M-Banking in Jordan by integrating UTAUT, TPB, TAM and service quality with ML. J. Open Innov. Technol. Mark. Complex. 2022, 8, 120. [Google Scholar] [CrossRef]
- Dash, G.; Sharma, K.; Yadav, N. The diffusion of mobile payments: Profiling the adopters and non-adopters, Roger’s way. J. Retail. Consum. Serv. 2023, 71, 103219. [Google Scholar] [CrossRef]
- Firmansyah, I.A.; Yasirandi, R.; Utomo, R.G. The influence of efficacy, credibility, and normative pressure to M-banking adoption level in Indonesia. Procedia Comput. Sci. 2022, 197, 51–60. [Google Scholar] [CrossRef]
- Silanoi, W.; Naruetharadhol, P.; Ponsree, K. The Confidence of and Concern about Using Mobile Banking among Generation Z: A Case of the Post COVID-19 Situation in Thailand. Soc. Sci. 2023, 12, 198. [Google Scholar] [CrossRef]
- Ly, B.; Ly, R. Internet banking adoption under Technology Acceptance Model—Evidence from Cambodian users. Comput. Hum. Behav. Rep. 2022, 7, 100224. [Google Scholar] [CrossRef]
- Türker, C.; Altay, B.C.; Okumuş, A. Understanding user acceptance of QR code mobile payment systems in Turkey: An extended TAM. Technol. Forecast. Soc. Change 2022, 184, 121968. [Google Scholar] [CrossRef]
- Almajali, D.; Al-Okaily, M.; Al-Daoud, K.; Weshah, S.; Shaikh, A.A. Go Cashless! Mobile Payment Apps Acceptance in Developing Countries: The Jordanian Context Perspective. Sustainability 2022, 14, 13524. [Google Scholar] [CrossRef]
- Hassan, H.E.; Wood, V.R. Does country culture influence consumers’ perceptions toward mobile banking? A comparison between Egypt and the United States. Telemat. Inform. 2020, 46, 101312. [Google Scholar] [CrossRef]
- Zhang, B.; Ying, L.; Khan, M.A.; Ali, M.; Barykin, S.; Jahanzeb, A. Sustainable Digital Marketing: Factors of Adoption of M-Technologies by Older Adults in the Chinese Market. Sustainability 2023, 15, 1972. [Google Scholar] [CrossRef]
- Yang, C.C.; Yang, S.Y.; Chang, Y.C. Predicting Older Adults’ Mobile Payment Adoption: An Extended TAM Model. Int. J. Environ. Res. Public Health 2023, 20, 1391. [Google Scholar] [CrossRef]
- Bao, L.Y.; Pan, Y. A Study on the Acceptability for Mobile Payment Platforms by China’s Early Elder People. J. Korea Converg. Soc. 2021, 12, 53–67. [Google Scholar]
- Kasemharuethaisuk, H.; Samanchuen, T. Factors Influencing Behavior Intention in Digital Investment Services of Mutual Fund Distributors Adoption in Thailand. Sustainability 2023, 15, 2279. [Google Scholar] [CrossRef]
- Almaiah, M.A.; Al-Rahmi, A.; Alturise, F.; Hassan, L.; Lutfi, A.; Alrawad, M.; Aldhyani, T.H. Investigating the Effect of Perceived Security, Perceived Trust, and Information Quality on Mobile Payment Usage through Near-Field Communication (NFC) in Saudi Arabia. Electronics 2022, 11, 3926. [Google Scholar] [CrossRef]
- Li, C.; Li, H. Disentangling Facial Recognition Payment Service Usage Behavior: A Trust Perspective. Telemat. Inform. 2023, 77, 101939. [Google Scholar] [CrossRef]
- Zhong, Y.; Moon, H.C. Investigating customer behavior of using contactless payment in China: A comparative study of facial recognition payment and mobile QR-code payment. Sustainability 2022, 14, 7150. [Google Scholar] [CrossRef]
- Cardon, P.W.; Marshall, B.A. National culture and technology acceptance: The impact of uncertainty avoidance. Issues Inf. Syst. 2008, 9, 103–110. [Google Scholar]
- Hofstede, G. Culture’s Consequences: International Differences in Work-Related Values; Sage: London, UK, 1984; Volume 5. [Google Scholar]
- Picoto, W.N.; Pinto, I. Cultural impact on mobile banking use–A multi-method approach. J. Bus. Res. 2021, 124, 620–628. [Google Scholar] [CrossRef]
- Dang, M.; Hoang, V.A.; Jones, E.; Henry, D.; Le, P.U.; Puwanenthiren, P. Country uncertainty, power distance, and payment methods in acquisitions. Eur. J. Financ. 2022, 28, 1541–1570. [Google Scholar] [CrossRef]
- Wang, J.J.; Lalwani, A.K.; DelVecchio, D. The impact of Power Distance Belief on consumers’ brand preferences. Int. J. Res. Mark. 2022, 39, 804–823. [Google Scholar] [CrossRef]
- Lee, H.; Lalwani, A.K.; Wang, J.J. Price no object!: The impact of power distance belief on consumers’ price sensitivity. J. Mark. 2020, 84, 113–129. [Google Scholar] [CrossRef]
- Jiang, L.; Gao, H.; Shi, L.H. The effect of power distance beliefs on the inconspicuous versus conspicuous consumption of luxury accessories in China and the USA. J. Mark. Manag. 2021, 37, 1459–1489. [Google Scholar] [CrossRef]
- Aw, E.C.X.; Chuah, S.H.W.; Sabri, M.F.; Basha, N.K. Go loud or go home? How power distance belief influences the effect of brand prominence on luxury goods purchase intention. J. Retail. Consum. Serv. 2021, 58, 102288. [Google Scholar] [CrossRef]
- Al-Adwan, A.S.; Al-Debei, M.M.; Dwivedi, Y.K. E-commerce in high uncertainty avoidance cultures: The driving forces of repurchase and word-of-mouth intentions. Technol. Soc. 2022, 71, 102083. [Google Scholar] [CrossRef]
- Lisana, L. Factors influencing the adoption of mobile payment systems in Indonesia. Int. J. Web Inf. Syst. 2021, 17, 10. [Google Scholar] [CrossRef]
- Al-Okaily, M.; Lutfi, A.; Alsaad, A.; Taamneh, A.; Alsyouf, A. The determinants of digital payment systems’ acceptance under cultural orientation differences: The case of uncertainty avoidance. Technol. Soc. 2020, 63, 101367. [Google Scholar] [CrossRef]
- Zhang, Y.; Sun, J.; Yang, Z.; Wang, Y. What makes people actually embrace or shun mobile payment: A cross-culture study. Mob. Inf. Syst. 2018, 2018, 7497545. [Google Scholar] [CrossRef]
- Sasongko, D.T.; Handayani, P.W.; Satria, R. Analysis of factors affecting continuance use intention of the electronic money application in Indonesia. Procedia Comput. Sci. 2022, 197, 42–50. [Google Scholar] [CrossRef]
- Migliore, G.; Wagner, R.; Cechella, F.S.; Liébana-Cabanillas, F. Antecedents to the adoption of mobile payment in China and Italy: An integration of UTAUT2 and innovation resistance theory. Inf. Syst. Front. 2022, 24, 2099–2122. [Google Scholar] [CrossRef]
- Xu, J.; Cheng, C. Uncertainty avoidance, individualism and the readiness of Business-to-Consumer E-commerce. J. Asian Financ. Econ. Bus. 2021, 8, 791–801. [Google Scholar]
- Crossler, R.E.; Andoh-Baidoo, F.K.; Menard, P. Espoused cultural values as antecedents of individuals’ threat and coping appraisal toward protective information technologies: Study of US and Ghana. Inf. Manag. 2019, 56, 754–766. [Google Scholar] [CrossRef]
- Al-Adwan, A.S.; Alrousan, M.K.; Yaseen, H.; Alkufahy, A.M.; Alsoud, M. Boosting Online Purchase Intention in High-Uncertainty-Avoidance Societies: A Signaling Theory Approach. J. Open Innov. Technol. Mark. Complex. 2022, 8, 136. [Google Scholar] [CrossRef]
- Faqih, K.M.; Jaradat, M.I.R.M. Assessing the moderating effect of gender differences and individualism-collectivism at individual-level on the adoption of mobile commerce technology: TAM3 perspective. J. Retail. Consum. Serv. 2015, 22, 37–52. [Google Scholar] [CrossRef]
- Gentry, J.W.; Doering, M.; O’Brien, T.V. Masculinity and femininity factors in product perception and self image. ACR North Am. Adv. 1978. Available online: https://www.acrwebsite.org/volumes/9444/volumes/v05/NA%20-%2005 (accessed on 23 February 2023).
- Debevec, K.; Iyer, E. Sex roles and consumer perceptions of promotions, products, and self: What do we know and where should we be headed? ACR North Am. Adv. 1986. Available online: https://www.acrwebsite.org/volumes/6491/volumes/v13/NA-13 (accessed on 23 February 2023).
- Wang, P.; Zhai, Y. The impact of long-term orientation on compulsive buying behavior: A cross-cultural study. Front. Psychol. 2022, 13, 979908. [Google Scholar] [CrossRef] [PubMed]
- Lin, X.; Wu, R.; Lim, Y.T.; Han, J.; Chen, S.C. Understanding the sustainable usage intention of mobile payment technology in Korea: Cross-countries comparison of Chinese and Korean users. Sustainability 2019, 11, 5532. [Google Scholar] [CrossRef]


| Variable | Operation Definition | Source |
|---|---|---|
| Behavioral intention | The intensity of consumers’ behavioral intentions for using mobile payment services | Davis (1989) [11] |
| Perceived usefulness | The degree to which consumers believe that using mobile payment services can help them improve their performance | Davis (1989) [11] |
| Perceived ease of use | How easy it is for consumers to learn to use and operate mobile payment services | Davis (1989) [11] |
| Power distance | The degree to which people of low status in a society accept the unequal distribution of power in a society or organization. | Geert Hofstede (2001) [31] |
| Uncertainty avoidance | Whether a society avoids and controls uncertainty through formal channels when it is threatened by uncertain events and unconventional environments. | Geert Hofstede (2001) [31] |
| Individualism versus collectivism | Whether a society as a whole pays attention to the interests of individuals or the interests of the collective. | Geert Hofstede (2001) [31] |
| Masculinity versus femininity | Whether a certain society represents male qualities such as competitiveness and assertiveness, or female qualities such as humility and caring for others, as well as the definition of male and female functions. | Geert Hofstede (2001) [31] |
| Item | China | Korea | ||
|---|---|---|---|---|
| Number | Percentage | Number | Percentage | |
| Valid questionnaire | 306 | 90.53% | 305 | 92.70% |
| Invalid questionnaire | 32 | 9.47% | 24 | 7.30% |
| Total | 338 | 100% | 329 | 100% |
| Item | China | Korea | |||
|---|---|---|---|---|---|
| Number | Percentage | Number | Percentage | ||
| Sex | Male | 170 | 55.55% | 163 | 53.44% |
| Female | 136 | 44.45% | 142 | 46.56% | |
| Age (years) | Below 20 | 8 | 2.61% | 6 | 2.70% |
| 20–29 | 113 | 36.93% | 112 | 35.80% | |
| 30–39 | 137 | 44.77% | 107 | 34.40% | |
| 40–49 | 30 | 9.80% | 59 | 18.80% | |
| 50–59 | 12 | 3.92% | 19 | 6.70% | |
| Over 60 | 6 | 1.96% | 5 | 1.50% | |
| Occupation | Student | 19 | 6.21% | 73 | 23.40% |
| Manual worker | 19 | 6.21% | 40 | 13.40% | |
| Office worker | 109 | 35.62% | 93 | 29.50% | |
| Professional, skilled worker | 42 | 13.73% | 51 | 16.40% | |
| Researcher | 81 | 26.47% | 15 | 5.50% | |
| Manager of one or more subordinates (non-managers) | 28 | 9.15% | 24 | 8.20% | |
| Senior manager of one or more subordinates (managers) | 8 | 2.61% | 9 | 3.60% | |
| Education | Below high-school graduation | 73 | 23.86% | 42 | 15.20% |
| Graduation | 218 | 71.24% | 234 | 73.60% | |
| Master’s degree and above | 15 | 4.90% | 29 | 11.20% | |
| Total | 306 | 100% | 305 | 100% | |
| Item | Payment Method | |||
|---|---|---|---|---|
| Cash | Mobile Pay | Card | ||
| Most used payment method | Number | 31 | 216 | 59 |
| Percentage | 10.13% | 70.59% | 19.28% | |
| Second preferred payment method | Number | 68 | 30 | 208 |
| Percentage | 22.22% | 9.80% | 67.97% | |
| Item | Payment Method | ||||
|---|---|---|---|---|---|
| Cash | Mobile Pay | Card | Money Transfer | ||
| Most used payment method | Number | 7 | 74 | 224 | 0 |
| Percentage | 2.10% | 26.70% | 71.10% | 0.00% | |
| Second preferred payment method | Number | 57 | 142 | 83 | 23 |
| Percentage | 18.50% | 46.50% | 26.70% | 8.25% | |
| Variable | KMO | Bartlett Spherical Test | ||||||
|---|---|---|---|---|---|---|---|---|
| Approx. Chi-Square | df | Sig. | ||||||
| China | Korea | China | Korea | China | Korea | China | Korea | |
| Behavioral intention | 0.826 | 0.804 | 513.251 | 738.674 | 6 | 6 | 0.00 | 0.00 |
| Perceived usefulness | 0.89 | 0.842 | 845.837 | 648.519 | 10 | 10 | 0.00 | 0.00 |
| Perceived ease of use | 0.839 | 0.843 | 648.157 | 732.218 | 6 | 6 | 0.00 | 0.00 |
| Power distance | 0.88 | 0.821 | 704.538 | 788.291 | 10 | 10 | 0.00 | 0.00 |
| Uncertainty avoidance | 0.873 | 0.829 | 609.443 | 477.315 | 10 | 10 | 0.00 | 0.00 |
| Individualism versus collectivism | 0.877 | 0.847 | 663.604 | 707.686 | 10 | 10 | 0.00 | 0.00 |
| Masculinity versus femininity | 0.874 | 0.866 | 615.069 | 986.554 | 10 | 10 | 0.00 | 0.00 |
| CMIN | X2/df | RMSEA | NFI | IFI | CFI | RFI | TLI | GFI | |
|---|---|---|---|---|---|---|---|---|---|
| China | 98.570 | 1.59 | 0.044 | 0.957 | 0.983 | 0.938 | 0.945 | 0.979 | 0.954 |
| Korea | 174.810 | 2.82 | 0.077 | 0.935 | 0.957 | 0.957 | 0.919 | 0.946 | 0.919 |
| Country | Measurements | Estimate | AVE | CR | Cronbach’s α | |
|---|---|---|---|---|---|---|
| China | BI1 | 0.78 | 0.595 | 0.854 | 0.855 | 0.886 |
| BI2 | 0.808 | |||||
| BI3 | 0.737 | |||||
| BI4 | 0.758 | |||||
| PU1 | 0.837 | 0.635 | 0.897 | 0.897 | ||
| PU2 | 0.776 | |||||
| PU3 | 0.793 | |||||
| PU4 | 0.776 | |||||
| PU5 | 0.802 | |||||
| PEOU1 | 0.8 | 0.658 | 0.885 | 0.885 | ||
| PEOU2 | 0.83 | |||||
| PEOU3 | 0.78 | |||||
| PEOU4 | 0.833 | |||||
| PDI1 | 0.773 | 0.586 | 0.876 | 0.876 | 0.862 | |
| PDI2 | 0.775 | |||||
| PDI3 | 0.773 | |||||
| PDI4 | 0.75 | |||||
| PDI5 | 0.755 | |||||
| UAI1 | 0.759 | 0.547 | 0.858 | 0.858 | ||
| UAI2 | 0.71 | |||||
| UAI3 | 0.75 | |||||
| UAI4 | 0.744 | |||||
| UAI5 | 0.734 | |||||
| IVC1 | 0.789 | 0.569 | 0.868 | 0.868 | ||
| IVC2 | 0.739 | |||||
| IVC3 | 0.747 | |||||
| IVC4 | 0.781 | |||||
| IVC5 | 0.714 | |||||
| MVC1 | 0.718 | 0.549 | 0.859 | 0.859 | ||
| MVC2 | 0.763 | |||||
| MVC3 | 0.777 | |||||
| MVC4 | 0.723 | |||||
| MVC5 | 0.723 | |||||
| Korea | BI1 | 0.784 | 0.679 | 0.894 | 0.893 | 0.933 |
| BI2 | 0.845 | |||||
| BI3 | 0.871 | |||||
| BI4 | 0.791 | |||||
| PU1 | 0.822 | 0.545 | 0.856 | 0.858 | ||
| PU2 | 0.618 | |||||
| PU3 | 0.775 | |||||
| PU4 | 0.715 | |||||
| PU5 | 0.744 | |||||
| PEOU1 | 0.841 | 0.689 | 0.898 | 0.896 | ||
| PEOU2 | 0.872 | |||||
| PEOU3 | 0.858 | |||||
| PEOU4 | 0.742 | |||||
| PDI1 | 0.726 | 0.576 | 0.868 | 0.862 | 0.874 | |
| PDI2 | 0.736 | |||||
| PDI3 | 0.873 | |||||
| PDI4 | 0.89 | |||||
| PDI5 | 0.506 | |||||
| UAI1 | 0.741 | 0.555 | 0.861 | 0.815 | ||
| UAI2 | 0.724 | |||||
| UAI3 | 0.814 | |||||
| UAI4 | 0.691 | |||||
| UAI5 | 0.748 | |||||
| IVC1 | 0.614 | 0.571 | 0.868 | 0.866 | ||
| IVC2 | 0.777 | |||||
| IVC3 | 0.796 | |||||
| IVC4 | 0.787 | |||||
| IVC5 | 0.787 | |||||
| MVC1 | 0.844 | 0.665 | 0.908 | 0.907 | ||
| MVC2 | 0.83 | |||||
| MVC3 | 0.847 | |||||
| MVC4 | 0.846 | |||||
| MVC5 | 0.699 | |||||
| BI | PU | PEOU | ||
|---|---|---|---|---|
| China | BI | 0.584 | ||
| PU | 0.119 *** | 0.246 | ||
| PEOU | 0.127 *** | 0.107 *** | 0.503 | |
| AVE square root | 0.764 | 0.496 | 0.709 | |
| Korea | BI | PU | PEOU | |
| BI | 0.679 | |||
| PU | 0.764 *** | 0.545 | ||
| PEOU | 0.563 *** | 0.653 *** | 0.689 | |
| AVE square root | 0.824 | 0.738 | 0.830 |
| Country | Statistics | Question 1 | Question 2 | Question 3 | Question 4 | Question 5 | Mean Value | |
|---|---|---|---|---|---|---|---|---|
| Power distance | China | Mean value | 3.25 | 3.06 | 3.15 | 2.96 | 2.85 | 3.054 |
| Standard deviation | 1.449 | 1.478 | 1.51 | 1.496 | 1.483 | |||
| Korea | Mean value | 3.22 | 3.27 | 2.68 | 2.67 | 3.82 | 3.132 | |
| Standard deviation | 1.913 | 1.771 | 1.887 | 1.794 | 1.896 | |||
| Uncertainty avoidance | China | Mean value | 4.64 | 4.82 | 4.74 | 4.92 | 5.01 | 4.826 |
| Standard deviation | 1.685 | 1.668 | 1.647 | 1.653 | 1.654 | |||
| Korea | Mean value | 5.18 | 5.34 | 5.35 | 5.28 | 5.55 | 5.34 | |
| Standard deviation | 1.436 | 1.187 | 1.297 | 1.276 | 1.264 | |||
| Individualism versus collectivism | China | Mean value | 5.13 | 5.33 | 5.23 | 5.43 | 5.53 | 5.334 |
| Standard deviation | 1.458 | 1.455 | 1.482 | 1.454 | 1.408 | |||
| Korea | Mean value | 4.1 | 4.2 | 4.11 | 3.89 | 3.41 | 3.942 | |
| Standard deviation | 1.54 | 1.54 | 1.608 | 1.572 | 1.68 | |||
| Masculinity versus femininity | China | Mean value | 4.87 | 5.07 | 4.97 | 5.17 | 5.27 | 5.07 |
| Standard deviation | 1.484 | 1.514 | 1.455 | 1.483 | 1.43 | |||
| Korea | Mean value | 3.01 | 3.13 | 3.16 | 3.28 | 3.57 | 3.23 | |
| Standard deviation | 1.827 | 1.886 | 1.851 | 1.806 | 1.892 |
| Path | Estimate | S.E. | C.R. | p | Significant Difference |
|---|---|---|---|---|---|
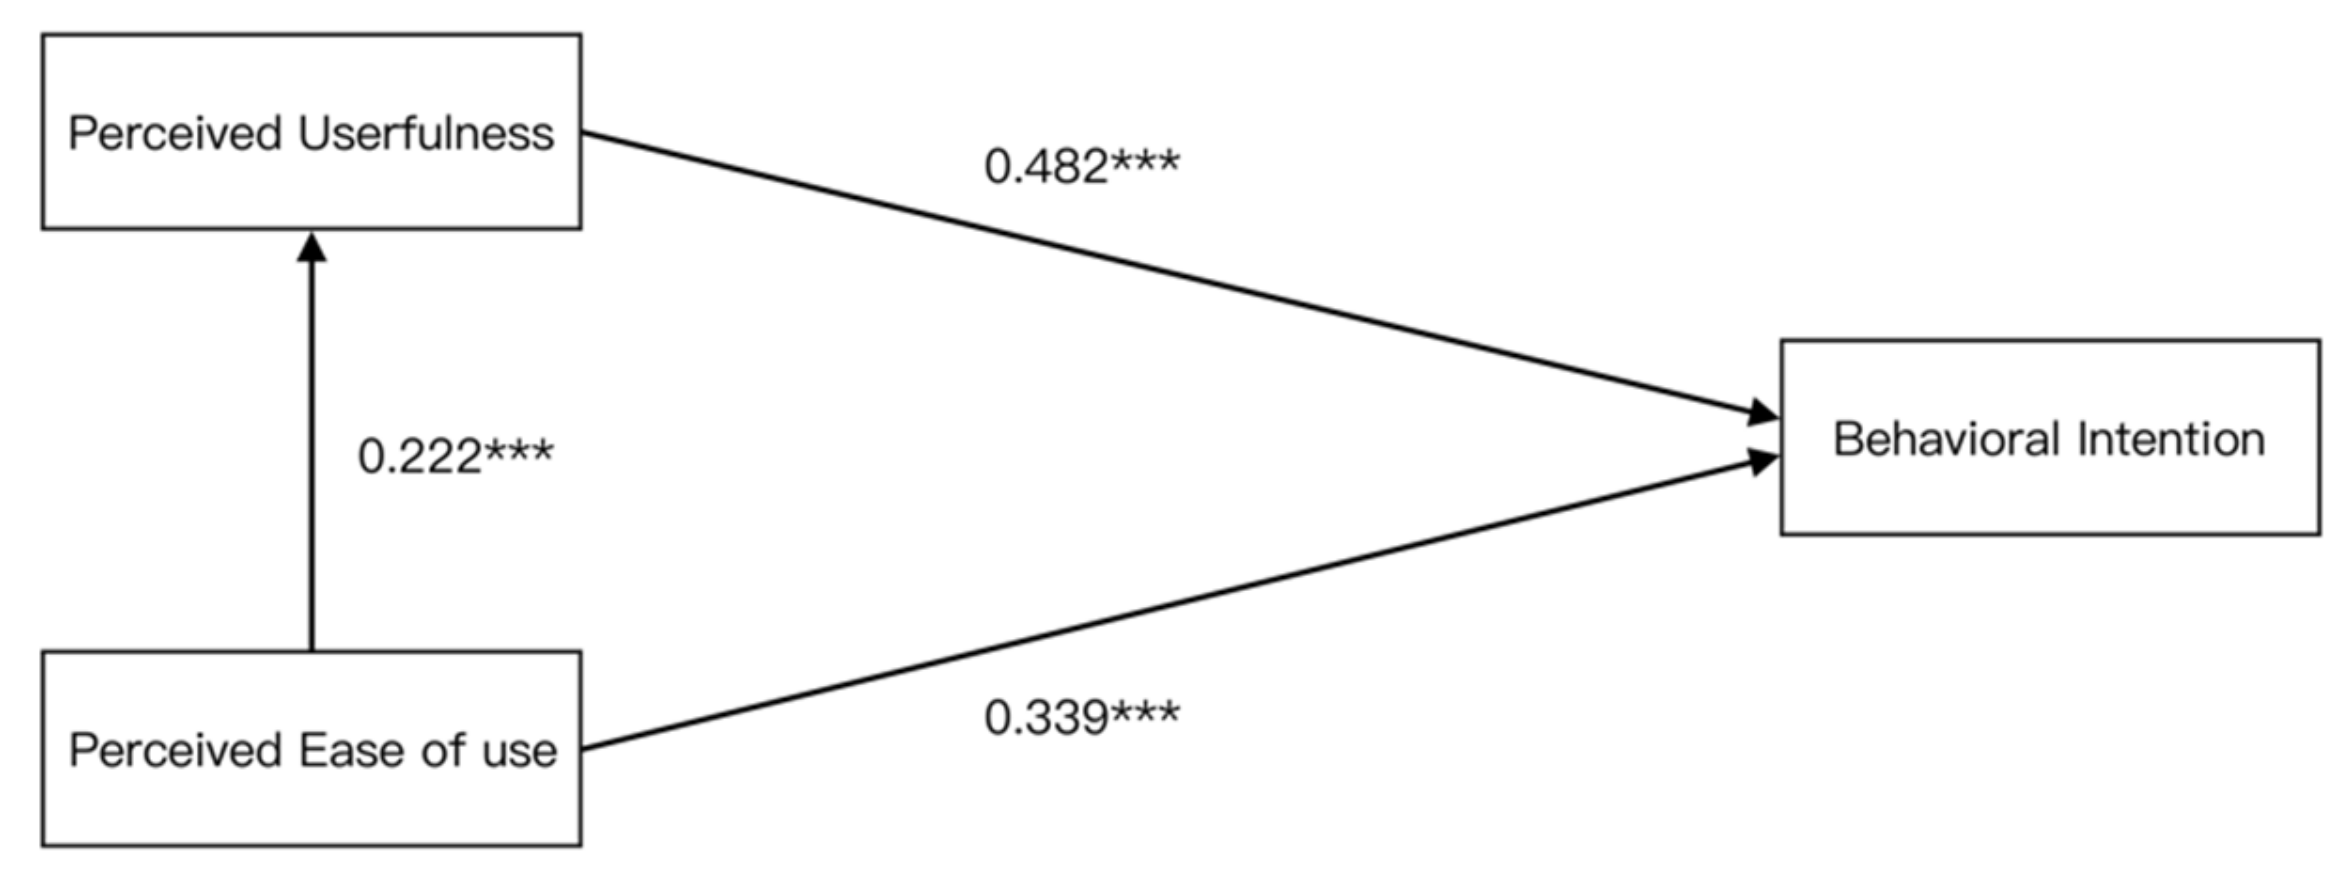
| PU ← PEOU | 0.222 | 0.058 | 3.842 | *** | Significant |
| BI ← PU | 0.482 | 0.06 | 7.974 | *** | Significant |
| BI ← PEOU | 0.339 | 0.053 | 6.421 | *** | Significant |
| Hypothesis of the Mobile Payment Acceptance Model of Chinese Consumers | Verification Result |
|---|---|
| H1: Perceived usefulness positively affects behavioral intention for mobile payments. | True |
| H2: Perceived ease of use positively affects behavioral intention for mobile payments. | True |
| H3: For mobile payment services, perceived ease of use positively affects perceived usefulness. | True |
| Path | Estimate | S.E. | C.R. | p | Significance |
|---|---|---|---|---|---|
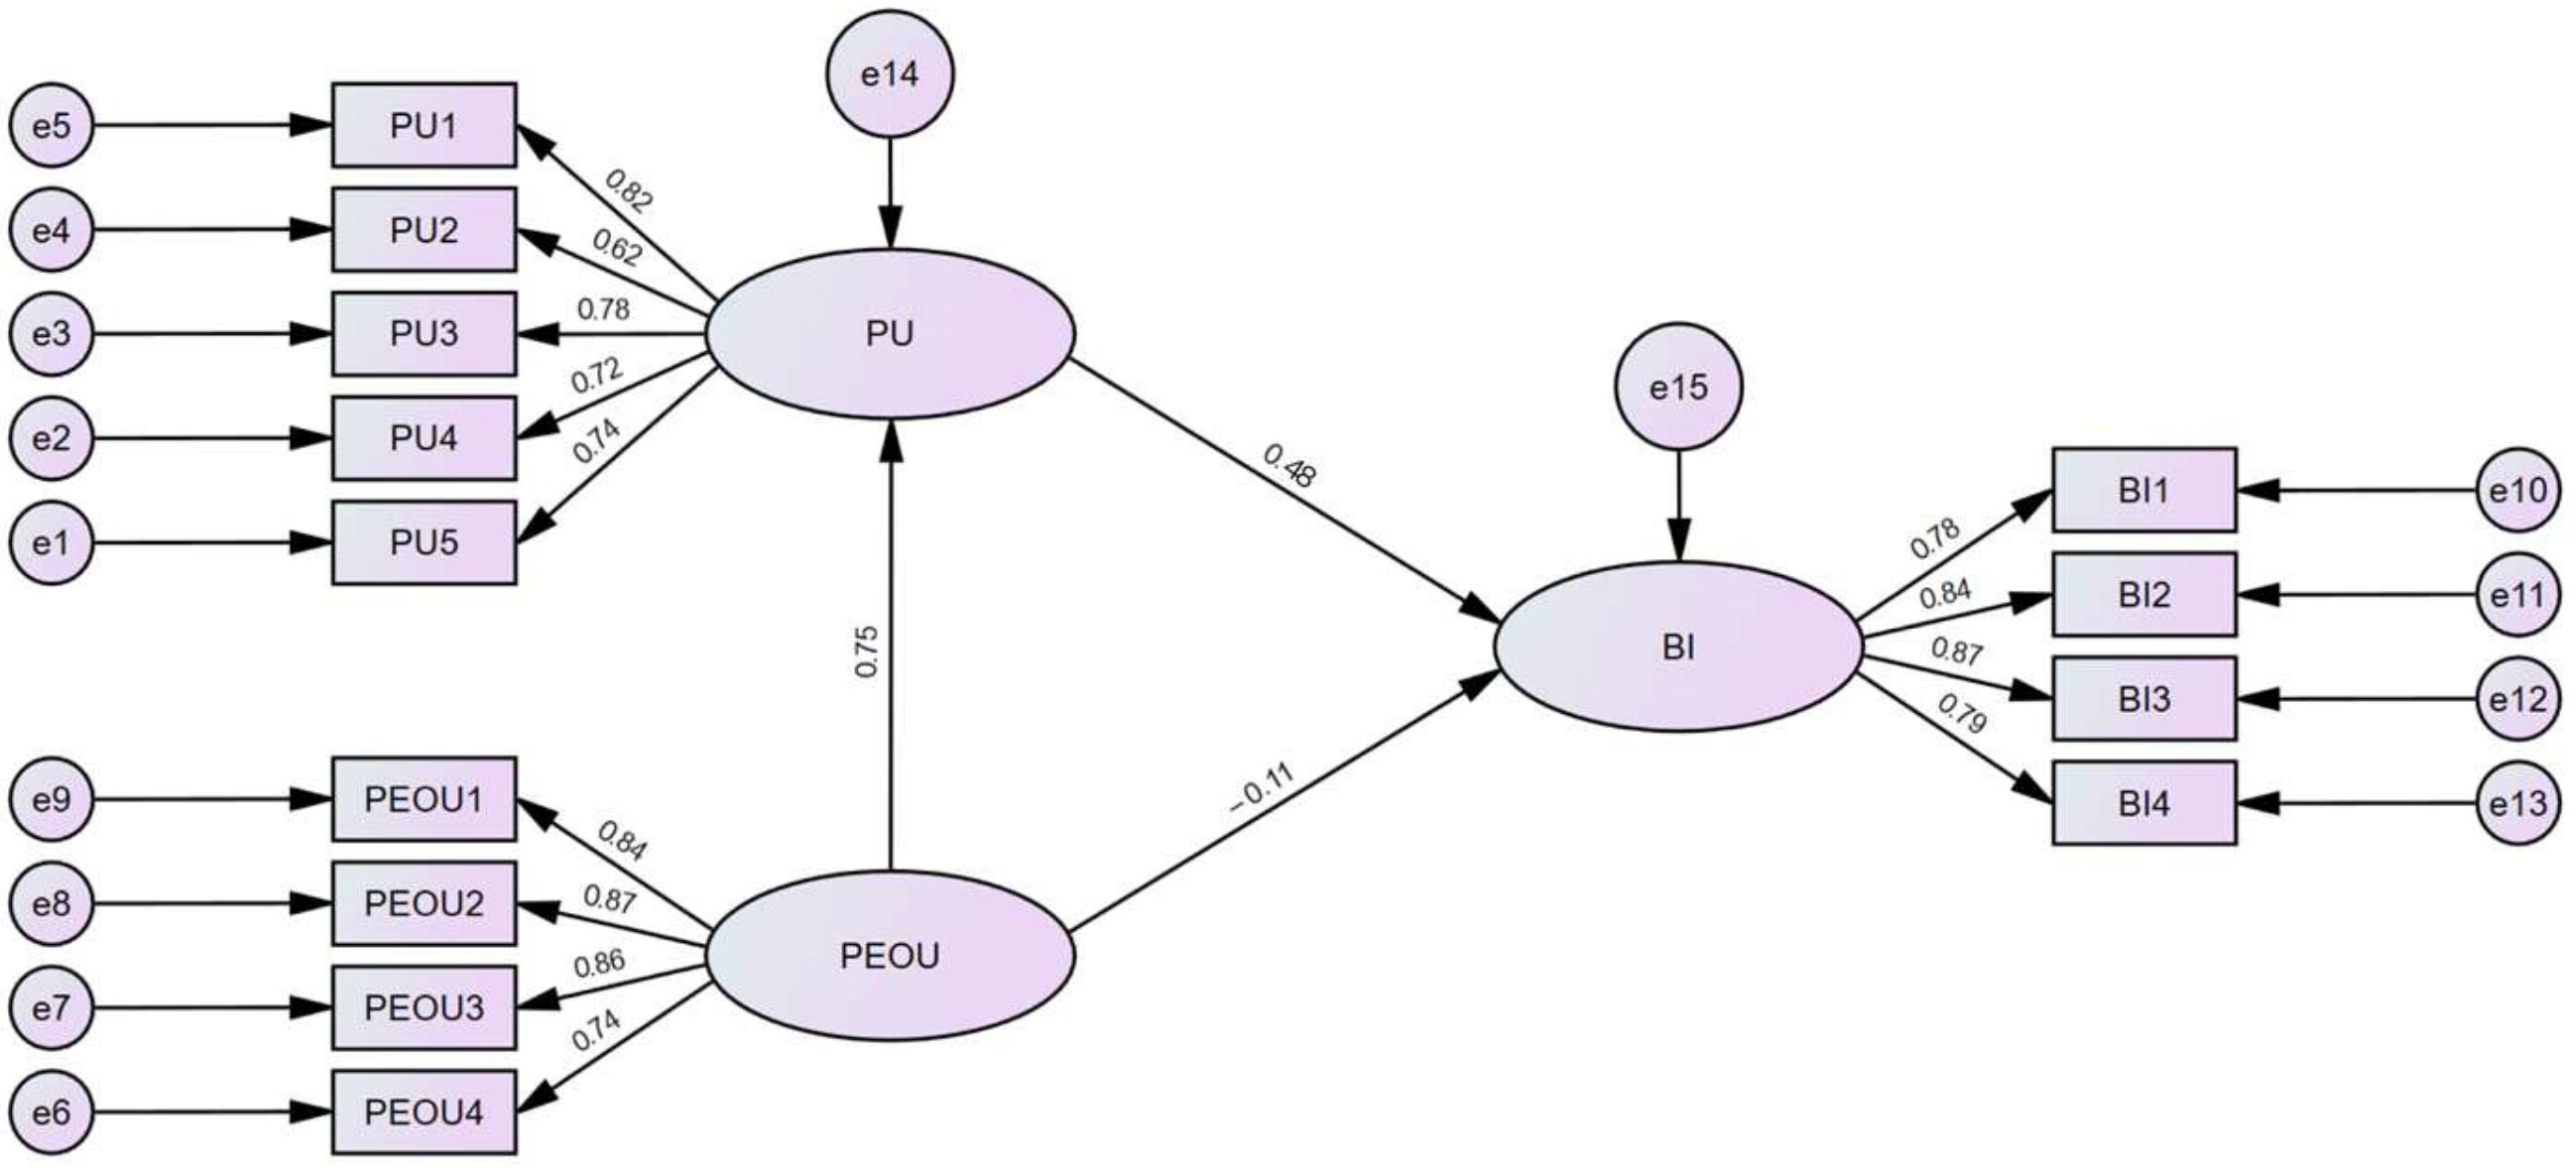
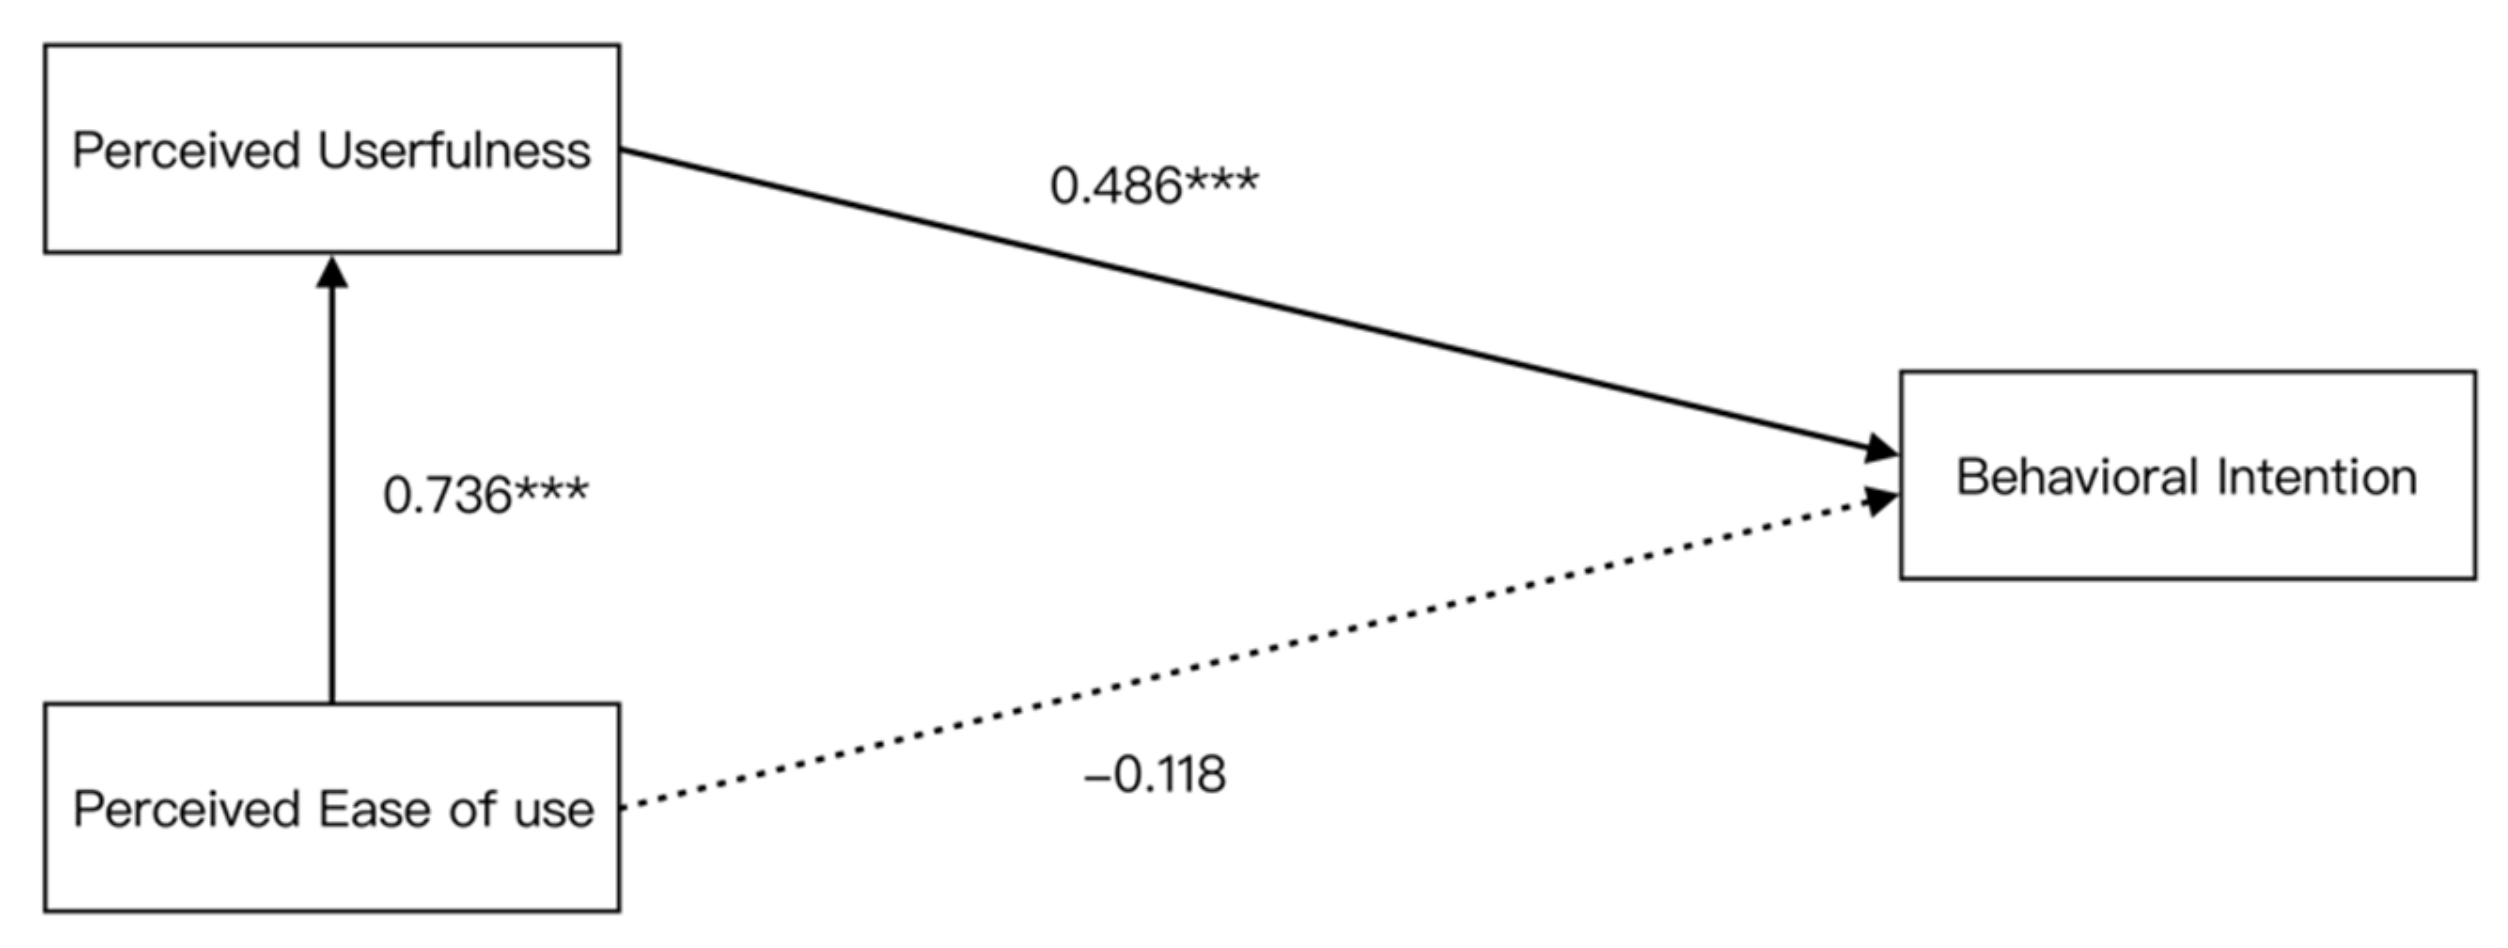
| PU ← PEOU | 0.736 | 0.071 | 10.352 | *** | Significant |
| BI ← PU | 0.486 | 0.031 | 9.814 | *** | Significant |
| BI ← PEOU | −0.118 | 0.08 | −1.468 | 0.142 > 0.05 | Non-significant |
| Hypothesis of Korean Consumers’ Mobile Payment Acceptance Model | Verification Result |
|---|---|
| H1: Perceived usefulness positively affects behavior intention for mobile payments. | True |
| H2: Perceived ease of use positively affects behavior intention for mobile payments. | False |
| H3: For mobile payment services, perceived ease of use positively affects perceived usefulness. | True |
| Relationship between Variables | Chinese Model Estimate (Standardized) | Korean Model Estimate (Standardized) |
|---|---|---|
| PU ← PEOU Perceived ease of use affects perceived usefulness | 0.222 *** | 0.736 *** |
| BI ← PU Perceived usefulness affects behavioral intention | 0.482 *** | 0.486 *** |
| BI ← PEOU Perceived ease of use affects behavioral intention | 0.339 *** | −0.118 (non-significant) |
| Model | Non-Normalized Coefficient | Standard Coefficient | t | Sig. | ||
|---|---|---|---|---|---|---|
| B | Standard Error | Trial Version | ||||
| H4 | z Perceived usefulness x Power distance | −0.001 | 0.035 | −0.002 | −0.037 | 0.971 |
| H5 | z Perceived ease of use x Power distance | 0.035 | 0.035 | 0.058 | 1.005 | 0.316 |
| H6 | z Perceived usefulness x Uncertainty avoidance | −0.026 | 0.037 | −0.041 | −0.041 | −0.709 |
| H7 | z Perceived ease of use x Uncertainty avoidance | −0.077 | 0.035 | −0.129 | −2.199 | 0.029 |
| H8 | z Perceived usefulness x Individualism versus collectivism | −0.036 | 0.034 | −0.056 | −1.06 | 0.29 |
| H9 | z Perceived ease of use x Individualism versus collectivism | −0.038 | 0.033 | −0.068 | −1.158 | 0.248 |
| H10 | z Perceived usefulness x Masculinity versus femininity | −0.047 | 0.035 | −0.066 | −1.376 | 0.17 |
| H11 | z Perceived ease of use x Masculinity versus femininity | −0.027 | 0.031 | −0.046 | −0.85 | 0.396 |
| Hypothesis No. | Related Hypotheses of Regulatory Action | Verification Result |
|---|---|---|
| H4 | Power distance has a positive moderating effect on the relationship between perceived usefulness and behavioral intention for mobile payments. | False |
| H5 | Power distance has a positive moderating effect on the relationship between perceived ease of use and behavioral intention for mobile payments. | False |
| H6 | Uncertainty avoidance has a negative moderating effect on the relationship between perceived usefulness and behavioral intention for mobile payments. | False |
| H7 | Uncertainty avoidance has a negative moderating effect on the relationship between perceived ease of use and behavioral intention for mobile payments. | True |
| H8 | Individualism versus collectivism has a positive moderating effect on the relationship between perceived usefulness and behavioral intention for mobile payments. | False |
| H9 | Individualism versus collectivism has a positive moderating effect on the relationship between perceived ease of use and behavioral intention for mobile payments. | False |
| H10 | Masculine versus feminine temperament has a positive moderating effect on the relationship between perceived usefulness and behavioral intention for mobile payments. | False |
| H11 | Masculine versus feminine temperament has a positive moderating effect on the relationship between perceived ease of use and behavioral intention for mobile payments. | False |
| Path | Estimate | Standard Estimate | S.E. | C.R. | p | Label | Critical Ratio |
|---|---|---|---|---|---|---|---|
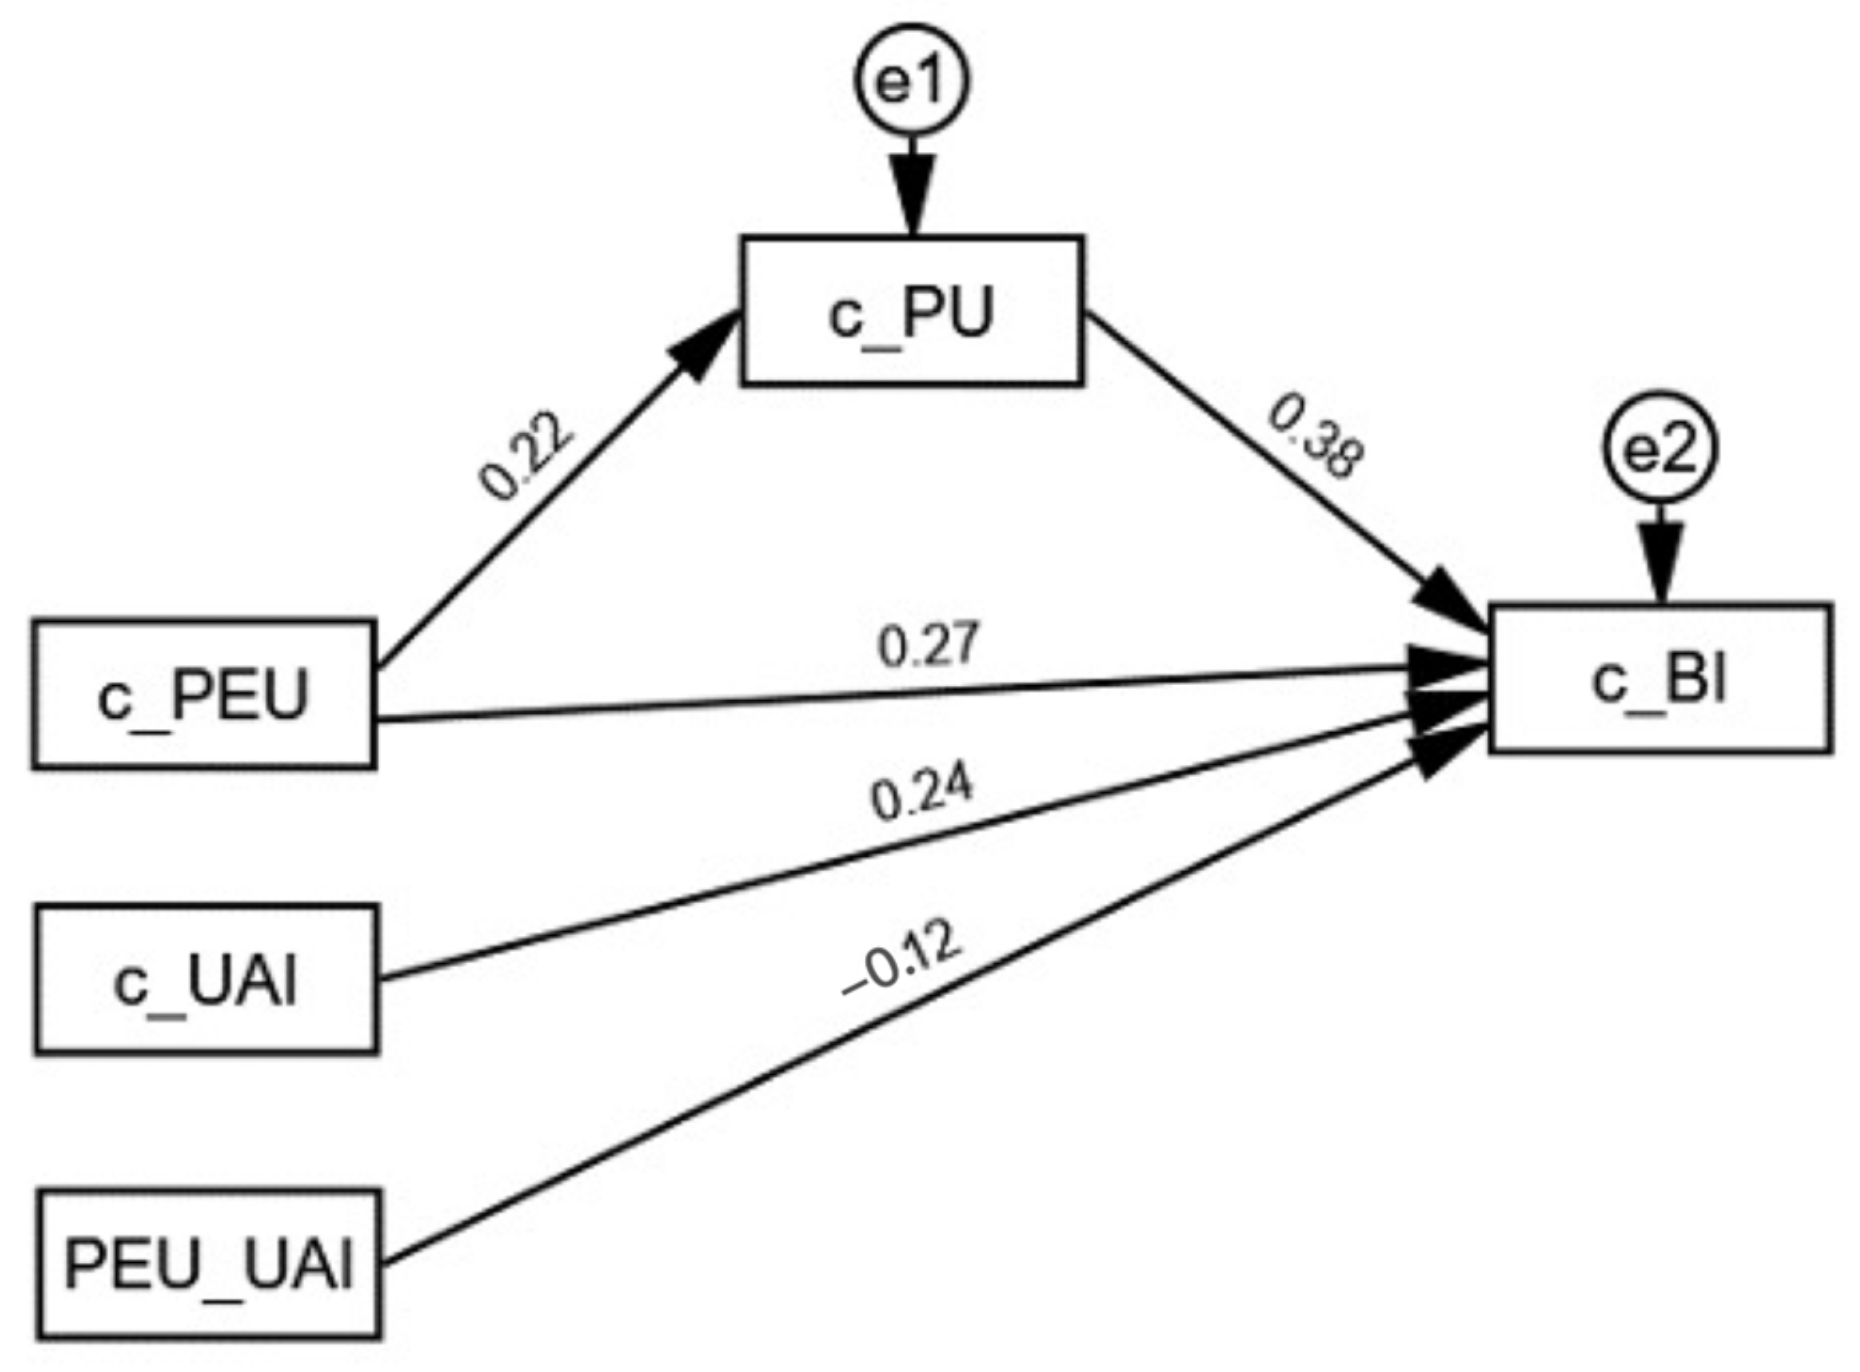
| c_PU ← c_PEU | 0.193 | 0.224 | 0.048 | 4.021 | *** | b1_1 | 6.435 |
| c_BI ← c_PU | 0.379 | 0.381 | 0.048 | 7.960 | *** | b2_1 | 5.416 |
| c_BI ← c_PEU | 0.230 | 0.269 | 0.041 | 5.610 | *** | b3_1 | −2.242 |
| c_BI ← c_UAI | 0.247 | 0.239 | 0.048 | 5.118 | *** | b4_1 | −1.796 |
| c_BI ← PU_UAI | −0.066 | −0.119 | 0.026 | −2.555 | 0.011 | b5_1 | −0.544 |
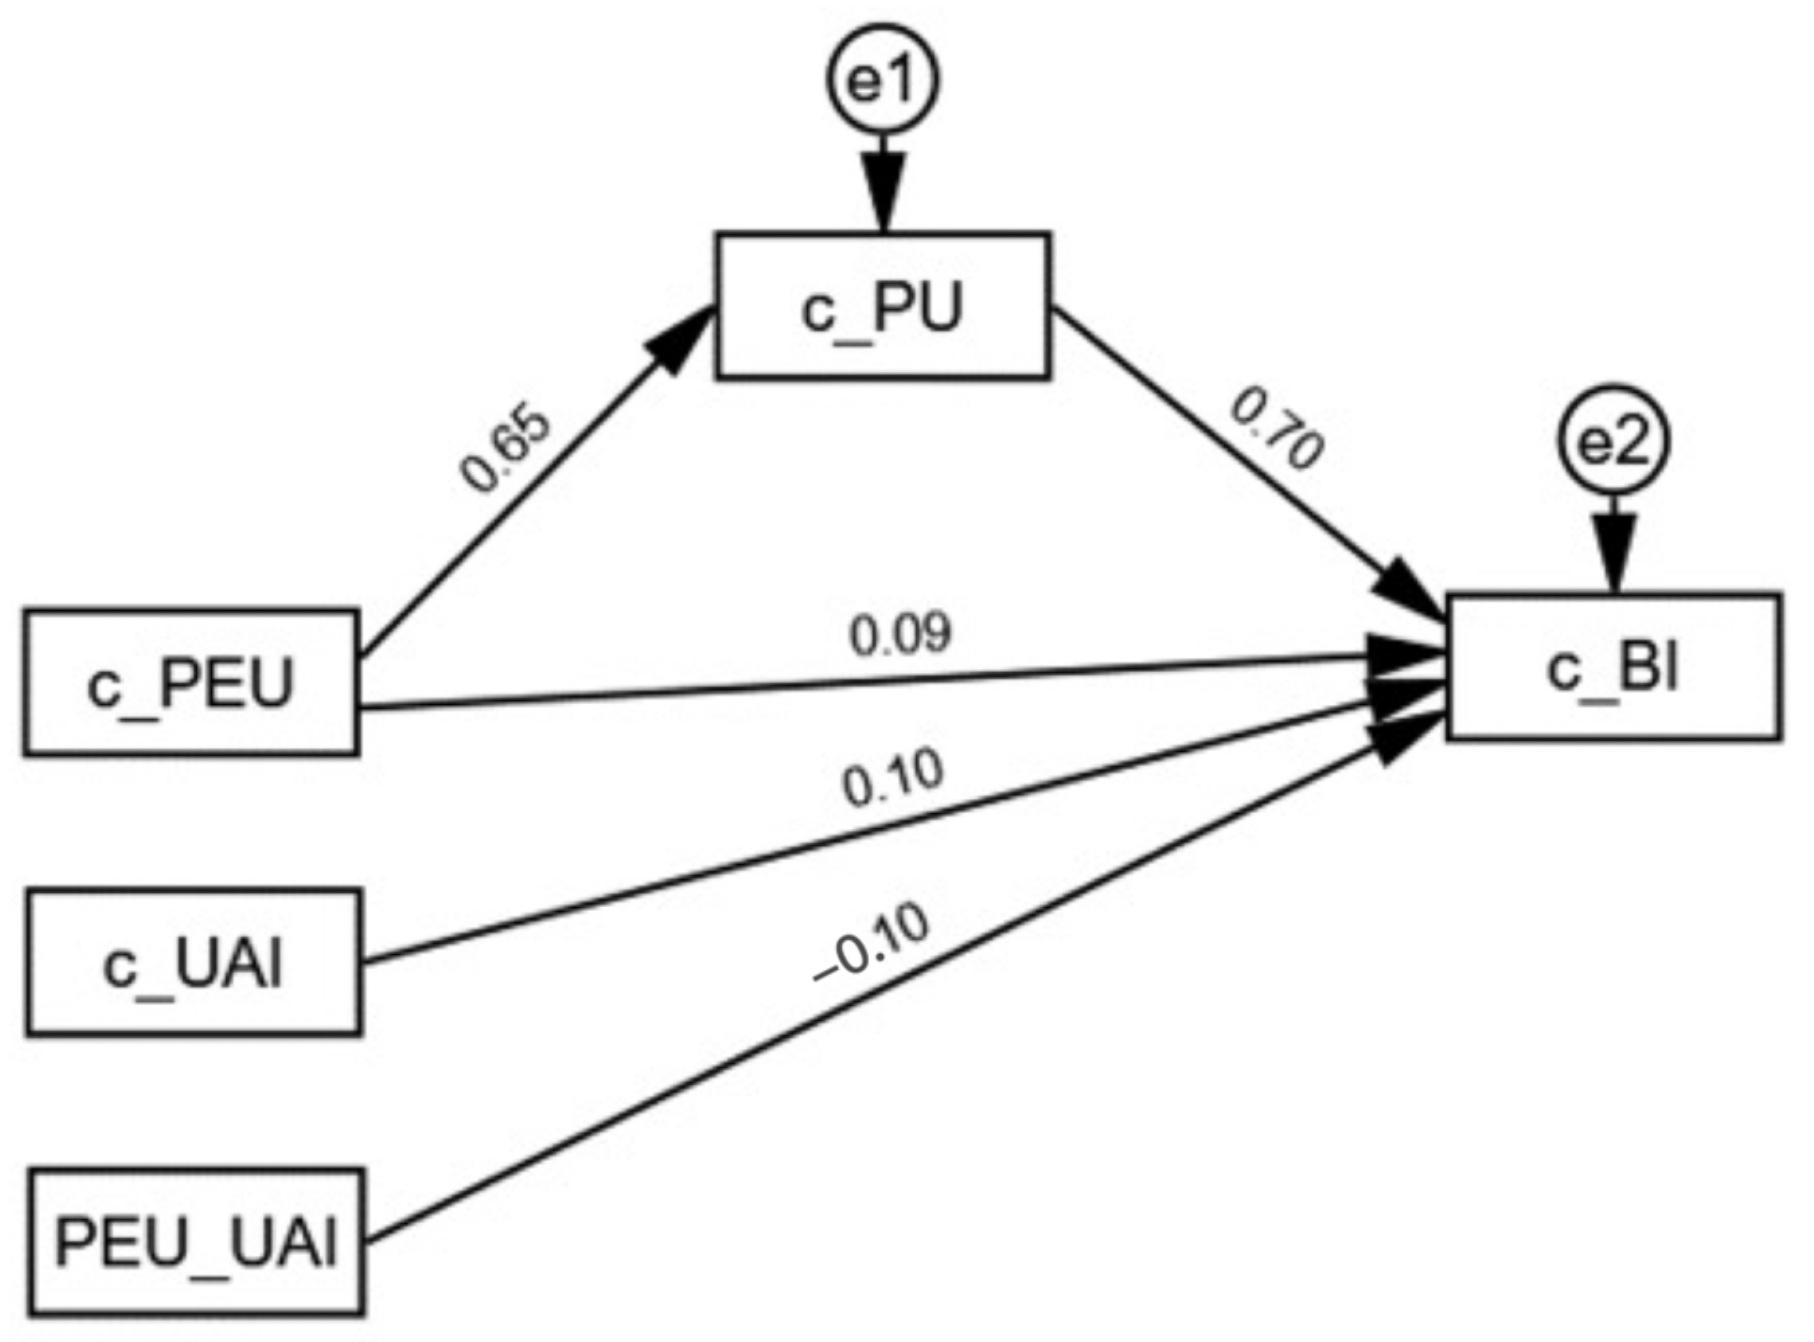
| c_PU ← c_PEU | 0.593 | 0.653 | 0.039 | 15.043 | *** | b1_2 | |
| c_BI ← c_PU | 0.767 | 0.696 | 0.053 | 14.367 | *** | b2_2 | |
| c_BI ← c_PEU | 0.088 | 0.088 | 0.048 | 1.812 | 0.070 | b3_2 | |
| c_BI ← c_UAI | 0.128 | 0.104 | 0.045 | 2.842 | 0.004 | b4_2 | |
| c_BI ← PU_UAI | −0.089 | −0.098 | 0.033 | −2.663 | 0.008 | b5_2 |
Disclaimer/Publisher’s Note: The statements, opinions and data contained in all publications are solely those of the individual author(s) and contributor(s) and not of MDPI and/or the editor(s). MDPI and/or the editor(s) disclaim responsibility for any injury to people or property resulting from any ideas, methods, instructions or products referred to in the content. |
© 2023 by the authors. Licensee MDPI, Basel, Switzerland. This article is an open access article distributed under the terms and conditions of the Creative Commons Attribution (CC BY) license (https://creativecommons.org/licenses/by/4.0/).
Share and Cite
Zhao, Y.; Pan, Y.-H. A Study of the Impact of Cultural Characteristics on Consumers’ Behavioral Intention for Mobile Payments: A Comparison between China and Korea. Sustainability 2023, 15, 6956. https://doi.org/10.3390/su15086956
Zhao Y, Pan Y-H. A Study of the Impact of Cultural Characteristics on Consumers’ Behavioral Intention for Mobile Payments: A Comparison between China and Korea. Sustainability. 2023; 15(8):6956. https://doi.org/10.3390/su15086956
Chicago/Turabian StyleZhao, Yuqi, and Young-Hwan Pan. 2023. "A Study of the Impact of Cultural Characteristics on Consumers’ Behavioral Intention for Mobile Payments: A Comparison between China and Korea" Sustainability 15, no. 8: 6956. https://doi.org/10.3390/su15086956