1. Introduction
With the introduction of an increasing number of satellites and the advent of the internet, remote sensing data has become a tool used more often in a variety of fields of research. Availability of data for download on the internet allows for research and analysis by more scientists than ever before across the world. Among the many uses of remote sensing data, economic, and more specifically GDP (Gross Domestic Product), likely the most popular and commonly used economic indicator at the national level or larger, prediction and verification have become a mainstay use of NTL (nighttime light) data [
1,
2,
3,
4,
5,
6,
7,
8,
9,
10,
11,
12].
GDP is a cumulative measure of the total amount of economic activity within any specified country in the span of a year. Though not without its limitations, GDP still remains one of the most important and commonplace indicators of the national economy. Governments, for example, tend to use GDP as one tool in informing policy decisions [
6,
13]. Therefore, knowing the strengths and limitations of GDP in addition to verifying its implications through alternate channels, such as NTL, can be vital.
NTL data has been applied in a number of studies comparing it to GDP numbers among other indicators, meaning it holds potential as an additional indicator in assessing sustainable development policy. Knowing the efficacy of economic policy promoting sustainability can help policymakers to make more informed decisions and refine sustainable development measures. Aside from its usage as a verification method of traditional GDP data [
2,
6], NTL offers reliable insight into areas wherein data collection may run into issues on the ground level. One of the most notable and obvious areas of NTL application is in reflecting urbanization, an area well-documented in previous literature [
8,
9,
11,
14,
15,
16]. Research has shown that VIIRS NTL data has proven a more accurate tool in predicting GDP in comparison to its predecessor satellite in monitoring NTL data, DMSP [
1,
14]. Past research has found a correlation between NTL and poverty distribution [
5] which attested to the reliability of NTL over traditional GDP metrics in identifying poverty areas in China. Similarly, one study utilized power shortage phenomena in Colombia to connect NTL decreases to fertility booms, which in turn led to correlation with worsened socioeconomic conditions for those families involved [
17]. Yet another study on the current Yemen conflict demonstrated a distinct and significant decrease in NTL levels in Yemen after the outbreak of fighting, particularly in the western region seeing severe conflict [
18]. This study in particular highlights the importance of studying substantial NTL loss due to the sudden, extreme nature of war causing the decrease.
In studying the connection between GDP and NTL, NTL has primarily been utilized as the dependent variable. NTL is then used as a factor in verifying and predicting actual GDP data. Additionally, there seems to be a gap in existing research regarding analyzing different possible economic trends. Existing research ostensibly appears to primarily focus on providing evidence between GDP growth and NTL growth in a positive direction, as recent history has primarily witnessed economies experience positive growth, whether rapid or slow. As a result, being able to predict or verify positive growth emerged as the natural research direction in this field. However, in this study the focus is to explore the possible connection between NTL data and a decrease in GDP.
Perhaps due to the fact that yearly GDP rarely declines in modern economies and thus leaves little in the way of subject material, the majority of the literature focuses on the correlation between positive GDP growth and positive NTL growth and NTL data’s ability to predict GDP [
2,
4,
6,
19,
20,
21,
22,
23]. A decrease in NTL, on the other hand, is rarely the subject of research outside of extreme cases such as the Yemen conflict, where war acts as an unnatural cause of infrastructure destruction and loss of life, therefore bringing about a rapid and severe reduction in nighttime activity and NTL [
5,
18]. That being said, economic sluggishness as a product of the natural downturn in the business cycle has yet to be compared with NTL data. As such, this study seeks to further support the connection between GDP and NTL data provided by the DMSP and VIIRS satellite series, the most commonly used NTL datasets, by verifying the existence of a correlation or absence therein due to GDP decrease, therein demonstrating its utility or limitations. By verifying that a correlation exists in both positive and negative directions, this study seeks to strengthen NTL data as an economic indicator and further highlight its application, which can be used in sustainable development research. The present study intends to begin to fill in this gap by utilizing remote sensing diagnosis to analyze the changes in the global NTL level in the years 2009 and 2015: the two years since the introduction of public NTL data products in which the global GDP underwent negative growth.
2. Data Collection
The National Oceanic and Atmospheric Administration (NOAA) provides free public access to NTL data online as far back as 1992. The source of the data NOAA offers is one of two datasets. The first is the Defense Meteorological Satellite Program (DMSP) that ran satellites from the program’s genesis in the 1970′s and began offering NTL data in 1992 until its satellites’ retirement in 2013. Beginning in 2012, NOAA updated to a new generation of satellites with high specs and observation capabilities. This marked the introduction of data from the Visible and Infrared Imaging Suite (VIIRS) that continues to provide accurate, improved NTL data from 2012 up to the present. Shapefiles were additionally obtained for the global level, as well as for China, the United States of America, and Europe, to extract only the relevant over-land NTL data in question.
Both DMSP and VIIRS datasets provide NTL images in GeoTIFF format. DMSP offers a spatial resolution of 30 arc-seconds, while VIIRS boasts a resolution of 15 arc-seconds. Radiometric resolution is 6-bit for DMSP and 14-bit for VIIRS. DMSP data is displayed in panchromatic bands of 400–1100 nm, while that of VIIRS is in panchromatic bands of 505–890 nm. Both the DMSP and VIIRS datasets are pre-processed NTL data products. The Version 4 DMSP-OLS Nighttime Light Series is a dataset processed to remove cloud coverage as well as extraneous light data, such as glare, sunlight, moonlight, and aurora data. Likewise, the Suomi NPP-VIIRS satellite’s Annual VNL V2 product is created from monthly cloud-free composites that remove sunlit, moonlit, and cloudy pixels as well as radiance outliers from fires and other extraneous light pixels. The yearly-averaged data for NTL provided in the two datasets can then be compared to the yearly GDP data for analysis.
Table 1 provides a summary of the specifications of each data series. Lastly, economic data was obtained from the World Bank GDP data available online.
3. Methodology
The theory behind the analysis of each NTL dataset is based on the fact that there exists only one band detecting light or its absence. The single band in this satellite data represents the detection or absence of light recognized by the sensor. This detection is depicted numerically as a number, which is referred to as the digital number (DN). Higher DN values for a pixel represent a brighter light, while a lower DN value represents a lower level of light, and a value of zero equates to no light detected. An increase in the average pixel value then points to an increase in the average NTL over time, and lower average pixel values would therefore mean a decrease in NTL. In order to observe the changes over time in NTL data on a global scale in order to compare these changes to GDP growth, the mean pixel value of each year of data was extracted to represent the data as a whole. The mean DN values were extracted in ArcGIS after extracting each study area via shapefile by using the software’s built-in raster data calculation capabilities. ArcGIS calculated the mean value for the single band available in each year of the dataset, and the mean DN values for each year split between the DMSP and VIIRS datasets were then utilized to represent average NTL in the ensuing analysis.
The two years of global GDP decline, 2009 and 2015, were separated into two cases and analyzed in conjunction with two different NTL data sets. DMSP data was utilized for the years 2007 to 2012 and dealt with the 2009 instance. For the GDP decline in 2015, VIIRS data from 2013 to 2017 was accessed for analysis. Timelines were selected to allow for the observation of change leading up to the year of decrease and at least an equal length of time after the decrease. Due to the constraints in available VIIRS data, a shorter time period of five years centering around the years in question was selected, with a similar time period selected for the DMSP dataset to match the VIIRS analysis in hopes of preserving a similar analysis setup. After documenting the changes in NTL data for each dataset, these results were compared with the global GDP data. In this way, it is possible to observe the existence or absence of a trend, thus confirming whether or not NTL will decrease in turn with natural GDP decline.
4. Results and Discussion
The sections below detail the results of analysis via ArcGIS in two parts split according to the source of data and time frame. Each section contains tables summarizing the data and NTL images. Following these sections is an additional subsection analyzing outlier data on a regional level.
4.1. DMSP Results
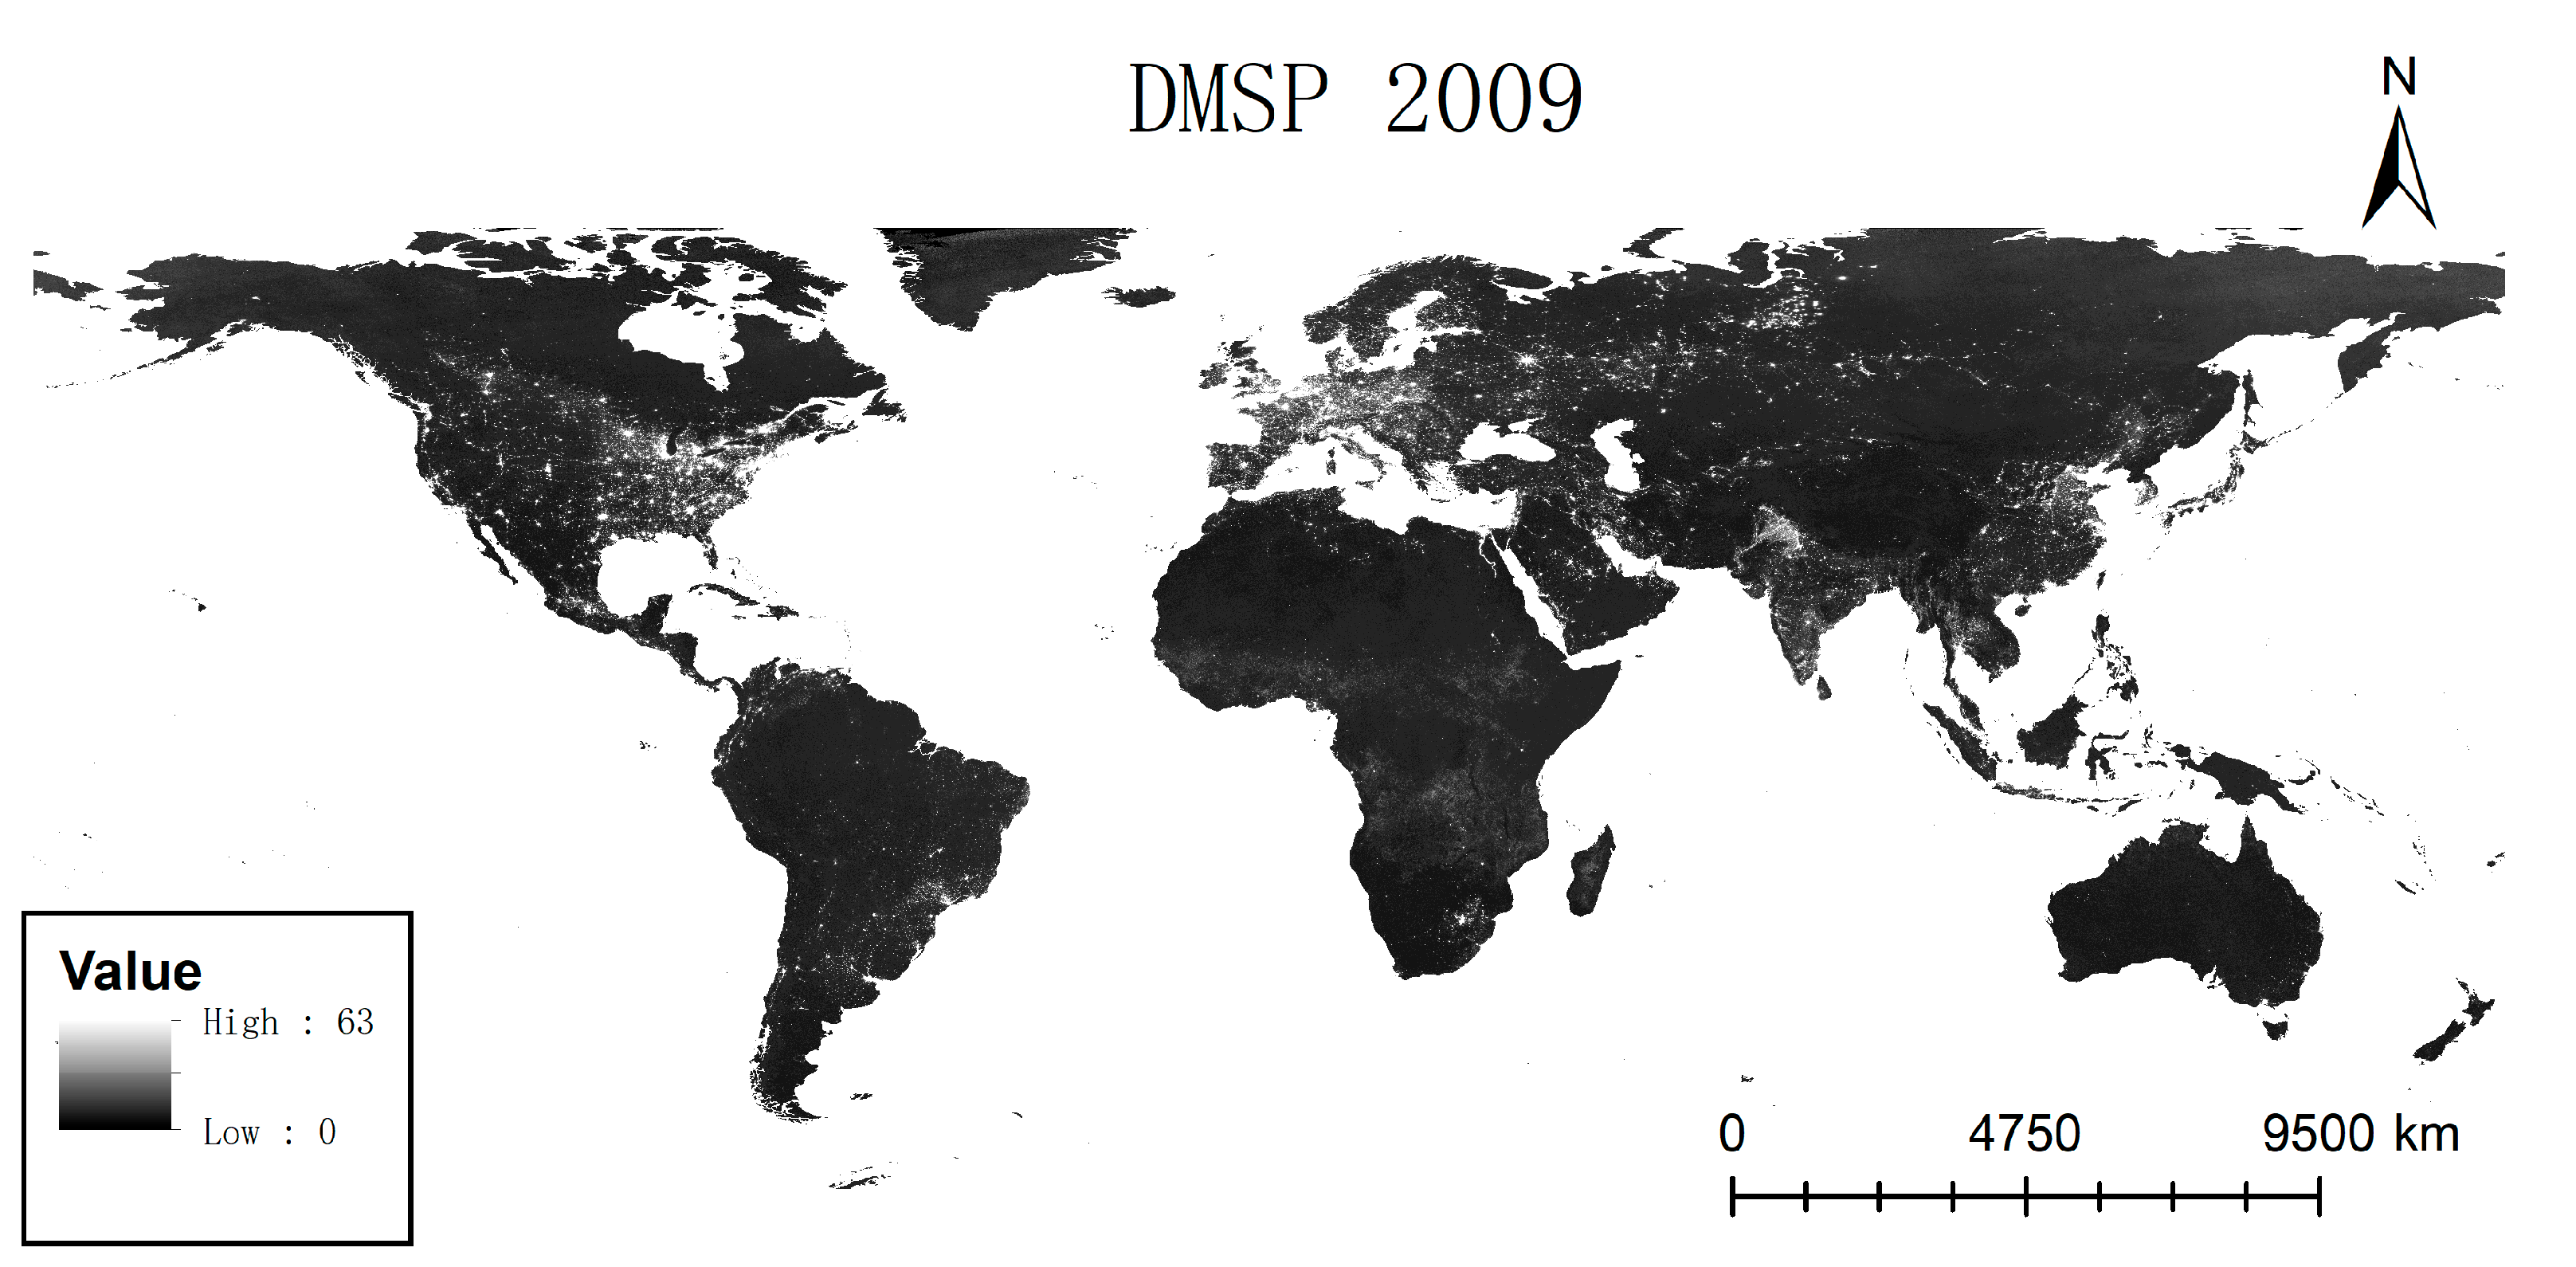
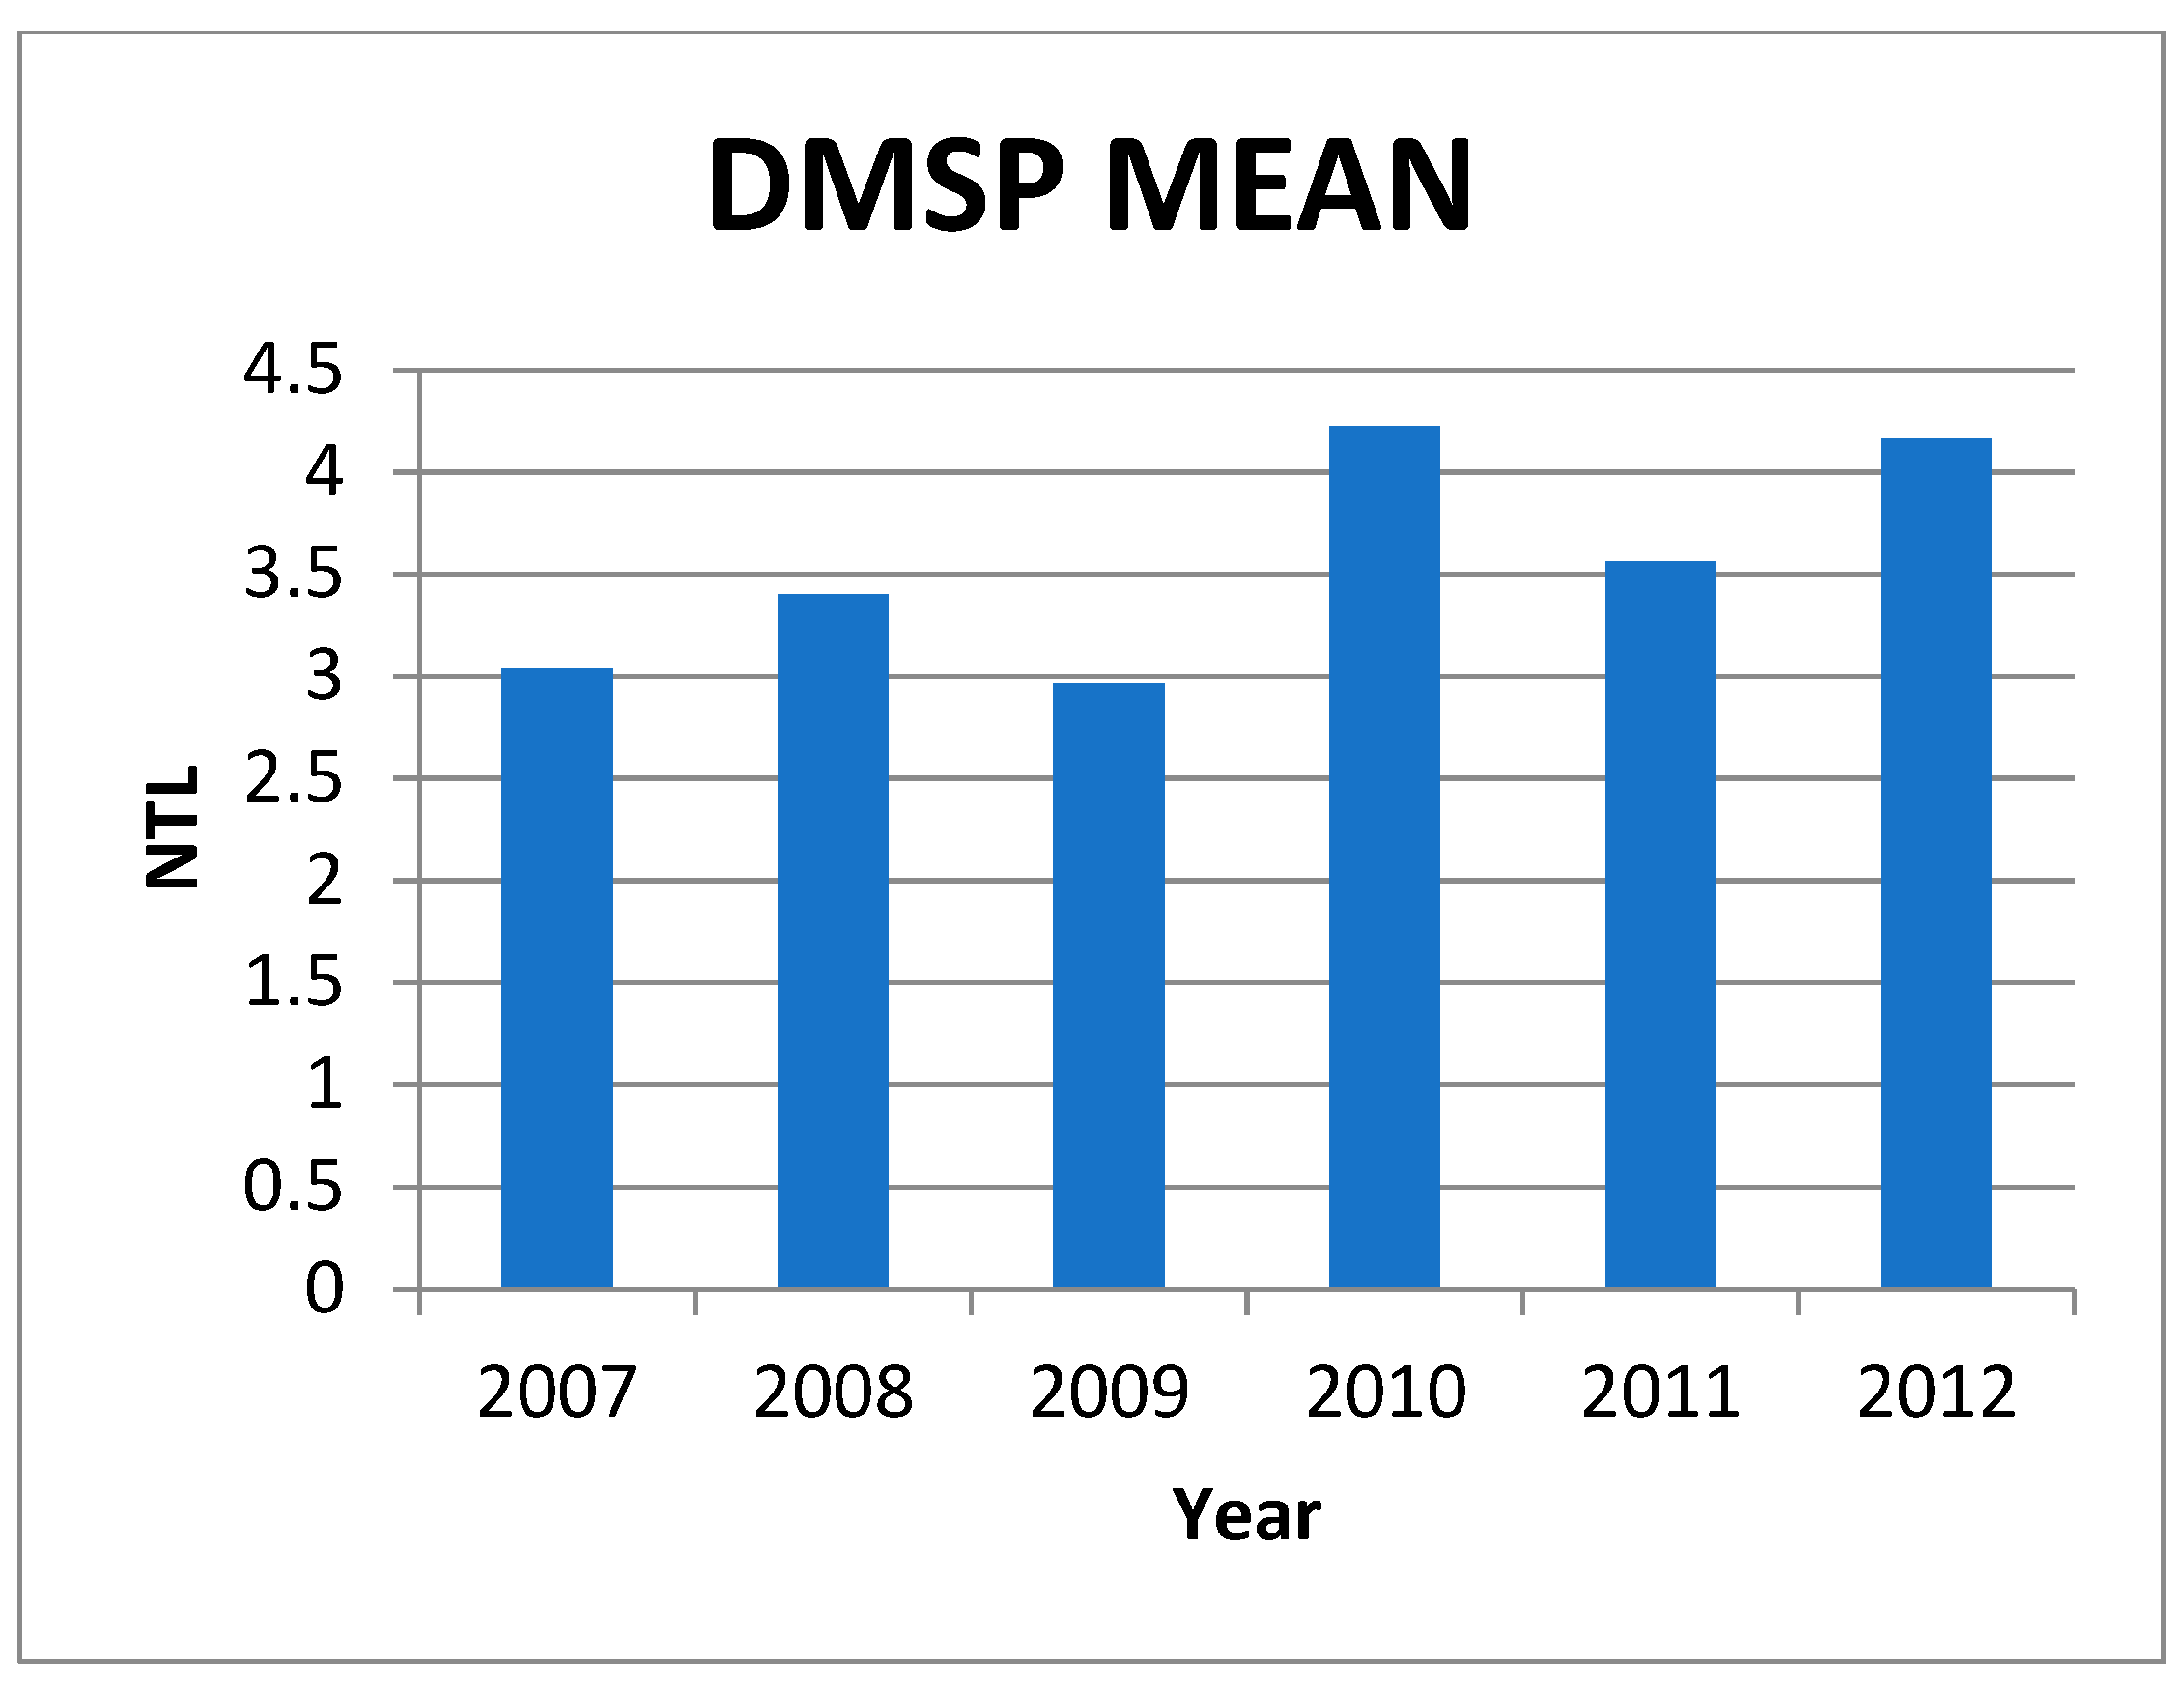
Final NTL images produced from the DMSP data are pre-made, filtered datasets cleaned by the NOAA. Cloudless yearly average data was utilized for the study. The range of pixel values for the band in the DMSP data is from 0, for no light detected, to 63, the brightest level of light detectable. Average pixel values ranged only between 2.9 and 4.3. The years 2007, 2008, 2010, and 2012 displayed an average pixel value increase in line with expectations from the GDP increases in the corresponding years. Likewise, NTL data from the year 2009 also met expectations, as the average pixel value dropped to 2.963 from 3.399 the previous year. This was a 12.8% decrease compared to the GDP value decrease in the same year of 5.1%. The year 2011 surprisingly showed an unexpected decrease in NTL in contrast with the increase in GDP that year, thus prompting the inclusion of an additional year after 2011 for clarification of a pattern or simple irregularity. However, this case will be further discussed in
Section 5.1. Overall, the DMSP dataset appeared to display more pronounced percentage changes, both positive and negative, compared to its GDP counterpart for the same span of time.
Figure 1 displays the global NTL using DMSP data from 2009, and
Figure 2 and
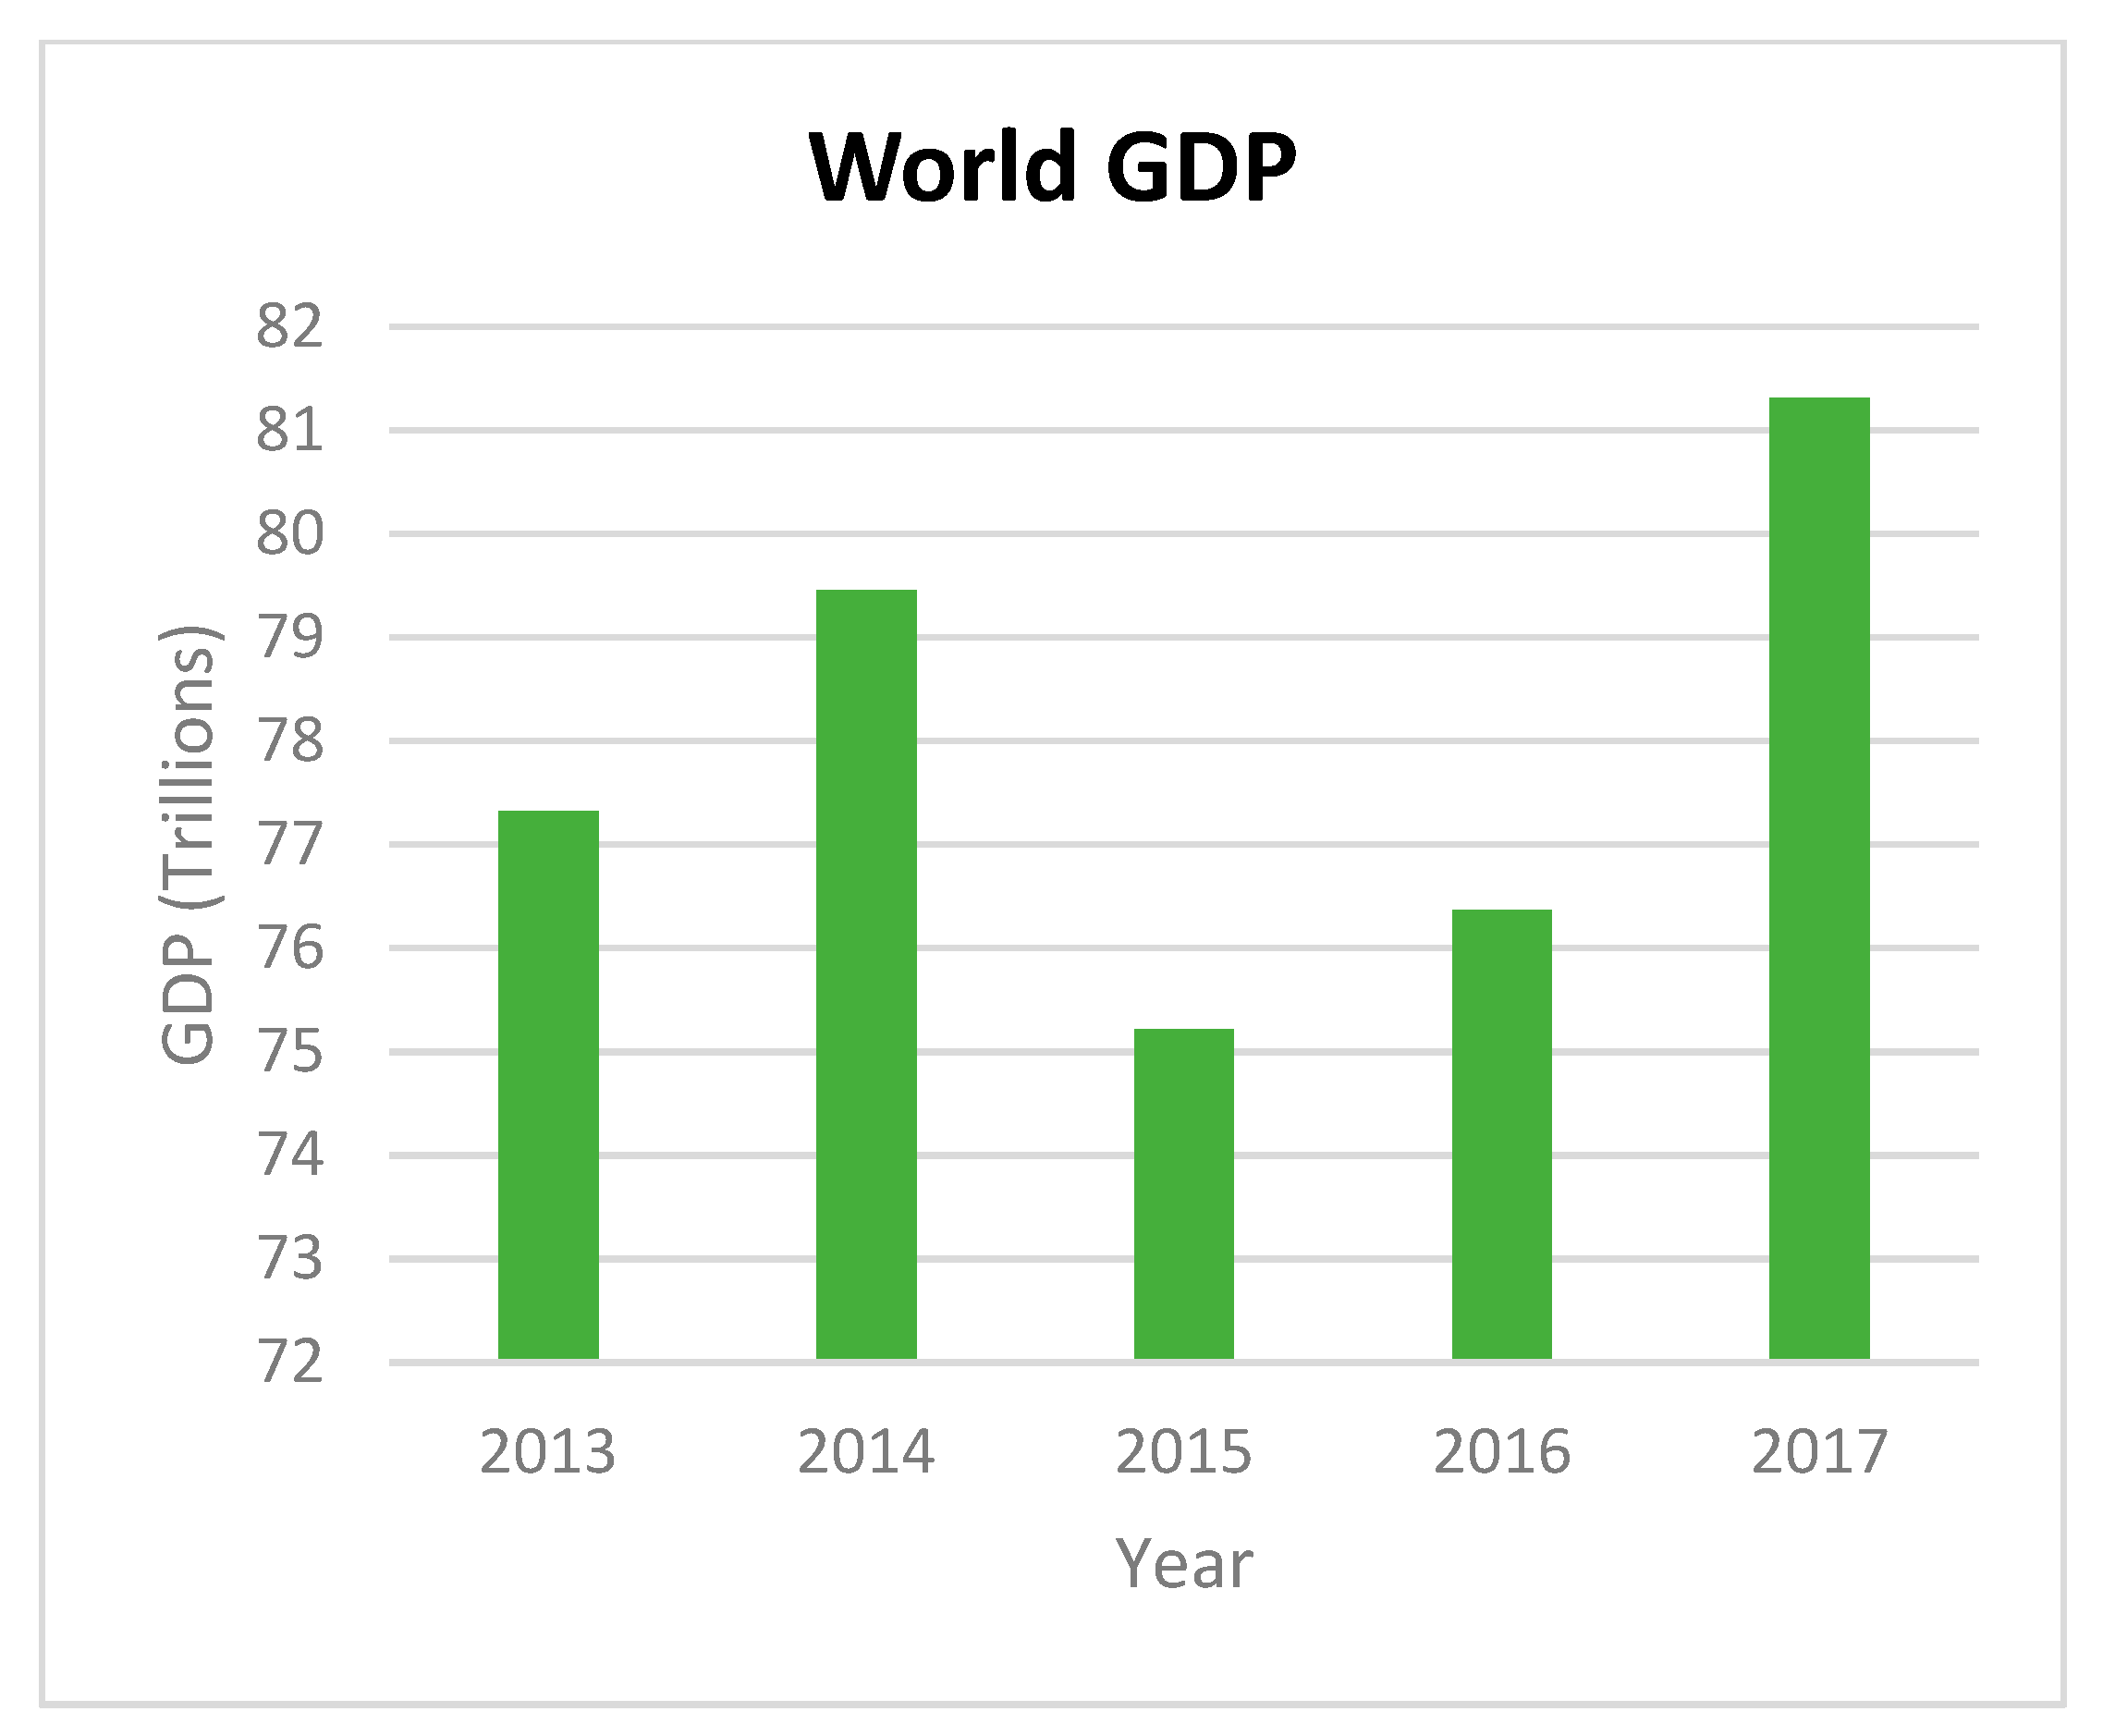
Figure 3 show the results of the DMSP average pixel values and GDP data, respectively, in further detail.
4.2. VIIRS Results
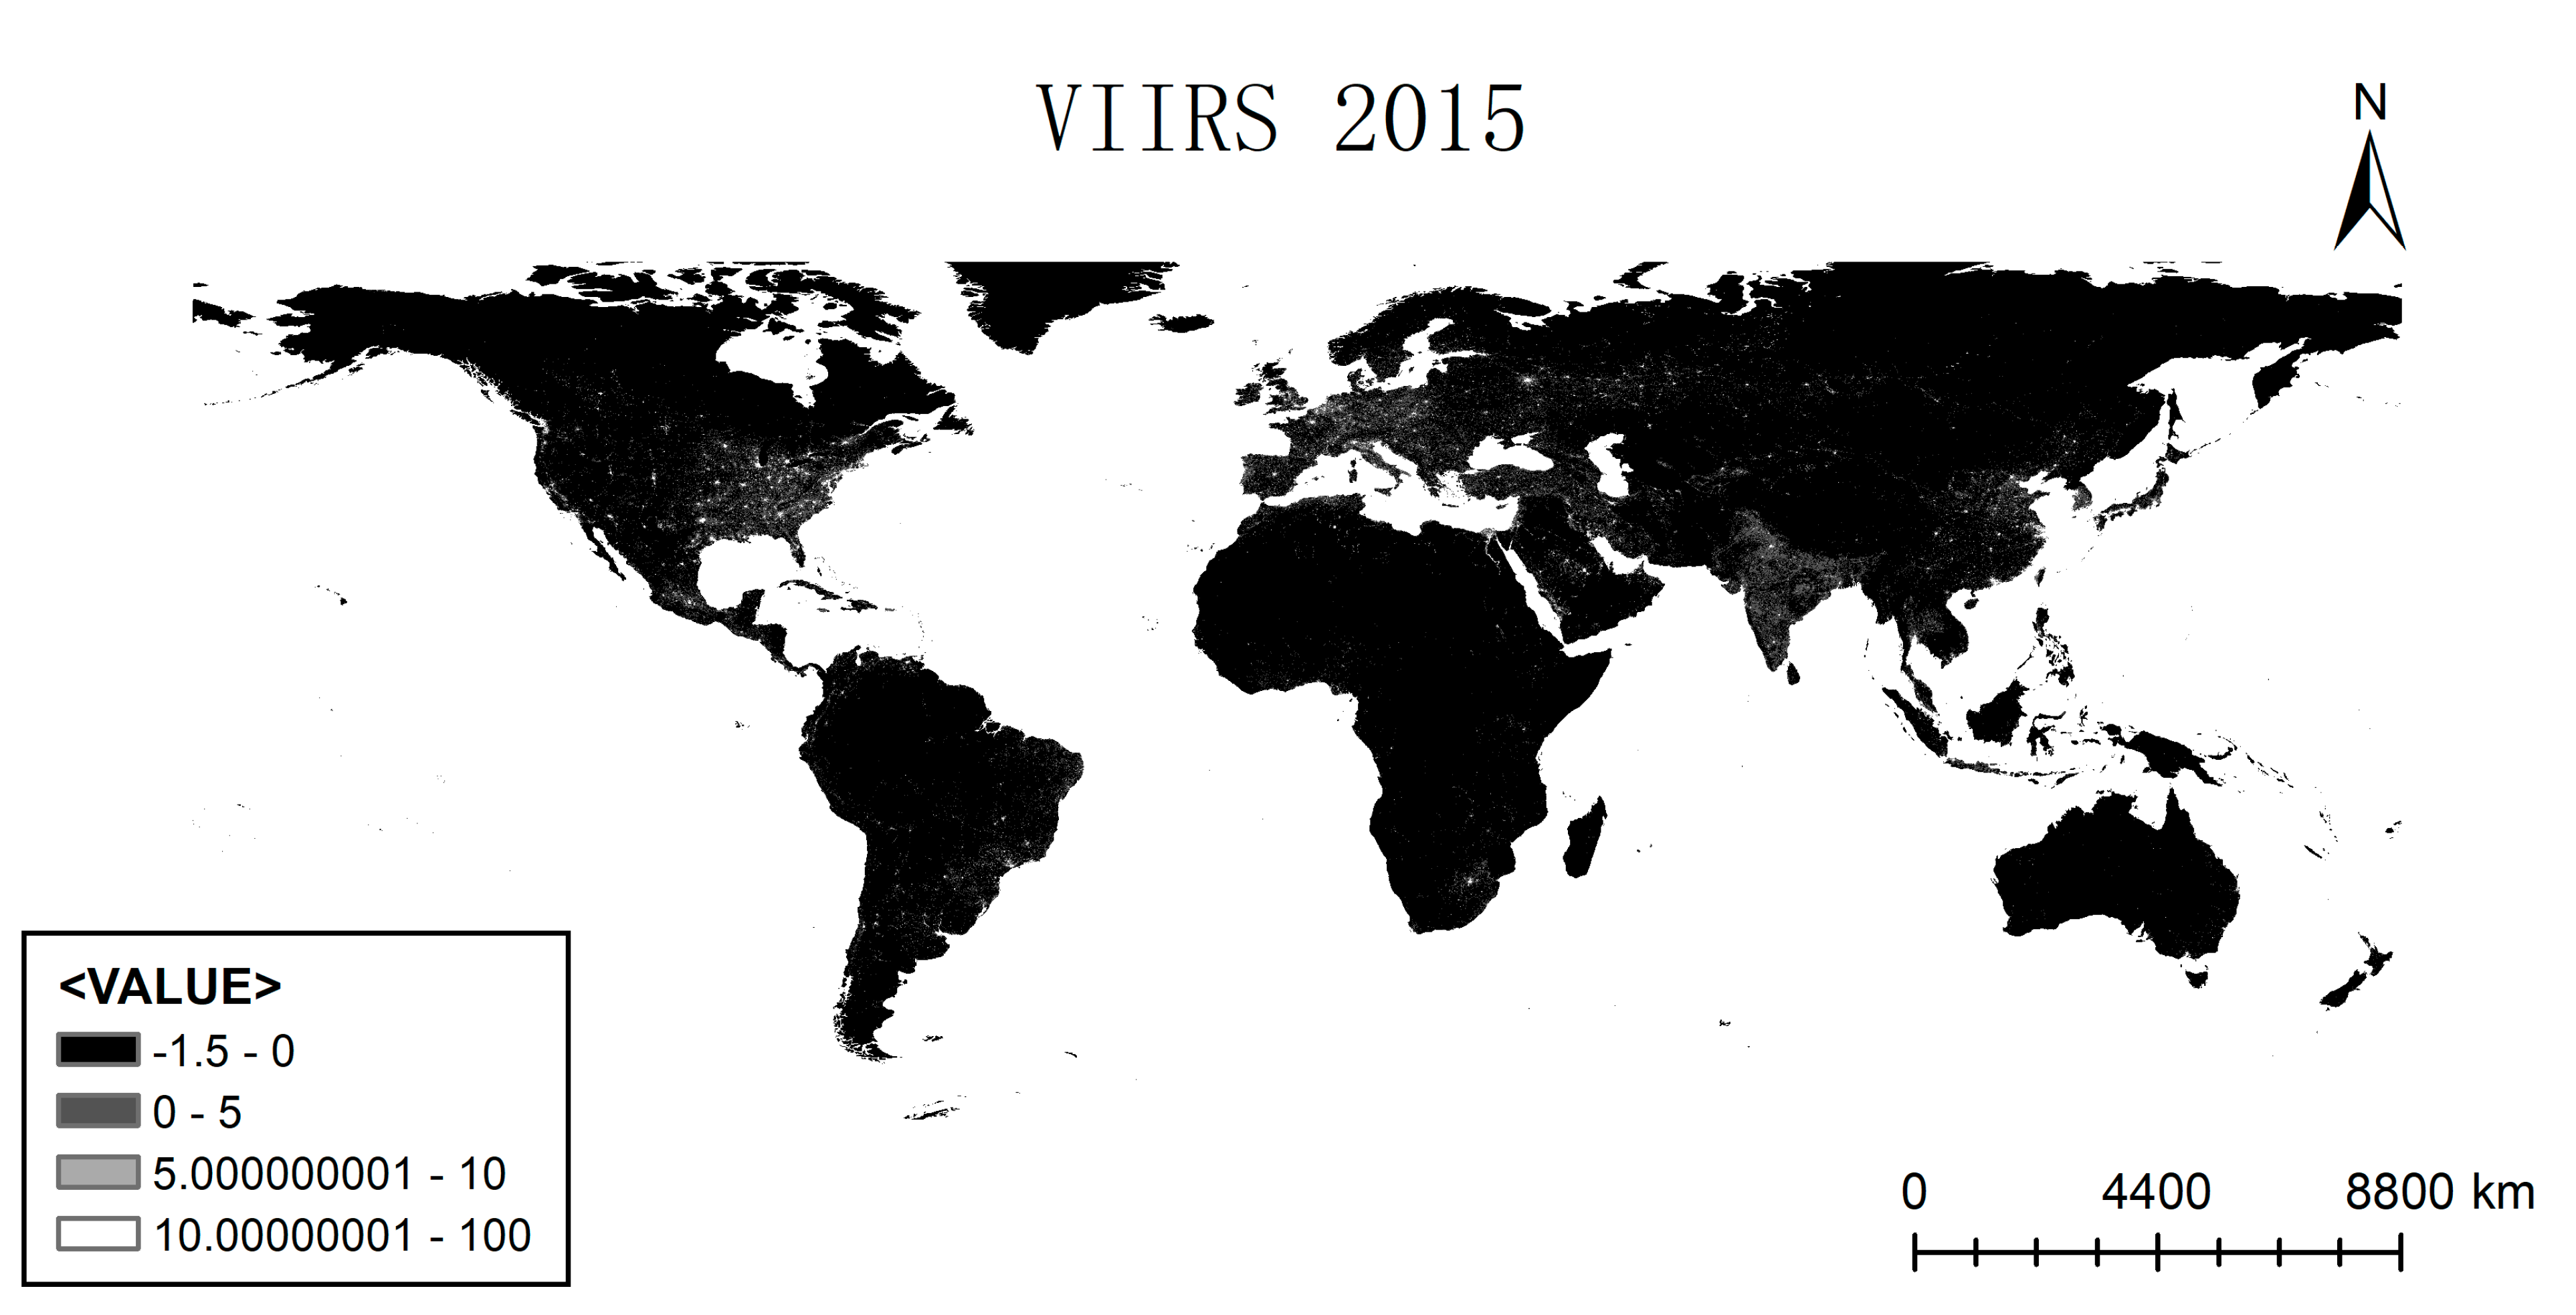
VIIRS data used in this study are also yearly composite maps with cloud data masked. Pixel values boasted a wider range, likely due to the increased capabilities of the VIIRS satellite series. The VIIRS datasets also received less prior treatment from the NOAA before publication compared to the DMSP data, with average values tending to be less than one on a scale measuring pixel values upwards of 10,000. This extreme gap in data values results in maps darker than those of the DMSP dataset, with smaller light clusters more compact and isolated. As a result, the VIIRS data required user processing to produce figures with visible information. The data display format was accordingly regrouped into five intervals at smaller values to illustrate the smaller average band values while excluding the unprocessed, extremely high values, thus producing the final map images.
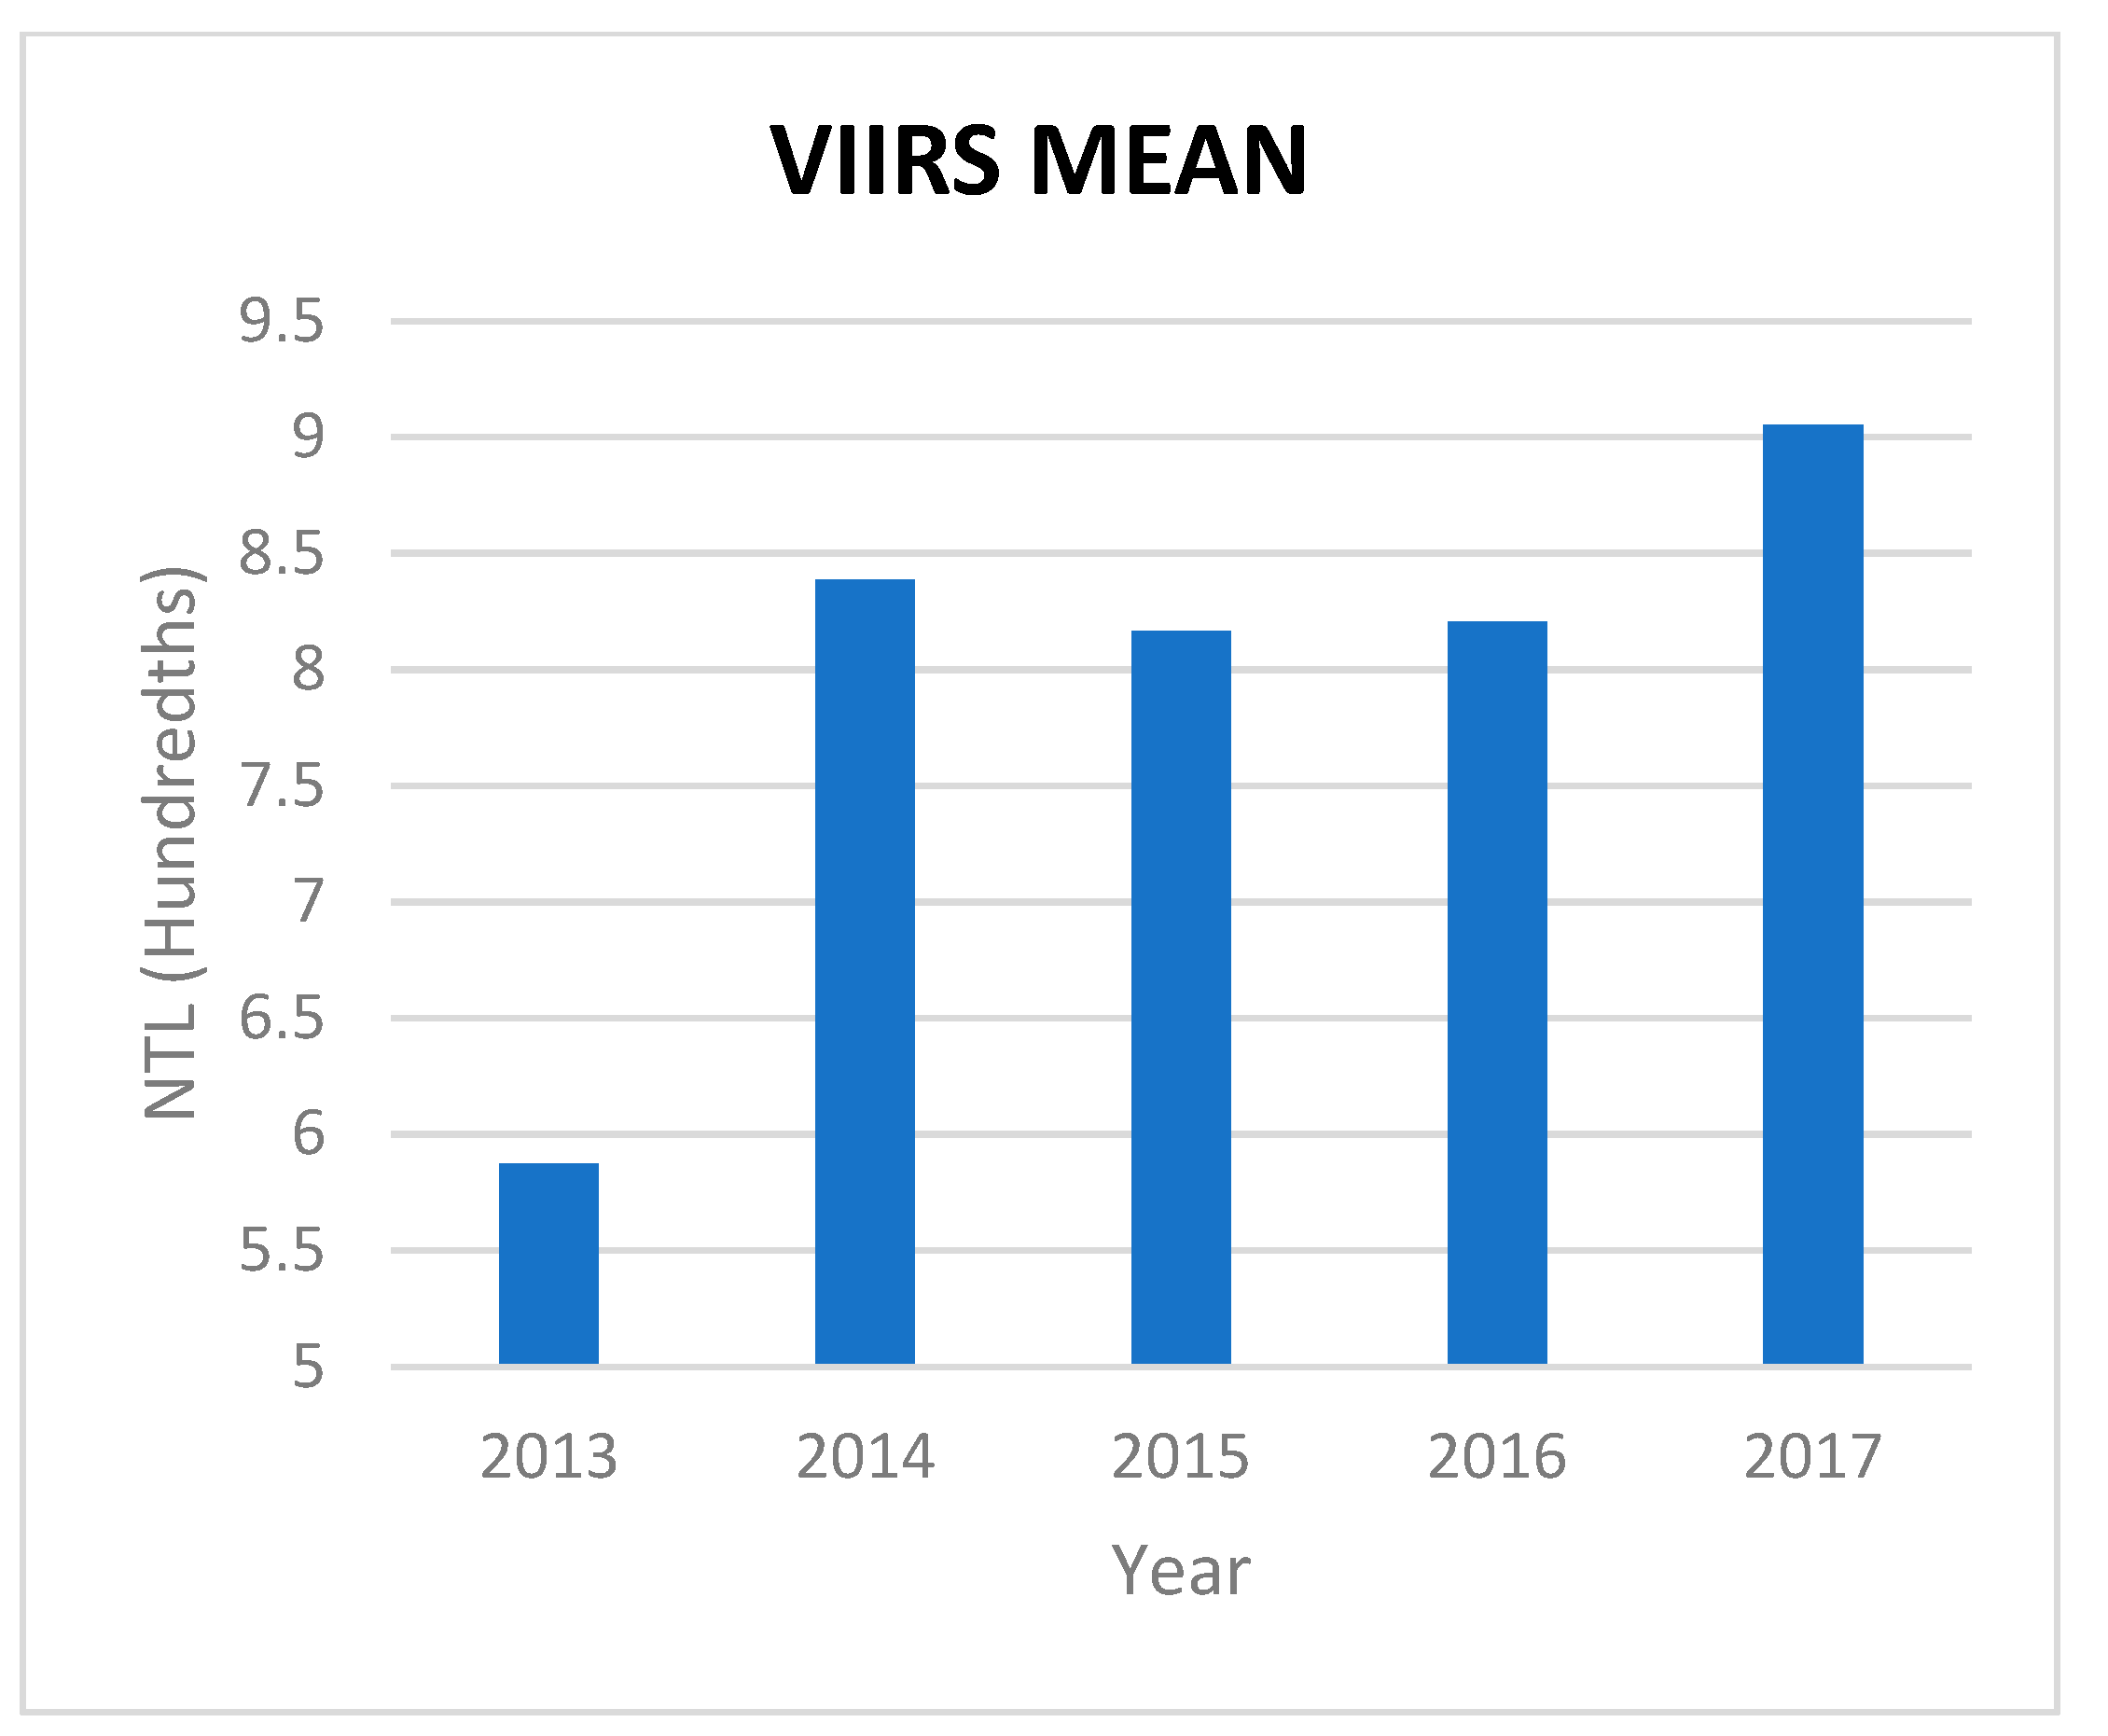
As with the DMSP results, the four years surrounding the decrease in GDP in 2015 all showed an increase in NTL; the same as seen in the corresponding GDP data. The year 2015 showed a marginal decrease in average pixel value from 0.08386 to 0.08164, which is a 2.6% decrease, and GDP from the same year also decreased by 5.3%. Overall, the VIIRS dataset acts as the opposite to the DMSP data in that the VIIRS data in its five-year span displayed less pronounced change.
Figure 4 shows the global NTL in 2015 using VIIRS data, while
Figure 5 and
Figure 6 illustrate the NTL and GDP changes in further detail.
5. Discussion
5.1. 2011 Analysis
Data was selected centered around the two years with instances of GDP decrease, namely 2009 and 2015. In theory, should NTL data display a positive correlation as expected, then a negative growth in GDP should also be reflected in NTL. However, while the expected reduction across both GDP and NTL data did occur in the two focus years, NTL also showed a significant decrease in 2011 despite GDP’s increase in that year, displaying a negative correlation between GDP and NTL in contrast to the rest of the data in the time series. Thus, it can be said 2011 is the only outlier year in the data, falling out of line with the predicted results and therefore worthy of further analysis. As a result, despite an original outline of utilizing five-year spans centering on the instances of GDP decrease (2007–2011 and 2013–2017), 2012 was added to the DMSP data range for further analysis. The aim was to include the year after the outlier year to discover whether or not the pattern of negative correlation would or would not continue, and what effect the additional year would have on the regression analysis. Coincidentally, 2012 is the last year available in the DMSP data series, meaning the only option for further study was adding this singular year.
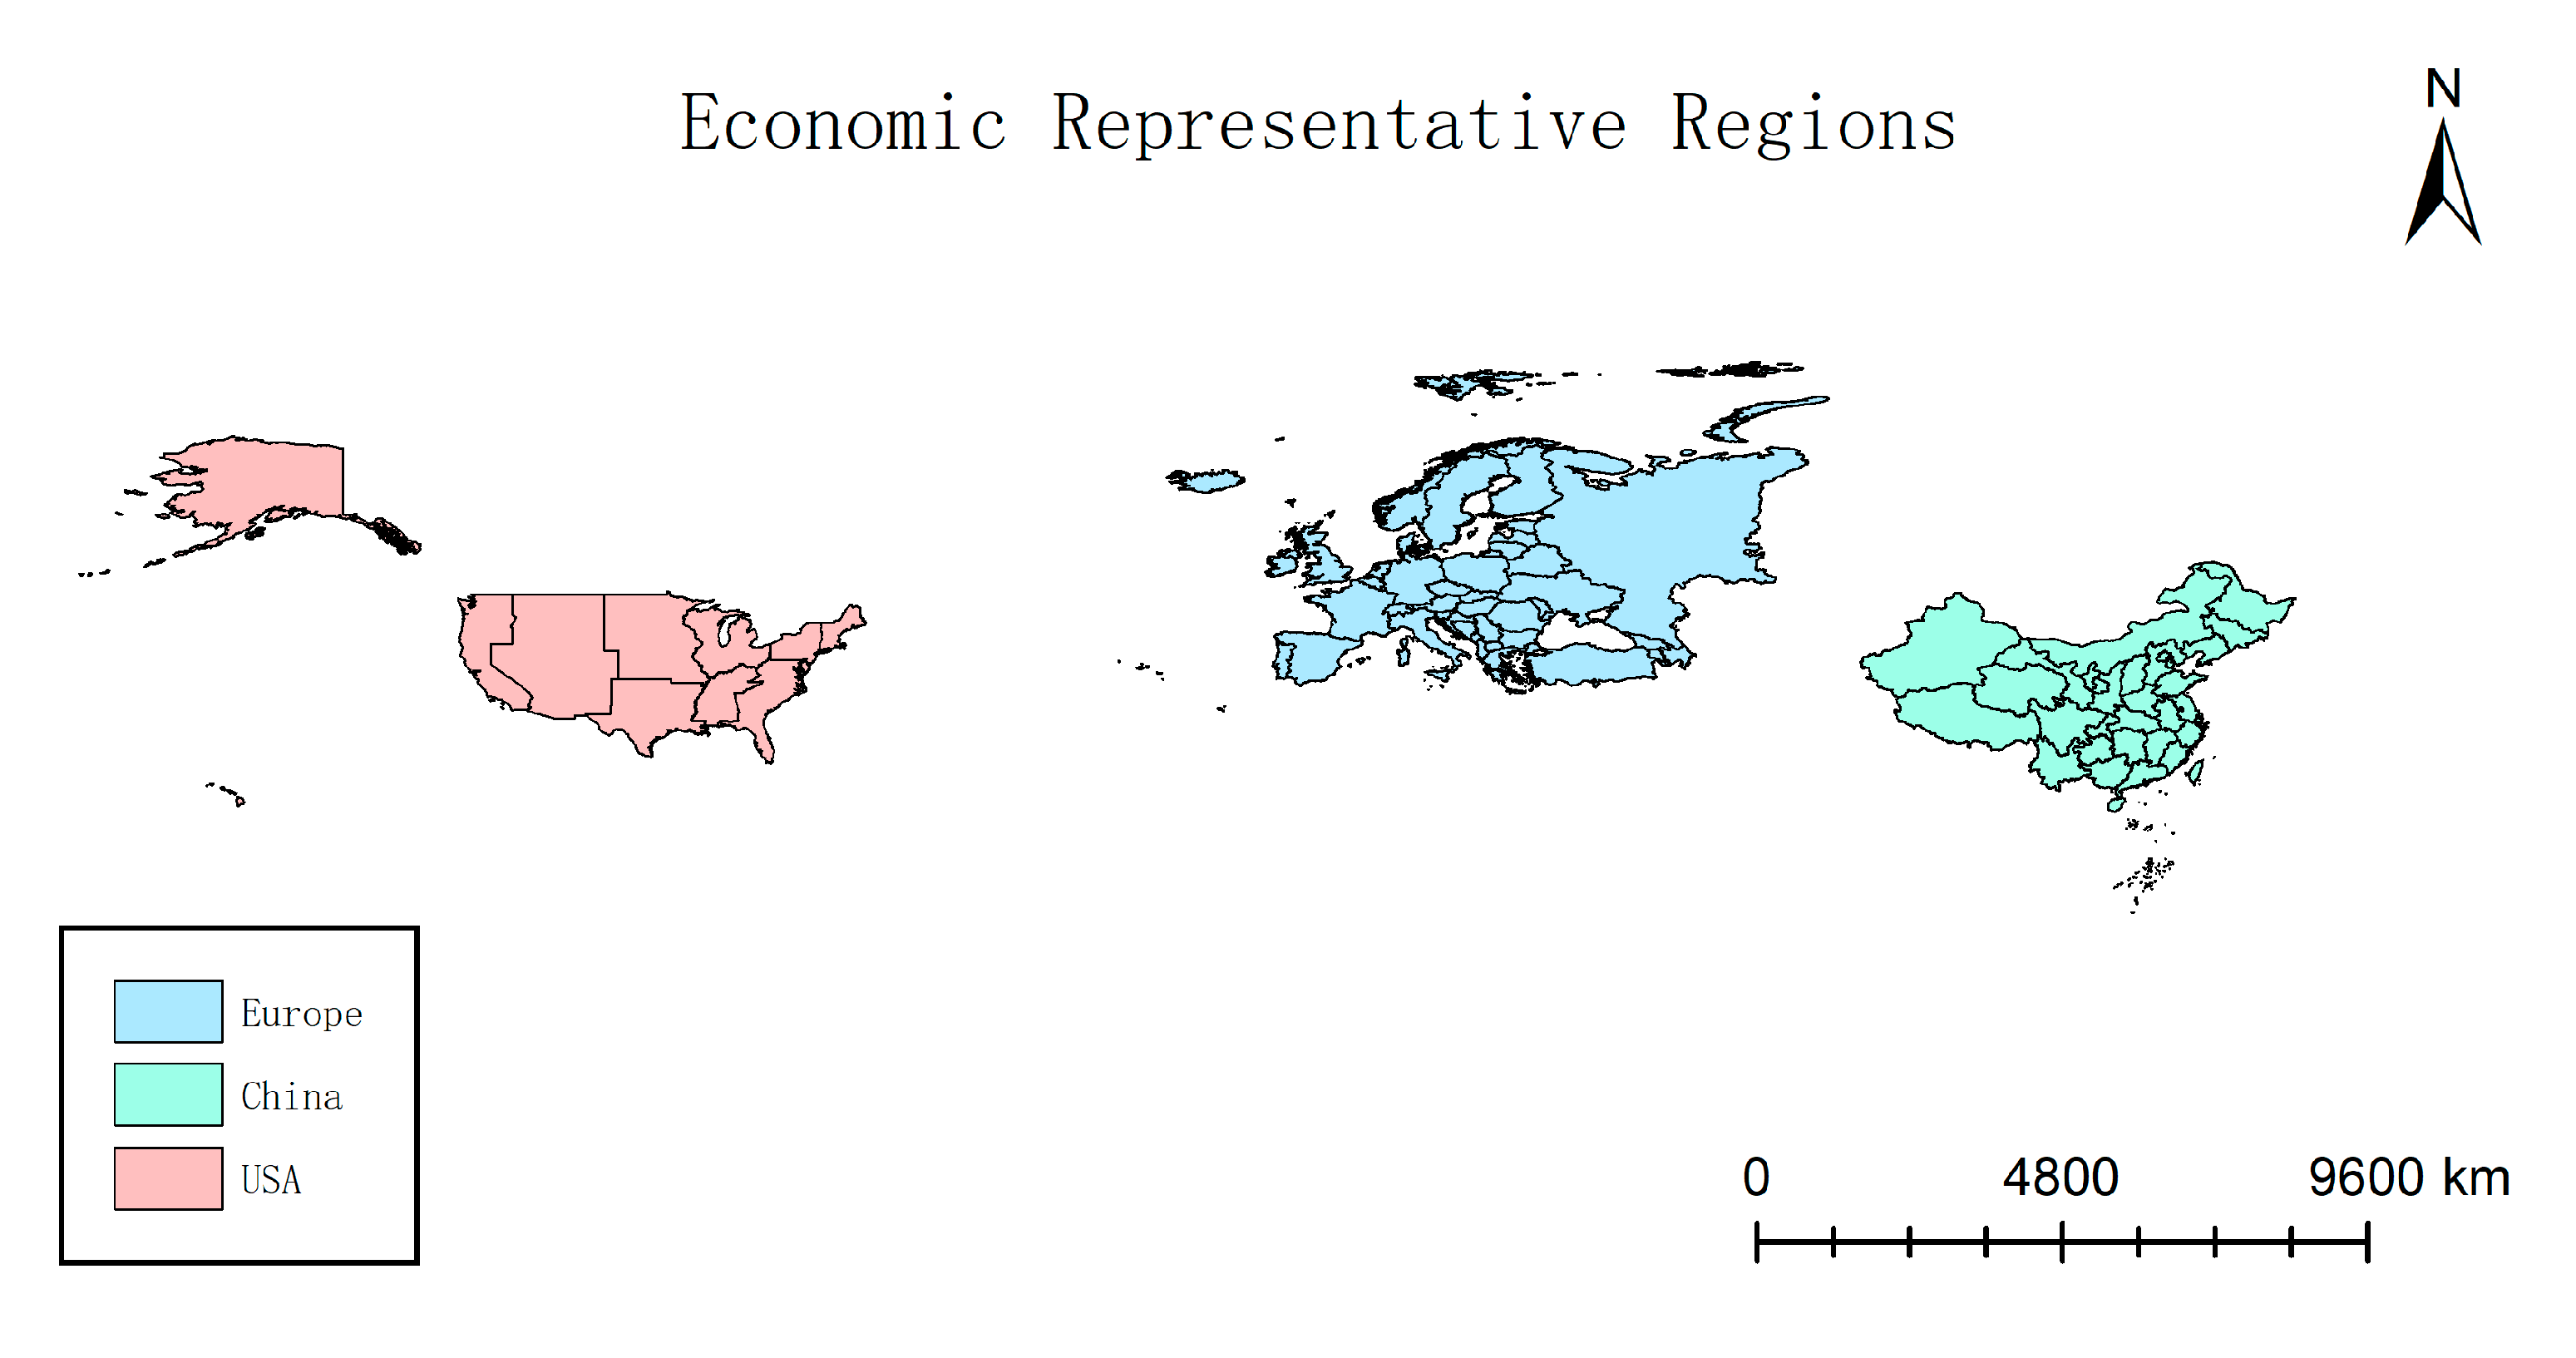
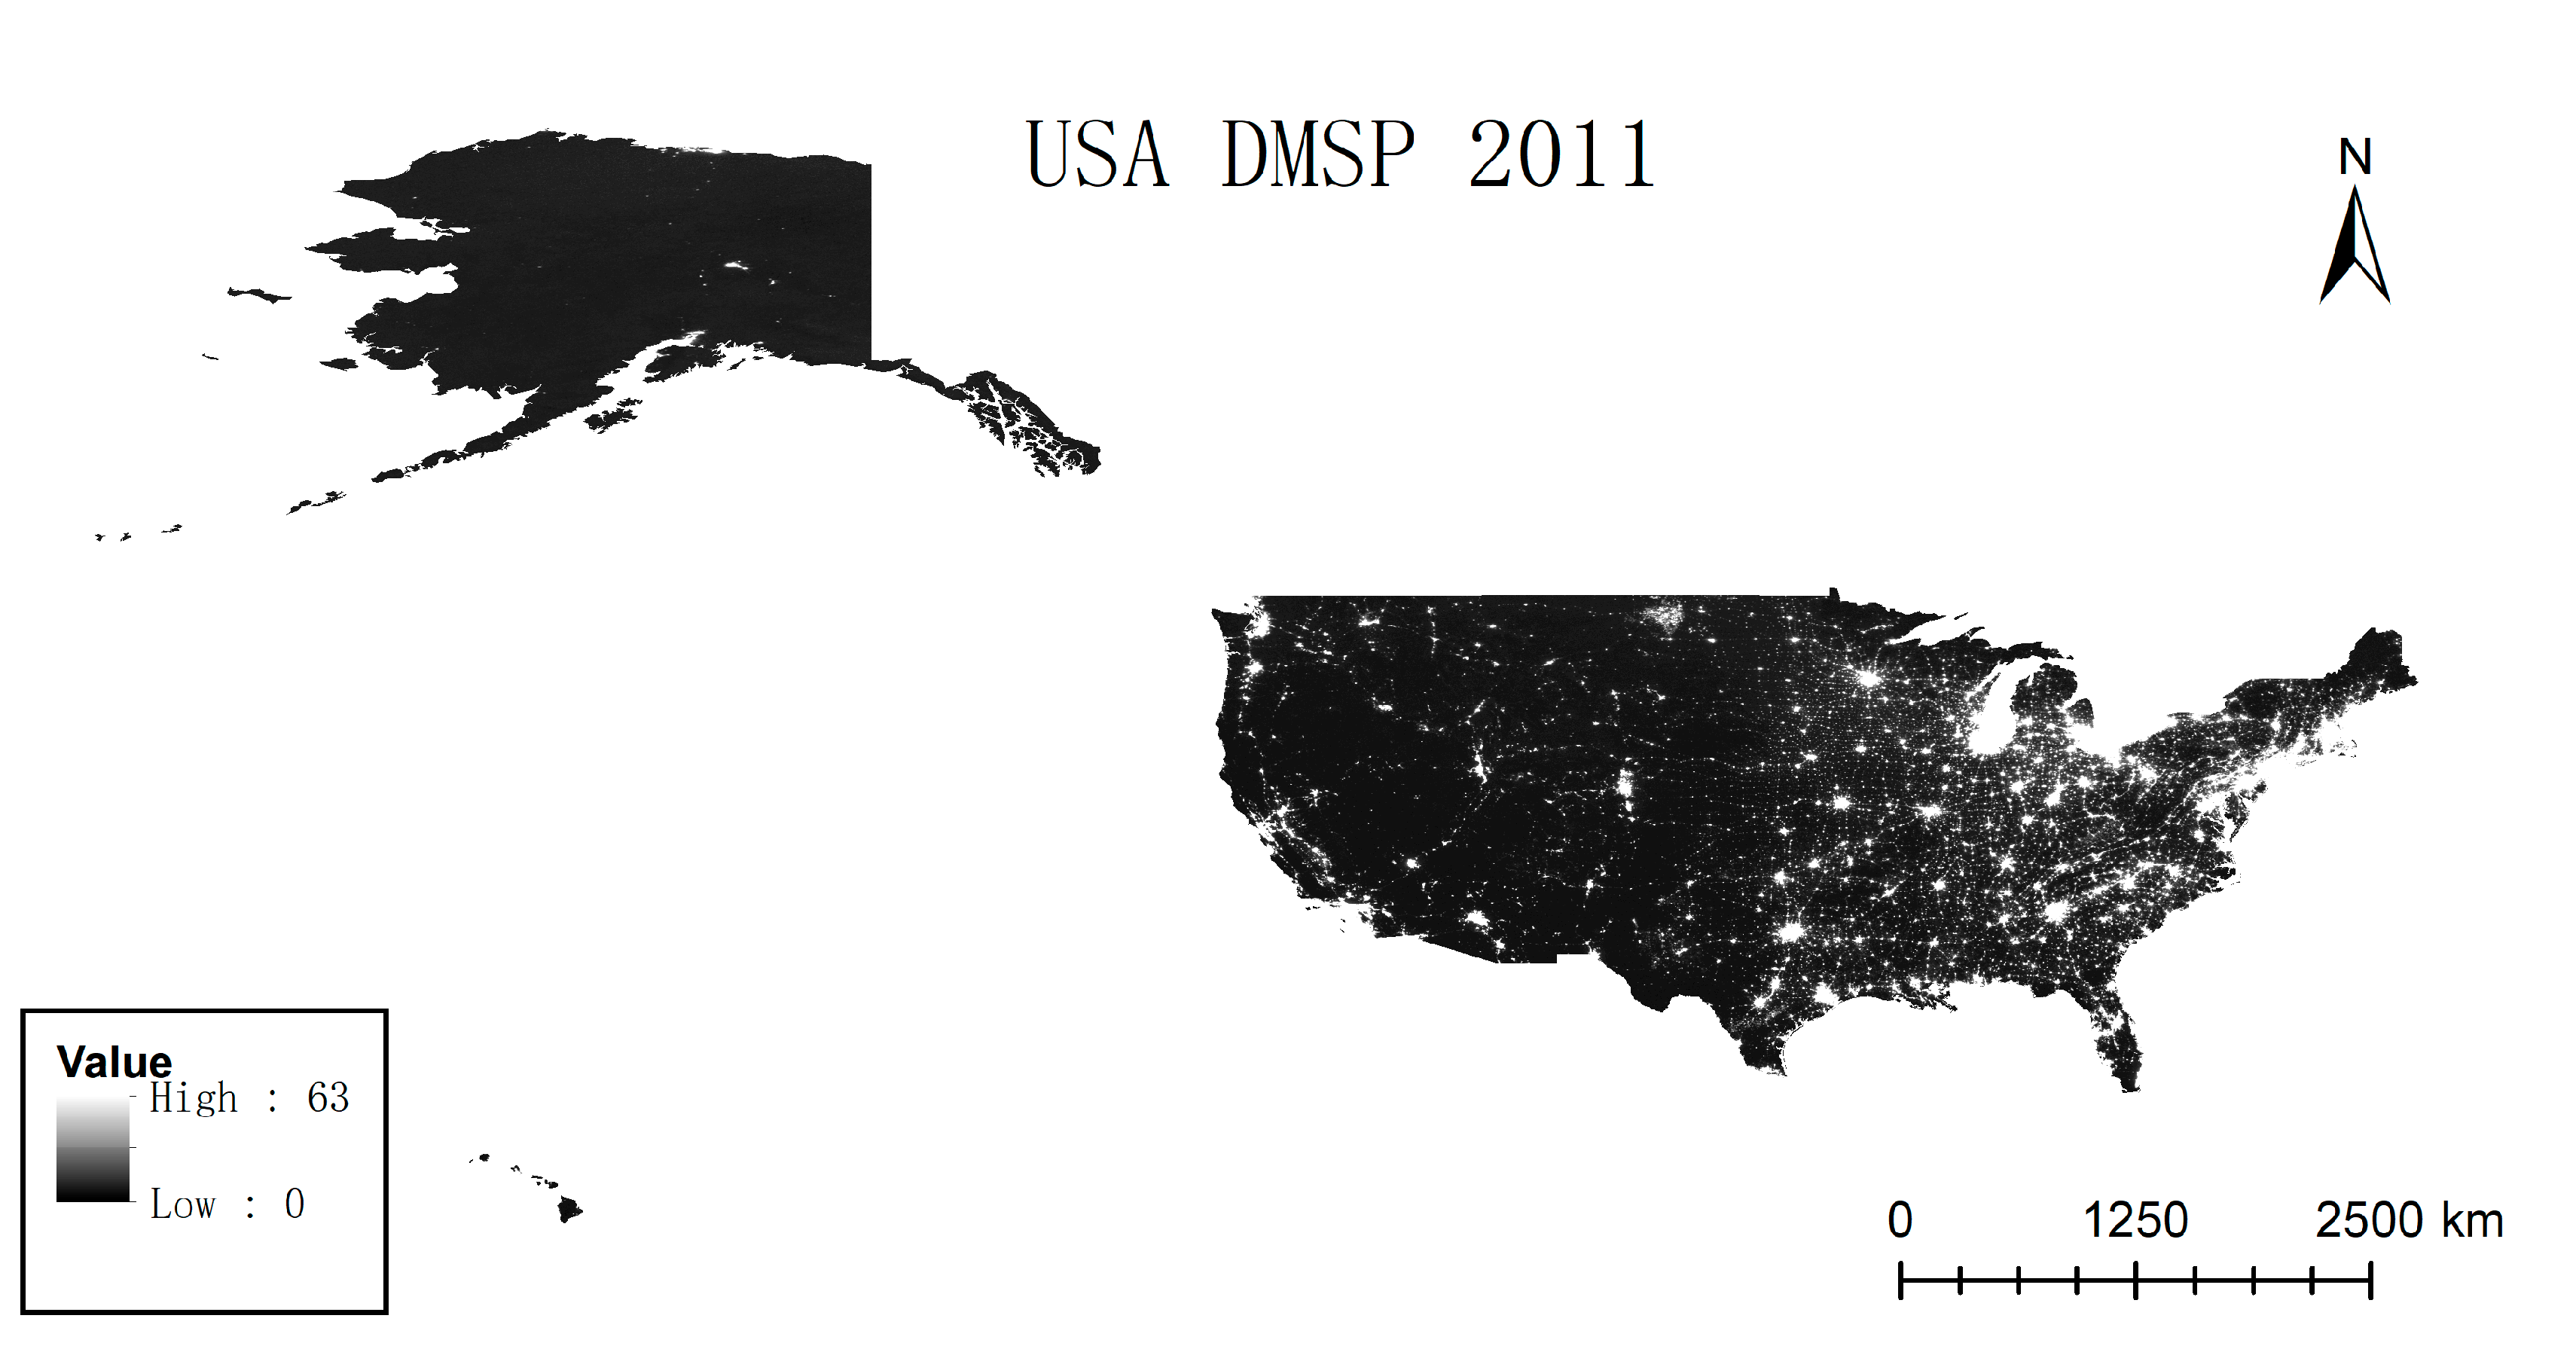
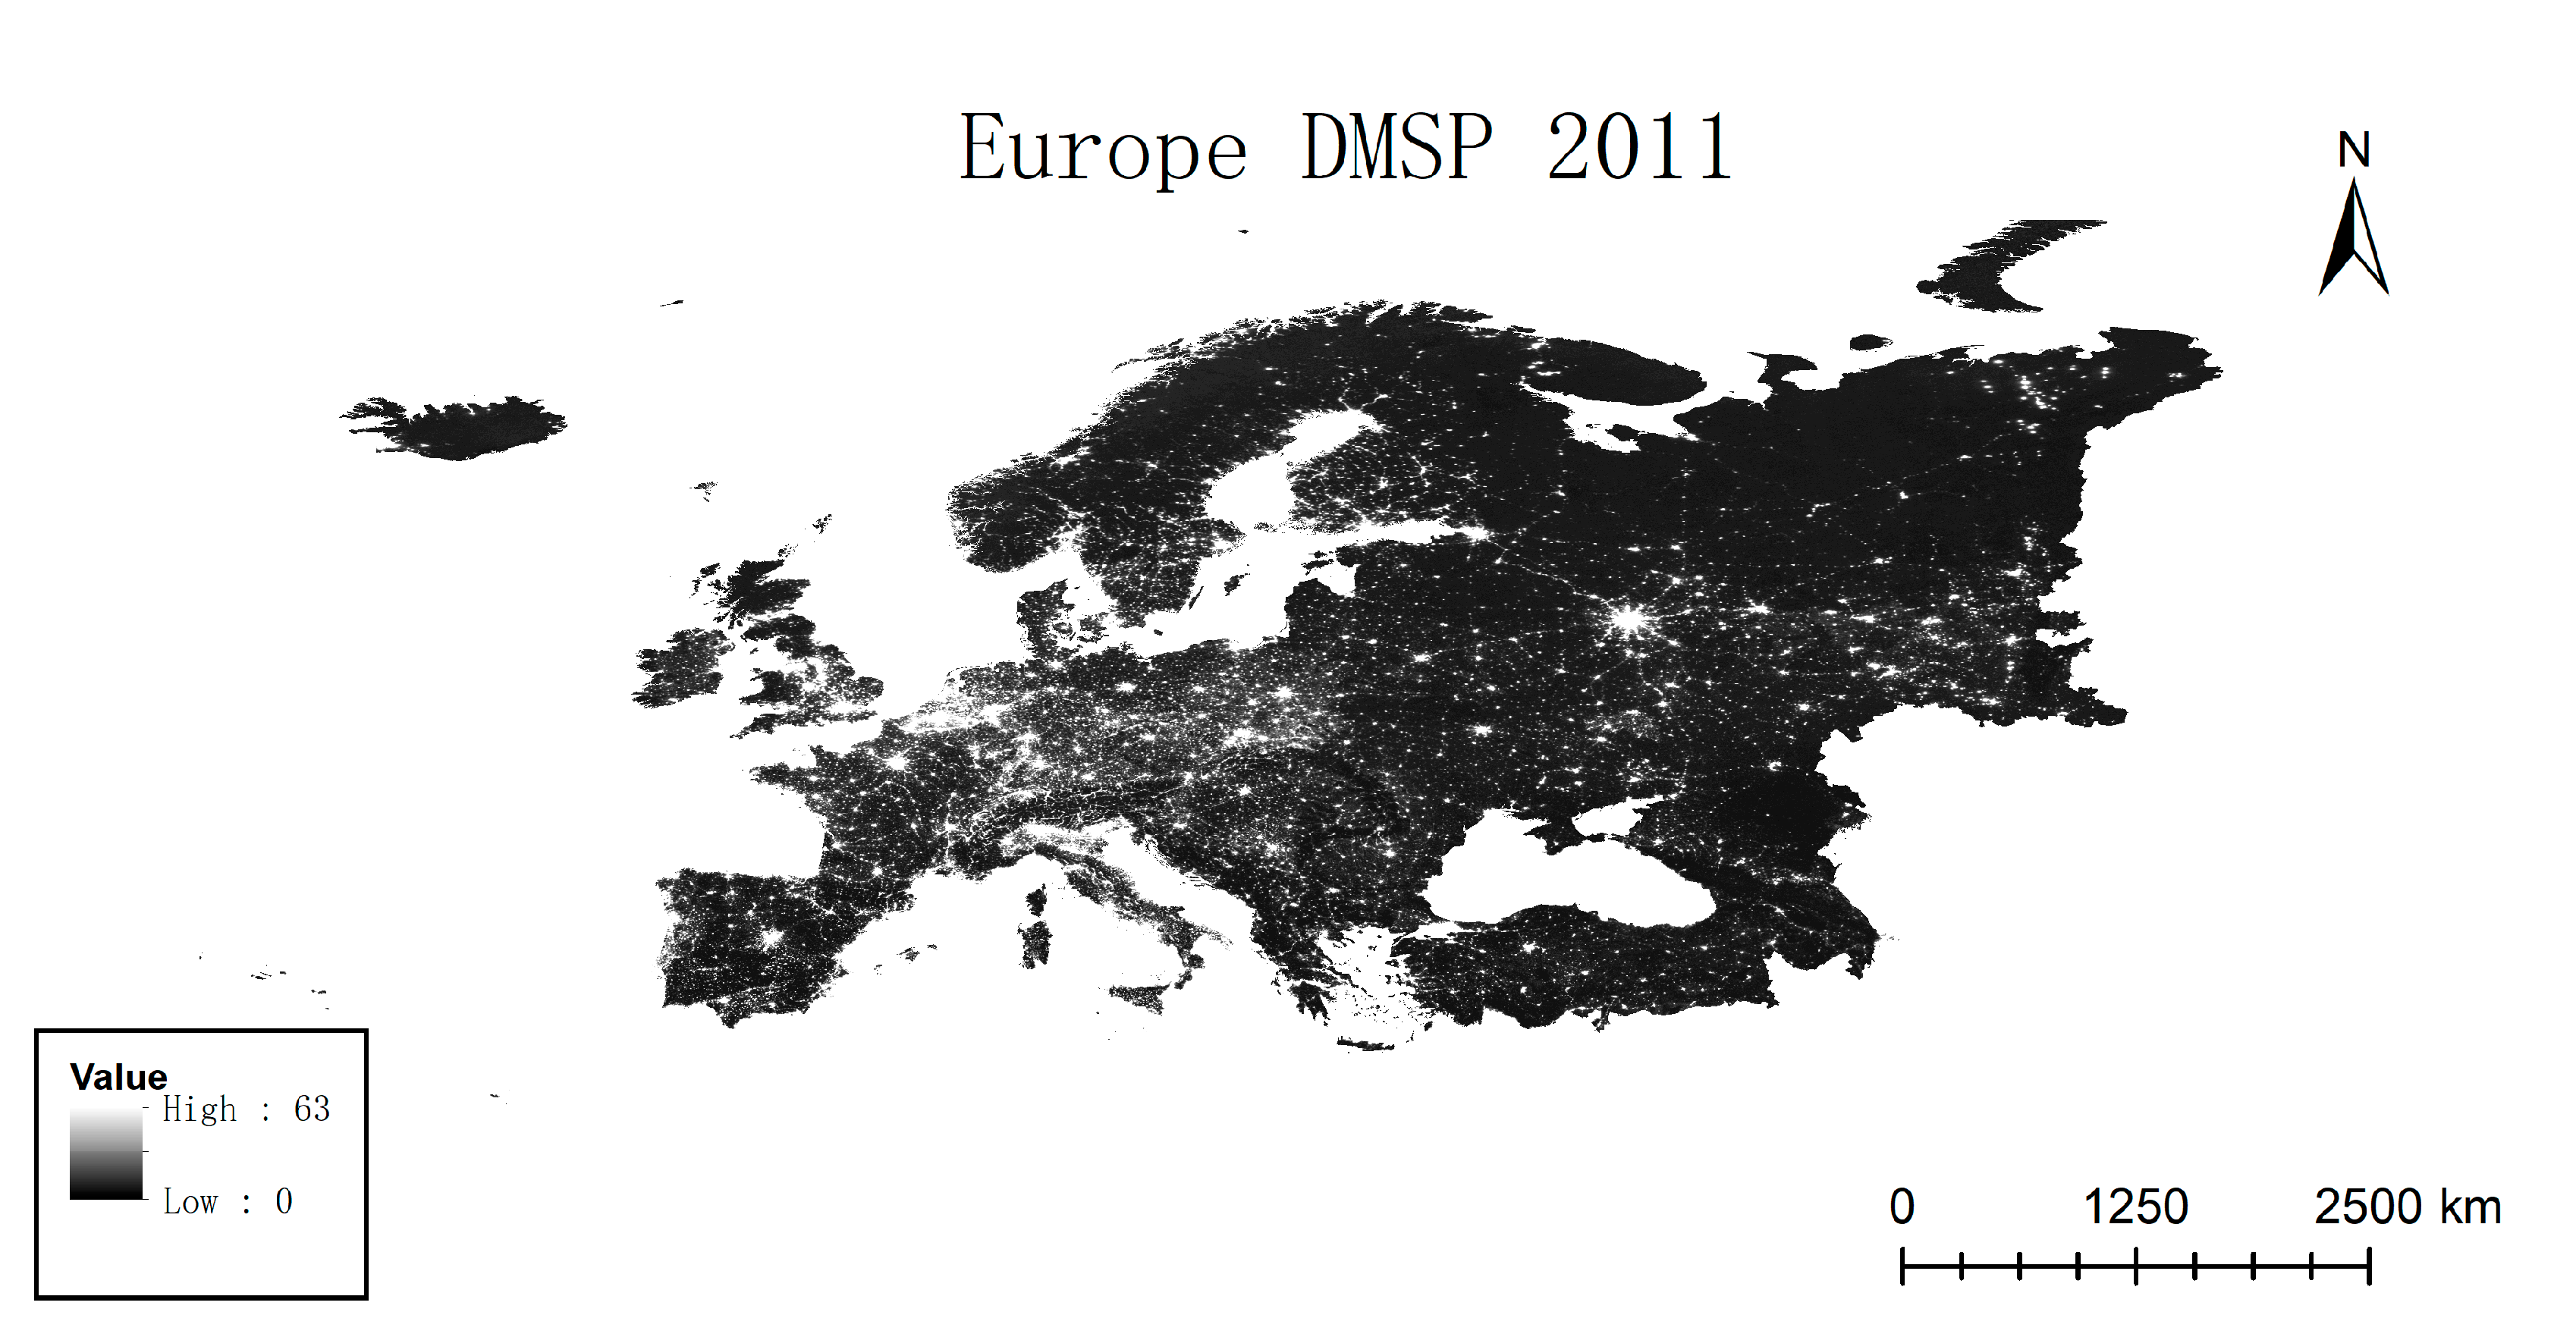
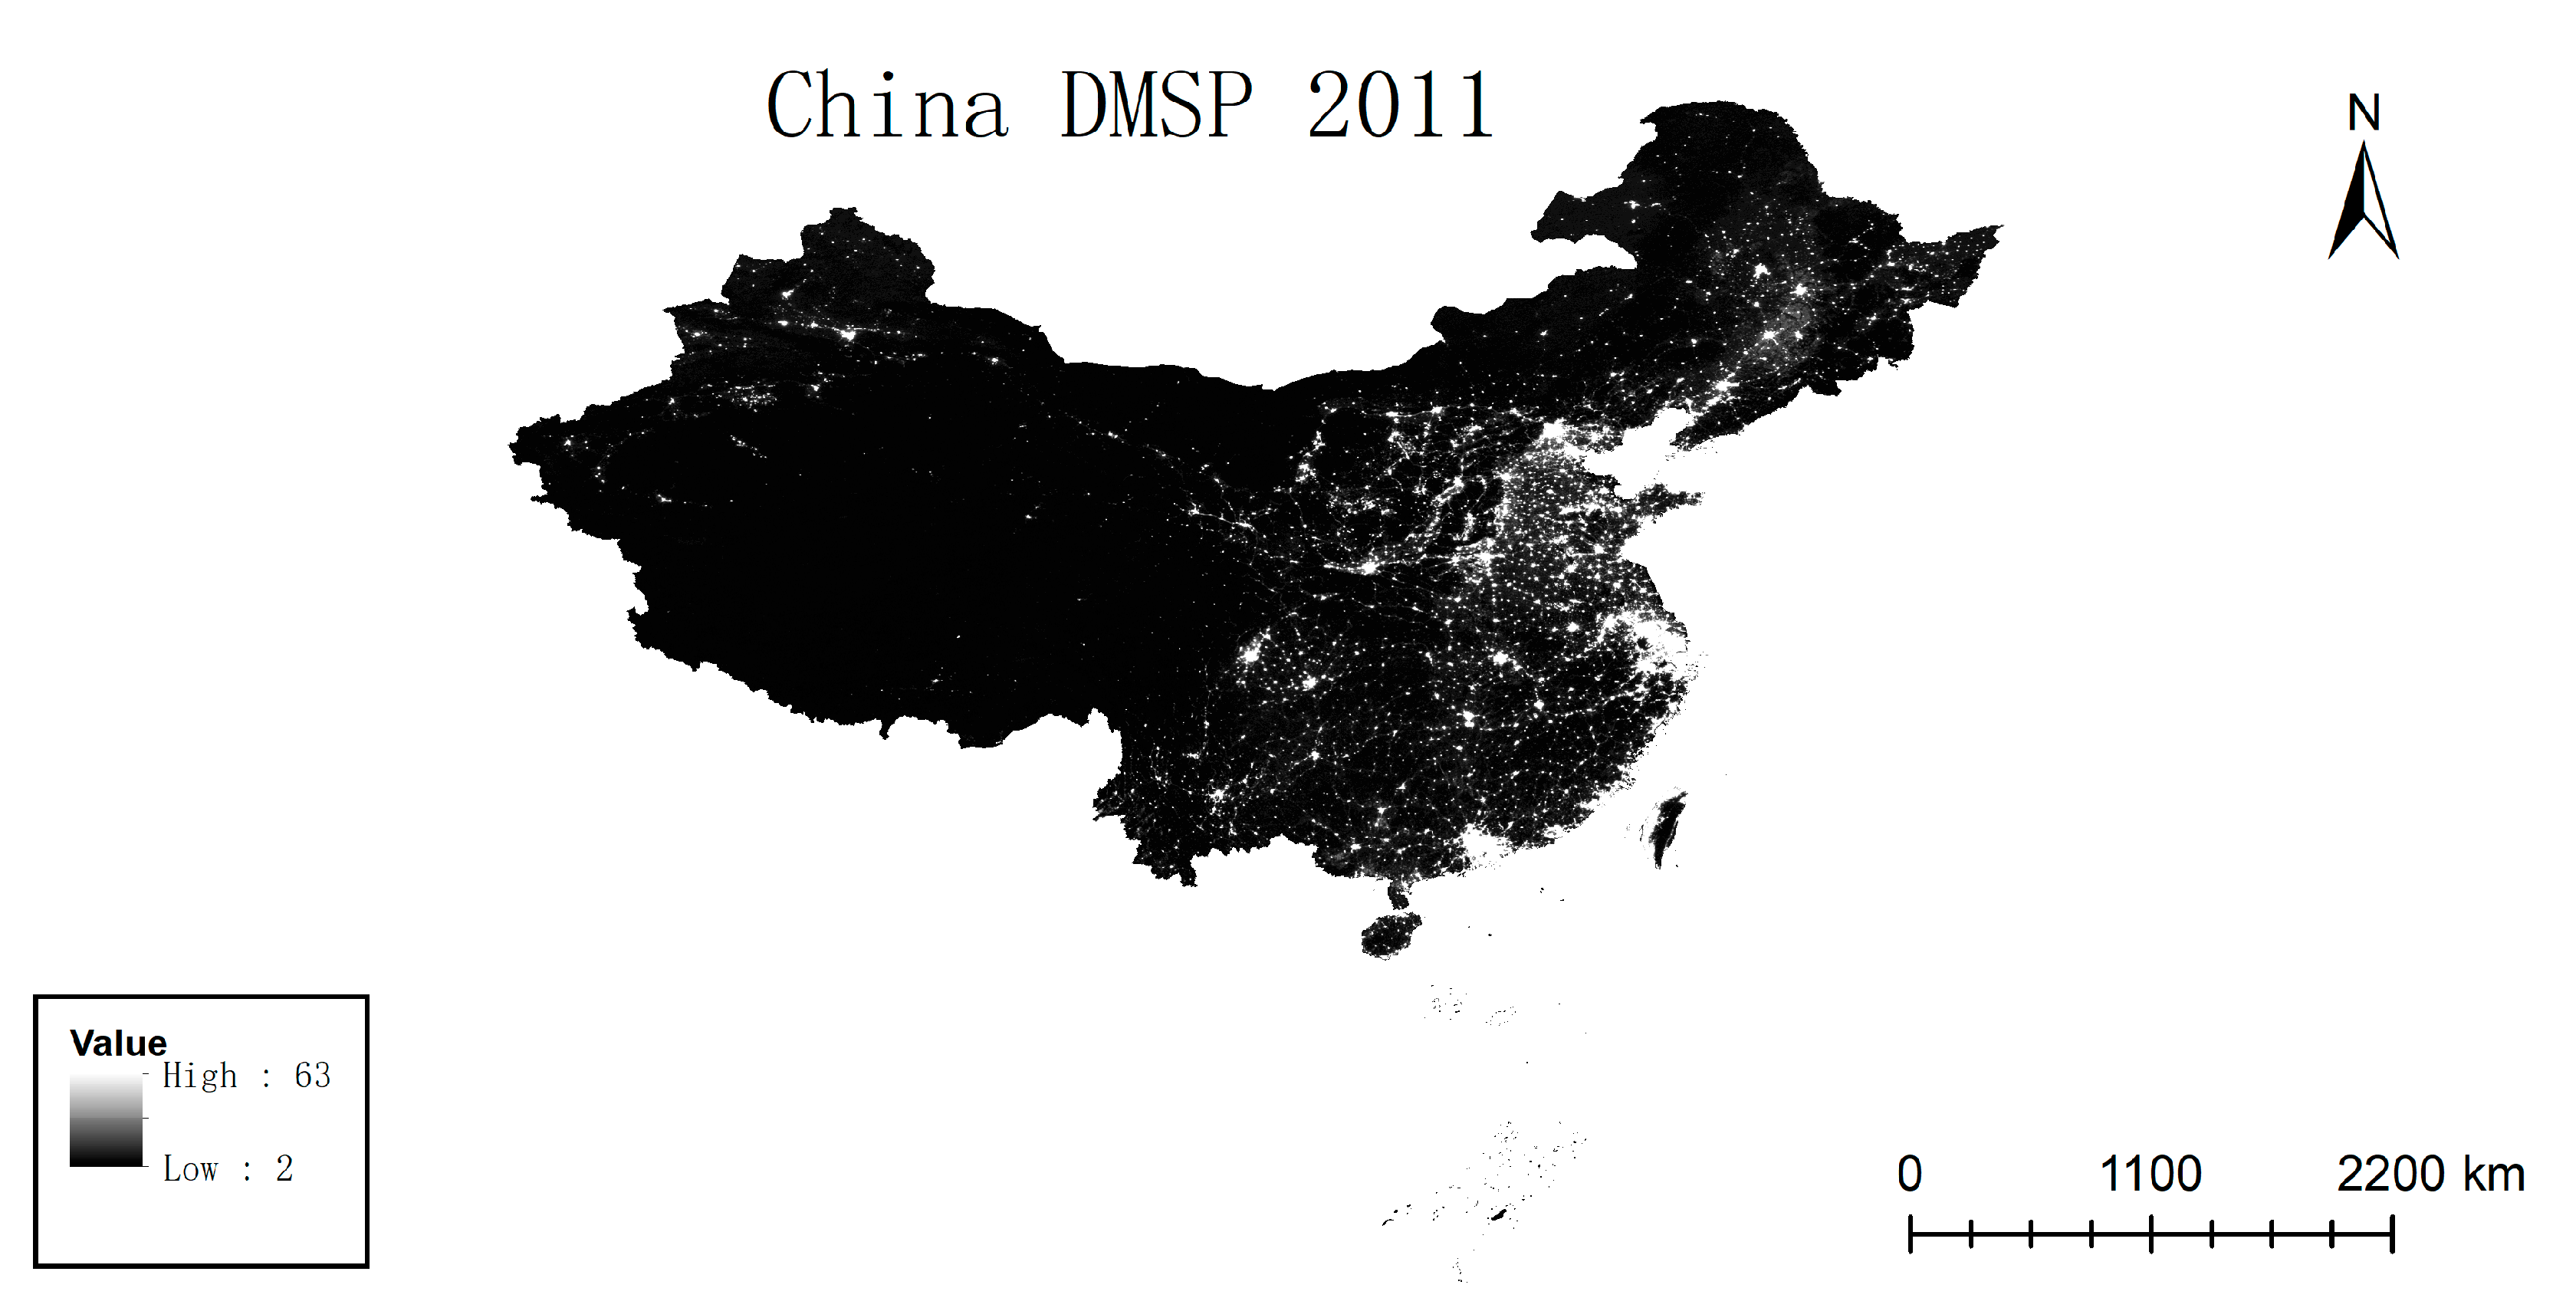
In the interest of further examining the sole outlier case, the study sought to conduct a more detailed analysis for the years 2010 and 2011, over which the data changes uniquely showed negative correlation. The detailed analysis was conducted on a smaller spatial scale to examine the more minute changes in the data. To represent the changes that occurred on such a large scale as the global scale, representative regions were chosen; namely, three main areas: the United States, China, and Europe. As these three regions produce the highest GDP comprising the largest shares of the global GDP data, in theory it is these three regions that will display the brightest NTL and therefore, show fluctuations in NTL data that are likely to have the greatest impact on the overall world NTL output. With this in mind, analyzing the three regions’ changes in NTL data from 2010 to 2011 may prove useful as representatives for insight into finer changes in NTL.
To begin, the United States of America, currently the nation with the largest economy and largest contributing share, displayed a 15.6% decrease in NTL, dropping from an average pixel value of 8.457 to 7.134. Not only was this drop in NTL in line with the global level change, but the United States’ GDP change over the same period was also positive, at a growth of 3.66%. Europe also experienced a decrease in NTL, losing 22% and dropping from an average pixel value of 9.718 to 7.582, while Europe’s GDP data saw positive growth at the rate of 7.88%. The final region was China, which decreased 14.4% in average pixel value from 5.855 to 5.010. At the same time, China’s GDP saw a staggering increase of 24.1%. This division illustrates the diversity of the metadata. All three regions showed negative NTL growth during periods of positive GDP growth. In other words, each of the regions supported the picture painted by the global trend in this outlier year. While China’s average pixel value remained significantly lower than that of the other two regions with a more volatile NTL decrease, it also showed the highest GDP growth of the three regions by far. The United States and Europe both displayed more restrained changes in NTL, which is in line with the more restrained changes in the two regions’ economic growth.
This demonstrates that the NTL loss experienced in the three largest areas of NTL growth in the world could not be compensated for by any potential gains experienced elsewhere, resulting in a net reduction of NTL globally. This marginally falls in line with globalist economic theory, which claims that as the economies of the world become more interconnected and specialized, all participants will grow and benefit [
14]. Moreover, in the following year of 2012, each of the three regions continued to influence the global trend of positive correlation between GDP and NTL, with each region seeing positive growth in both sets of data. This is an interesting point for two reasons. First, this phenomenon could potentially lend credibility to the criticisms aimed at national GDP’s limitations in accurately reflecting the economic reality of a country’s population. At times, economic reports may show positive growth, such as in less concrete industries like real estate and stock trading, while citizens in particular regions or on average may still be lagging behind in sharing economic prosperity. In this case, during the period of the Great Recession, it is possible that GDP began to recover in part thanks to national economic policy efforts, while local economic activity continued to stagnate as reflected in the negative NTL growth. Secondly, while most of the time series experienced changes in GDP and NTL that correlated, including years of negative growth, there are still exceptions to the prevailing trend. This shows that while NTL could be a potentially accurate tool in correlating economic growth, it is not infallible alone and should be used in tandem with other indicators or examined carefully. As such, further research could use globalist development as a lens to analyze the potential link between economic and remote sensing data or its drawbacks therein on smaller scales for more specific, minute details outside of the most influential economic regions.
Figure 7 shows the three regions being analyzed, while
Figure 8,
Figure 9 and
Figure 10 display the NTL of each region in 2011.
5.2. Linear Regression Analysis
Linear regression analysis was carried out individually for the DMSP dataset and the VIIRS dataset. Particularly, for the DMSP dataset linear regression was carried out twice: once for all years from 2007 to 2012 and again excluding 2011. Because 2011 was the lone year in which GDP and NTL data displayed a negative correlation, in order to assess its influence 2011 was excluded in an extra linear regression analysis.
Linear regression was manually calculated according to the following equation:
For all years of the DMSP data, a subpar result was produced, with R
2 calculated at 0.5204. However, with the anomaly year 2011 excluded (2007–2010, 2012) linear regression was calculated at R
2 = 0.7072. Regression carried out for all years of the VIIRS data resulted in a coefficient of 0.1575, a particularly low result. However, with the year 2013 excluded from the regression data a result of R
2 = 0.8032 is achieved, a more satisfactory result. The second VIIRS linear regression was run without 2013 due to the sizable increase in NTL in contrast to the relatively small increase in GDP, which likely caused the primary low result. Although the research was limited in the amount of data, satisfactory results were nevertheless obtained despite the relatively small time frame. Previous literature shows similar correlation results. Dai et al.’s study using provincial level data in China yielded regression coefficients for DMSP data ranging from 0.7478 to 0.7835, and for VIIRS data the coefficients ranged from 0.8653 to 0.8738 [
1]. Dubey et al. predicted national GDP in India using NTL and produced regression coefficients of 0.87 and 0.7511 for DMSP and VIIRS datasets, respectively, a rare case showing the DMSP data product demonstrating a higher NTL correlation than VIIRS [
2]. Zhu et al. obtained one of the highest coefficients by processing and then combining DMSP data with VIIRS data to develop a longer continuous set of data, which resulted in a coefficient of 0.9648 [
7]. Thus, it can be concluded that while not unconditionally, the DMSP and VIIRS NTL datasets are capable of producing somewhat accurate regression results with GDP data on the global scale, including during times of GDP decrease. Future research may be able to provide even more accurate results with smaller, but higher quality datasets or by studying decreasing economic indices on smaller spatial scales.
6. Conclusions
Despite an extensive amount of research into the positive correlation between GDP statistics and NTL data, a gap exists in verifying the relationship in times of negative GDP growth. In order to further strengthen the body of research studying said relationship, this study sought to focus on examining the change in NTL during the years of 2009 and 2015: the only two years in recent history that recorded a global decrease in GDP. NTL data was downloaded from the DMSP and VIIRS satellites to produce global level maps depicting NTL data for each year of the study’s focus according to each data type. These datasets provided the basis for assessing the viability of the DMSP and VIIRS satellite series’ capacity for GDP correlation during times of economic downturn. Additionally, shapefiles for the United States, Europe, and China were included to find each region’s NTL for 2010 and 2011.
After finding the average pixel value of each NTL map, this average was then used as a representative for the NTL overall when calculating yearly change. Yearly NTL change was then compared with yearly GDP change. In both 2009 and 2015 NTL and GDP both experienced negative growths as had been expected and measured at 12.8% and 2.6%, respectively. Additionally, all years except 2011 displayed positive growth for both GDP and NTL. To further understand the underlying causes of why 2011 showed a negative correlation between GDP and NTL, the United States, Europe, and China were selected as representative regions to analyze the smaller changes in NTL compared to GDP. Each of these three regions saw negative NTL growth in line with the global NTL trend, while also experiencing positive GDP growth that likewise followed the change in global GDP.
After calculating the change of time of the NTL for both datasets, simple linear regression was carried out for both the DMSP and VIIRS datasets. A regression coefficient of 0.7072 was calculated for the DMSP data compared to GDP, while the VIIRS data produced a coefficient of 0.8032. These results are in line with past research, showing that the VIIRS line of NTL data provides a more accurate description of global NTL in comparison to the previous DMSP data. Though not ideal, these linear regression results were still deemed satisfactory in identifying a link between NTL and GDP using datasets from the DMSP and VIIRS satellite series despite the fluctuations in the data. Thus, this study concluded that there generally exists a fairly close, positive correlation between GDP and NTL on the global scale even during periods of negative growth. However, taking into consideration the outlier year of 2011, this relationship is not completely infallible and heavy fluctuations due to economic turmoil will likely decrease the viability of these two datasets. While providing a certain level of accuracy, NTL obtained from DMSP and VIIRS datasets would be ideally utilized in tandem with other indicators when studying economic conditions.
This study is limited in part by the small scale of data used temporally. The available years of VIIRS dataset and the limited number of instances of global GDP decreases restricted the amount of data used, but future studies might look for more available points of interest in GDP decreases at a regional level. Secondly, this study is limited by the type of data utilized. DMSP and VIIRS datasets were specifically selected as they are the most commonly used NTL dataset for economic research, and therefore this study has not examined other, more minor data products. Although these selected data products are of high quality and satisfactory for research, later research has been able to improve the quality of NTL data for such newer, less frequently used NTL data products, and subsequent analysis using these data products could further highlight the utility of NTL during economic downturns. Additionally, through further processing of issues such as saturation and cloud cover, even better NTL data images could be analyzed. Future studies could also evaluate the utility of these other NTL data products in conjunction with GDP decrease.
Further research might strengthen this link by analyzing GDP loss on the regional or national level. In the past there have been more instances of GDP loss at the national level in multiple countries that would provide for more available research data than the two years of global GDP loss in the current study. Additionally, finding a correlation with the negative growth of other economic indicators could provide further insight as well. For example, future research could analyze spatiotemporal changes in NTL in conjunction with decreasing regional per capita income or local tax revenue, as well as with other indicators more prone to volatile changes such as unemployment or welfare distribution data. Likewise, a weighted index consisting of multiple economic factors could be used, as in Yu et al.’s study utilizing a weighted index of ten indicators for poverty evaluation [
5]. Pursuing any of these lines of study would help in understanding the limitations of NTL data products in economic correlation, thus enhancing the credibility and accuracy of their applications.
Author Contributions
Conceptualization, C.C. and R.D.; methodology, R.D., B.X. and Y.C.; software, K.W. and Y.C.; validation, K.W. and Y.C.; formal analysis, R.D., Z.H. and B.X.; investigation, R.D. and Z.H.; resources, R.D.; data curation, R.D. and Y.L.; writing—original draft preparation, R.D.; writing—review and editing, C.C.; visualization, C.C., R.D. and B.X.; supervision, C.C. and M.X.; project administration, C.C.; funding acquisition, M.X. All authors have read and agreed to the published version of the manuscript.
Funding
This study was supported by the National Science Foundation of China, grant 41971394, as well as the Forest and Grass Science and Technology Innovation Development and Research Project of the State Forestry and Grassland Administration of China, grant 2020132108.
Institutional Review Board Statement
Not applicable.
Informed Consent Statement
Not applicable.
Data Availability Statement
No new data were created or analyzed in this study. Data sharing is not applicable to this study.
Conflicts of Interest
The authors declare no conflict of interest. The funders had no role in the design of the study; in the collection, analyses, or interpretation of data; in the writing of the manuscript, or in the decision to publish the results.
References
- Dai, Z.; Hu, Y.; Zhao, G. The Suitability of Different Nighttime Light Data for GDP Estimation at Different Spatial Scales and Regional Levels. Sustainability 2017, 9, 305. [Google Scholar] [CrossRef]
- Dubey, A.; Bedekar, S.; Jain, V.; Srivastav, V. Exploring Nighttime Light Data for Forecasting GDP Ver. 1.0; Reserve Bank Information Technology Pvt. Ltd.: Maharashtra, India, 2019; Available online: https://pub.rebit.org.in/inline-files/Exploring%20NightLight%20Data%20for%20Forecasting%20GDP_0.pdf (accessed on 1 April 2023).
- Ghosh, T.; Powell, R.; Elvidge, C.D.; Baugh, K.E.; Sutton, P.C.; Anderson, S. Shedding light on the global distribution of economic activity. Open Geogr. J. 2010, 3, 148–161. [Google Scholar]
- Owyang, M.; Shell, H. China’s Economic Data: An Accurate Reflection, or Just Smoke and Mirrors? Reg. Econ. 2017, 25, 6–12. Available online: https://econpapers.repec.org/article/fipfedlre/00144.htm (accessed on 1 April 2023).
- Yu, B.; Shi, K.; Hu, Y.; Huang, C.; Chen, Z.; Wu, J. Poverty Evaluation Using NPP-VIIRS Nighttime Light Composite Data at the County Level in China. IEEE J. Sel. Top. Appl. Earth Obs. Remote Sens. 2015, 8, 1217–1229. [Google Scholar] [CrossRef]
- Zhao, M.; Zhou, Y.; Li, X.; Cao, W.; He, C.; Yu, B.; Elvidge, C.D.; Cheng, W. Applications of Satellite Remote Sensing of Nighttime Light Observations: Advances, Challenges, and Perspectives. Remote Sens. 2019, 11, 1971. [Google Scholar] [CrossRef]
- Zhu, X.; Ma, M.; Yang, H.; Ge, W. Modeling the Spatiotemporal Dynamics of Gross Domestic Product in China Using Extended Temporal Coverage Nighttime Light Data. Remote Sens. 2017, 9, 626. [Google Scholar] [CrossRef]
- Zhao, M.; Zhou, Y.; Li, X.; Cheng, W.; Zhou, C.; Ma, T.; Li, M.; Huang, K. Mapping urban dynamics (1992–2018) in Southeast Asia using consistent nighttime light data from DMSP and VIIRS. Remote Sens. Environ. 2020, 248, 111980. [Google Scholar] [CrossRef]
- Xu, P.; Lin, M.; Jin, P. Spatio-temporal Dynamics of Urbanization in China Using DMSP/OLS Nighttime Light Data from 1992–2013. Chin. Geogr. Sci. 2021, 31, 70–80. [Google Scholar] [CrossRef]
- Giannetti, B.F.; Agostinho, F.; Almeida, C.M.V.B.; Huisingh, D. A review of limitations of GDP and alternative indices to monitor human wellbeing and to manage eco-system functionality. J. Clean. Prod. 2015, 87, 11–25. [Google Scholar] [CrossRef]
- Liu, Y.; Wang, Y.; Peng, J.; Du, Y.; Liu, X.; Li, S.; Zhang, D. Correlations between Urbanization and Vegetation Degradation across the World’s Metropolises Using DMSP/OLS Nighttime Light Data. Remote Sens. 2015, 7, 2067–2088. [Google Scholar] [CrossRef]
- Ou, J.; Liu, X.; Li, X.; Li, M.; Li, W. Evaluation of NPP-VIIRS Nighttime Light Data for Mapping Global Fossil Fuel Combustion CO2 Emissions: A Comparison with DMSP-OLS Nighttime Light Data. PLoS ONE 2015, 10, e0138310. [Google Scholar] [CrossRef] [PubMed]
- Watanabe, C.; Tou, Y.; Neittaanmäki, P. A new paradox of the digital economy-Structural sources of the limitation of GDP statistics. Technol. Soc. 2018, 55, 9–23. [Google Scholar] [CrossRef]
- Chen, D.; Zhang, Y.; Yao, Y.; Hong, Y.; Guan, Q.; Tu, W. Exploring the spatial differentiation of urbanization on two sides of the Hu Huanyong Line -- based on nighttime light data and cellular automata. Appl. Geogr. 2019, 112, 102081. [Google Scholar] [CrossRef]
- Li, Y.; Ye, H.; Gao, X.; Sun, D.; Li, Z.; Zhang, N.; Leng, X.; Meng, D.; Zheng, J. Spatiotemporal Patterns of Urbanization in the Three Most Developed Urban Agglomerations in China Based on Continuous Nighttime Light Data (2000–2018). Remote Sens. 2021, 13, 2245. [Google Scholar] [CrossRef]
- Xiao, P.; Wang, X.; Feng, X.; Zhang, X.; Yang, Y. Detecting China’s Urban Expansion Over the Past Three Decades Using Nighttime Light Data. IEEE J. Sel. Top. Appl. Earth Obs. Remote Sens. 2014, 7, 4095–4106. [Google Scholar] [CrossRef]
- Fetzer, T.; Pardo, O.; Shanghavi, A. More than an urban legend: The short- and long-run effects of unplanned fertility shocks. J. Popul. Econ. 2018, 31, 1125–1176. [Google Scholar] [CrossRef]
- Jiang, W.; He, G.; Long, T.; Liu, H. Ongoing Conflict Makes Yemen Dark: From the Perspective of Nighttime Light. Remote Sens. 2017, 9, 798. [Google Scholar] [CrossRef]
- Ma, L.; Wu, J.; Li, W.; Peng, J.; Liu, H. Evaluating Saturation Correction Methods for DMSP/OLS Nighttime Light Data: A Case Study from China’s Cities. Remote Sens. 2014, 6, 9853–9872. [Google Scholar] [CrossRef]
- Chen, J.; Gao, M.; Cheng, S.; Liu, X.; Hou, W.; Song, M.; Li, D.; Fan, W. China’s city-level carbon emissions during 1992–2017 based on the inter-calibration of nighttime light data. Sci. Rep. 2021, 11, 3323. [Google Scholar] [CrossRef]
- Chaisse, J.; Matsushita, M. ‘China’s ‘Belt and Road’ Initiative: Mapping the World Trade Normative and Strategic Implications’. J. World Trade 2018, 52, 163–186. [Google Scholar] [CrossRef]
- Andersson, M.; Hall, O.; Archila, M.F. How Data-Poor Countries Remain Data Poor: Underestimation of Human Settlements in Burkina Faso as Observed from Nighttime Light Data. ISPRS Int. J. Geo-Inf. 2019, 8, 498. [Google Scholar] [CrossRef]
- Chen, Z.; Yu, B.; Yang, C.; Zhou, Y.; Yao, S.; Qian, X.; Wang, C.; Wu, B.; Wu, J. An extended time series (2000–2018) of global NPP-VIIRS-like nighttime light data from a cross-sensor calibration. Earth Syst. Sci. Data 2021, 13, 889–906. [Google Scholar] [CrossRef]
| Disclaimer/Publisher’s Note: The statements, opinions and data contained in all publications are solely those of the individual author(s) and contributor(s) and not of MDPI and/or the editor(s). MDPI and/or the editor(s) disclaim responsibility for any injury to people or property resulting from any ideas, methods, instructions or products referred to in the content. |
© 2023 by the authors. Licensee MDPI, Basel, Switzerland. This article is an open access article distributed under the terms and conditions of the Creative Commons Attribution (CC BY) license (https://creativecommons.org/licenses/by/4.0/).


