Article

Enhancement of System and Environmental Performance of High Solids Anaerobic Digestion of Lignocellulosic Banana Waste by Biochar Addition

Department of Civil & Environmental Engineering, University of South Florida, Tampa, FL 33620, USA
*
Author to whom correspondence should be addressed.
Sustainability 2023, 15(8), 6832; https://doi.org/10.3390/su15086832
Submission received: 11 March 2023 / Revised: 12 April 2023 / Accepted: 14 April 2023 / Published: 18 April 2023
(This article belongs to the Collection Organic Waste Management)

Abstract

:
Banana waste, a lignocellulosic waste material, is generated in large quantities around the world. High Solids Anaerobic Digestion (HS-AD) of lignocellulosic waste can recover energy and reduce its environmental impacts. However, high carbon/nitrogen ratios and low water content in HS-AD can potentially cause system acidification and/or failure. This study investigated the addition of biochar to enhance the performance of HS-AD of mixed banana waste (peel, stem, and leaf). Biochemical methane potential assays with varying biochar dosages (2.5–30%) showed that 10% biochar addition increased methane yields by 7% compared with unamended controls. Semi-continuous HS-AD studies, without and with 10% biochar addition, were conducted at varying solids retention times (42, 35, and 28 days) for long-term performance evaluation. Biochar addition reduced volatile fatty acid accumulation, improved system stability, and increased methane production by 20–47%. The nutrient content of digestate from HS-AD of banana waste indicated its potential use as a bio-fertilizer. Life cycle assessment results showed that biochar addition to HS-AD resulted in greater environmental benefits in most categories compared with the unamended control, including eutrophication, ecotoxicity, and fossil fuel depletion when biochar was available within a radius of 8830 km.

1. Introduction

Lignocellulosic waste materials are promising feedstocks for renewable energy production. Banana waste, including peels, leaves, pseudo-stems, and stalks, is a typical lignocellulosic waste. Banana leaf contains 16.5% lignin, 22.4% hemicellulose, 39.2% cellulose, and 5.2% ash [1], while the main organic components of banana stem are 30.08% cellulose, 27.79% hemicellulose, and 6.08% lignin [2], and banana peel contains 83.0% carbohydrate and 16.9% lignin [3]. It is estimated that 288 million tons of banana waste are produced worldwide annually [4]. However, in many regions, banana waste is discarded directly into nearby rivers, ponds, or low-lying areas. Degradation of banana waste emits greenhouse gases, produces odors, and spreads mosquitoes and pathogens [5]. In addition, leachate percolating through banana waste dump sites has high organic matter and nutrient concentrations, leading to serious contamination of water bodies.
Anaerobic Digestion (AD) is a cost-effective energy-recovery technology, which can reduce environmental pollution and generate economic benefits. Previous studies showed that methane yields were 227–294 L/kg Volatile Solids (VS) for banana peel and 188–334 L/kg VS for banana stem [5,6]. Based on Total Solid (TS) content, AD can be classified as low solids (LS-AD, <15% TS) and high solids (HS-AD, >15% TS) [7]. HS-AD is an attractive alternative for bioenergy recovery from lignocellulosic waste materials, because it has lower reactor volume and water requirements, reduced leachate generation, and enhanced pathogen removal than LS-AD [8]. However, the relatively low moisture content in HS-AD systems results in a greater risk of Volatile Fatty Acid (VFA) accumulation due to its low dilution, insufficient mixing, and poor mass transfer conditions, which inhibits methanogenic activity. A prior study found that increasing TS content from 2% to 16% decreased methane yields [6]. In addition, banana waste has a relatively high C/N ratio: 26–39 for peel [9,10], 29–40 for leaf [11,12], and 27–78 for stem [13,14]. This is higher than the optimal C/N value of 25 for AD [15]. A high C/N can result in VFA accumulation and system acidification, especially in HS-AD systems.
Adding low-cost adsorbent materials, such as biochar, to HS-AD of lignocellulosic banana waste has the potential to prevent microbial inhibition and enhance system stability. Biochar is a byproduct of pyrolysis of organic feedstocks, such as agricultural residuals, at high temperature under oxygen limited conditions. Biochar has a high surface area, porous structure, and active surface functional groups. Previous studies showed that applying biochar to LS-AD systems improved pH buffering capacity by adsorbing VFAs and providing attachment surfaces for microbes, which enhanced methane yields [16]. Direct Interspecies Electron Transfer (DIET) is another pathway that may be enhanced by biochar addition. During DIET, microorganisms attached to the biochar surface capture electrons to form the final products of methane and carbon dioxide (CO2), without intermediate product formation and consumption, resulting in a faster and energetically favorable methanogenesis process [17]. Previous studies showed that biochar addition to LS-AD of food waste and sewage sludge increased methane yield by 33% through DIET [18].
Life Cycle Assessment (LCA) is a well-established methodology for evaluating the environmental impacts of a process. LCA has been previously applied to assess the environmental impacts of lignocellulosic biomass utilization, AD processes, and integration of AD and biochar pyrolysis [19,20]. For example, Li and Feng [21] pyrolyzed AD digestate to produce biochar for land use and bio-oil/syngas for heating AD reactors. They found that integrating AD and pyrolysis had a higher environmental burden than AD alone, but lower than pyrolysis only. However, few LCA studies have been conducted to investigate the environmental trade-offs of AD with or without biochar, particularly for HS-AD of lignocellulosic waste.
Although AD of banana waste for methane production has been previously investigated, prior studies were mainly short-term experiments of approximately 1 to 3 months [6,22], and the reported results were for separated banana waste. Studies of long-term methane production potential from mixed banana waste with different organic compound compositions are still limited. In addition, although biochar addition to LS-AD reactors has been evaluated to improve system performance, few studies investigated the effects of biochar addition on HS-AD system performance, especially for mixed lignocellulosic waste. To fully understand the potential influences of biochar addition on long-term (~1 year) system performance and environmental impacts of HS-AD of mixed lignocellulosic banana waste, both experimental studies and LCA were conducted, with the aim of providing a reliable reference for design and operation of full-scale biochar-amended HS-AD of lignocellulosic waste. Specific objectives were to investigate: (1) biochar dosages on methane yields; (2) long-term HS-AD system performance with and without biochar addition, in terms of methane yield, digestate quality, and system stability; (3) biochar addition on environmental impacts of HS-AD through LCA.

2. Materials and Methods

2.1. Substrate, Inoculum, and Biochar Preparation

Banana waste, including peel, stem, and leaf, was obtained from a residential home in Tampa, FL, USA. Banana waste was cut manually to a particle size of ~6 × 6 mm, air-dried at 37 °C in a constant temperature room to achieve TS of ~20%, and stored at 4 °C before use. The inoculum used in this study was dewatered effluent sludge from a mesophilic LS-AD system at the Northeast Water Reclamation Facility in Clearwater, FL, USA. Biochar used in this study was a commercially available product obtained from Biochar Supreme Inc. (Everson, WA, USA). It was produced from soft wood waste (chipped Douglas Fir) using updraft gasification at 480–540 °C and a residence time less than 20 s. Biochar was washed with Deionized Water (DI) and dried before use. Characteristics of banana waste, dewatered sludge, and biochar are shown in Table A1.

2.2. Batch High Solids Anaerobic Digestion Experiments

Three sets of high solids batch Biochemical Methane Potential (BMP) assays modified from conventional low solids BMP design [23] were carried out to investigate biochar addition on methane production (Table A2). The first set was a long-term (345 days) biochar control assay (no chemical analysis) to evaluate the methane production potential of biochar itself. Most prior studies assumed that the organic substrates in biochar were persistent and unavailable [24,25]. This study aimed to confirm the non-bioavailability of organic carbon in biochar. In this first assay, two BMP reactors (inoculum only, inoculum + 10% biochar) were set up. The second set of BMP assays was used to investigate biochar dosage on methane production from banana waste. Biochar dosages of 10% and 30% were chosen based on our preliminary VFA adsorption test (Figure A1). Banana peel, stem, and leaf were mixed at a ratio of 1:1:1 [by dry mass] as the substrate. Inoculum was added to the mixed banana waste at a Substrate/Inoculum (S/I) ratio of 1:1 by VS. Three BMP reactors (without biochar addition as control, 10% biochar addition, 30% biochar addition [by dry mass]) were set up for methane production. Blank reactors containing only inoculum were used to correct for methane produced from the inoculum. Based on the results from second set of BMP assays (Section 3.1.1), the optimal biochar addition dosage was 10%. To evaluate the effects of lower biochar dosage on methane production, a third set of BMP assays with lower biochar dosages of 2.5–10% was conducted to further identify the best biochar dosage.
Each BMP reactor consisted of six replicates, with duplicate bottles sacrificed on Day 7, Day 21, and the final day. All BMP reactors were set up in 250 mL glass serum bottles. A mixture of oyster shell and sodium bicarbonate at the ratio of 3:2 with alkalinity of 3 g CaCO3 was added to each reactor as an alkalinity supplement [26]. DI water was added as needed to adjust the mixture TS content to 20%. All reactors were purged with nitrogen gas and sealed with silicon septa and aluminum crimp caps to create anaerobic conditions. All reactors were incubated in a constant temperature room at 35 °C.

2.3. Semi-Continuous High Solids Anaerobic Digestion Experiments

Two identical 3.5 L HS-AD reactors were constructed from plastic buckets with screw-on lids to evaluate long-term system performance (Figure A2). Each reactor was connected to a 1 L SKC gas bag (Eighty Four, PA, USA) for methane content measurement and a wet-tip gas meter (Nashville, TN, USA) for recording biogas flow rate. The reactors were initially seeded with dewatered AD effluent sludge from the Northeast Water Reclamation Facility and fed with banana waste (peel: stem: leaf = 1:1:1 by dry mass). The reactors contained a total mixture mass of approximately 1800 g at a TS content of 20%. Biochar (10%, by dry mass) was added to one reactor to investigate biochar addition on methane production and digestate quality. As poor methane yields were observed in the preliminary semi-continuous experiments (Figure A3 and Figure A4), NH4Cl was added to both reactors as a nitrogen source to maintain a beneficial ammonia concentration of around 200 mg/L [27]. A micro-nutrient solution was added at a ratio of 1 mL/kg total wet weight to enhance methane production [28]. The stock micro-nutrient solution contained FeCl2·6H2O (10 g/L), CoCl2·6H2O (4 g/L), Na2MO4·2H2O (0.5 g/L), Ni (NO3)2·6H2O (5 g/L), Na2SeO3·5H2O (0.7 g/L), ZnSO4·7H2O (0.9 g/L), CuCl2·2H2O (0.3 g/L), MnCl2·4H2O (2 g/L), and H3BO3 (0.05 g/L). Both reactors were operated at varying Solids Retention Times (SRTs) (42 d, 35 d, and 28 d) at 35 °C for 12 months with organic loading rates of 3.5, 4.1, and 5.1 kg VS/m3/d, respectively. A specific amount of digestate was wasted weekly to maintain the target SRT and the wasted digestate was used for chemical analysis bi-weekly.

2.4. Analytical Methods

For BMP assays, biogas volume was measured periodically until its production was negligible. Biogas volume in batch BMP assays was measured using a frictionless syringe (Cadence, Inc., Staunton, VA, USA). The methane content of the biogas in BMP assays was determined by injecting 4 mL of biogas sample into an alkaline solution (3M NaOH) and measuring the resulting liquid displacement. Biogas volume in semi-continuous experiments was recorded daily using wet-tip gas meters (Nashville, TN, USA), and methane content was measured every two days using a Gow Mac series 550 gas chromatograph (Bethlehem, PA, USA) with a thermal conductivity detector and 10-foot, Q 80/100, 1/8-inch stainless steel packed column. The injection, detection, and column temperatures were set up at 100 °C, 100 °C, and 60 °C, respectively. High purity helium gas (Airgas, Inc., Radnor, PA, USA) was used as the carrier gas at a flow rate of 40 mL/min. All gas volumes were converted to standard conditions (0 °C and 1 atm).
Digestate from semi-continuous reactors was centrifuged and filtered through 0.45 µm glass fiber filter paper for bi-weekly chemical analysis. The pH was measured using an Orion 5 Star Multifunction Meter (Thermo Scientific, Waltham, MA, USA). Total Ammonia Nitrogen (TAN) was measured using a Timberline TL-2800 Ammonia Analyzer (Timberline Instrument, Boulder, CO, USA). Soluble COD (sCOD) was measured using Lovibond MR test kits (0–1500 mg/L) (Tintometer Inc, Sarasota, FL, USA). VFA was measured using Hach TNT plus 872 test kits (5–2500 mg/L). Standard Methods [29] were used to measure alkalinity (2320B), TS and VS (2540).
For digestate quality analysis, digestates from both reactors were collected at the end of each SRT condition and oven dried (100 °C). A 1% (mass/volume) suspension of dried digestate was prepared by adding DI and shaking at 100 rpm for 2 h to measure pH. Total nitrogen, phosphorus, and potassium content in the digestate was analyzed at the University of Florida (UF), Institute of Food and Agricultural Sciences (IFAS) Analytical Services Laboratories. Cation Exchange Capacity (CEC) of dried digestate was measured using the Ammonium Acetate Method [30]. Water Holding Capacity (WHC) was measured based on Werner, et al. [31].
Statistical significance was determined using GraphPad Prism software. Analysis of Variance (ANOVA) was used for three group comparison (BMP studies): One-Way nonparametric paired test (Friedman test) was carried out for comparing methane yields and Two-Way ANOVA of Dunnett multiple comparison test with assumption of equal variability of differences was used for comparing chemical parameters. T-Test was used for two group comparison (semi-continuous study): Nonparametric paired test (Wilcoxon matched-pairs signed rank test) was used for comparing weekly methane yields and parametric test assuming gaussian distribution and equal variance was used for chemical parameters.

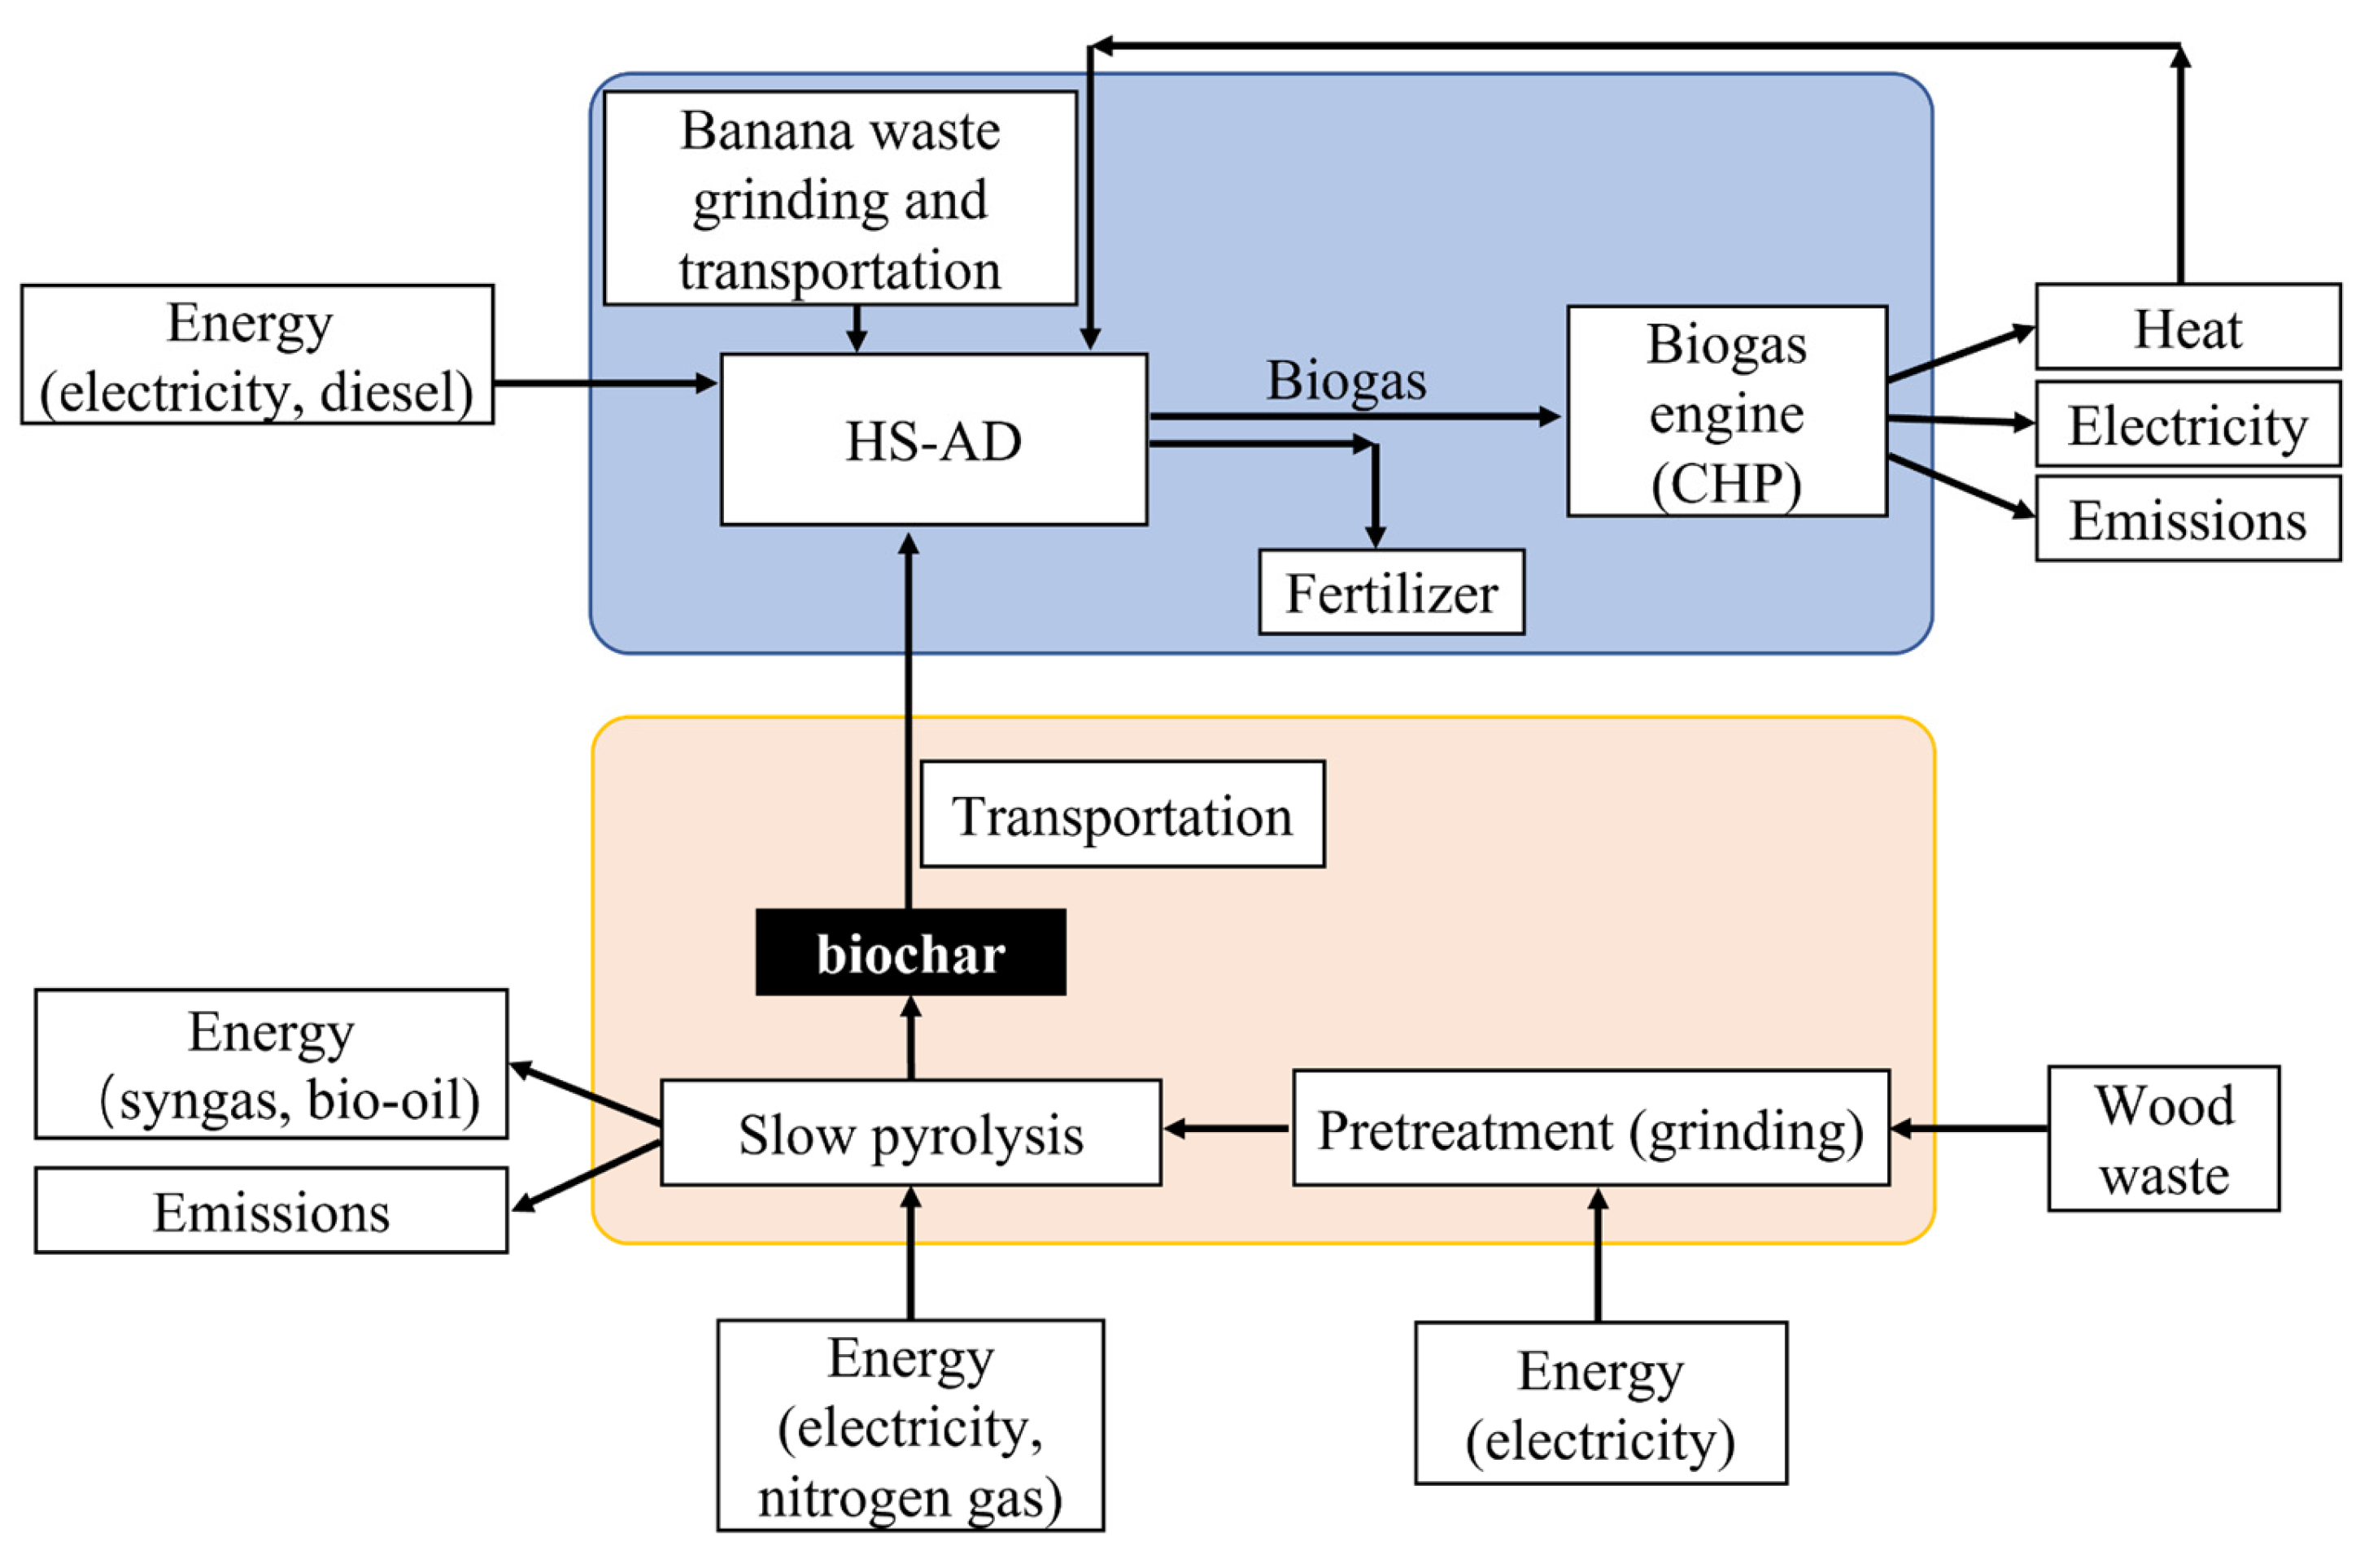
2.5. Life Cycle Assessment

2.5.1. Goal and System Boundary

The goal of the LCA study was to compare the environmental impacts of HS-AD of banana waste without and with biochar. Decentralized HS-AD reactors were proposed to be constructed near banana farms for onsite treatment and resource recovery from banana waste. The system boundary included banana waste grinding and transportation to HS-AD reactors, HS-AD process, digestate utilization, and biochar production and transportation (Figure 1). Construction and demolition of the AD system were not included. The functional unit was 1 ton of dried banana waste with a TS content of approximately 20%. Detailed process flow diagrams are shown in Figure A5. For the analysis, SimaPro PhD software (version 9.0), the Ecoinvent 3.2 database, and Tool for the Reduction and Assessment of Chemicals and other environmental Impacts (TRACI 2.1 v1.07) impact method by US EPA were used. For impact assessment indicators, global warming and fossil fuel depletion potentials are strongly influenced by biochar production due to biochar’s excellent carbon sequestration ability and renewable energy generation. Eutrophication and ecotoxicity potentials are related to the performance of HS-AD coupled with a combined heat and power (CHP) unit for electricity and fertilizer production. Hence, global warming potential, eutrophication, ecotoxicity, and fossil fuel depletion were considered as the major impact categories.

2.5.2. LCA Inventory

Experimental data from the semi-continuous reactors operated at an SRT of 35d were adopted, including methane yield and digestate nutrient content. Data from other literature sources were also used, as summarized in Table A3. Banana waste was assumed to be sun-dried to a TS content of around 20%. Electricity consumption for banana waste grinding was calculated from the average motor power capacity of agricultural grinders. The electricity required for transporting banana waste to onsite HS-AD reactors was calculated based on the average area of banana farms and the typical speed and horsepower of a medium size bulldozer. The produced biogas was used to generate electricity and heat in a CHP unit. The electricity and heat generation efficiencies were assumed as 39% and 46% of the methane lower heating value (37 MJ/m³), respectively, which are the typical efficiencies reported in previous studies [32]. The heat from the CHP unit was used to maintain the HS-AD reactors at a constant temperature (35 °C) and the excess heat was directly released without further use. The emission factors from the CHP unit were adopted from a prior study [33]. The digestate was used as bio-fertilizer and directly spread on the soils for enhancing banana growth. An average energy consumption of 22.7 MJ diesel/ton digestate was used for spreading the digestate [34]. For biochar production, wood waste collection and transportation were not included. Air emissions from construction of pyrolysis plant was assumed as 0.22 ton CO2/ton of dry feedstock [35]. A pyrolysis temperature of 500 °C and heating residence time of 1 h were used for biochar production [36]. The pyrolysis yields of biochar, syngas, and bio-oil were assumed to be 35%, 30%, and 35%, respectively, which is the typical yield distribution of slow pyrolysis (temperature of 350–700 °C, heating rate of 1–100 °C/s, and residence time from minutes to hours) [36,37]. The energy consumption and pyrolysis emissions were based on previous studies [35,36,38,39]. For biochar transportation, a diesel truck with a loading capacity of 50,000 lb (22.68 ton) and fuel efficiency of 5.5 mpg (2.3 km/L) [40] was considered. The biochar transportation distances were varied to determine the threshold of beneficial effects of biochar addition on environmental impact.

3. Results and Discussion

3.1. Batch High Solids Anaerobic Digestion Experiments

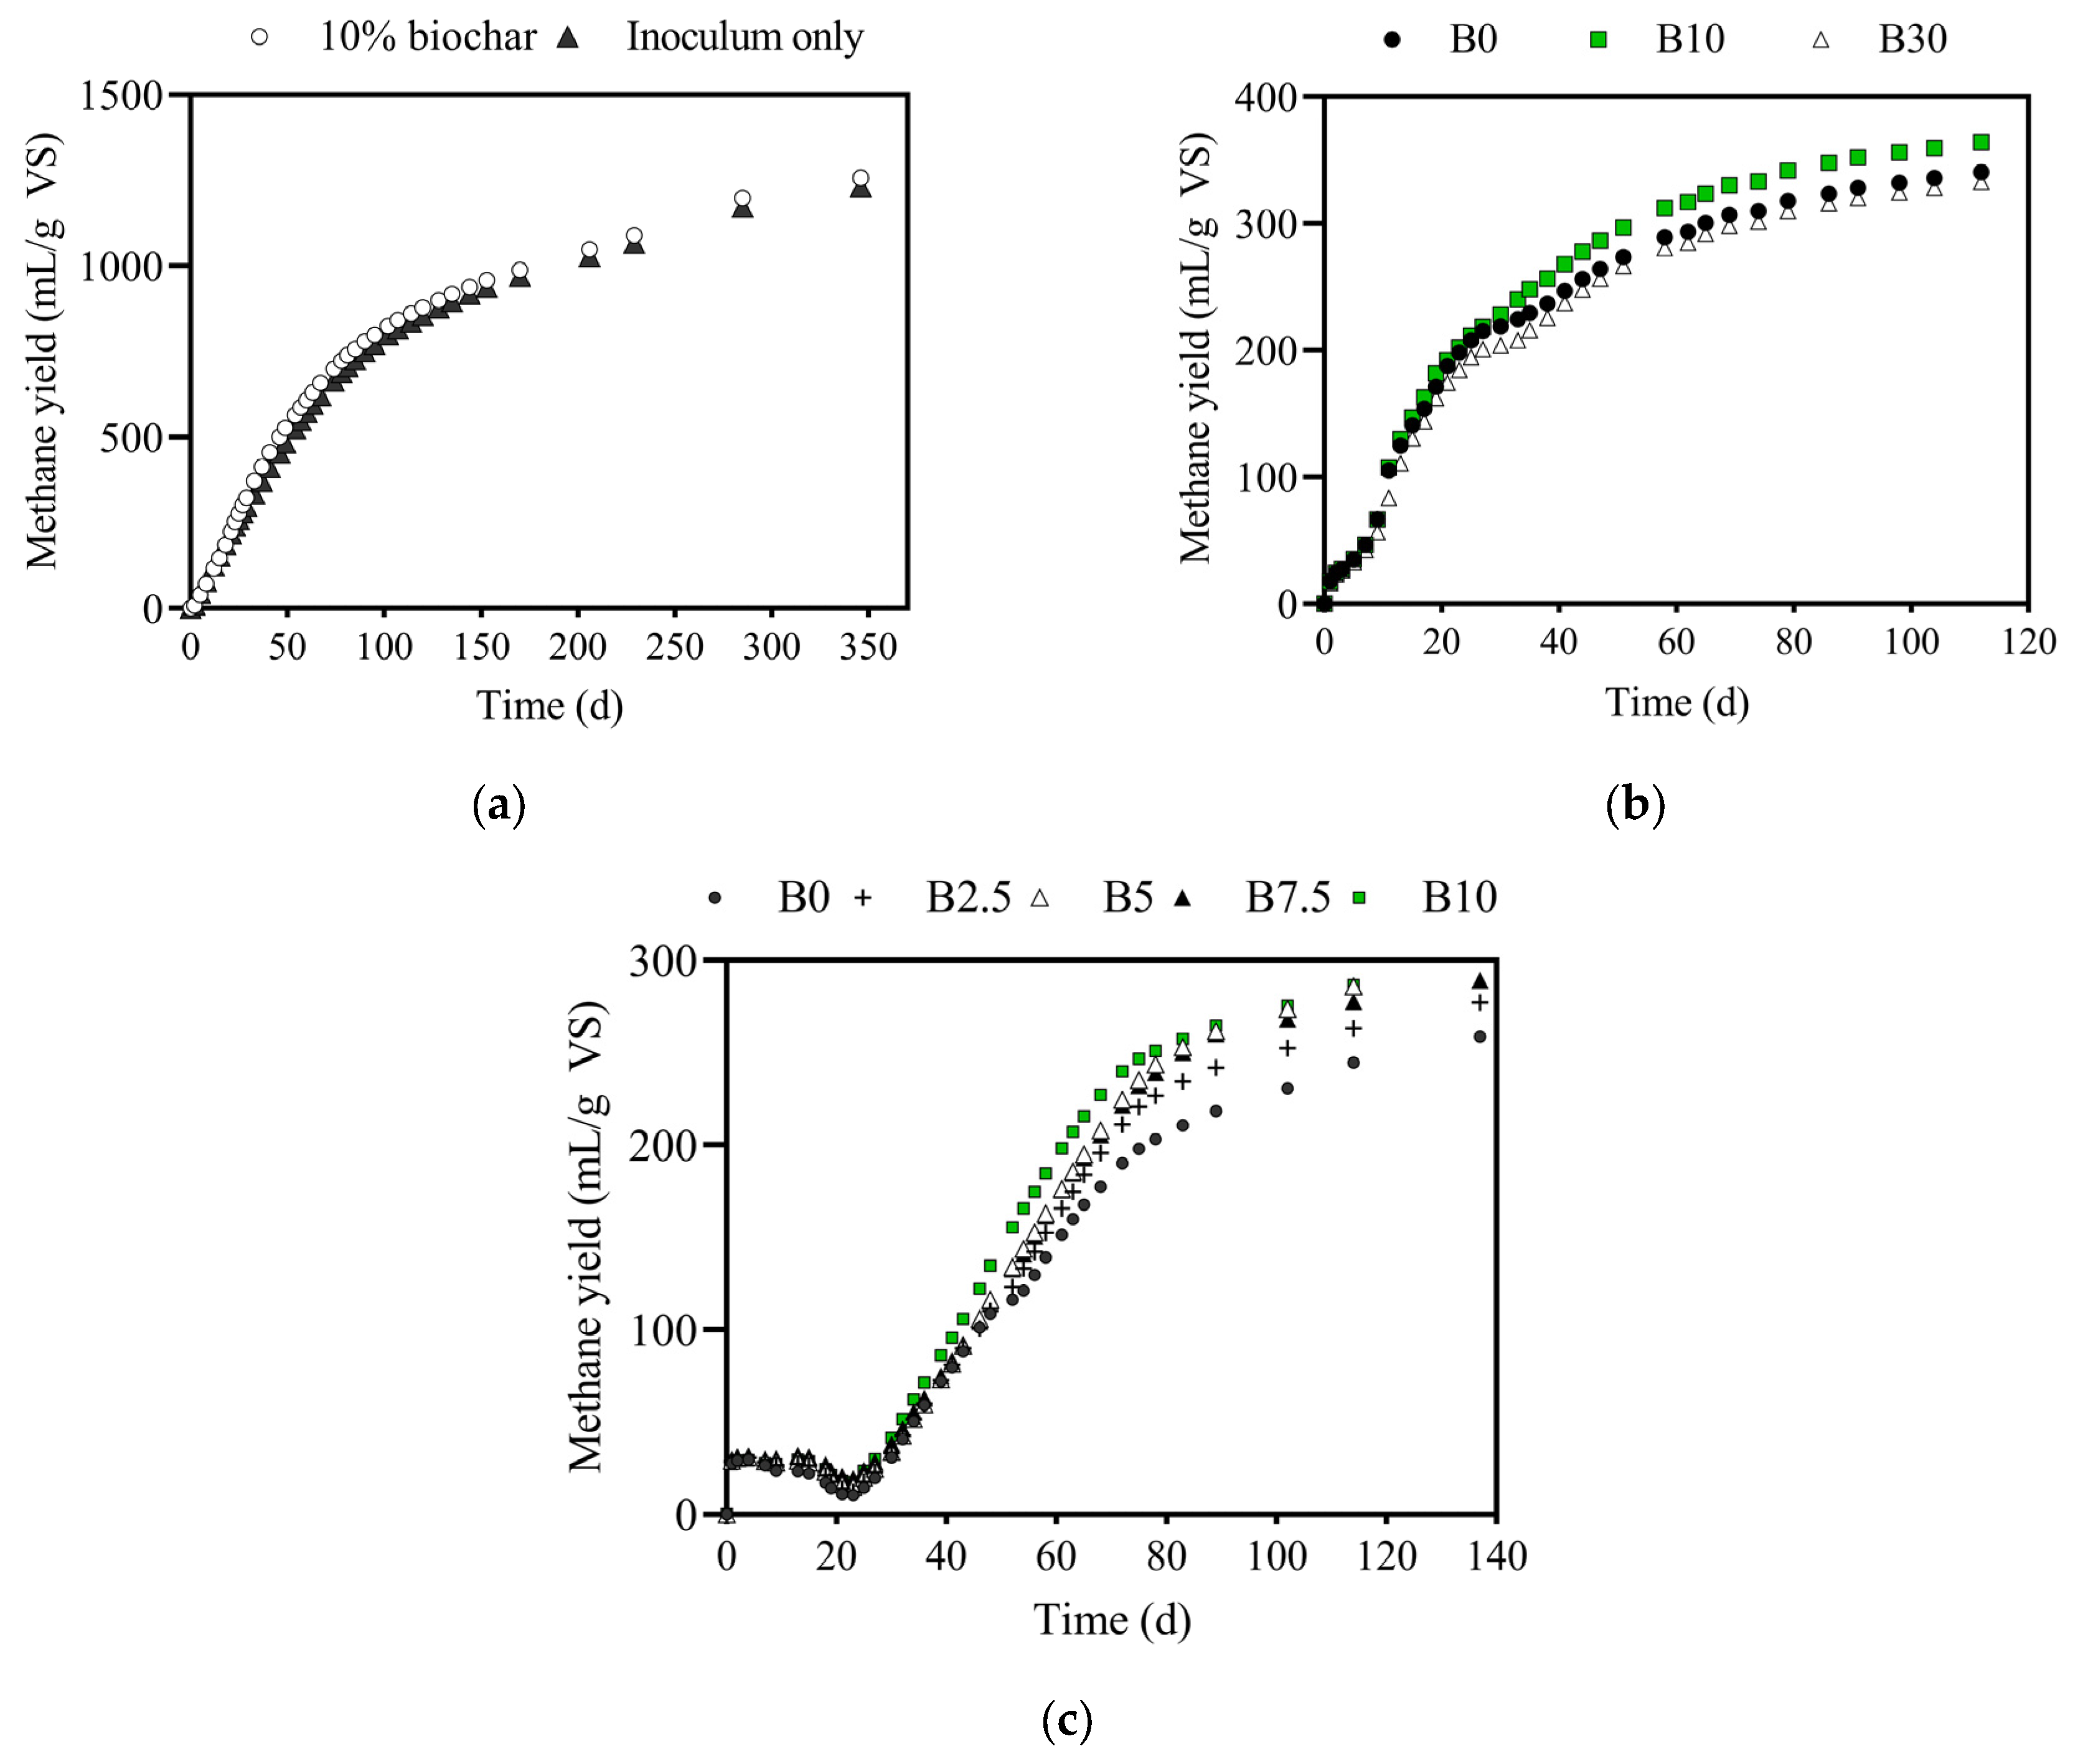
3.1.1. Methane Production from Biochar

As shown in Figure 2a, biochar addition to the inoculum did not significantly increase the cumulative methane production compared with inoculum only (p > 0.05), indicating that biochar is not bioavailable for methane production. Previous research reported that the carbon in biochar can persist for thousands of years due to its high carbonization [24]. Hence, in subsequent experiments, biochar was considered only as an adsorbent or biofilm carrier instead of a carbon source for methanogenesis.

3.1.2. Methane Production with Varying Biochar Dosages

As shown in Figure 2b, the cumulative methane yields were 340 ± 7, 364 ± 1, and 333 ± 10 mL CH4/g VS for B0, B10, and B30, respectively. Addition of 10% (~21 g/L) biochar increased methane yield by 7% (p < 0.5), which was higher than the methane yields reported in previous studies. For example, Gunaseelan [22] found that banana peel produced a methane yield of 243–322 mL/g VS during LS-AD. Previous studies showed that LS-AD of banana leaf and stem achieved methane yields of 46–56 mL/g VS [41,42] and 146 to 347 mL/g VS [2,43], respectively. Jokhio, et al. [44] found that batch LS-AD of mixed banana waste (stem and leaf) achieved a methane yield of 48 mL/g VS. Zhang, et al. [45] reported that the methane yield of HS-AD of banana stem was 232 mL/g VS. However, 30% biochar addition (~62 g/L) had a negative impact on methane yield (p < 0.5) likely due to VFA over-sequestration, which limited its availability for methanogenesis. Zhang, et al. [46] also reported that increasing the dosage of corn-straw derived biochar from 6.2 to 26.1 g/L increased methane production. However, further increase in biochar dosage to 34.2 g/L decreased methane production.
Chemical parameter changes during AD are shown in Table 1. pH and VFA/alkalinity ratios (VFA/ALK) are essential indicators of AD stability. The optimal pH for AD is 6.5–8.0 [47]. A VFA/ALK above 0.8 indicates system instability caused by acidification [48]. As shown in Table 1, pH of all reactors decreased on Day 7, with an increase in VFA/ALK, especially for B0 (>0.8), which was due to the rapid hydrolysis of banana waste during the start-up period. Biochar addition (B10 and B30) significantly decreased VFA/ALK compared with B0, especially on Day 7 (p < 0.05). The VFA concentration in B0 was 13,608 ± 679 mg/L on Day 7, which is higher than the inhibitory level of 10,000 mg/L [49]. Both 10% or 30% of biochar addition reduced VFA concentration to 8106 ± 344 mg/L and 7119 ± 176 mg/L, respectively, which reduced VFA inhibition to methanogens. However, it is possible that biochar over-addition in B30 reduced VFA concentrations and limited substrate availability to methanogens over the entire AD process (Figure 2b).
Ammonia is used as a nitrogen source for cell synthesis and provides part of alkalinity for pH buffering. However, TAN concentrations above 1500–1700 mg/L can cause inhibition to methanogens [49]. As shown in Table 1, TAN concentrations in all BMP reactors were in the range from 500 to 1700 mg/L during the entire AD process, which did not likely cause ammonia inhibition.
Biochar addition, especially B30, significantly reduced initial sCOD concentration on Day 0 (p < 0.05) due to adsorption. Biochar addition increased the final sCOD removals to 74.5% (B10) and 70.9% (B30), compared with B0 (62.4%), which was likely due to the combined effects of biodegradation and adsorption. VS Reduction (VSR) was correlated with methane yields. B10 achieved the highest VSR of 26.5%. Kalia, Sonakya and Raizada [6] found that AD (TS of 16%) of banana stem achieved 55% VSR at 37–40 °C. The lower VSR in this study might be due to the different substrates (mixed banana waste) and inoculum sources.
The cumulatively methane yields with biochar addition (0–10%) is shown in Figure 2c. The addition of 5% (B5), 7.5% (B7.5), and 10% (B10) biochar significantly enhanced methane yields (289–303 mL/g VS) compared with the control (B0) (259 mL/g VS) (p < 0.05). Although the final cumulative methane yields were similar between B5, B7.5, and B10, B10 had the fastest methane production rate (p < 0.05). Therefore, 10% biochar addition was selected for subsequent semi-continuous HS-AD studies.

3.2. Semi-Continuous HS-AD Experiments

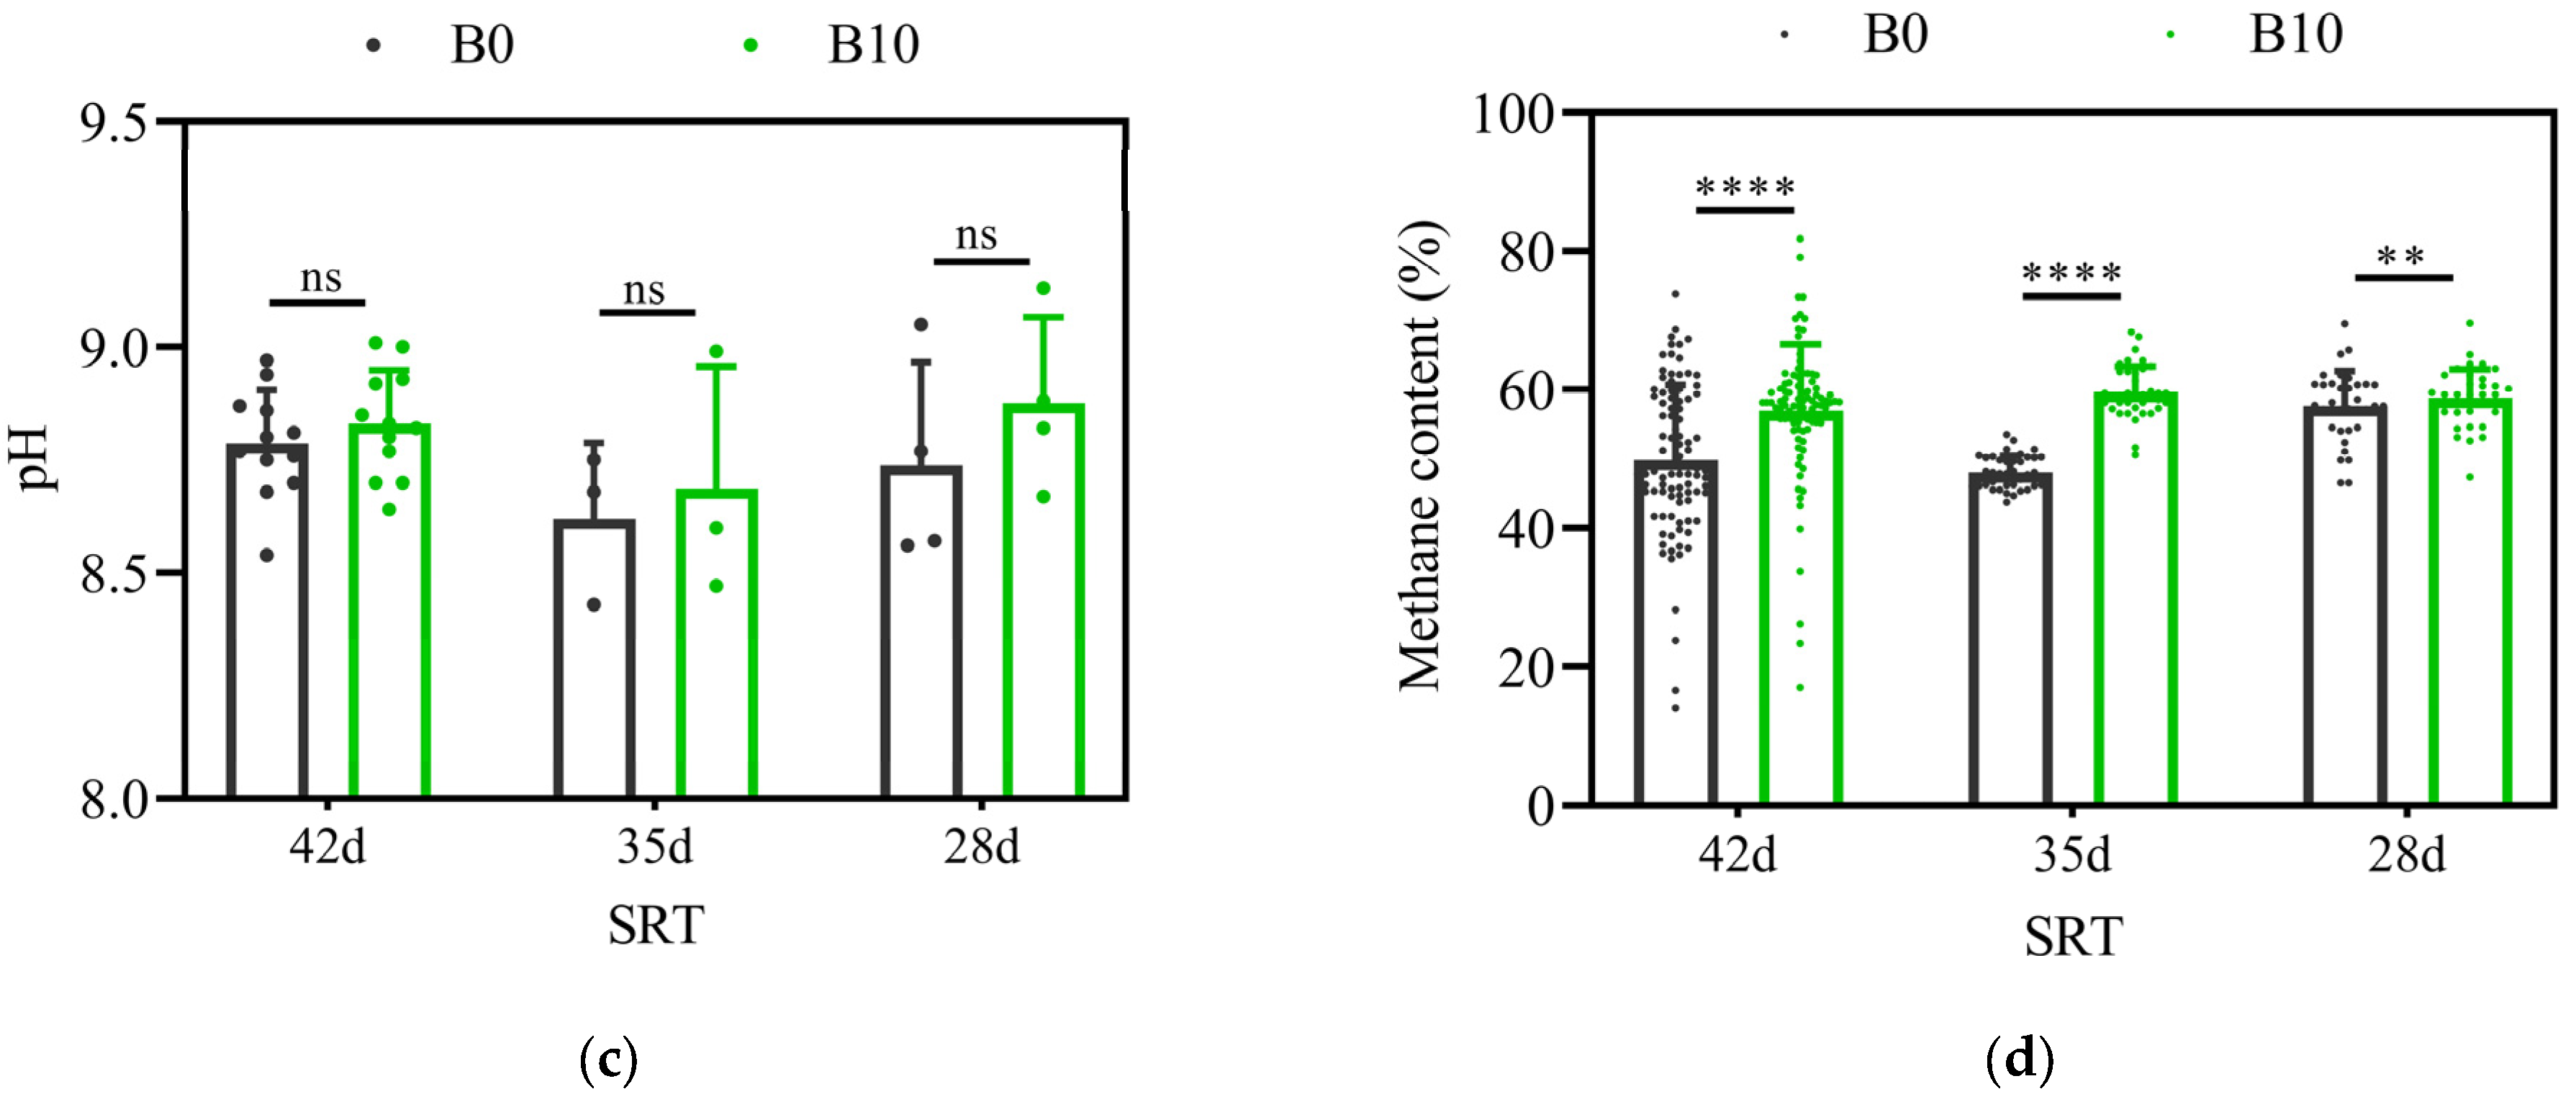
3.2.1. Methane Yield and Chemical Analysis

Biochar addition significantly improved methane yields and system stability by 20–47% (p < 0.05) (Figure 3a). Methane yields of B0 and B10 were 90 ± 26 and 132 ± 20 mL/g VS at a SRT of 42 d, 129 ± 15 and 184 ± 10 mL/g VS at a SRT of 35 d, and 132 ± 10 and 158 ± 11 mL/g VS at a SRT of 28 d. Similar results were found in previous studies showing that 3.75 g/L biochar addition to batch AD of mixed fruits (banana, mango, tomato, and papaya) increased methane yields by 33% compared with the control with a methane yield of ~150 mL/g VS [50]. For B10, when the SRT was decreased from 42 to 35 d, the increased methane yield was likely due to the increased substrate availability, while the decreased yield when SRT was further decreased to 28 d could have been due to the short biomass retention time. A previous study by Kinyua, et al. [51] found that a methane yield of LS-AD (TS of 40.7 g/L) of swine waste increased as the SRT decreased from 42 to 21 d but then decreased when SRT was further decreased to 14 d. The high solids content and lower biodegradability of the lignocellulosic wastes in the AD reactors in this study likely extended the optimal SRT. For B0, methane yields gradually increased with a decreasing SRT, which finally achieved a similar methane yield as that of B10 at a SRT of 42 d. This was likely due to the long-term acclimation of the microbes.
VFA concentrations were 811–1862 mg/L for B0 and 519–1486 mg/L for B10 (Figure 3b). A lower VFA concentration in B10 could have been due to VFA adsorption by biochar [52], which significantly reduced acid stress to methanogens, especially when serious VFA accumulation occurred in the preliminary experiment (Figure A3 and Figure A4). Besides adsorption, as a conductive material, biochar added to B10 potentially promoted DIET to stimulate VFA degradation and enhance methane production [52]. Prior research showed that the Methanosaetaceae family was able to facilitate DIET while attached on biochar surface [53].
The pH of B0 and B10 was 8.3–8.8 (Figure 3c). Previous research showed that alkaline functional groups on the biochar surface, such as ash-inorganic alkalis or organic alkalis, can neutralize protons and partially diminish pH decline and acidification for enhanced methane production [54]. However, no significant differences in pH by biochar addition were observed in this study (p > 0.05). This is in agreement with the results reported by prior studies [50,55]. As shown in Figure 3d, methane contents of B0 biogas were 50–58% and biochar addition significantly increased methane content by 2–24%. A prior study showed that biochar can adsorb CO2 from biogas resulting in increased methane content [56]. The higher CO2 content in B0 biogas may also decrease system pH and contribute to acidification. Yang [52] found that biochar potentially provided a biofilm attachment surface for a greater abundance of acetrotrophic methanogens in B10 for increased methane content and yield. Methanogens (Methanosarcina and Methanosaeta) were found to be more abundant in a biochar-amended reactor than the control in previous studies [16].

3.2.2. Digestate Quality

AD digestate is usually used as soil amendment. The quality of the two digestates from the semi-continuous reactors is shown in Table 2. An alkaline pH of 10.7–10.9 was observed for both digestates (p > 0.05), likely due to the formation of ammonium carbonate and the existence of basic cations (such as Ca2+). Hence, the two digestates in this study can potentially be used to neutralize the pH of acidic soils (pH < 6.5) or to grow alkaline soil plants, such as asparagus.
WHC is an important physical index of soil, which refers to the amount of water retained in soils. WHC is controlled mainly by the soil’s pore number/distribution and surface area [57]. Biochar has been shown to effectively retain water in its pores due to its high porosity and irregular shape [58]. Decreasing biochar particle size from the macro- to micro-range can result in more available sites for water adsorption and higher WHC [58]. Previous studies showed that biochar can adsorb 10 times its weight in water and increase soil WHC up to 30% [58]. In this study, B10 digestate showed a slightly higher WHC, especially at a SRT of 42d (4.4 g/g for B10 and 3.8 g/g for B0, p < 0.05), which is likely due to the addition of biochar with high WHC of ~27 g/g [59]. Both digestates had a higher WHC than typical values for soil (0.3–0.5 g/g) [57].
CEC is an indicator of soil nutrient holding capacity. A slightly lower CEC was observed in B10 digestate than B0 digestate, especially at a SRT of 28 d (p < 0.05), which is caused by the addition of biochar with low CEC of 3 cmol/kg. Decreasing the SRT decreased the CEC capacity from 38 to 29 cmol/kg for B0 digestate and 37 to 26 cmol/kg for B10 digestate, which is likely due to insufficient organic matter degradation and high cation concentrations remaining in digestates at the shorter SRT. The CECs of the two digestates in this study were comparable with a bioorganic fertilizer (31.5–36.0 cmol/kg) [60].
Nitrogen, phosphorus, and potassium are primary nutrients in fertilizer. B0 and B10 digestates had similar TN (1.7–2.4%), TP (0.3–0.4%), and TK contents (3.2–4.7%) (p > 0.05). Raw banana waste has been shown to have a TN of ~1.33% (1.05% for peel, 1.65% for leaf, and 1.28% for stem) [2,9,61]. Nitrogen source addition for enhancing methane yield most likely contributed to the additional TN of ~0.74% in the digestate. Overall, decreasing the SRT increased the digestate nutrient contents, which was likely due to lower nutrient utilization at shorter SRT. The ratio of TN:TP:TK of the two digestates was 6:1:12–13. Prior studies showed that a suitable TN:TP:TK ratio for growing bananas is 3–8:1:10 [62,63], indicating that digestates in this study are a promising fertilizer for banana growth. Compared with the bioorganic fertilizer [64], both digestates had a higher TN and TK values and a lower TP value, which is likely due to the low phosphorus content in raw banana waste [61]. However, a comparison of the total nutrient content (5.5–7.3%) of the two digestates to the bioorganic fertilizer (6%) demonstrates their potential to enhance crop growth.
Table 2. Digestate quality.
SRT
(d)
DigestatepHWHC
(g/g)
CEC
(cmol/kg)
Nutrient Content (%)
TNTPTK
42B0 digestate10.7 ± 0.013.8 ± 0.2238 ± 0.81.710.443.73
B10 digestate10.7 ± 0.004.4 ± 0.10 *37 ± 2.21.810.423.23
35B0 digestate10.8 ± 0.004.0 ± 0.0630 ± 0.11.990.294.69
B10 digestate10.7 ± 0.004.3 ± 0.1829 ± 0.62.010.284.32
28B0 digestate10.9 ± 0.003.9 ± 0.1729 ± 1.12.380.314.61
B10 digestate10.8 ± 0.004.0 ± 0.2626 ± 0.3 *2.110.314.69
Bio-fertilizer [64]NANANA1.602.551.90
Note: NA = not applicable, SRT = solids retention time, WHC = water holding capacity, CEC = cation exchange capacity, TN = total nitrogen, TP = total phosphorus, TK = total potassium. Statistical significance was analyzed for comparing B10 with the control (B0). (* p < 0.05).

3.3. Life Cycle Environmental Impacts

Results from the LCA for the two HS-AD scenarios (B0 and B10) are shown in Figure 4. Two biochar transportation cases were considered for B10: (1) no transportation (T = 0 km) case assuming biochar production using potential feedstocks at hand (such as banana waste) or high proximity of biochar manufactures and banana farms; (2) threshold transportation (T = 8830 km) case when environmental impacts overshadowed the benefit associated with biochar amendment. As shown in Figure 4, B0 showed net environmental benefits in all categories while B10 showed net environmental burdens in global warming potential but higher net environmental benefits in eutrophication, ecotoxicity, and fossil fuel depletion categories. Electricity required for banana waste grinding and transportation was the major contributor to the environmental burden for all categories. The environmental benefits were mainly due to electricity and fertilizer produced. Biochar transportation distance mainly affected fossil fuel depletion due to diesel consumption.
For fossil fuel depletion (Figure 4a), the electricity generated by the CHP unit offset the electricity consumed for banana waste grinding and transportation. The recovered fertilizers avoided fossil fuel depletion of ~10.3 MJ surplus/FU. Without considering biochar transportation, biochar addition to B10 brought additional environmental benefits due to the production of syngas and bio-oil during pyrolysis. Syngas and bio-oil are renewable and ecofriendly energy products, which are promising alternatives for replacing fossil fuels. However, B10 did not show net environmental benefits compared with B0 when the biochar transportation distance was longer than 8830 km.
For global warming potential (Figure 4b), electricity consumption resulted in 34.4 kg CO2 eq/FU, likely due to the combustion of fossil fuels for electricity generation. The energy mix for electricity used in this study was 40% natural gas, 19% coal, 20% nuclear and 20% renewables (EIA, 2021). The combustion of coal and natural gas can emit approximately 1.15 tons of CO2 per MWh electricity generated and 0.75 tons of CO2 per MWh, respectively [65]. Air emissions from the CHP units were another source for the global warming potential due to greenhouse gas emission. For environmental benefits, the generated electricity avoided 29.1 kg CO2 eq/FU for B0 and 43.0 kg CO2 eq/FU for B10. Recovered fertilizers from both scenarios offset 10.3–10.9 kg CO2 eq/FU, because the greenhouse gas emission during chemical fertilizer manufacture was avoided, such as nitrous oxide emissions. Compared with B0, biochar addition significantly improved electricity generation by enhancing methane production. However, biochar manufacture, especially the energy consumption during pyrolysis, caused large quantities of greenhouse gas emission, which caused a slight net environmental burden for B10. To reduce global warming associated with biochar production, prior studies showed that increasing the recalcitrant carbon yield of biochar rather than the bioenergy during pyrolysis, especially in regions with poor soils, can enhance the mitigation of climate change [66]. Biochar addition to soil can enhance soil carbon sequestration [67]. For example, biochar addition improved soil structure, such as increasing the surface area and water/nutrient holding capacities, which enhanced microbial growth and activity for a higher microbial biomass with fixed carbon [68]. The enhanced crop growth also reduced fertilizer demand and utilization as well as increasing the photosynthesis effect for carbon capture [67]. Hence, optimizing pyrolysis conditions for increased recalcitrant biochar yield and considering crop (banana) growth in LCA is recommended for future research. Increasing biochar transportation could further increase global warming (20.2 to 21.0 kg CO2 eq/FU).
Eutrophication and ecotoxicity potentials showed similar trends (Figure 4c,d). Electricity consumption contributed a 0.038 kg N eq/FU for eutrophication and 103.8 CTUe/FU for ecotoxicity. The combustion and mining of fossil fuels for electricity production can emit nitrogen oxides and release a significant amount of phosphate to water bodies, contributing to eutrophication [69]. In addition, fossil fuel mining can release heavy metals, such as nickel and mercury. Coal ash after combustion contains various types of metals, such as mercury and cadmium. Without proper management, these toxic contaminants can highly pollute environment and affect human health [69]. The recovered fertilizer offset ecotoxicity by avoiding the release of heavy metals during raw material mining and fertilizer processing. Although biochar application had a slight eutrophication potential of 0.015 kg N eq/FU and ecotoxicity of 37.4 CTUe/FU, it significantly enhanced energy recovery, resulting in higher net environmental benefits compared with B0. Biochar transportation distance did not have a significant effect on these two impact categories.

4. Conclusions

The addition of 10% biochar was the optimal dosage for methanogenesis enhancement. Biochar addition to HS-AD of lignocellulosic banana waste improved system stability and enhanced methane production by 20–47% with weekly methane yields increasing from 90–132 mL/g VS to 132–184 mL/g VS. The improved performance was likely due to several factors: (1) Biochar addition significantly reduced VFA stress to methanogens at all SRT conditions; (2) Biochar potentially promoted DIET to stimulate VFA degradation and enhance methane production; (3) Biochar also potentially provided a biofilm attachment surface for methanogens for increased methane content and yield. Digestate from both biochar unamended and amended HS-AD reactors of banana waste can potentially be used as bioorganic fertilizer for neutralizing acidic soil or growing alkaline soil plants. The high nutrient (TN and TK) contents, WHC, and CEC of the digestate indicated its potential for improving soil quality and crop growth. Biochar addition to HS-AD had higher environmental benefits in eutrophication and ecotoxicity categories due to enhanced electricity generation. Biochar addition also decreased fossil fuel depletion when the transportation distance is shorter than 8830 km. However, biochar addition increased global warming potential compared with the control due to the energy consumption during biochar manufacture.

Author Contributions

Conceptualization, X.Y. and S.J.E.; methodology, X.Y., S.J.E. and Q.Z.; software, Q.Z.; validation of results, X.Y., S.J.E. and Q.Z.; formal analysis, X.Y.; investigation, X.Y.; resources, S.J.E.; data curation, X.Y.; writing—original draft preparation, X.Y.; writing—review and editing, S.J.E., Q.Z. and X.Y. All authors have read and agreed to the published version of the manuscript.

Funding

This research received no external funding.

Institutional Review Board Statement

Not applicable.

Informed Consent Statement

Not applicable.

Data Availability Statement

Not applicable.

Acknowledgments

The authors would like to thank Allan Feldman (Professor in the College of Education at USF) for providing banana waste and the generous support from Biochar Supreme Inc. as well as help from Laurie Walker (Director of USF Botanical Garden) and USF students, Yan Zhang, Jiayi Hua, Dhanashree Rawalgaonkar and Paula Bittencourt.

Conflicts of Interest

The authors declare no conflict of interest.

Appendix A

Figure A1. Preliminary VFA adsorption by biochar test.
Sustainability 15 06832 g0a1
Based on this test, the VFA adsorption capacity of biochar was 63 mg/g. To reduce VFA concentrations from 14,000 mg/L (observed in preliminary BMP test) to 10,000 mg/L (inhibitory level), ~6 g (30% by dry mass) of biochar needs to be added to the BMP reactors containing 20 g TS.
Figure A2. Photo of semi-continuous HS-AD reactor.
Sustainability 15 06832 g0a2
Figure A3. Methane yield for semi-continuous HS-AD reactors in preliminary study. (Note: B is control and BB is biochar-amended reactor).
Sustainability 15 06832 g0a3
After this study, a nitrogen source and trace element solution were added to the semi-continuous HS-AD reactors to improve methane yields.
Figure A4. Chemical analysis for semi-continuous HS-AD reactors in the preliminary study. (Note: B is control and BB is biochar-amended reactor): (a) VFA, (b) VFA/Alk, (c) TAN.
Sustainability 15 06832 g0a4aSustainability 15 06832 g0a4b
Figure A5. LCA process flow diagrams: (a) control (B) and (b) with biochar (BB).
Sustainability 15 06832 g0a5
Table A1. Characteristics of substrate, dewatered sludge, and biochar.
Banana PeelBanana StemBanana LeafDewatered Sludge
TS (%)12 ± 0.39 ± 0.327 ± 3.719 ± 0.2
VS (%)10 ± 0.48 ± 0.324 ± 3.313 ± 0.1
VS/TS0.820.890.890.72
Biochar
Particle sizeBulk densityElectrical conductivitypHCation exchange capacitySurface areaPore volume
0.15–3 mm0.09 g/cm350.7 µS/cm9.43 cmol/kg467 m2/g0.029 cc/g
Table A2. Experimental conditions for batch high solids anerobic digestion experiments.
Biochar Dosage
(By Dry Mass)
Temperature
(°C)
S/I
(VS Basis)
TS
(%)
Banana Waste
(g VS)
110%35NA200
20351:1207
10%
30%
30351:1207
2.5%
5%
7.5%
10%
Note: NA = Not Applicable.
Table A3. LCA inventory without/with biochar addition.
Process
Biochar productionInput
Wood waste (dry) (ton)2.86
Pretreatment/grindingElectricity (kWh) a124.7
PyrolysisElectricity (kWh) b1080
Liquid nitrogen (g) c81
Output
Biochar (ton) d1.00
Syngas (ton) d0.89
Bio-oil (ton) d1.00
Air emissions eCO2 (kg)111
CH4 (kg)12.2
H2 (kg)0.1
N2O (kg)0.025
NOx (kg)0.0102
SO2 (kg)0.120
SOx (kg)0.099
NMVOC (kg)0.124
CO2 (kg) f629
HS-ADControlBiochar-amended
Input
Banana waste (dry with TS 20%)11
Pretreatment and transportationElectricity (kWh) g43.643.6
Biochar (kg)016.8
Output
CH4 (m3)2537
Digestate, modeled as avoided N fertilizer as N (kg)2.232.41
Digestate, modeled as avoided P fertilizer as P2O5 (kg)0.730.76
Digestate, modeled as avoided K fertilizer as K2O (kg)6.336.23
CHPControlBiochar-amended
Input
CH4 (m3)2537
Output
Electricity (kWh)100.2148.3
NOx (g)186.9276.5
UHC (g)308.0455.9
NMVOC (g)9.313.7
CH4 (g)401.5594.1
CO (g)286.8424.4
N2O (g)1.52.2
SO2 (g)17.626.0
Emissions hFormaldehyde (g)8.011.9
Acetaldehyde (g)0.10.2
Acrolein (g)9.3 × 10−41.4× 10−3
Propanal (g)2.1 × 10−23.1 × 10−2
Acetone (g)2.1 × 10−23.1 × 10−2
Butanal (g)9.3 × 10−41.4 × 10−3
Pentanal (g)9.3 × 10−41.4 × 10−3
Hexanal (g)9.3 × 10−41.4 × 10−3
Benzaldehyde (g)1.2 × 10−21.8 × 10−2
PAH (g)3.9 × 10−65.7 × 10−6
Naphthalene (g)4.2 × 10−36.3 × 10−3
HCB (g)1.8 × 10−72.6 × 10−7
PCB (g)1.8 × 10−102.6 × 10⁻¹⁰
Fertilizer spreadControlBiochar-amended
Input
diesel (MJ) i2.442.48
a Electricity consumed for pyrolysis feedstock grinding was based on [38]. b Electricity consumed for pyrolysis was based on Muñoz et al. (2017) [36]. c Nitrogen gas flow rate for pyrosis was assumed as 100 L/h and pyrolysis residence time was 1 h. d Pyrolysis product distribution was based on [35]. e Air emissions from pyrolysis was mainly based on [35,39]. f Emissions from the construction of pyrolysis plant were assumed as 0.22 ton CO2/ton of dry feedstock [35]. g Agricultural grinders with the electric motor were assumed to have an average power of 9 kW and griding capacity of 500 kg/h. The average area of a banana farm is ~250 ha [70] and a medium bulldozer has a 160-kW horsepower, 10 km/h of transport speed, and 2 ton of operating weight capacity. h Emission factor was according to [33]. UHC: unspecified hydrocarbons; NMVOC: non-methane volatile organic compounds; PCDD: Polychlorinated dibenzo-p-dioxins; PAH: Polycyclic Aromatic Hydrocarbon; HCB: Hexachlorobenzene; PCB: Polychlorinated biphenyls [34]. i Diesel consumption for fertilizer spread is calculated based on [34].

References

  1. Nada, A.; El-Gendy, A.; Mohamed, S. Banana leaves as adsorbents for removal of metal ions from waste water. Carbohydr. Polym. 2010, 82, 1025–1030. [Google Scholar] [CrossRef]
  2. Li, C.; Liu, G.; Nges, I.A.; Deng, L.; Nistor, M.; Liu, J. Fresh banana pseudo-stems as a tropical lignocellulosic feedstock for methane production. Energy Sustain. Soc. 2016, 6, 27. [Google Scholar] [CrossRef]
  3. Fatmawati, A.; Gunawan, K.Y.; Hadiwijaya, F.A. Hydrolysis of alkaline pretreated banana peel. In Proceedings of the International Conference on Informatics, Technology and Engineering 2017, Bali, Indonesia, 24–25 August 2017; IOP Conference Series: Materials Science and Engineering. IOP Publishing: Bristol, UK, 2017; p. 012011. [Google Scholar]
  4. Ahmad, T.; Danish, M. Prospects of banana waste utilization in wastewater treatment: A review. J. Environ. Manag. 2018, 206, 330–348. [Google Scholar] [CrossRef]
  5. Khan, M.T.; Brulé, M.; Maurer, C.; Argyropoulos, D.; Müller, J.; Oechsner, H. Batch anaerobic digestion of banana waste-energy potential and modelling of methane production kinetics. Agric. Eng. Int. CIGR J. 2016, 18, 110–128. [Google Scholar]
  6. Kalia, V.; Sonakya, V.; Raizada, N. Anaerobic digestion of banana stem waste. Bioresour. Technol. 2000, 73, 191–193. [Google Scholar] [CrossRef]
  7. Paritosh, K.; Pareek, N.; Chawade, A.; Vivekanand, V. Prioritization of solid concentration and temperature for solid state anaerobic digestion of pearl millet straw employing multi-criteria assessment tool. Sci. Rep. 2019, 9, 11902. [Google Scholar] [CrossRef]
  8. Abbassi-Guendouz, A.; Brockmann, D.; Trably, E.; Dumas, C.; Delgenès, J.-P.; Steyer, J.-P.; Escudié, R. Total solids content drives high solid anaerobic digestion via mass transfer limitation. Bioresour. Technol. 2012, 111, 55–61. [Google Scholar] [CrossRef]
  9. Bardiya, N.; Somayaji, D.; Khanna, S. Biomethanation of banana peel and pineapple waste. Bioresour. Technol. 1996, 58, 73–76. [Google Scholar] [CrossRef]
  10. Gautam, K.; Pareek, A.; Sharma, D.K. A method to utilize waste nutrient sources in aqueous extracts for enhancement of biomass and lipid content in potential green algal species for biodiesel production. J. Bioprocess. Biotech. 2015, 5, 1. [Google Scholar] [CrossRef]
  11. Blume, E.; Reichert, J.M. Banana leaf and glucose mineralization and soil organic matter in microhabitats of banana plantations under long-term pesticide use. Environ. Toxicol. Chem. 2015, 34, 1232–1238. [Google Scholar] [CrossRef]
  12. Liu, L.; Kong, J.; Cui, H.; Zhang, J.; Wang, F.; Cai, Z.; Huang, X. Relationships of decomposability and C/N ratio in different types of organic matter with suppression of Fusarium oxysporum and microbial communities during reductive soil disinfestation. Biol. Control 2016, 101, 103–113. [Google Scholar] [CrossRef]
  13. Divyabharathi, R.; Angeeswaran, R.; Jagadeeshkumar, K.; Pugalendhi, S. Characterization and batch anaerobic digestion study of banana wastes. Int. J. Curr. Microbiol. Appl. Sci. 2017, 6, 2307–2315. [Google Scholar] [CrossRef]
  14. Faozi, K.; Yudono, P.; Indradewa, D.; Maas, A. Banana stem bokashi and its effect to increase soybean yield (Glycine max L. Merrill) in coastal sands area. Agrotechnology 2018, 7, 2. [Google Scholar] [CrossRef]
  15. Estevez, M.M.; Linjordet, R.; Morken, J. Effects of steam explosion and co-digestion in the methane production from Salix by mesophilic batch assays. Bioresour. Technol. 2012, 104, 749–756. [Google Scholar] [CrossRef]
  16. Luo, C.; Lü, F.; Shao, L.; He, P. Application of eco-compatible biochar in anaerobic digestion to relieve acid stress and promote the selective colonization of functional microbes. Water Res. 2015, 68, 710–718. [Google Scholar] [CrossRef]
  17. Baek, G.; Kim, J.; Kim, J.; Lee, C.J.E. Role and potential of direct interspecies electron transfer in anaerobic digestion. Energies 2018, 11, 107. [Google Scholar] [CrossRef]
  18. Jiang, Q.; Chen, Y.; Yu, S.; Zhu, R.; Zhong, C.; Zou, H.; Gu, L.; He, Q. Effects of citrus peel biochar on anaerobic co-digestion of food waste and sewage sludge and its direct interspecies electron transfer pathway study. Chem. Eng. J. 2020, 398, 125643. [Google Scholar] [CrossRef]
  19. Lee, E.; Oliveira, D.S.B.L.; Oliveira, L.S.B.L.; Jimenez, E.; Kim, Y.; Wang, M.; Ergas, S.J.; Zhang, Q. Comparative environmental and economic life cycle assessment of high solids anaerobic co-digestion for biosolids and organic waste management. Water Res. 2020, 171, 115443. [Google Scholar] [CrossRef]
  20. Shen, X.; Kommalapati, R.R.; Huque, Z. The comparative life cycle assessment of power generation from lignocellulosic biomass. Sustainability 2015, 7, 12974–12987. [Google Scholar] [CrossRef]
  21. Li, H.; Feng, K. Life cycle assessment of the environmental impacts and energy efficiency of an integration of sludge anaerobic digestion and pyrolysis. J. Clean. Prod. 2018, 195, 476–485. [Google Scholar] [CrossRef]
  22. Gunaseelan, V.N. Biochemical methane potential of fruits and vegetable solid waste feedstocks. Biomass Bioenergy 2004, 26, 389–399. [Google Scholar] [CrossRef]
  23. Holliger, C.; Alves, M.; Andrade, D.; Angelidaki, I.; Astals, S.; Baier, U.; Bougrier, C.; Buffière, P.; Carballa, M.; De Wilde, V.; et al. Towards a standardization of biomethane potential tests. Water Sci. Technol. 2016, 74, 2515–2522. [Google Scholar] [CrossRef]
  24. Joseph, S.; Cowie, A.L.; Van Zwieten, L.; Bolan, N.; Budai, A.; Buss, W.; Cayuela, M.L.; Graber, E.R.; Ippolito, J.A.; Kuzyakov, Y.; et al. How biochar works, and when it doesn’t: A review of mechanisms controlling soil and plant responses to biochar. GCB Bioenergy 2021, 13, 1731–1764. [Google Scholar] [CrossRef]
  25. Gurwick, N.P.; Moore, L.A.; Kelly, C.; Elias, P. A systematic review of biochar research, with a focus on its stability in situ and its promise as a climate mitigation strategy. PLoS ONE 2013, 8, e75932. [Google Scholar] [CrossRef]
  26. Lee, E.; Bittencourt, P.; Casimir, L.; Jimenez, E.; Wang, M.; Zhang, Q.; Ergas, S.J. Biogas production from high solids anaerobic co-digestion of food waste, yard waste and waste activated sludge. Waste Manag. 2019, 95, 432–439. [Google Scholar] [CrossRef]
  27. Liu, T.; Sung, S. Ammonia inhibition on thermophilic aceticlastic methanogens. Water Sci. Technol. 2002, 45, 113–120. [Google Scholar] [CrossRef]
  28. Demirel, B.; Scherer, P. Trace element requirements of agricultural biogas digesters during biological conversion of renewable biomass to methane. Biomass Bioenergy 2011, 35, 992–998. [Google Scholar] [CrossRef]
  29. Rice, E.W.; Baird, R.B.; Eaton, A.D.; Clesceri, L.S. Standard Methods for the Examination of Water and Wastewater; American Public Health Association: Washington, DC, USA, 2012; Volume 10. [Google Scholar]
  30. Chapman, H. Cation-exchange capacity. Methods Soil Anal. Part 2 Chem. Microbiol. Prop. 1965, 9, 891–901. [Google Scholar]
  31. Werner, W.J.; Sanderman, J.; Melillo, J.M. Decreased soil organic matter in a long-term soil warming experiment lowers soil water holding capacity and affects soil thermal and hydrological buffering. J. Geophys. Res. Biogeosciences 2020, 125, e2019JG005158. [Google Scholar] [CrossRef]
  32. Naroznova, I.; Møller, J.; Scheutz, C. Global warming potential of material fractions occurring in source-separated organic household waste treated by anaerobic digestion or incineration under different framework conditions. Waste Manag. 2016, 58, 397–407. [Google Scholar] [CrossRef]
  33. Nielsen, M.; Nielsen, O.-K.; Thomsen, M. Emissions from Decentralised CHP Plants 2007-Energinet. dk Environmental Project no. 07/1882. Project Report 5-Emission Factors and Emission Inventory for Decentralised CHP Production; Aarhus University, National Environmental Research Institute, Department of Policy Analysis: Aarhus, Denmark, 2010.
  34. Zhang, J.; Tian, H.; Wang, X.; Tong, Y.W. Effects of activated carbon on mesophilic and thermophilic anaerobic digestion of food waste: Process performance and life cycle assessment. Chem. Eng. J. 2020, 399, 125757. [Google Scholar] [CrossRef]
  35. Homagain, K.; Shahi, C.; Luckai, N.; Sharma, M. Life cycle environmental impact assessment of biochar-based bioenergy production and utilization in Northwestern Ontario, Canada. J. For. Res. 2015, 26, 799–809. [Google Scholar] [CrossRef]
  36. Muñoz, E.; Curaqueo, G.; Cea, M.; Vera, L.; Navia, R. Environmental hotspots in the life cycle of a biochar-soil system. J. Clean. Prod. 2017, 158, 1–7. [Google Scholar] [CrossRef]
  37. Spokas, K.A.; Cantrell, K.B.; Novak, J.M.; Archer, D.W.; Ippolito, J.A.; Collins, H.P.; Boateng, A.A.; Lima, I.M.; Lamb, M.C.; McAloon, A.J.; et al. Biochar: A synthesis of its agronomic impact beyond carbon sequestration. J. Environ. Qual. 2012, 41, 973–989. [Google Scholar] [CrossRef]
  38. Llorach-Massana, P.; Lopez-Capel, E.; Peña, J.; Rieradevall, J.; Montero, J.I.; Puy, N. Technical feasibility and carbon footprint of biochar co-production with tomato plant residue. Waste Manag. 2017, 67, 121–130. [Google Scholar] [CrossRef] [PubMed]
  39. Li, X.; Wang, R.; Shao, C.; Li, D.; Bai, S.; Hou, N.; Zhao, X. Biochar and Hydrochar from Agricultural Residues for Soil Conditioning: Life Cycle Assessment and Microbially Mediated C and N Cycles. ACS Sustain. Chem. Eng. 2022, 10, 3574–3583. [Google Scholar] [CrossRef]
  40. Field, J.L.; Keske, C.M.; Birch, G.L.; DeFoort, M.W.; Cotrufo, M.F. Distributed biochar and bioenergy coproduction: A regionally specific case study of environmental benefits and economic impacts. Gcb Bioenergy 2013, 5, 177–191. [Google Scholar] [CrossRef]
  41. Richard, E.N. Pre-treatment of banana leaves with alkaline banana winery bottle-washing wastewater to improve the anaerobic digestion process. Biomass-Convers. Biorefinery 2022. [Google Scholar] [CrossRef]
  42. Obuya, B.; Waita, S.; Otieno, C. Biogas from Different Parts of a Banana Plant: A Case Study of the Banana Plant from Kisii County. J. Energy Res. Rev. 2020, 6, 1–10. [Google Scholar] [CrossRef]
  43. Pan, S.; Chi, Y.; Zhou, L.; Li, Z.; Du, L.; Wei, Y. Evaluation of squeezing pretreatment for improving methane production from fresh banana pseudo-stems. Waste Manag. 2020, 102, 900–908. [Google Scholar] [CrossRef]
  44. Jokhio, I.; Qureshi, S.S.; Sahito, A.R.; Lashari, I.A.; Mubarak, N.; Tripathi, M.; Al-Mohaimeed, A.M. Enhanced bio-methane and bio-hydrogen production using banana plant waste and sewage sludge through anaerobic co-digestion. Int. J. Hydrogen Energy 2022. [Google Scholar] [CrossRef]
  45. Zhang, C.; Li, J.; Liu, C.; Liu, X.; Wang, J.; Li, S.; Fan, G.; Zhang, L. Alkaline pretreatment for enhancement of biogas production from banana stem and swine manure by anaerobic codigestion. Bioresour. Technol. 2013, 149, 353–358. [Google Scholar] [CrossRef] [PubMed]
  46. Zhang, M.; Li, J.; Wang, Y.; Yang, C. Impacts of different biochar types on the anaerobic digestion of sewage sludge. RSC Adv. 2019, 9, 42375–42386. [Google Scholar] [CrossRef]
  47. Khan, M.A.; Ngo, H.H.; Guo, W.; Liu, Y.; Nghiem, L.D.; Chang, S.W.; Nguyen, D.D.; Zhang, S.; Luo, G.; Jia, H. Optimization of hydraulic retention time and organic loading rate for volatile fatty acid production from low strength wastewater in an anaerobic membrane bioreactor. Bioresour. Technol. 2019, 271, 100–108. [Google Scholar] [CrossRef] [PubMed]
  48. Chaiprapat, S.; Laklam, T. Enhancing digestion efficiency of POME in anaerobic sequencing batch reactor with ozonation pretreatment and cycle time reduction. Bioresour. Technol. 2011, 102, 4061–4068. [Google Scholar] [CrossRef]
  49. Hinds, G.R.; Lens, P.N.; Zhang, Q.; Ergas, S.J. Microbial biomethane production from municipal solid waste using high solids anaerobic digestion. In Microbial Fuels; CRC Press: Boca Raton, FL, USA, 2017; pp. 153–188. [Google Scholar]
  50. Ambaye, T.G.; Rene, E.R.; Dupont, C.; Wongrod, S.; Van Hullebusch, E.D. Anaerobic digestion of fruit waste mixed with sewage sludge digestate biochar: Influence on biomethane production. Front. Energy Res. 2020, 8, 31. [Google Scholar] [CrossRef]
  51. Kinyua, M.N.; Cunningham, J.; Ergas, S.J. Effect of solids retention time on the bioavailability of organic carbon in anaerobically digested swine waste. Bioresour. Technol. 2014, 162, 14–20. [Google Scholar] [CrossRef]
  52. Yang, X. Biochar Amended Biological Systems for Enhanced Landfill Leachate and Lignocellulosic Banana Waste Treatment. Ph.D. Thesis, University of South Florida, Tampa, FL, USA, 2022. [Google Scholar]
  53. Indren, M.; Birzer, C.H.; Kidd, S.P.; Medwell, P.R. Effect of total solids content on anaerobic digestion of poultry litter with biochar. J. Environ. Manag. 2020, 255, 109744. [Google Scholar] [CrossRef]
  54. Wang, G.; Li, Q.; Gao, X.; Wang, X.C. Synergetic promotion of syntrophic methane production from anaerobic digestion of complex organic wastes by biochar: Performance and associated mechanisms. Bioresour. Technol. 2018, 250, 812–820. [Google Scholar] [CrossRef]
  55. Mumme, J.; Srocke, F.; Heeg, K.; Werner, M. Use of biochars in anaerobic digestion. Bioresour. Technol. 2014, 164, 189–197. [Google Scholar] [CrossRef]
  56. Shen, Y.; Linville, J.L.; Ignacio-de Leon, P.A.A.; Schoene, R.P.; Urgun-Demirtas, M. Towards a sustainable paradigm of waste-to-energy process: Enhanced anaerobic digestion of sludge with woody biochar. J. Clean. Prod. 2016, 135, 1054–1064. [Google Scholar] [CrossRef]
  57. Vengadaramana, A.; Jashothan, P. Effect of organic fertilizers on the water holding capacity of soil in different terrains of Jaffna peninsula in Sri Lanka. J. Nat. Prod. Plant Resour 2012, 2, 500–503. [Google Scholar]
  58. Santos, R.V.; Mendes, M.A.; Alexandre, C.; Carrott, M.R.; Rodrigues, A.; Ferreira, A.F. Assessment of Biomass and Biochar of Maritime Pine as a Porous Medium for Water Retention in Soils. Energies 2022, 15, 5882. [Google Scholar] [CrossRef]
  59. Yu, O.-Y.; Raichle, B.; Sink, S. Impact of biochar on the water holding capacity of loamy sand soil. Int. J. Energy Environ. Eng. 2013, 4, 44. [Google Scholar] [CrossRef]
  60. Loh, S.K.; James, S.; Ngatiman, M.; Cheong, K.Y.; Choo, Y.M.; Lim, W.S. Enhancement of palm oil refinery waste–Spent bleaching earth (SBE) into bio organic fertilizer and their effects on crop biomass growth. Ind. Crops Prod. 2013, 49, 775–781. [Google Scholar] [CrossRef]
  61. Kalemelawa, F.; Nishihara, E.; Endo, T.; Ahmad, Z.; Yeasmin, R.; Tenywa, M.M.; Yamamoto, S. An evaluation of aerobic and anaerobic composting of banana peels treated with different inoculums for soil nutrient replenishment. Bioresour. Technol. 2012, 126, 375–382. [Google Scholar] [CrossRef]
  62. Gawad, N. Effect of organic compost tea and humic acid to reduce dose of NPK fertigation of banana plants cv. “Grand Nain”. Egypt J. Hort 2016, 43, 195–210. [Google Scholar]
  63. Twyford, I.T.; Walmsley, D. The mineral composition of the Robusta banana plant IV. The application of fertilizers for high yields. Plant Soil 1974, 41, 493–508. [Google Scholar] [CrossRef]
  64. Nabel, M.; Temperton, V.M.; Poorter, H.; Lücke, A.; Jablonowski, N.D. Energizing marginal soils–The establishment of the energy crop Sida hermaphrodita as dependent on digestate fertilization, NPK, and legume intercropping. Biomass Bioenergy 2016, 87, 9–16. [Google Scholar] [CrossRef]
  65. Leonard, M.D.; Michaelides, E.E.; Michaelides, D.N. Energy storage needs for the substitution of fossil fuel power plants with renewables. Renew. Energy 2020, 145, 951–962. [Google Scholar] [CrossRef]
  66. Woolf, D.; Amonette, J.E.; Street-Perrott, F.A.; Lehmann, J.; Joseph, S. Sustainable biochar to mitigate global climate change. Nat. Commun. 2010, 1, 56. [Google Scholar] [CrossRef] [PubMed]
  67. Sarfraz, R.; Hussain, A.; Sabir, A.; Ben Fekih, I.; Ditta, A.; Xing, S. Role of biochar and plant growth promoting rhizobacteria to enhance soil carbon sequestration—A review. Environ. Monit. Assess. 2019, 191, 251. [Google Scholar] [CrossRef] [PubMed]
  68. Liu, S.; Zhang, Y.; Zong, Y.; Hu, Z.; Wu, S.; Zhou, J.; Jin, Y.; Zou, J. Response of soil carbon dioxide fluxes, soil organic carbon and microbial biomass carbon to biochar amendment: A meta-analysis. Gcb Bioenergy 2016, 8, 392–406. [Google Scholar] [CrossRef]
  69. Gaete-Morales, C.; Gallego-Schmid, A.; Stamford, L.; Azapagic, A. Life cycle environmental impacts of electricity from fossil fuels in Chile over a ten-year period. J. Clean. Prod. 2019, 232, 1499–1512. [Google Scholar] [CrossRef]
  70. Castillo, L.E.; Martínez, E.; Ruepert, C.; Savage, C.; Gilek, M.; Pinnock, M.; Solis, E.J. Water quality and macroinvertebrate community response following pesticide applications in a banana plantation, Limon, Costa Rica. Sci. Total Environ. 2006, 367, 418–432. [Google Scholar] [CrossRef]
Figure 1. LCA system boundary.
Sustainability 15 06832 g001
Figure 2. Cumulative methane yields: (a) biochar control test; (b) HS-AD with 0–30% biochar addition; (c) HS-AD with 0–10% biochar addition.
Sustainability 15 06832 g002
Figure 3. System performance of semi-continuous HS-ADs: (a) weekly methane yield; (b) VFA concentration; (c) pH; and (d) methane content (Note: error bar is the standard deviation, * p < 0.05, ** p < 0.01, **** p < 0.0001, ns: not significant).
Sustainability 15 06832 g003aSustainability 15 06832 g003b
Figure 4. Environmental impacts: (a) fossil fuel depletion, (b) global warming, (c) eutrophication, (d) ecotoxicity. (B10 (T = 0 km) did not consider biochar transportation and B10 (T = 8830 km) assumed an 8830 km of biochar transportation distance).
Sustainability 15 06832 g004
Table 1. Chemical parameter changes during batch HS-AD with biochar addition from 0 to 30%.
Day 0Day 7Day 30Day 112
B0pH8.76 ± 0.0078.59 ± 0.0508.69 ± 0.0078.94 ± 0.099
VFA (mg/L)2421 ± 3313,608 ± 6791204 ± 221269 ± 11
ALK (mg/L)16,470 ± 21914,506 ± 36117,396 ± 6419,149 ± 511
VFA/ALK0.15 ± 0.0000.94 ± 0.0230.07 ± 0.0010.07 ± 0.001
sCOD (mg/L)20,170 ± 49522,760 ± 12138032 ± 3757583 ± 195
TAN (mg/L)1407 ± 931375 ± 91514 ± 82578 ± 0.04
VSR (%)19.1 ± 0.67
B10pH8.83 ± 0.0288.53 ± 0.0078.68 ± 0.0218.84 ± 0.014
VFA (mg/L)2858 ± 3008106 ± 344 **1292 ± 51083 ± 21 **
ALK (mg/L)17,606 ± 182914,757 ± 343 **19,556 ± 62 ***19,425 ± 106
VFA/ALK0.16 ± 0.0000.55 ± 0.011 ***0.07 ± 0.0000.06 ± 0.001
sCOD (mg/L)23,610 ± 211712,105 ± 78 **8925 ± 106030 ± 127 ***
TAN (mg/L)1558 ± 5690 ± 8 ***1492 ± 15606 ± 2
VSR (%)26.5 ± 0.33 ***
B30pH8.88 ± 0.001 **8.60 ± 0.0078.77 ± 0.014 **8.91 ± 0.035
VFA (mg/L)1914 ± 140 *7119 ± 176 **1016 ± 13 **804 ± 68 **
ALK (mg/L)17,325 ± 116713,684 ± 188 *18,638 ± 250*18,750 ± 20
VFA/ALK0.11 ± 0.001 ***0.52 ± 0.079 **0.05 ± 0.0000.04 ± 0.004 *
sCOD (mg/L)14,905 ± 1633 *10,728 ± 225 **7408 ± 499 *4335 ± 64 ***
TAN (mg/L)1522 ± 11629 ± 6 ***1362 ± 32613 ± 2
VSR (%)20.9 ± 0.64
Note: Statistical significance was analyzed for comparing the experimental group (B10 or B30) with the control (B0). (* p < 0.05, ** p < 0.01, *** p < 0.001).
Disclaimer/Publisher’s Note: The statements, opinions and data contained in all publications are solely those of the individual author(s) and contributor(s) and not of MDPI and/or the editor(s). MDPI and/or the editor(s) disclaim responsibility for any injury to people or property resulting from any ideas, methods, instructions or products referred to in the content.

