Article

Vulnus Web: A Web-Based Procedure for the Seismic Vulnerability Assessment of Masonry Buildings

by
Maria Rosa Valluzzi
1,
Veronica Follador
2 and
Luca Sbrogiò
1,*
1
Department of Cultural Heritage, University of Padova, Piazza Capitaniato 7, 35139 Padova, Italy
2
Department of Geosciensces, University of Padova, via Gradenigo 6, 35131 Padova, Italy
*
Author to whom correspondence should be addressed.
Sustainability 2023, 15(8), 6787; https://doi.org/10.3390/su15086787
Submission received: 23 February 2023 / Revised: 4 April 2023 / Accepted: 11 April 2023 / Published: 17 April 2023
(This article belongs to the Special Issue Natural and Anthropogenic Disasters Vs. Cultural Heritage)

Abstract

:
Masonry is a widespread construction system, but it is very prone to seismic damage. In Italy, almost 60% of residential buildings are constructed in masonry, and 85% of them were built before 1980 without specific design regulation; thus, there is the need for large-scale vulnerability assessment. When large stocks of residential buildings (>50–100) are involved, also in historical centers, seismic vulnerability analysis must resort to simplified and computer-aided methods. Among these, the best known analyze (i) the overall shear strength normalized to the weight; (ii) the activation coefficient of local mechanisms; and (iii) dimensionless indexes obtained from the weighted sum of scores associated with a set of vulnerability factors. The Vulnus procedure proposes a vulnerability function in the 3D space defined by these factors, namely VIP, VOP and VV. The ‘mechanical’ indexes VIP and VOP determine the capacity of the building (in-plane and out-of-plane, respectively), whereas the ‘empirical’ index VV sets the pace at which this capacity is reached and the uncertainty in its final value. The procedure considers the confidence level of the indexes by means of fuzzy set theory, which enables expression of the vulnerability in linguistic terms (e.g., ‘high’ or ‘low’), as well as through a fragility curve. In this paper, a web toolbox based on the Vulnus procedure, namely, Vulnus Web, is proposed. It enables the central archiving of data, improved interaction with the program code and a wider dissemination. The new procedure was applied to a masonry building hit by the Central Italy 2016 earthquake; both the vulnerability level assessed numerically and the damage prediction were in good accordance with the actual seismic performance of the building.

1. Introduction

In 2018, the building construction sector accounted for 36% of final energy use and 39% of energy-related CO2 emissions [1], mainly due to operating needs. In accordance with international and European guidelines [2,3], energy retrofit interventions are needed to minimize the energy demand. However, many existing buildings have come to the end of their service life and/or do not meet present standards, and structural assessment and consequent structural retrofit is required in combination/addition to energy retrofit measures [4,5]. Indeed, existing buildings already embody a large amount of energy [6], and potential losses connected with structural damage, e.g., that caused by earthquakes, or with the disposal of demolition residuals from their replacement, would increase that figure, thus emphasizing the need for a holistic or life-cycle approach [5]. Nevertheless, further research on the embodied energy of buildings is required [7]. The structural assessment of stocks of existing buildings is a way towards sustainable development, as it enables the development of risk reduction policies by defining priorities and the resources needed [8], which can be connected to different hazards [9,10]. In this context, simplified assessment methods become particularly useful to produce large-scale outcomes while limiting computational effort and time demands. Seismic risk represents an important share of the total risk to which buildings in Italy are exposed [8]. Therefore, the development of methods for the assessment of the seismic vulnerability of buildings, i.e., their susceptibility to damage, is a staple in risk calculation. These approaches [11] mainly refer to: (i) empirical methods, which involve expected damage based on damage observed after seismic events; (ii) mechanical methods, which build predicting models based on more or less detailed numerical modelling; and (iii) hybrid, macroseismic or expert judgement-based methods, which often involve the assignment of vulnerability indexes on the basis of building characteristics.
Vulnerability models are empirically determined by grouping buildings as a function of the levels of certain features (e.g., year built, number of stories, structural type) and then observing their behavior during seismic actions. Based on the results of such approaches, for preventive purposes, various methods to infer vulnerability from a list of ‘vulnerability factors’ have been proposed [12] which use standardized data collections forms (e.g., [13] and its adaptation to other countries, e.g., [14]; CARTIS [15]; MUSE-DV [16]) and scoring systems [17,18]. Among the latter, the GNDT second-level methodology (henceforth, GNDT-2) has been largely applied to historical centers [19,20,21,22], including with adaptations for façades alone [23], or to consider different data collection forms [24,25]. Recently, new attempts have been made to calibrate this method by comparing it to actual damage data [26,27], in addition to those made shortly after it was originally issued [28,29].
The empirical association of building categories with expected damage can be replaced by simplified calculations [30], e.g., of the collapse mechanisms of external facades [31], the normalized shear strength of a building [32], a combination of these [33] and simplified non-linear static analysis [34,35]. Simplified mechanical procedures, such as those previously mentioned, seem more suitable for the characteristics of unreinforced masonry buildings in historic centers, as the actual seismic behavior can be influenced by several factors, often concealed by transformations [36,37], which can only be vaguely or imprecisely assessed during inspection campaigns. However, these require that drawings of either the façades or the floor plans be available, thus limiting the extent of the campaign to several hundred buildings, i.e., the size of a historical center or historical town.
Simplified mechanical models are based on a target parameter of the seismic response of buildings, which may appear too strict to represent the empirical interpretations of experts. Conversely, empirical methods use a selection of factors, whose choice and contribution to the overall vulnerability definition is appropriate to its calibration procedure and, partially, to the expert opinion of its creator. Hybrid methods catch the positive aspects of both these approaches. In particular, vulnerability factors appear to be graded on a scale, which can be expressed in linguistic terms, e.g., ‘good’ or ‘severe’. However, the matching is approximate, as some states may lie in between the definitions. This approximated reasoning can be represented by fuzzy logic [38], which considers fuzzy sets and fuzzy rules to represent the condition of a building and to infer knowledge, i.e., the vulnerability, from an ‘expert opinion’ based on an imprecise definition of the causes. However, there are only a few vulnerability assessment procedures based on fuzzy logic [33,39,40,41,42,43,44,45].
The translation of the described procedures from paper modules to digital format, such as applications for mobile phones or software tools for personal computers [16,46,47], as well as the usage of online resources [48], simplifies data management and storage. These systems generally exploit the client–server architecture, with a graphical interface provided by the software or the app on the local device and a central database on a remote server. In addition, digital archiving systems can collect real-time information in homogeneous formats and protect data from manipulation or potential losses and conflicts.

2. Vulnus Procedure

Vulnus is a knowledge base procedure developed by the University of Padova for the simplified assessment of the seismic vulnerability of existing residential masonry buildings. It considers both descriptive vulnerability factors and geometric data to build a simplified structural model based on the plan layout, materials and slab features averaged over the construction [49,50]. Vulnus mainly targets ordinary masonry buildings in historical centers (i.e., pre 1945), which in Italy represent almost 40% of the total masonry-built heritage and 57% of the total number of residential buildings [51]. The procedure estimates the capacity of the load-bearing wall system of a building in its two main directions for: (i) a series of out-of-plane (OOP) overturning mechanisms and (ii) the in-plane (IP) shear stress. The vulnerability model is based on the evaluation of three dimensionless parameters: two indexes refer to the OOP behavior (combination of kinematic mechanisms) and the IP behavior (shear wall resistance), computed on a typical plan geometry; a third index is evaluated as the weighted sum of the scores obtained from the GNDT-2 method [52]. Finally, Vulnus provides fragility curves related to a moderate-to-substantial damage state and an overall qualitative assessment of the vulnerability, based on random and fuzzy set theory and integration of the qualitative information collected for the building in question.

2.1. Concept and Development

The original proposal of the Vulnus procedure dates to the middle 1980s [53,54], along with the earliest studies on seismic vulnerability in Italy, and it found its first formalization in the early 1990s [33]. In the earliest works, the general architecture of the procedure and the fundamental mechanical formulations (Equations (1) and (2)) were defined. Already at this date, the vulnerability assessment was thought to be computer-aided, and the algorithm was translated into the Basic programming language [55]. In a later phase, the definition of the simplified model was improved and empirical vulnerability factors, coming from the GNDT-2 method, were added [56,57]. Fuzzy logic was applied throughout the whole procedure [49] to infer vulnerability from different inputs (mechanical, empiric, verbal), including the reliability of the information available, and to express it in a communicative way, i.e., in linguistic terms such as ‘high’ or ‘low’. Finally, the procedure was completed using a graphical user interface and was distributed as a stand-alone free software for personal computers as Vulnus VB 4.0 [58]. As Vulnus works on different sources of information, such as geometrical and verbal descriptions of a building, a data collection form including both was presented in [54] and continued to be improved up to Bernardini et al. [58]. An updated version is provided in Appendix A and its contents are discussed in Section 4.
The earliest trial applications of the Vulnus procedure were carried out in the middle 1980s on small groups (20–30) of masonry buildings in the Garda lake area (S. Zeno, Brenzone [53,54]) and in the Veneto Pre-Alps (Badia Calavena, S. Mauro di Saline [59]; Asolo [60]). These buildings were very homogenous, as they had random rubble masonry walls, timber floors and roofs, generally without ties, and were clustered in town blocks or terraces. In addition, for each building, a complete geometric survey and the description of the main structural features were carried out.
Comparison with empirical reconnaissance of damage was made possible by the earthquakes in Umbria-Marche in 1997 [61,62] and in L’Aquila in 2009 [63,64]. The vulnerability assessment was then improved by the addition of two modules on that basis: the fragility calculation and the comparison with the EMS-98 scale [65]. The linguistic vulnerability assessment was carried out for entire town blocks, divided into individual units, for up to 50 buildings per each case study. However, a comparison between predicted and observed damage after the 2016 earthquake showed some critical issues, especially when individual buildings were considered instead of the group [66].
Recently, Vulnus has been used for large-scale vulnerability analyses based on a typological approach thanks to its ability to efficiently reproduce the mechanical behavior of buildings with minimal computational effort (nationwide, see [67]; at town scale, see [68]), while also considering the effects of strengthening interventions aimed at reducing seismic risk [69,70]. Promising results were obtained when Vulnus was compared to other methods for residential [71,72] as well as school buildings [73]. However, the input phase was highly inefficient for a large stock (about 500 buildings), and no central archiving of the input and the outputs was possible.

2.2. Critical Issues and New Aims

Vulnus has been developed over a long time, and it originated when hardware resources were limited. As a result, the Basic code appeared often redundant, the interchange among the modules was non-seamless and the maximum size of the building was limited to a few walls (about 30, see Section 4.3). In addition, the stand-alone distribution did not exploit the central archiving of data and required continuous updating to keep up with different operating systems and their versions. These issues were solved by translating the code into the Python programming language [74], which is more flexible, and the stand-alone software into a web site, which solves the problems of compatibility and updating. The web site also enables the creation of a collaborative environment, as many users can contribute to a single database, which can be easily maintained and queried, and it can be used anywhere, provided that an internet connection is available.
To quicken the input phase, the data sheet was purposely translated into a preformatted spreadsheet, which can replace, partially or completely, the manual input at the web site. Finally, the results can be visualized and downloaded for further elaboration of the expected behavior of a building.
The following sections explain the general framework of Vulnus, that is, the mechanical (Section 3.1 and Section 3.2) and the qualitative (Section 3.3) vulnerability assessments, the management of the reliability of information, and the theoretical model and the definition of the fragility curves through the fuzzy set theory (Section 3.5). Section 4 presents the structural model and Section 5 describes the new website; in Section 6, its application to an existing earthquake-damaged masonry building is used for pointing out the pros and cons of the proposed approach. Fuzzy-based vulnerability assessment procedures are quite complex and are difficult to use either in large-scale applications or in professional practice. However, the implementation of the procedure in a website improves accessibility and use by practitioners.

3. Vulnus Framework

Vulnus uses rule-based expert systems and approximate reasoning based on fuzzy logic to infer vulnerability from input data. The fuzzy set theory enables consideration also of qualitative information and its reliability in the vulnerability assessment [75]. Vulnus calculates three scalar values: (i) VOP, the smallest acceleration of activation, normalized to the gravity acceleration g, in a set of the most common OOP local mechanisms assessed systematically on every boundary wall; (ii) VIP, the horizontal resisting force normalized over the total weight of the building; and (iii) the qualitative index VV, which refers to the state of the building in the terms of the GNDT-2 method. These values are considered as indexes, representative of the state of a building for the given component, and they enable comparison with other buildings. For the sake of comparison with all previous works, VOP replaces I2, VIP replaces I1, and VV corresponds to I3. Then, the random fuzzy set theory is applied to the indexes to obtain damage fragility curves [61].

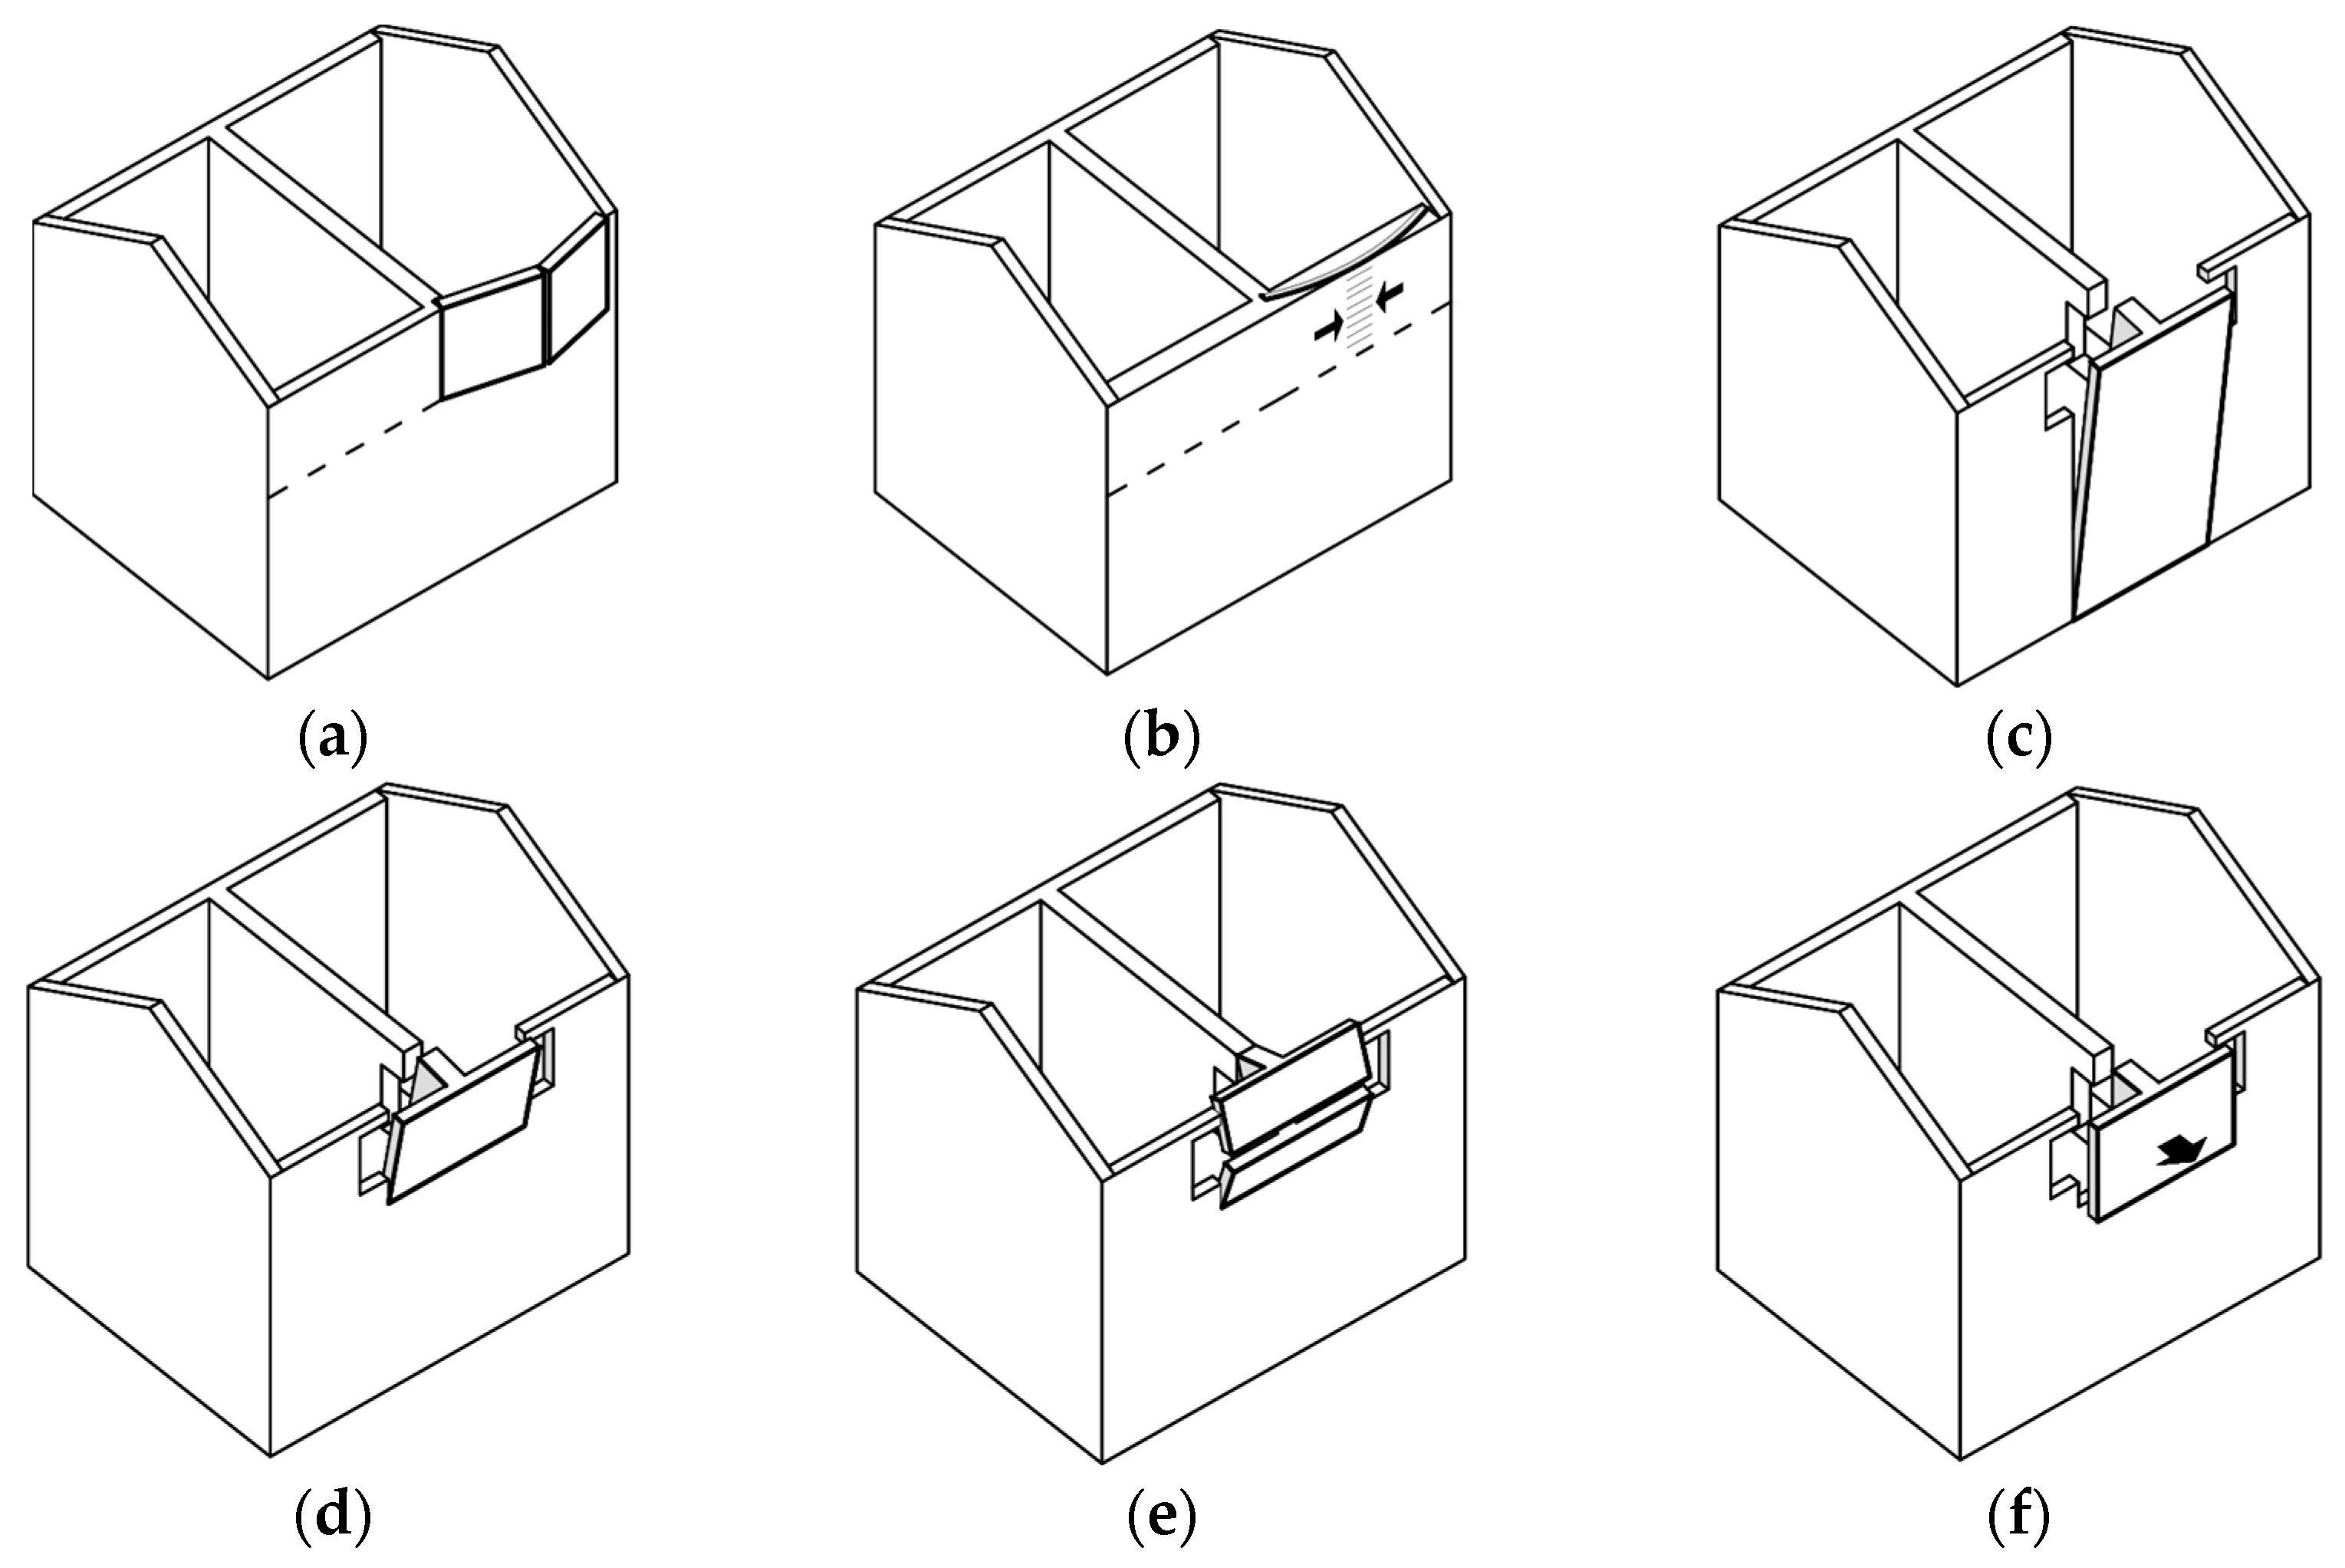
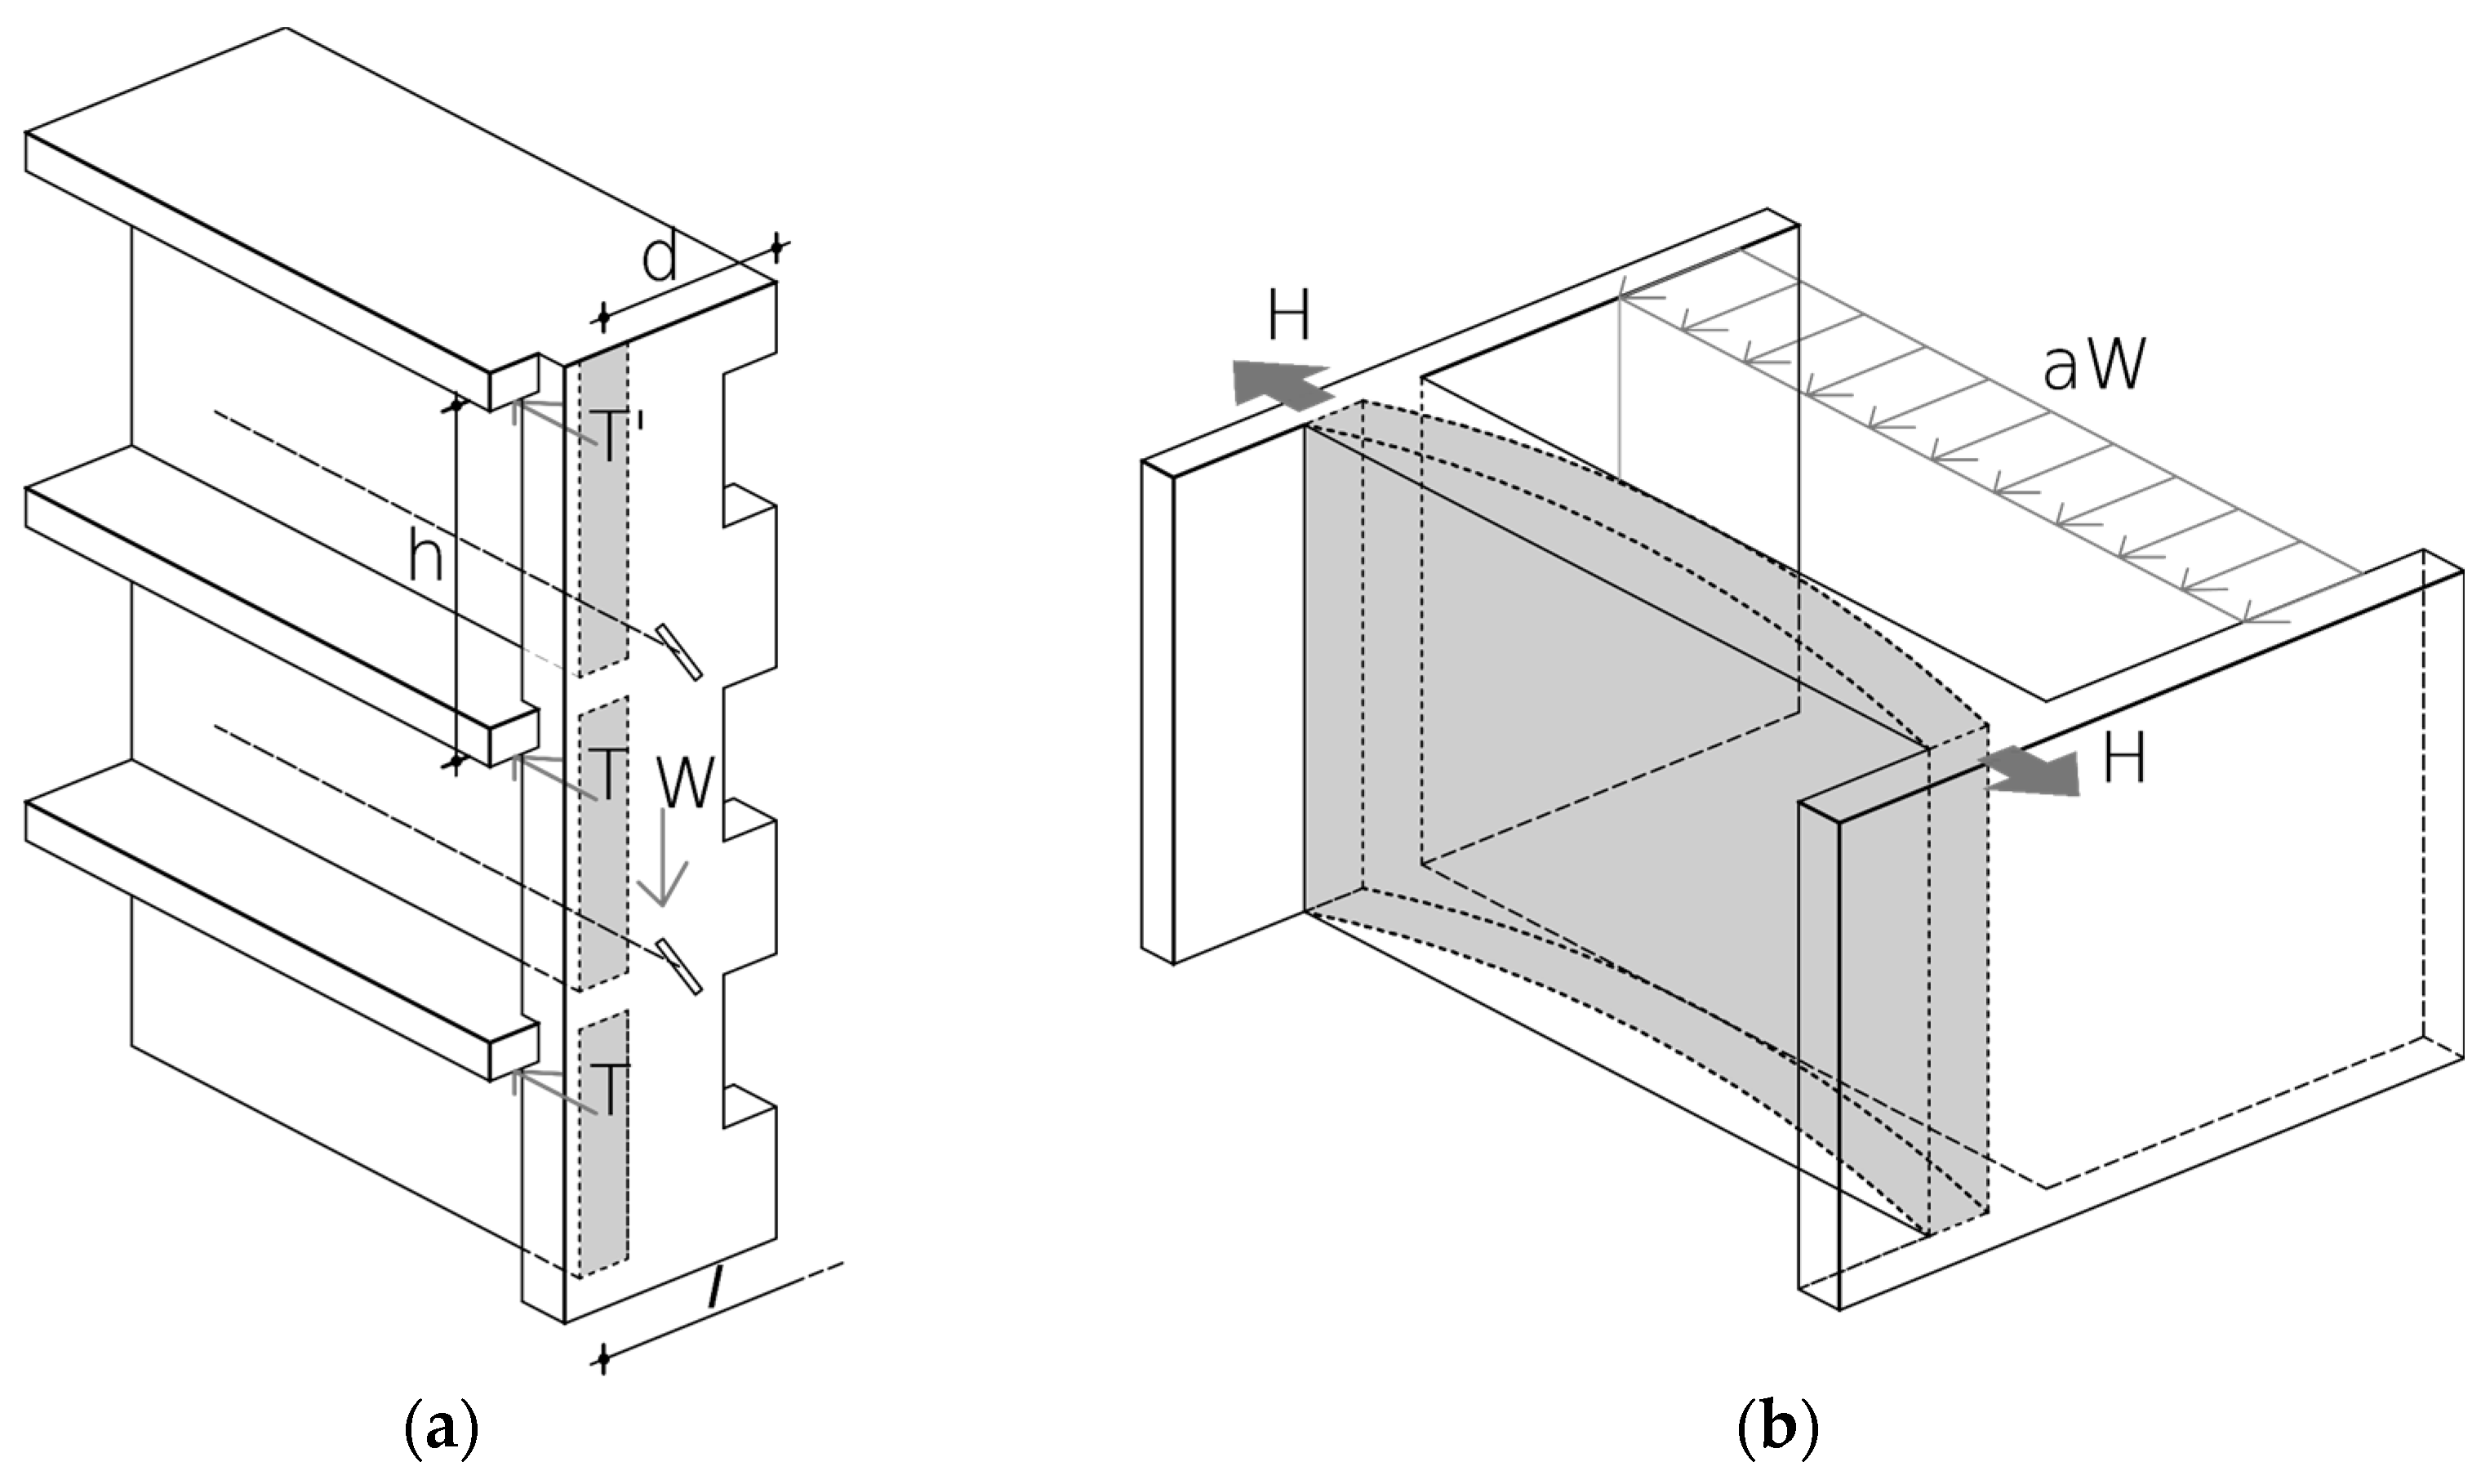
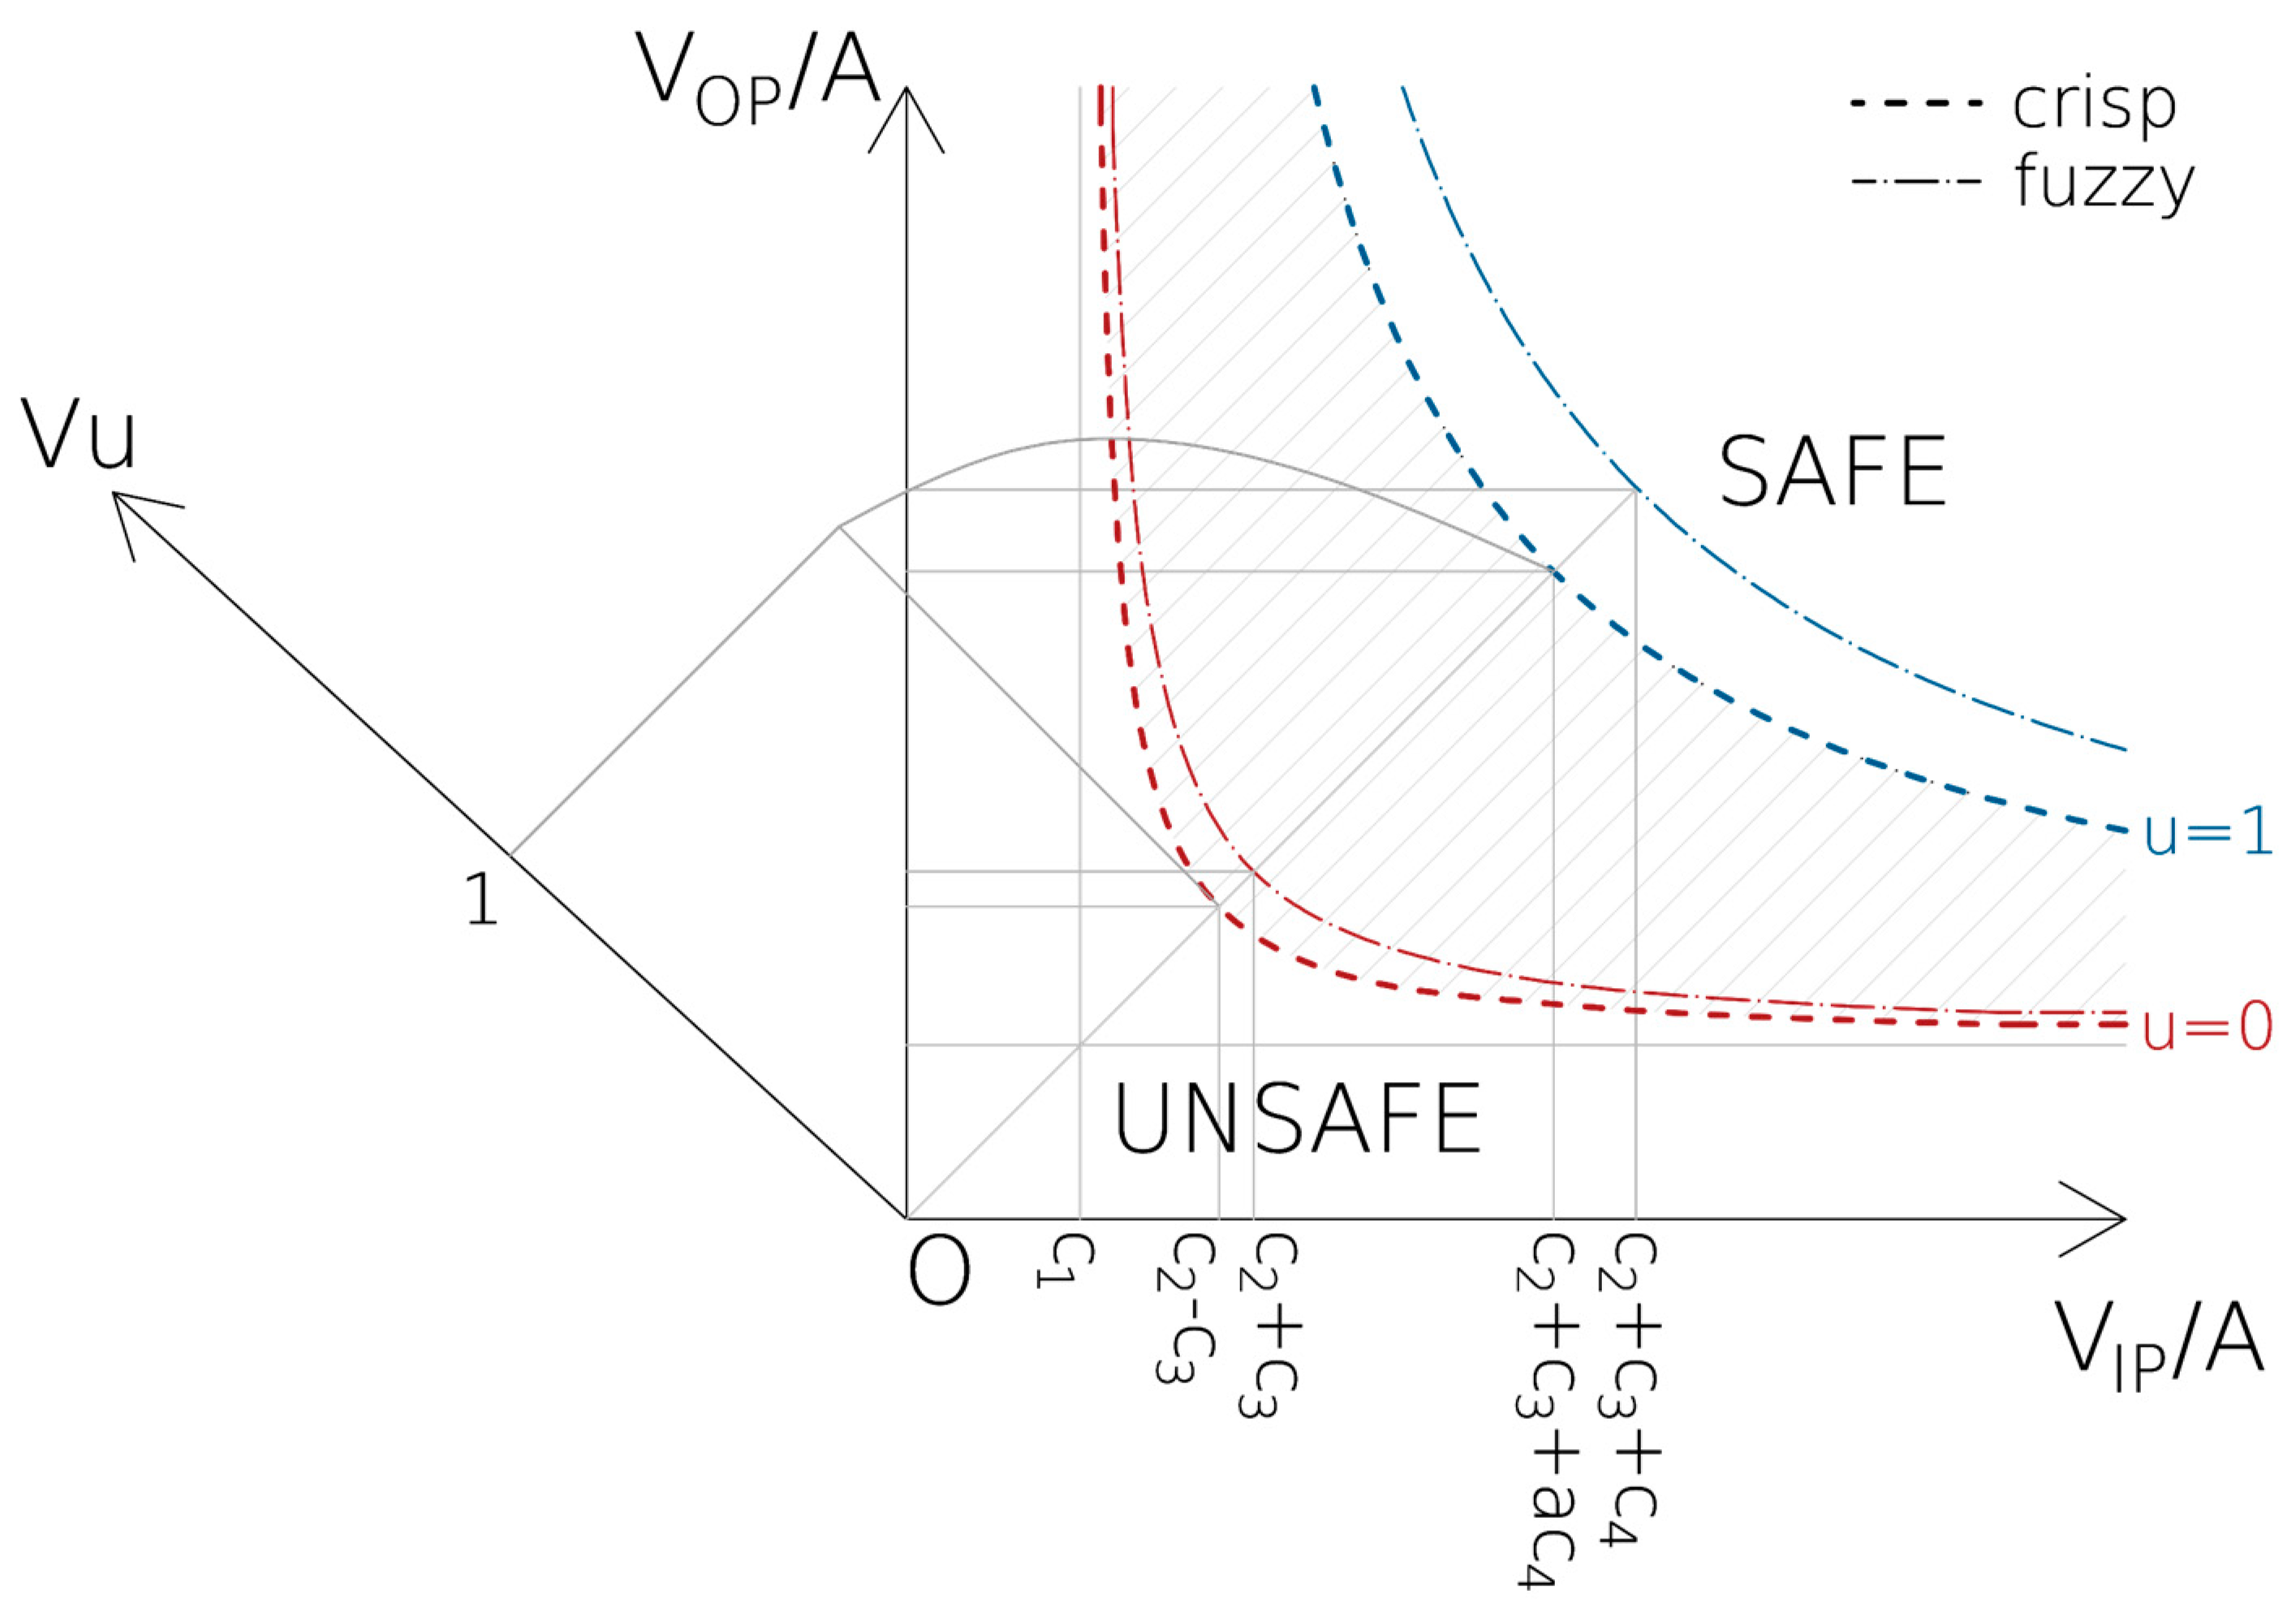
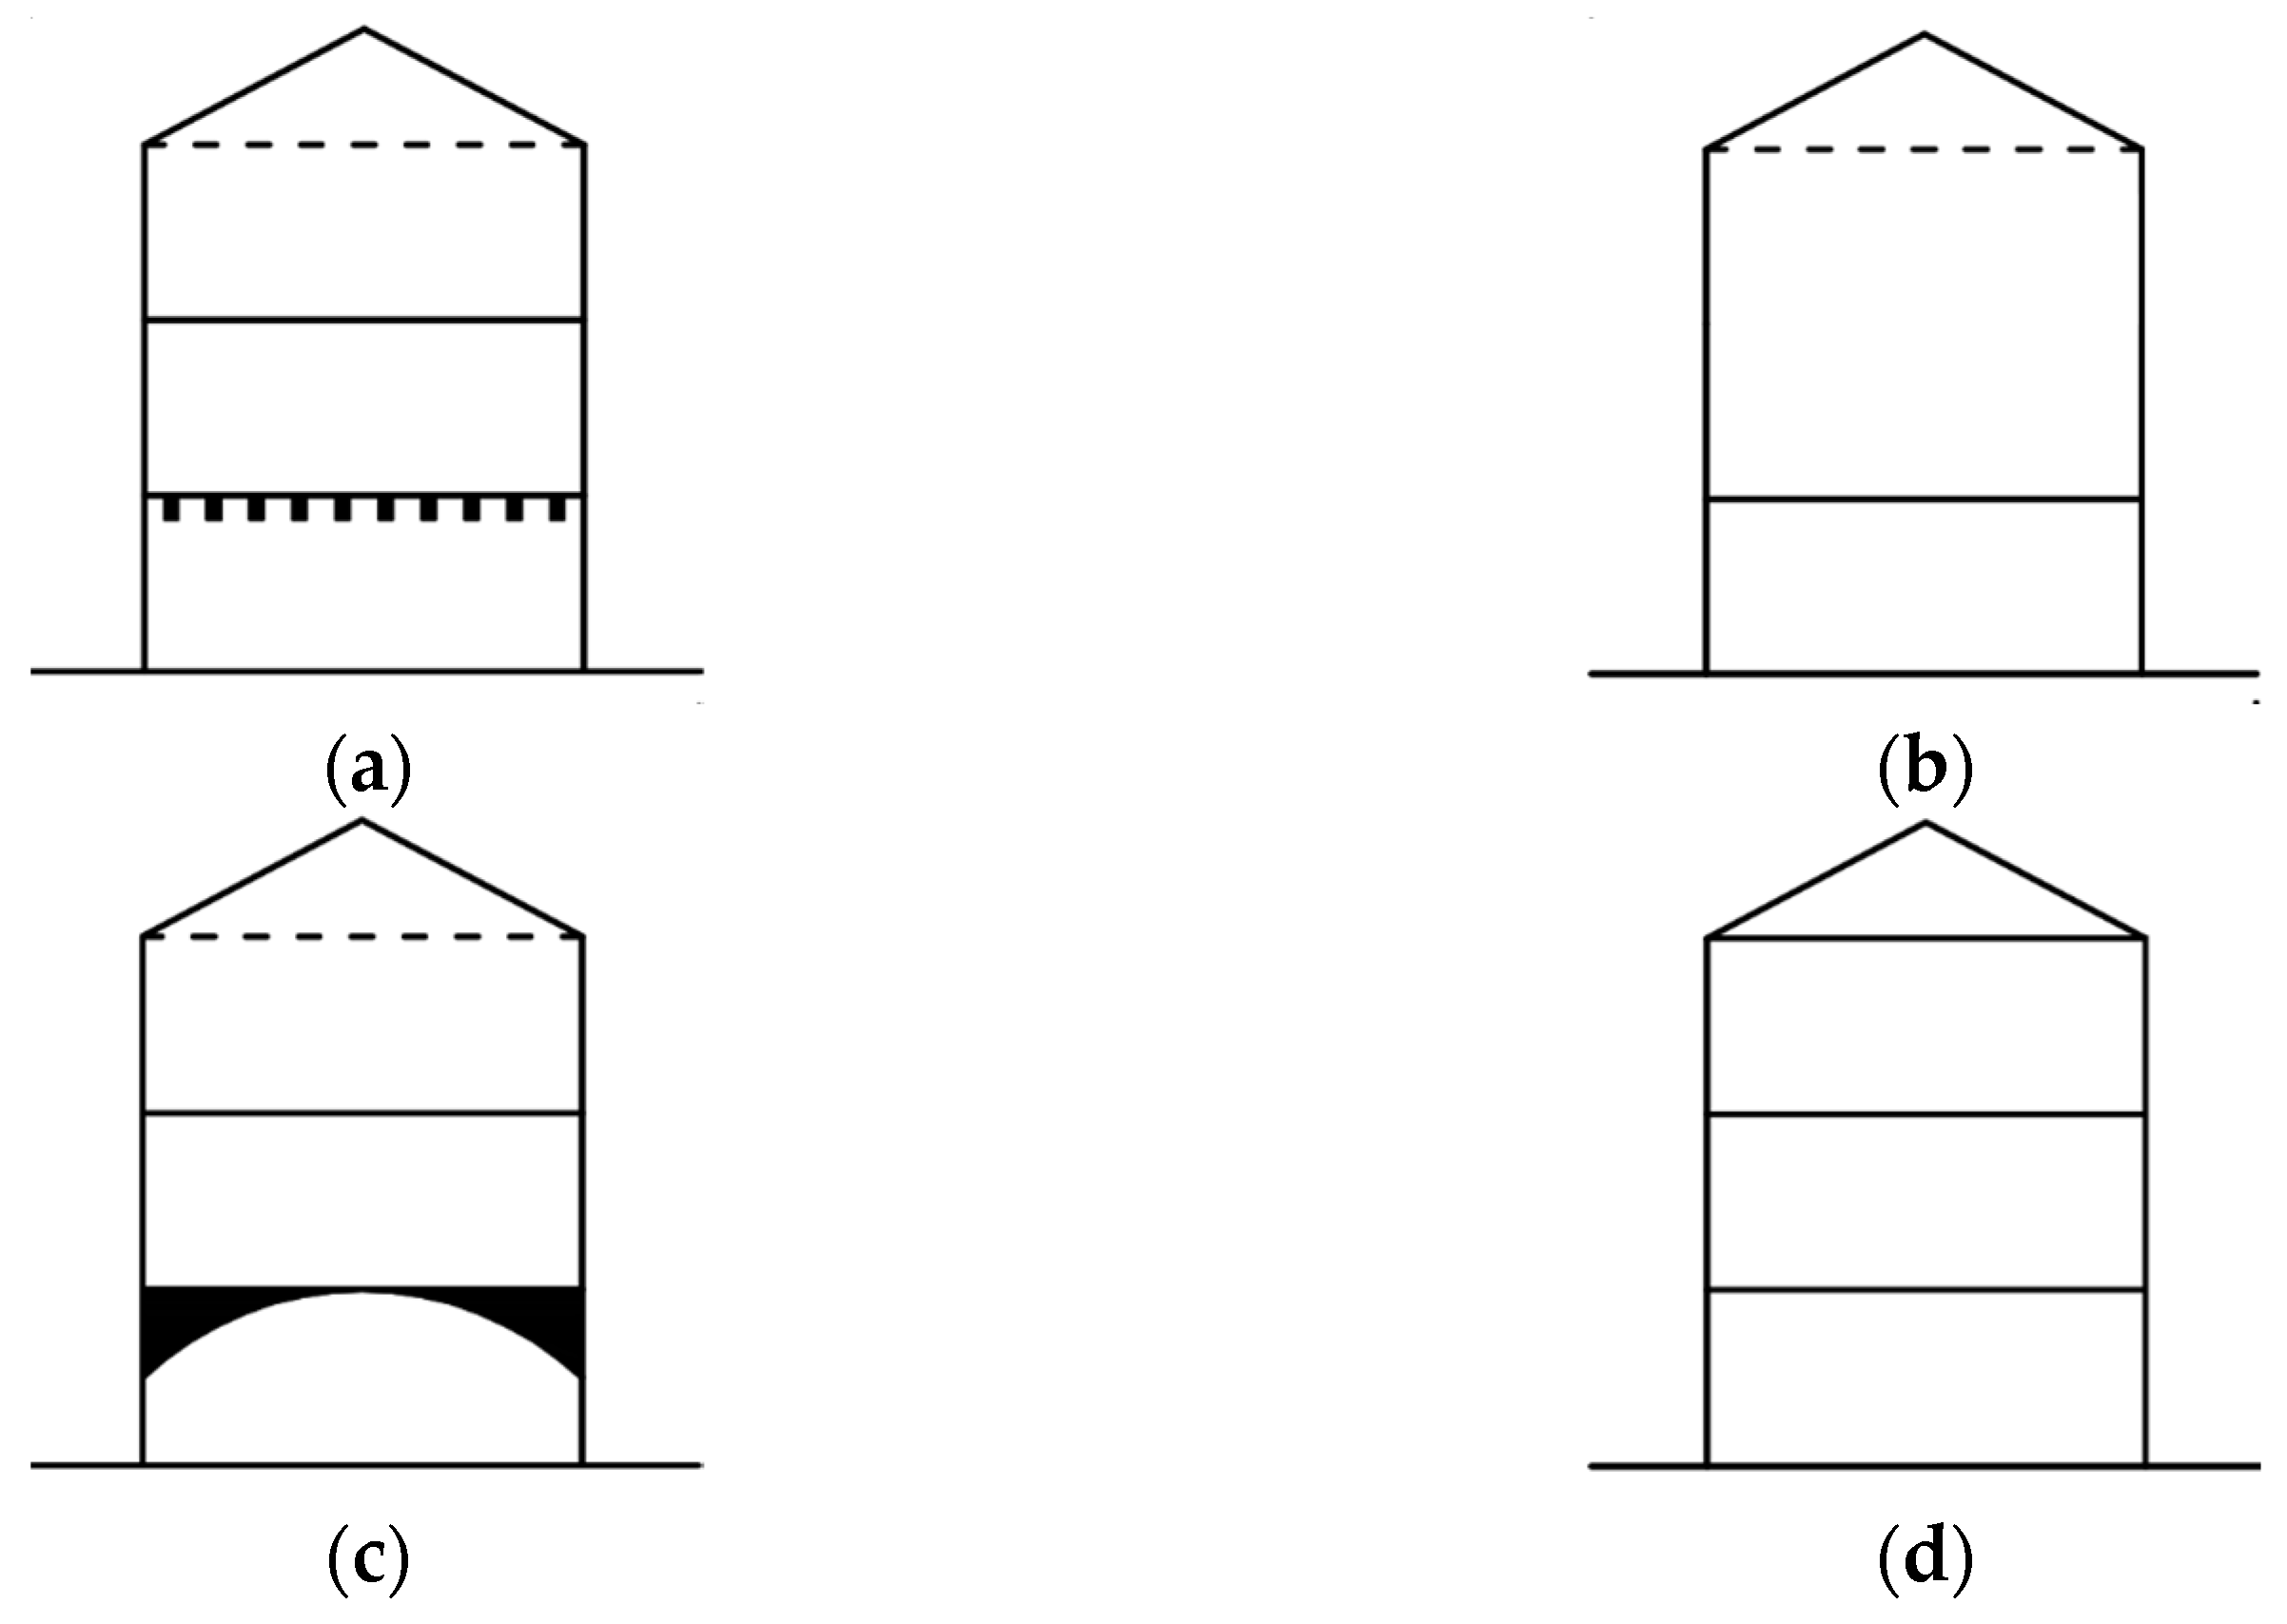
3.1. Out-of-Plane Index (VOP)

The out-of-plane index VOP represents the normalized OOP strength of a building. Vulnus considers a total of nine local mechanisms for each panel of the boundary walls of a building, distinguished among those that develop ‘vertically’ (i.e., those that span over one or more stories, see Figure 1, and across the floor slabs), and those that develop ‘horizontally’ (i.e., those that occur at story level, spanning between two consecutive internal walls, see Figure 2). The vertical mechanisms are the overall overturning of a panel (Figure 1a), considering the total building height, and the local overturning (Figure 1b) or vertical bending (Figure 1c) of the panel at the top story. The relative importance of a mechanism at the top story depends on the assumption of an inverted triangular distribution of seismic loads along the height, which therefore stresses the upper parts of a building. In the assessment, each masonry element is considered as simply supported by either the foundations or the internal floor slab, stabilized by the self-weight and partially restrained by connecting devices and the friction forces that develop at the interfaces between the wall and the slabs.
These restraint forces therefore depend on the floor load, the estimated friction coefficient, and the presence and the number of tie rods or tie beams at floor levels (Figure 3a). The activation coefficients are calculated separately as described in Equation (1), and then combined according to the rules expressed there, to determine which mechanism is the most probable. The combination rules are a consequence of the application of fuzzy logic to the values, as mechanisms 1b and 1c are interchangeable and any of them may occur (fuzzy logic OR, i.e., max{1b; 1c}), whereas the mechanisms 1a and any 1b or 1c can occur at the same time in a panel (fuzzy AND, i.e., min{1a; 1b–1c}). The final value is a partial index named V′OP. The same criterion applies to the calculation of V″OP.
The horizontal mechanisms are generally associated with the top story/plan (henceforth TP). Those directly involving the boundary walls are the horizontal bending (Figure 2a) and the crushing of masonry at the midsection (Figure 2b). The others are induced on the boundary walls by the thrust from the internal walls when these are loaded in their OOP direction by the earthquake (resisting arch in the thickness of the wall, see Figure 3b). These thrusts involve the intersections between the internal and the external wall (flanges). The possible mechanisms are the overturning of the flange either for the entire height of the building (Figure 2c) or for the TP alone (Figure 2d), and the vertical bending (Figure 2e) or the expulsion of the flange (Figure 2f). The activation of mechanism 2f is usually triggered when restraint forces at floor levels are low, as compared to mechanisms 2e–2d. Each panel is restrained at both ends by the tensile strength of the masonry cross section, in addition to the self-weight and the applied loads (Figure 3b). The partial index V″OP, associated with this set of mechanisms, is calculated through Equation (2), which also shows the combination rules of the mechanisms.
V OP = min 3 t 4 nh + nT W , m e c h . 1 a m a x n t h ( n 0.5 ) , m e c h . 1 b n t n ( n 0.5 ) 1 3 + 2 f t 3 ρ h , m e c h . 1 c
V OP = min m a x 0.5 f t t n ρ l 2 ( n 0.5 ) , m e c h . 2 a m i n 0.32 f c t ρ l 2 n 0.5 , m e c h . 2 b 6.4 T ( d 1 + d 2 ) ρ h l 2 + 4.8 t 2 d 1 + d 2 + 1.2 t ( t + l ) 2 nh l 2 , m e c h . 2 c 6.4 d l 2 t n h ( n 0.5 ) · m a x 2 + 4 d 1 t 1 + d 2 t 2 d t , m e c h . 2 d 1 3 1 + 2 f t ρ h 2 + 8 d 1 t 1 + d 2 t 2 d t 1 , m e c h . 2 e n n 0.5 t 2 f t ( h t ) ρ h ( l 1 t 1 + l 2 t 2 ) , m e c h . 2 f
where W is the weight of the wall; t and t′ are the wall thickness at the reference floor (see Section 4.1) and at the TP, respectively; n is the number of stories; T and T′ are the restraint forces exerted on the walls by floor slabs and the roof, respectively; ft and fc are the tensile and compressive strength of the material, respectively; ρ is the specific weight of the panel; h is the average floor height; d, d1 and d2 are the distances from the closest window to a node at a T intersection of the boundary walls; and l, l1, l2 are the lengths of the walls converging in a node. For additional explanations of the formulas, the reader is referred to [33,76]. The specific weight ρ also includes the floor loads, as per Equation (3).
ρ = ρ m 1 A f A p + q f A mur h A TOT
where ρm is the specific weight of the masonry, Af is the total area of the openings (conventionally assumed to be as tall as half of the average story height), Ap is the vertical surface of a panel, qf is the floor load, Amur is the total area of the walls and ATOT the total gross area of the building. The restraint forces are proportional to the floor loads through the friction coefficient and the number of tie rods, the effect of which is spread over the length of a façade and the overall height (Equation (4)).
T X , Y = 16   s X , Y n   l X , Y + μ r   n t n A TOT q f + q r 2   l X , Y
where s is the number of tie rods in a façade, n is the number of stories, l is the length of the façade, μ is the friction coefficient, nt is the number of floors with tie beams, r is the depth of the tie beam divided by wall thickness, and qr is the roof load. The subscript X,Y refers to the fact that the values of T are specific to those directions of the building. Finally, the overall VOP for the building is the minimum of that summation for the i-th wall (Equation (5)).
VOP=min{V′OP,i + V″OP,i}

3.2. In-Plane Index VIP

The in-plane index VIP expresses the overall shear capacity of a building, normalized to its weight, per each main direction. This is a rather simplified evaluation, as it considers just the simultaneous diagonal shear failure of all piers, independently from the masonry type and cross section. However, as the reference floor is generally the ground one, the vertical stress in piers can be high enough to determine a prevalence of diagonal shear failure on IP bending. Other assumptions of this calculation include an almost regular layout of openings on the façades; IP rigid floors, so that they can redistribute the seismic loads; no interaction in the repartition of seismic loads between orthogonal directions; and shear capacity proportional to a pier’s cross section. Consequently, the shear capacity is obtained from the cross section of the walls parallel to either of the main directions of a building (X or Y) and the shear strength of the material, as expressed by [77]. The corner area contributes to the capacity in both directions [52]. The gross weight of the building is calculated from the area of the walls (average value between the RP and the TP) and the total floor load, repeated over the number of stories. Their ratio is expressed by Equation (6).
V IP , i = f t 1.5   σ 0 1 + σ 0 f t i A i k   A t
where σ0 is the average vertical stress in the walls; ∑iAi is the total resisting area of the walls in a direction; At is the total net area of the walls in both directions; and 1.0 ≤ k ≤ 1.1 is a reducing factor accounting for plan irregularity. VIP is then assumed as the minimum between the two directions of the building (Equation (7)).
VIP = min{VIP,X; VIP,Y}
The wall thickness is reduced for masonry panels which are shared between two adjacent buildings, proportionally to their height [33].

3.3. Qualitative Vulnerability Index VV

The index VV is obtained from an adaptation of the GNDT-2 method. It includes the qualitative aspects of a building and overall represents the progress of damage, with the rule being that the higher the index, the higher the expected damage [78].
The GNDT-2 method considers eleven vulnerability factors (VF, Table 1) which were assumed to be those most influencing the seismic behavior of a building. Each VF can be attributed to a ‘quality’ class (from the best—A—to the worst—D–), which corresponds to a score vi (Table 2), and the weights account for the relative importance of the VF (Table 1). Each VF is influenced by one or more parameters accounting for the state of a building, e.g., the Overall Organization depends on the presence, total figure, and distribution over the stories and the two main directions of a building, and connection devices such as tie beams and tie rods. The screener is guided in the choice of the class by rules over a set of parameters which can be described by geometrical information (e.g., cross section area, length, height), dimensionless ratios (e.g., slenderness), Boolean options (True, False), or single choices in a set of linguistic variables. Since the first proposal of the method, Ferrini et al. [52], systematically defined the rules by which the class of the VF can be determined, accounting for the empirical observations of the Umbria-Marche (1997) and Garfagnana (2001) earthquakes, e.g., the detrimental effects of rigid floor slabs on poor quality masonry walls [79].
The scores vi, assigned to the VFs on the basis of their quality class, are linearly combined through the weights wi listed in Table 1, whose values reflects the importance attributed to each VF for the overall behavior. The sum can be normalized to the maximum value to obtain a Vulnerability Index Iv (Equation (8)).
I v = i v i w i 438.75
Iv accounts for the overall state of a building. However, in Vulnus, VIP matches to the parameter Normalized Shear Strength and considers the Plan Irregularity, and VOP corresponds to Overall Organization and the maximum distance between Transverse Walls. Therefore, some VFs are neglected in calculation, and different weights wi,Vulnus are chosen (Table 1). Similarly, the scores vi,Vulnus are simplified as shown in Table 2 and the resulting normalized index Vv is calculated through Equation (9).
V v = i v i , Vulnus   w i , Vulnus 141.75
A null or negligible value of Iv-VV stands for a new building, where code previsions and good construction practices have been applied.

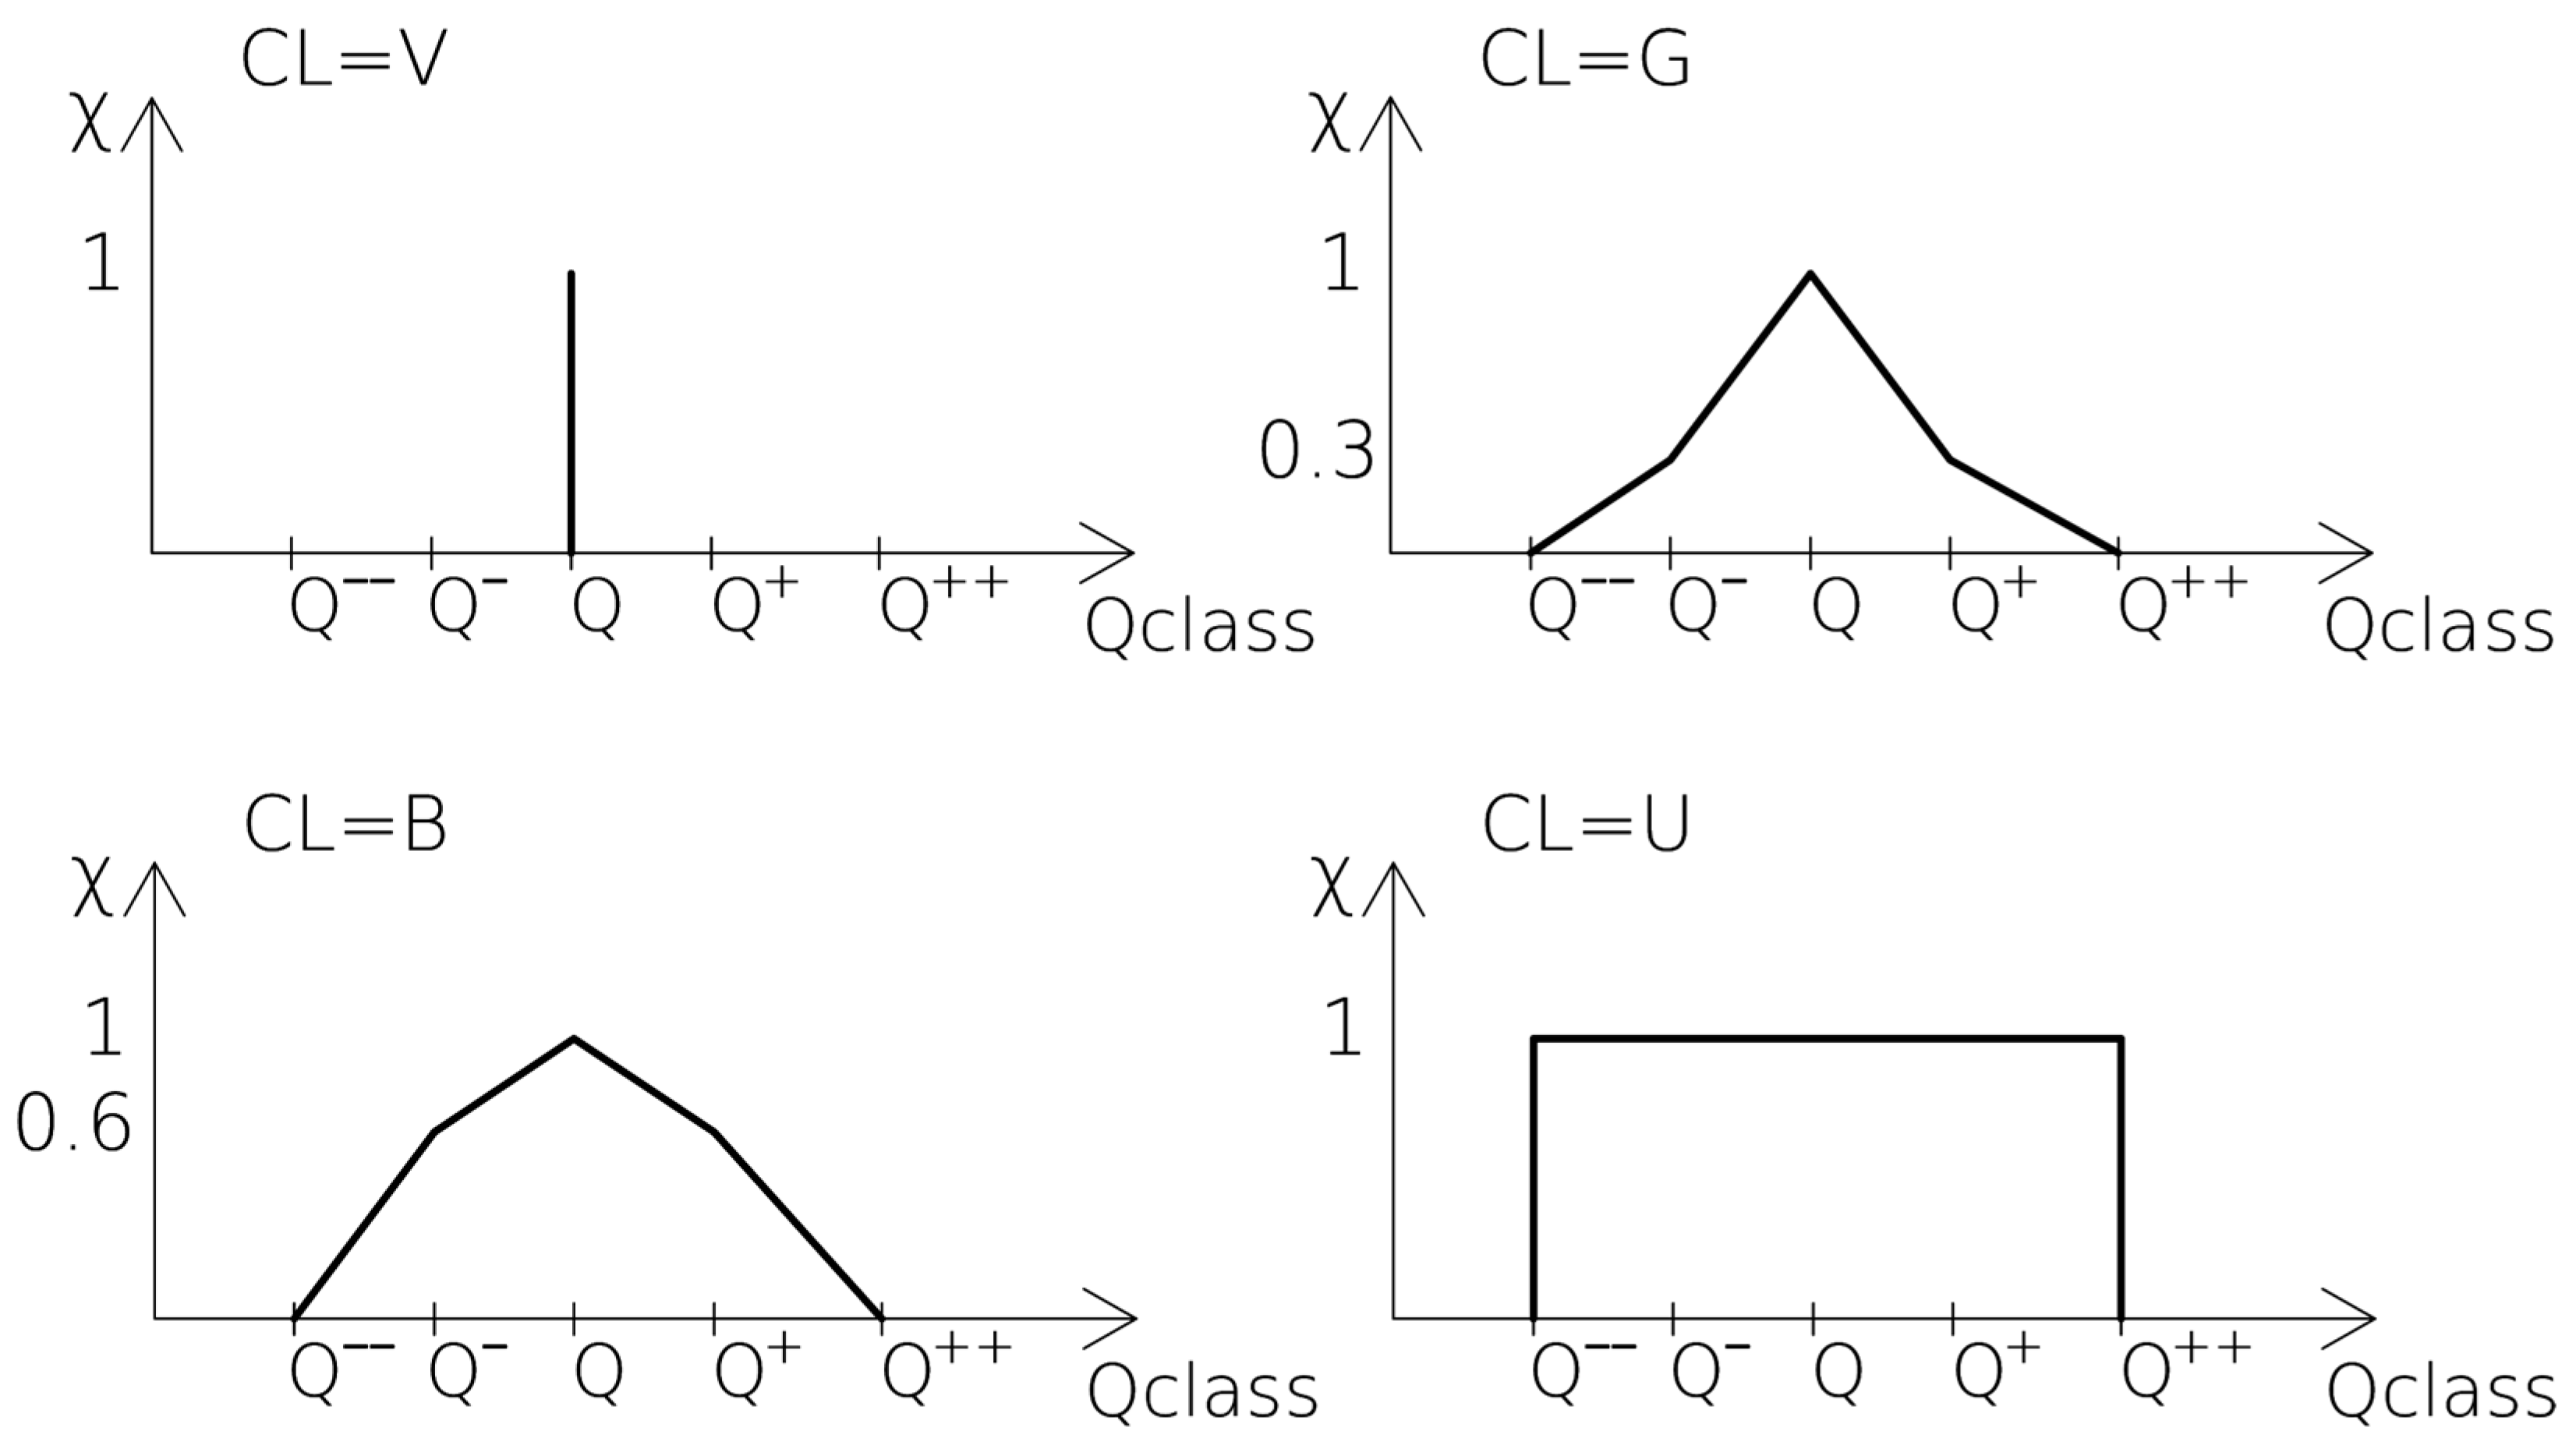
3.4. Confidence Management and Application of Fuzzy Logic

The GNDT-2 method requires the screener to express a ‘partial confidence factor’ for each vulnerability parameter as a function of the available information upon which the vulnerability assessment is built. This confidence level (CL) can be expressed as: (i) Very good (V); (ii) Good (G); (iii) Basic (B); (iv) Unknown (U), and it depends on the sources and the methods chosen or available for the evaluation of each factor (Table 3).
The CL describes the reliability of the assessment of a VF: ‘V’ means that the class selected is the only possibility; ‘G’ that there is a 30% probability that the actual class is one the first closest (better or worse) to that selected; ‘B’ implies that this probability is increased to the 60% and there is also a 30% probability that the actual class is the second closest to the value. Finally, when ‘U’ is chosen, any of the four quality classes can be selected. This uncertainty in the vulnerability assessment can be formally represented through the membership function of the fuzzy subsets, as shown in Figure 4. The X axis represents the GNDT-2 quality class Q (increasing from left to right, from Q−− to Q++), and the Y axis the probability of belonging (membership, χ) to any of the classes according to the CL. Actually, in the GNDT-2 method there are only four quality classes, so the graphs are accordingly cut vertically, depending on the position of the selected class (Q). It is worth noting that the membership functions presented in Figure 4 are an extension of the original proposal [78].

3.5. Vulnerability Model and Damage Probability Curves (Fragility)

A preliminary measure of the vulnerability of a building can be obtained by comparing its indexes VOP, VIP, VV with an input acceleration A (per unit g), expected for the site on a normative or historical basis. Considering the mechanical indexes VIP and VOP, a ‘vulnerability function’ Vu can be expressed as per Equation (10) [56].
Vu = 1 if VIP < A OR VOP < A
Vu = 0 if VIP > A AND VOP > A
That is, vulnerability is high when at least one of the two indexes is lower than the reference acceleration A and the building is expected to be substantially damaged. Conversely, Vu is close to 0 when both the indexes are greater than A and negligible or slight damage to the building is expected.
However, Equation (10) neglects (i) the interaction between the two indexes; (ii) the uncertainties related to the model; and (iii) the influence of qualitative parameters. The fuzzy set theory was introduced to overcome these problems, and the vulnerability Vu was defined as a continuous function of the three indexes VOP, VIP and VV. The vulnerability function Vu can thus be assumed as the probability of a building suffering substantial damage. It ranges between 0, which represents the ’safe‘ condition (i.e., no substantial damage expected), and 1, which represents the ’unsafe‘ one (i.e., substantial damage expected). The probability of membership in the unsafe zone is then expressed through Equation (11) [33,59].
V u = 1 , u 0 1 u 1 a + 1 , 0 < u < 1 0 , u 1
where u represents the interaction between VIP and VOP (assumed as hyperbolic):
u = c 3 + c 1 c 2 + V IP A c 1 V OP A   c 1 2 c 3 + a c 4
In Equation (12), the parameters c1, c2, c3 and c4 define the crisp boundaries of the model (Figure 5); c1 and c2 characterize the interaction between VIP and VOP, whereas c3 and c4 define the maximum extent of the transition zone between the safe and the unsafe areas. Their values are, respectively, c1 = 0.5 (asymptote of the hyperbolic function), c2 = 1 (representative of the condition in which VOP/A or VIP/A are equal to 1, thus defining the unsafe boundary), c3 = 0.1 (model uncertainties) and c4 = 1 (which, summed to c2, hypothesizes negligible damage when the IP and OOP capacities of the building are at least twice than A) [33,49].
Finally, the coefficient a in [0; 1] is closely related to the qualitative VV index and influences the width of the transition zone. For a = 0, i.e., the best qualitative configuration of the building (new one), the transition zone is defined by only the mechanical model uncertainties; in the case of a > 0, the transition zone grows larger as VV increases [33].
Figure 5 shows graphically the vulnerability model expressed by Equations (11) and (12). The plane defined by VOP/A and VIP/A is thus divided into an ‘unsafe’ zone (Vu = 1), bounded by the hyperbole defined for u = 0, and a ‘safe’ zone (Vu = 0) bounded by the hyperbole defined for u = 1 (thick dashed lines); the transition zone, where the probability of membership to either of them is affected by the values of VV through a (thin dash–dot lines), is according to the fuzzy set theory. Once the fuzzy sets of the three variables VOP, VIP (based on A) and a (dependent on VV) have been obtained, the fuzzy set of the range of variation of Vu (from 0 to 1) is derived. Therefore, the model provides, given the acceleration A due to an earthquake, a measure of the probability of damage, i.e., the cumulative probability of a building suffering substantial damage, which is the expected frequency of such damage occurring.
By using the fuzzy sets of Vu, Vulnus derives three boundary cumulative probability distributions: a lower and an upper bound, and a central one (the particularly significant value). When setting up the analysis for discrete values of A, the program returns the vulnerability via the upper bounds (Upper Bounds—U), lower bounds (Lower Bounds—L) and the central value (White—W) of the expected fragility [61]. These curves could be referred to a damage state (DS) intermediate between DS2 (moderate) and DS3 (substantial) [65], which corresponds to the first activation of a local mechanism.

4. Vulnus Structural Model and Usage

The Vulnus data collection form (Appendix A) acquires the identification and other generalities of a building, i.e., (i) the features of the loadbearing system relevant to seismic loads to build a simplified structural model based on minimum information about its features, loads and materials (Section 4.1); (ii) the vulnerability factors and the parameters that determine them (Section 4.2); and (iii) the overall geometrical and structural layout of the building (Section 4.3). The input data correspond to free text fields, single choices, or tables, which must be filled in progressively. The conversion to tabular form largely reduces the computational effort and simplifies data storage and management, although a user is entrusted with the creation of the scheme and the manual filling in of the tables needed.

4.1. Structural Model

Vulnus models a building as a Structural Unit (SU), that is, an individual structure with the same loadbearing system and the continuity of vertical loads from roof to foundations [80]. Consequently, town blocks (Figure 6a), where there are horizontal additions with different structures or heights, should be subdivided into SUs, but this is also true of large buildings (Figure 6b), which may be considered as a single SU (e.g., hospitals, schools, apartment buildings) but can be divided into smaller units which are homogeneous from either a structural or constructive point of view. This is a different approach from that of [13], where adjacent SUs are considered as an individual building. Limited vertical and horizontal irregularities in detached buildings (Figure 6c) may be ignored.

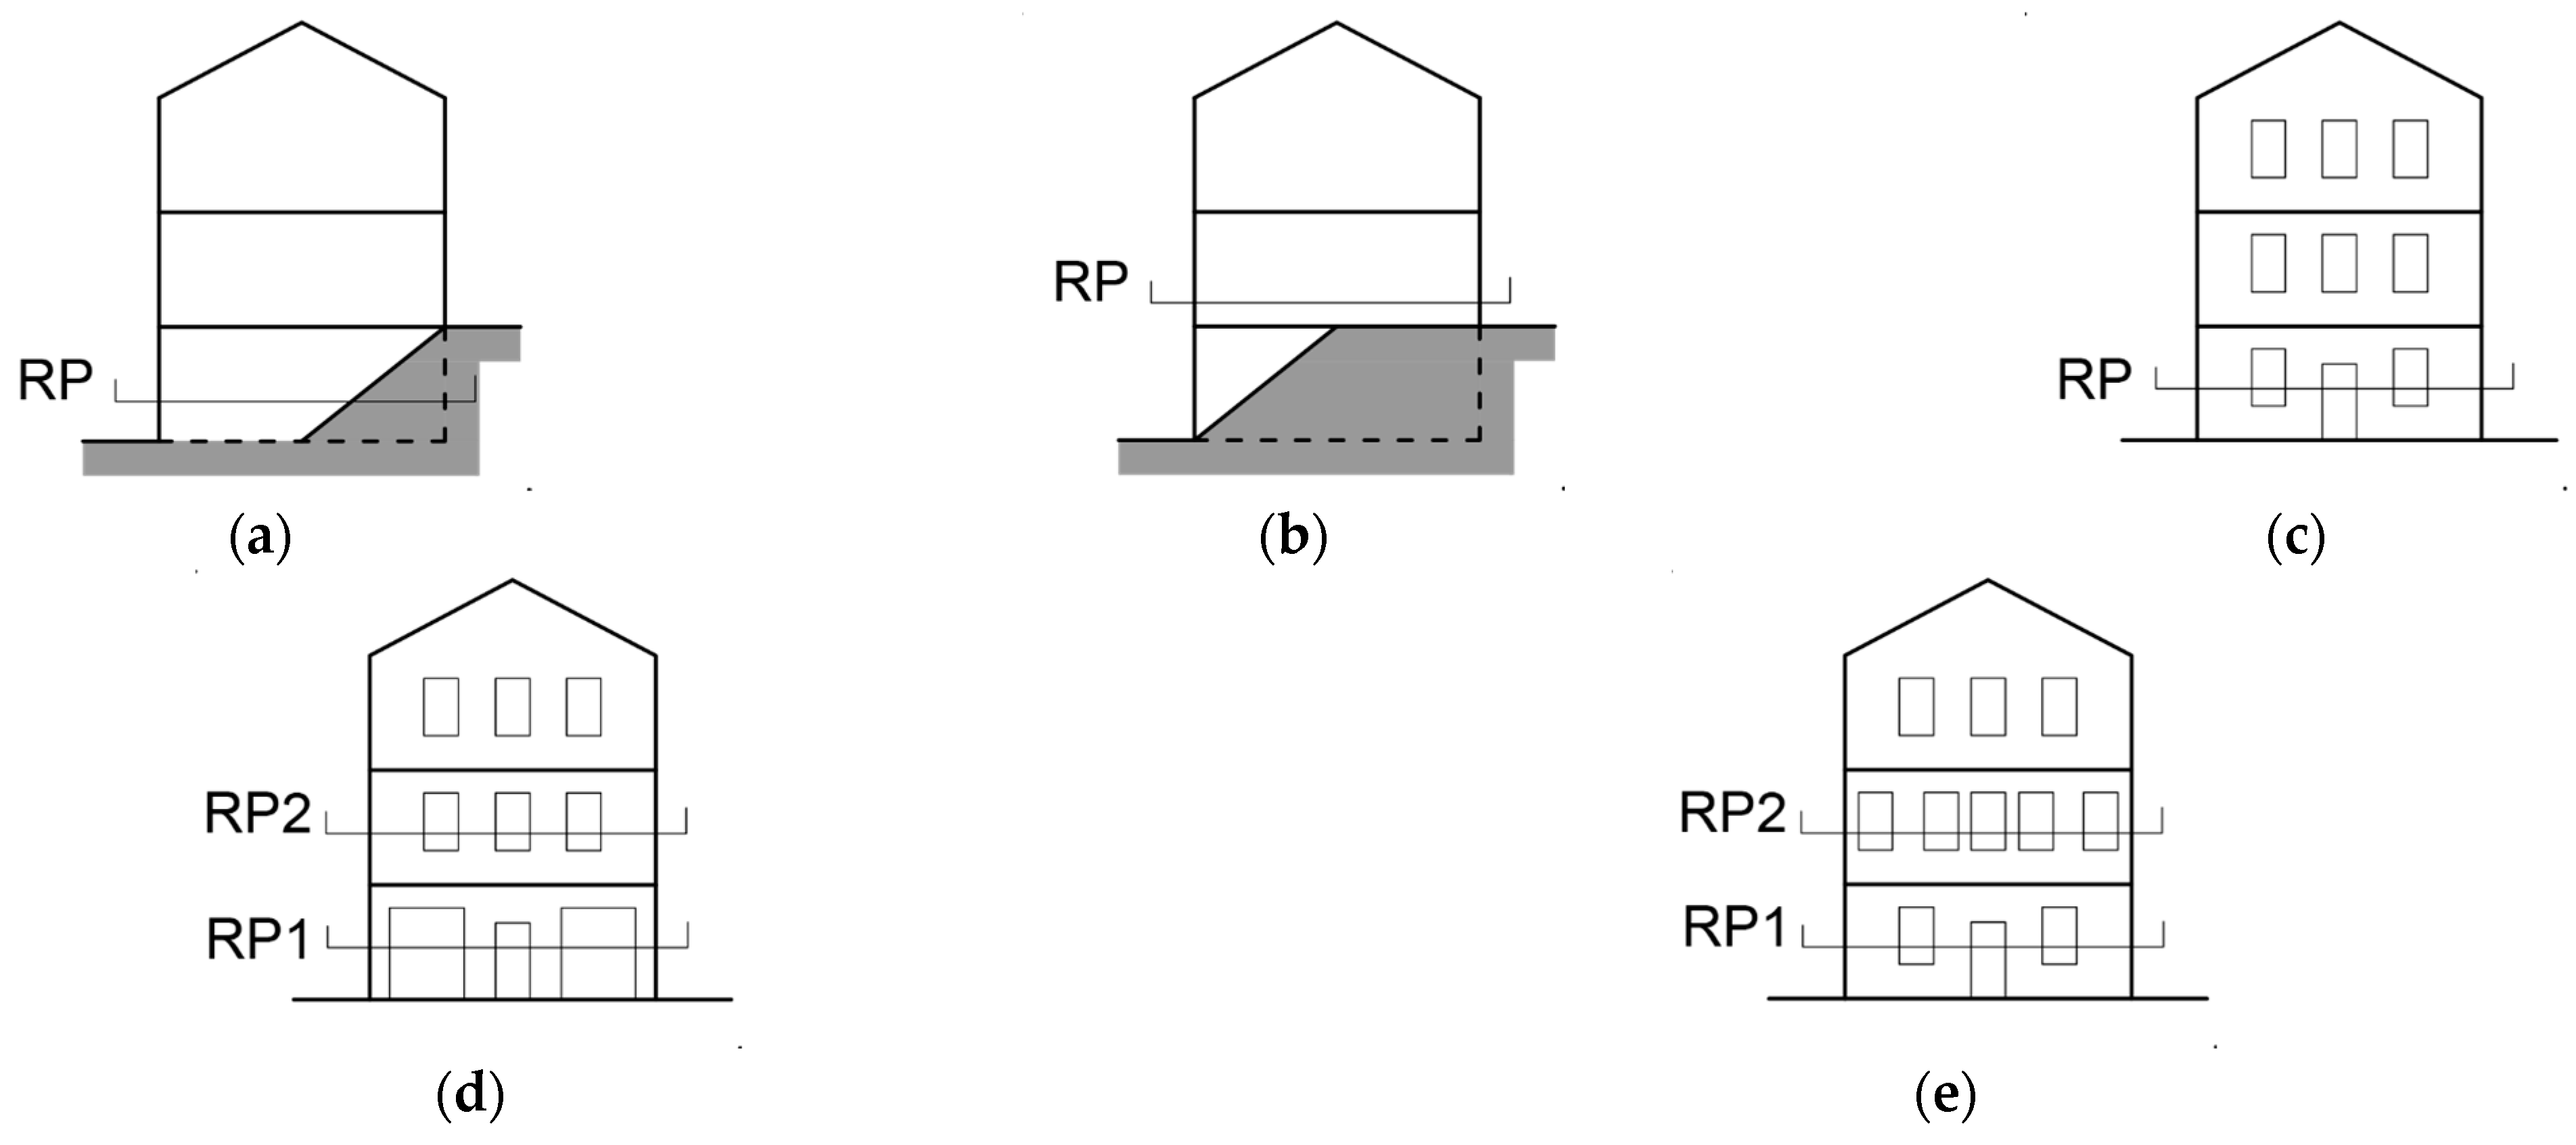
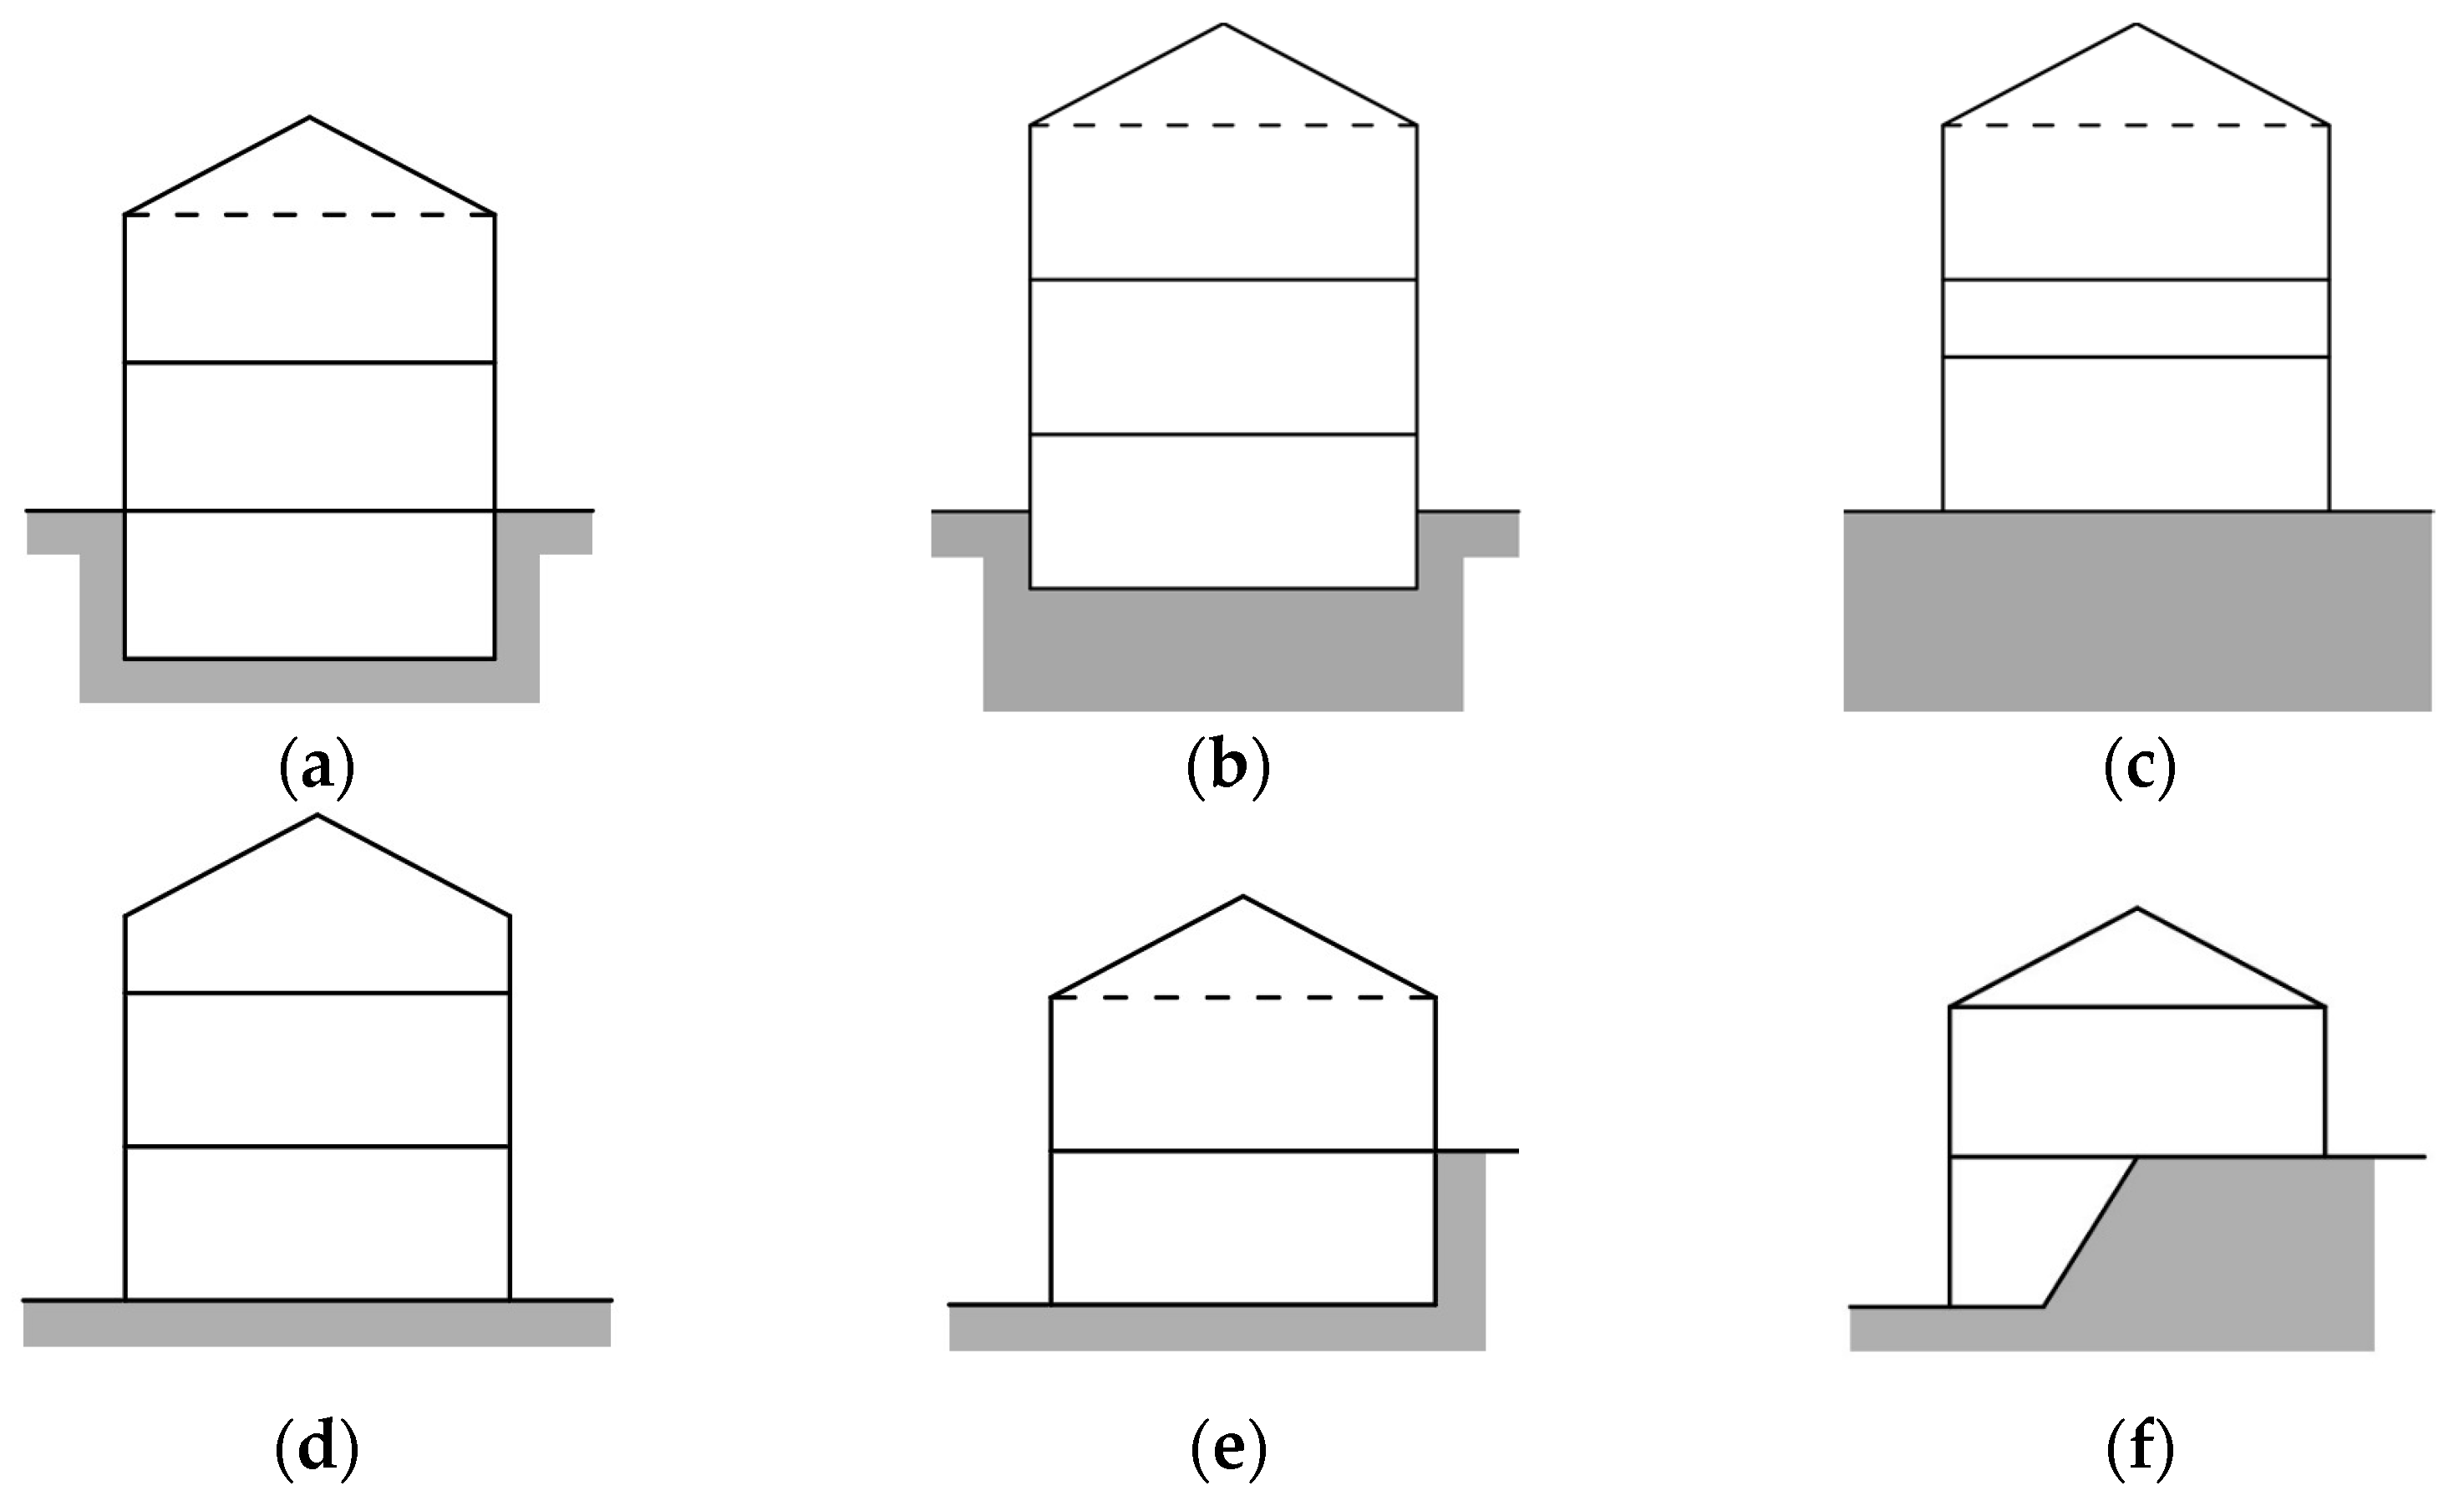
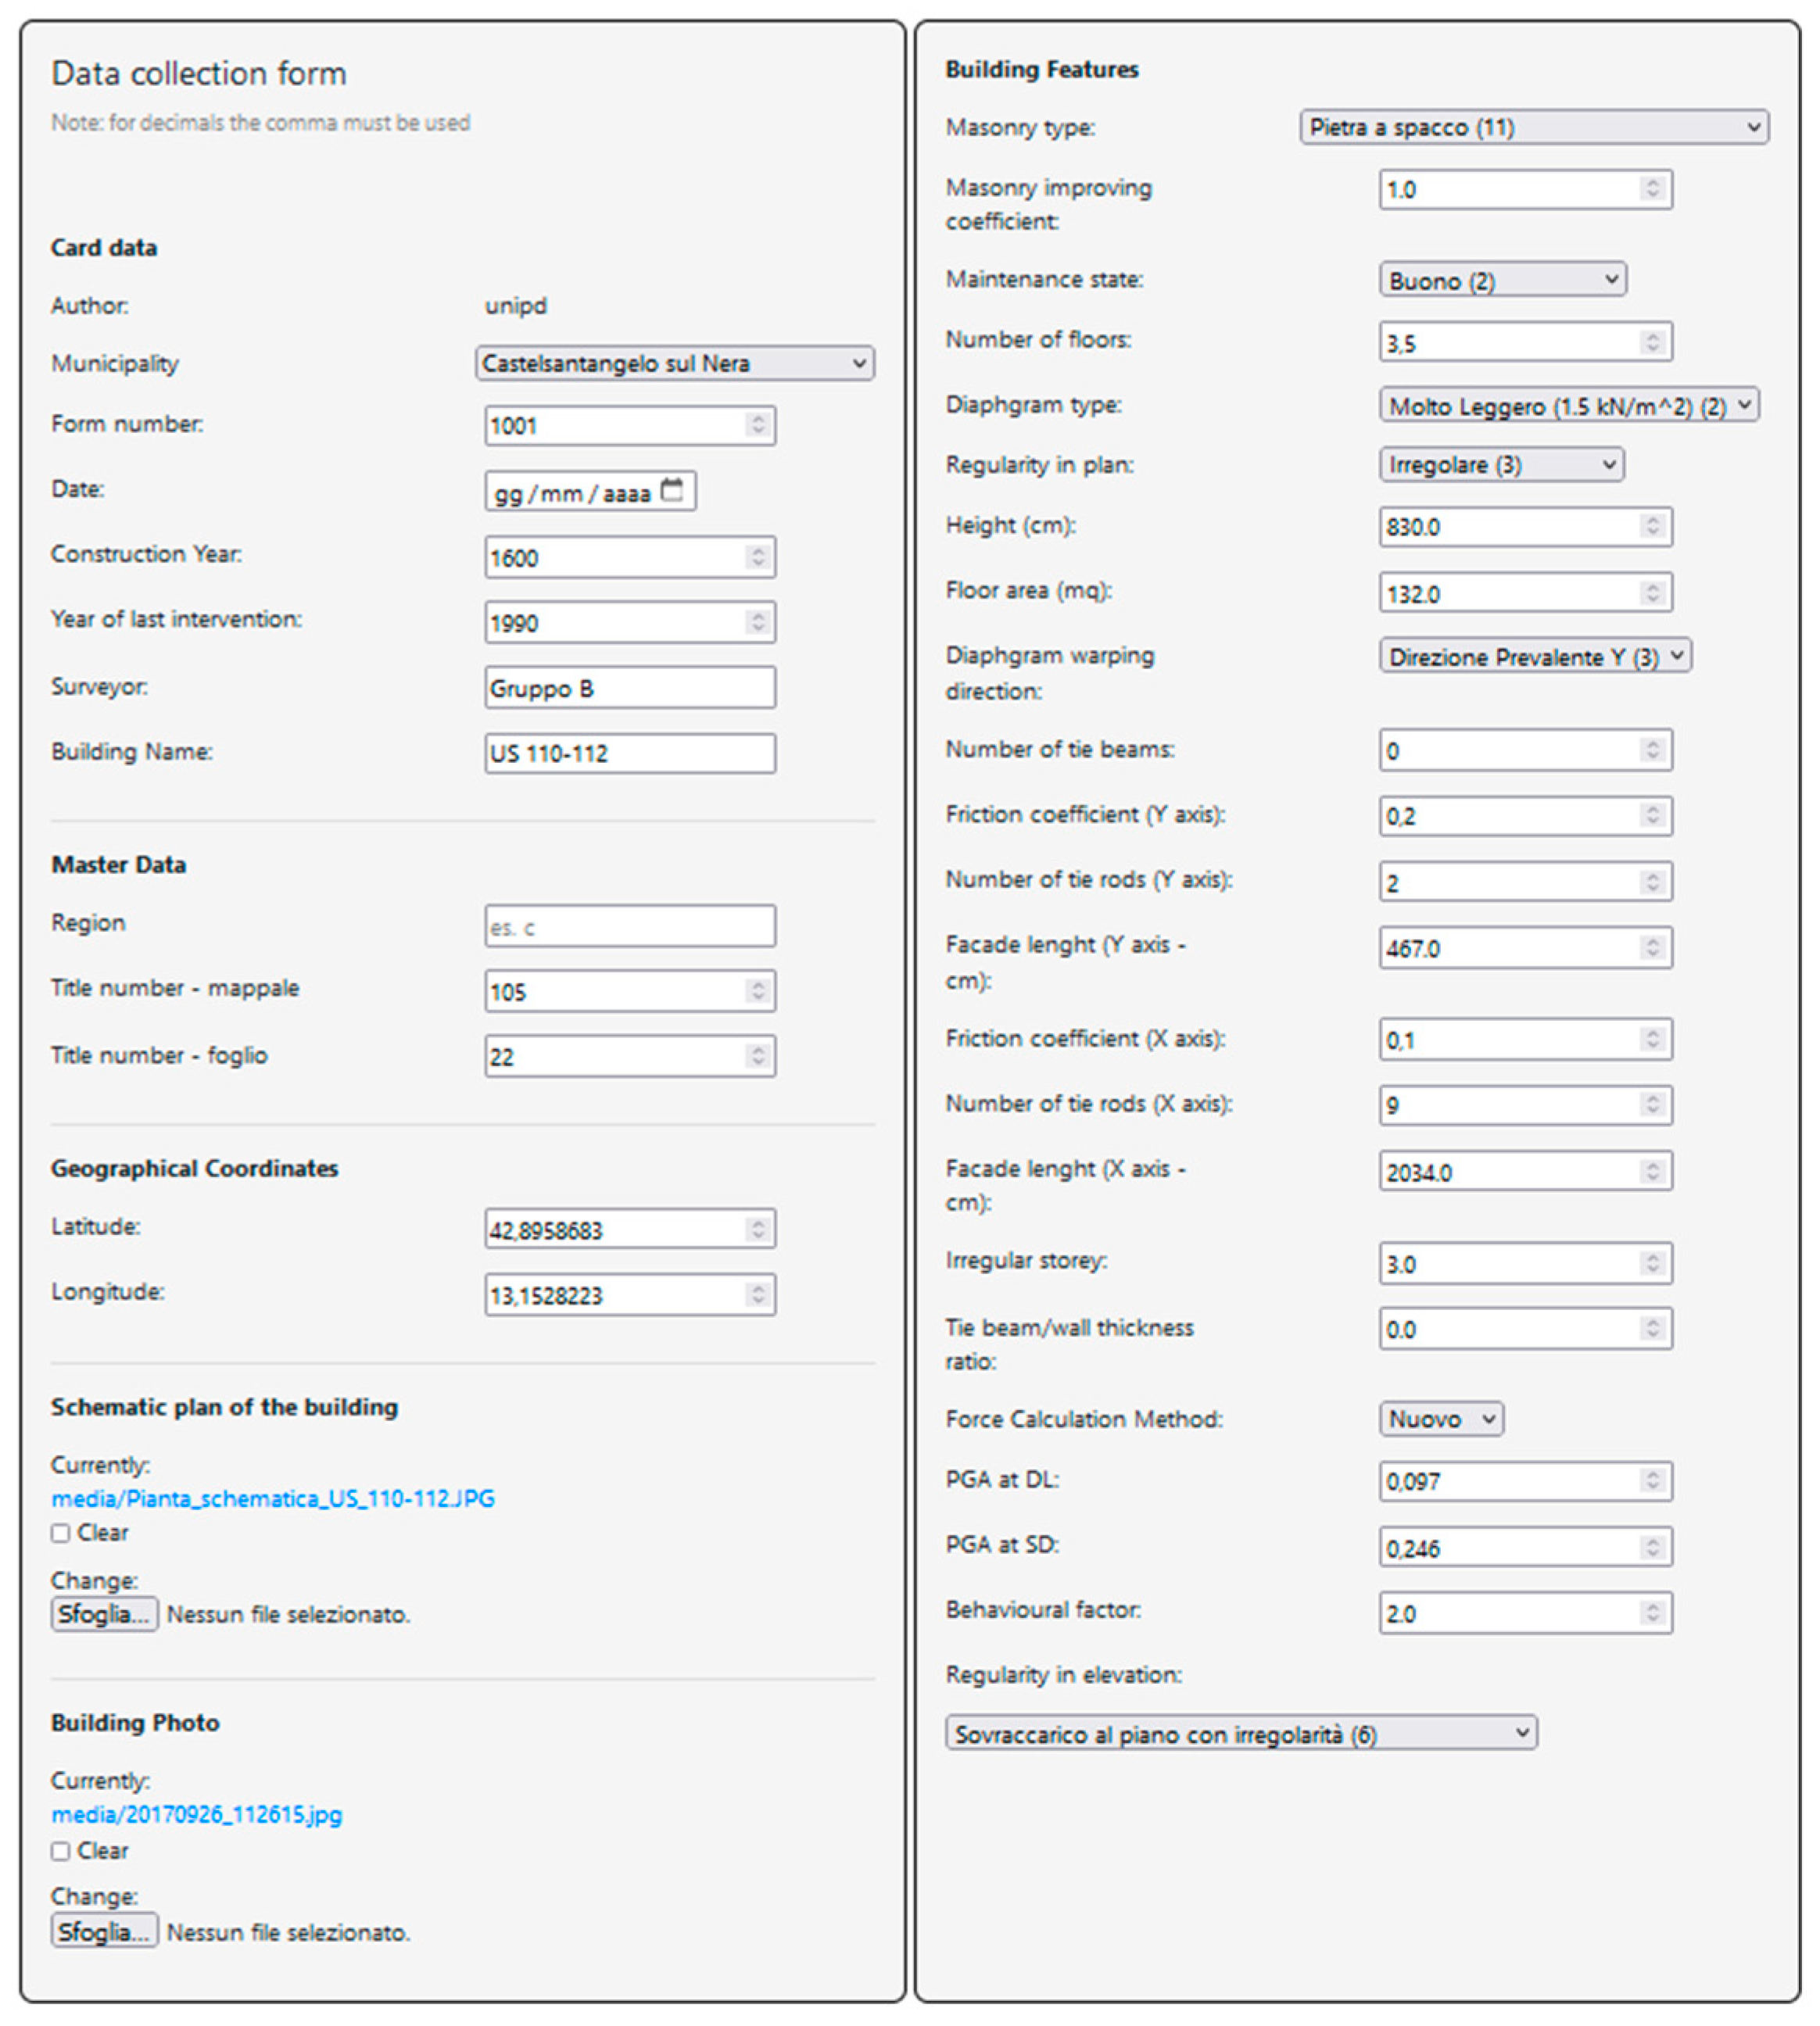
4.1.1. Overall Geometric Data

The model assumes a ‘reference plan’ (RP) which becomes the floor type, repeated at each story of a building (Figure 7). The RP is usually the ground floor, where seismic forces are the highest. When an intermediate floor appears weaker (e.g., owing to large openings) or the ground floor has a different layout from the upper stories, it is possible to compare the different layouts and identify which configuration is the most critical. On sloping sites, the RP can have no more than one side completely underground and two others covered by less than 1/3 of their length. The RP also determines the reference axes, as the two main directions of the walls. The geometric data of the RP are inputted to Vulnus according to the criteria given in Section 4.3 and applied in Section 6.1.
With reference to the calculations presented in Section 3.1 and Section 3.2, the following geometric inputs are requested: (i) the floor area, as the total footprint of a building on the ground comprising the boundary walls or a half of them, when they are in common with adjacent buildings; (ii) the length of the façades, as the total linear projection of the plan in the two main directions of a building; (iii) the height from the level of the RP to the eave line; (iv) the number of stories, which is usually that of the floors above the assumed RP. Local variations of the height, e.g., due to technical volumes, storerooms or penthouses, especially if they extend over a portion of the total floor area, can be neglected. The number of stories may not be an integer, to take into account: (i) basements and below-grade floors which emerge for no less than ½ of their height (Figure 8a,b); (ii) mezzanines or stories with a relevant difference in height form the other stories above and below (Figure 8c), a situation which may be observed in palaces and large buildings. Habitable lofts with boundary walls that have windows, a minimum height of 1.2 m and almost the same thickness of the story below count as half of a story (Figure 8d). On sloping sites, stories may be counted only when they are underground for no more than one side (Figure 8e,f).

4.1.2. Floor System

The dead loads of floor slabs (structural, g1, and non-structural, g2) must be chosen from the types listed in Table 4. In calculations, the additional g2,eq = 0.4 kN/m2 accounts for internal partitions, whereas live loads q are assumed as for residential buildings [80]. These loads are combined according to Equation (13).
E = g1 + g2 + g2,eq+ ψ02q
where ψ02 = 0.3 is the load combination factor prescribed by [80] in seismic conditions. For the sake of simplicity, in roofs, the partitions are neglected and ψ02 = 0, assuming that they are not accessible during the common use of a building. Therefore, the roof load reduces to E = g1 + g2.
The overall vertical and the plan regularity are considered in the qualitative vulnerability assessment (see Section 4.2), but the conditions of the floors also affect the mechanical indexes. The warping direction of the floors and the distribution of masses over the height of a building determine both the vertical stress, and thus VIP, and the restraint forces on the masonry walls, and thus VOP. The warping direction is assumed as the most common direction of floor joists inside a building, with respect to the X-Y axes of the RP. The prevalence in either of the two depends on having more than half of the joists in the same direction, otherwise the floors are identified as bidirectional. As for the mass distribution, the floor where any of the following conditions appear are considered: (i) changes in the warping direction of the floors (Figure 9a); (ii) double-height floors (Figure 9b); (iii) changes in the structural type of the floors or additional load at a story (e.g., heavy non-structural ceilings, vaults; Figure 9c); and (iv) habitable loft with a structural floor slab just beneath the roof (Figure 9d). In cases (i) and (ii), the stress distribution is altered, and the restraint forces are reduced; in cases (iii) and (iv), the load increases by considering the following load category. However, it is possible to indicate just one story as different from the others.
To complete the information about the floor system, the number of stories over the total which are bordered by r.c. tie beams is requested, as well as the total number of effective tie rods in each direction of the building. Obviously, tie rods parallel to a direction will affect the restraint forces in the perpendicular one, whereas tie beams influence both directions.

4.1.3. Masonry Type

The masonry types used for the structural model are those listed by [81] (Table 5). When multiple masonry types are observed in the loadbearing walls of the RP, the weaker one can be considered when it extends for more than 1/3 of the total resisting area. It is also possible to include the effect of strengthening interventions in the walls (e.g., repointing or grouting), through a multiplying coefficient which is assumed from those also allowed by [81] as a function of the masonry and the intervention type.

4.2. Vulnerability Factors and Overall Descriptors

The overall description of the vulnerability of a building is obtained from the GNDT-2 method, according to the factors and the criteria described in Section 3.3. In Vulnus, this information also concurs with the definition of the structural model, since the maintenance state and the plan regularity, when classified as poor, determine a reduction in the mechanical properties of the material (Table 6). The plan regularity depends on the shape of the plan (e.g., rectangular, L, T) and on the ratio between the two dimensions of the main building and the ratio between the length of its larger dimension and that of the ‘flange’ [52]. When SUs are part of a town block, it is suggested to classify them as ‘irregular’ to account for possible interaction effects. The maintenance state depends on the degradation of masonry induced by weathering and cracking, statically determined or seismically induced [52,82].

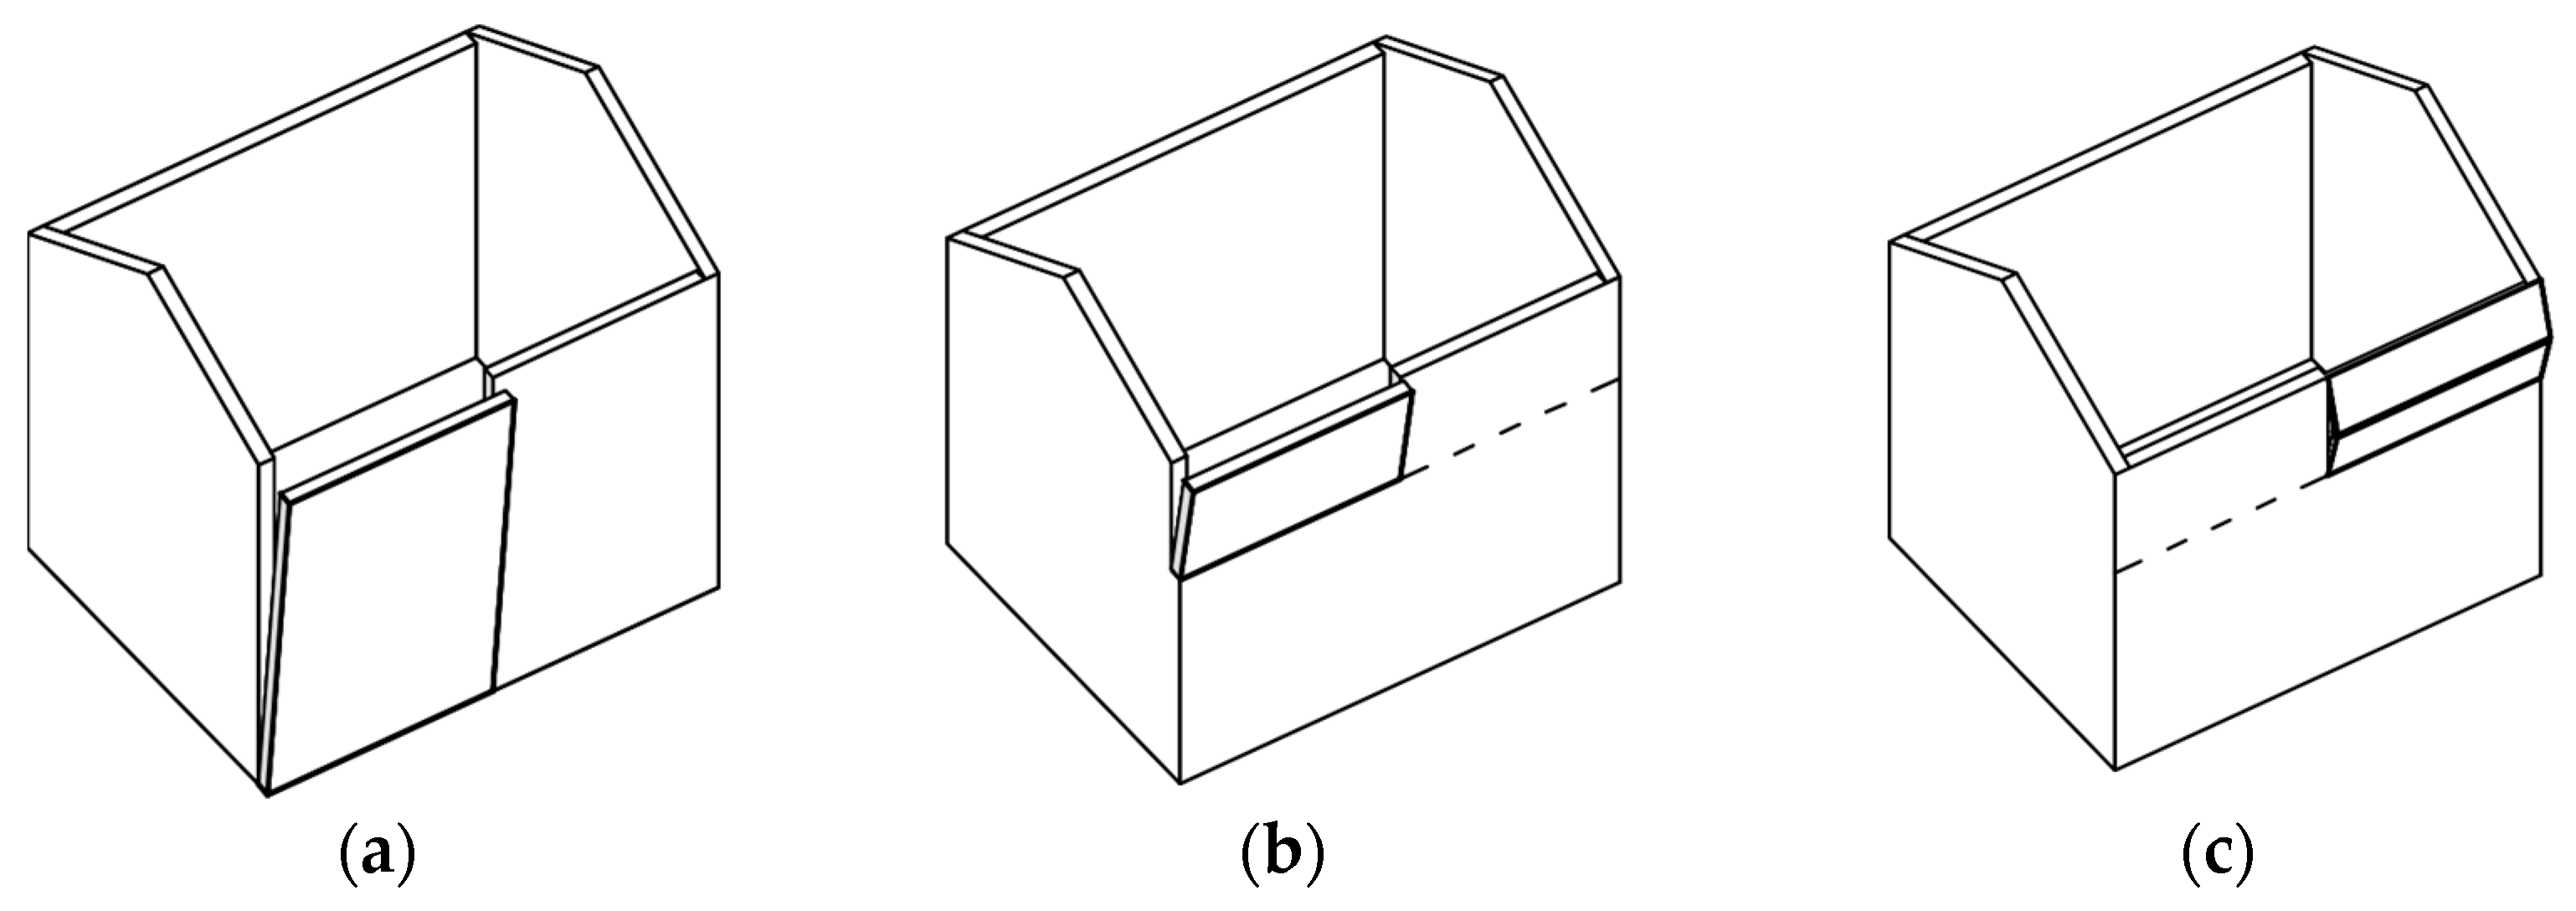
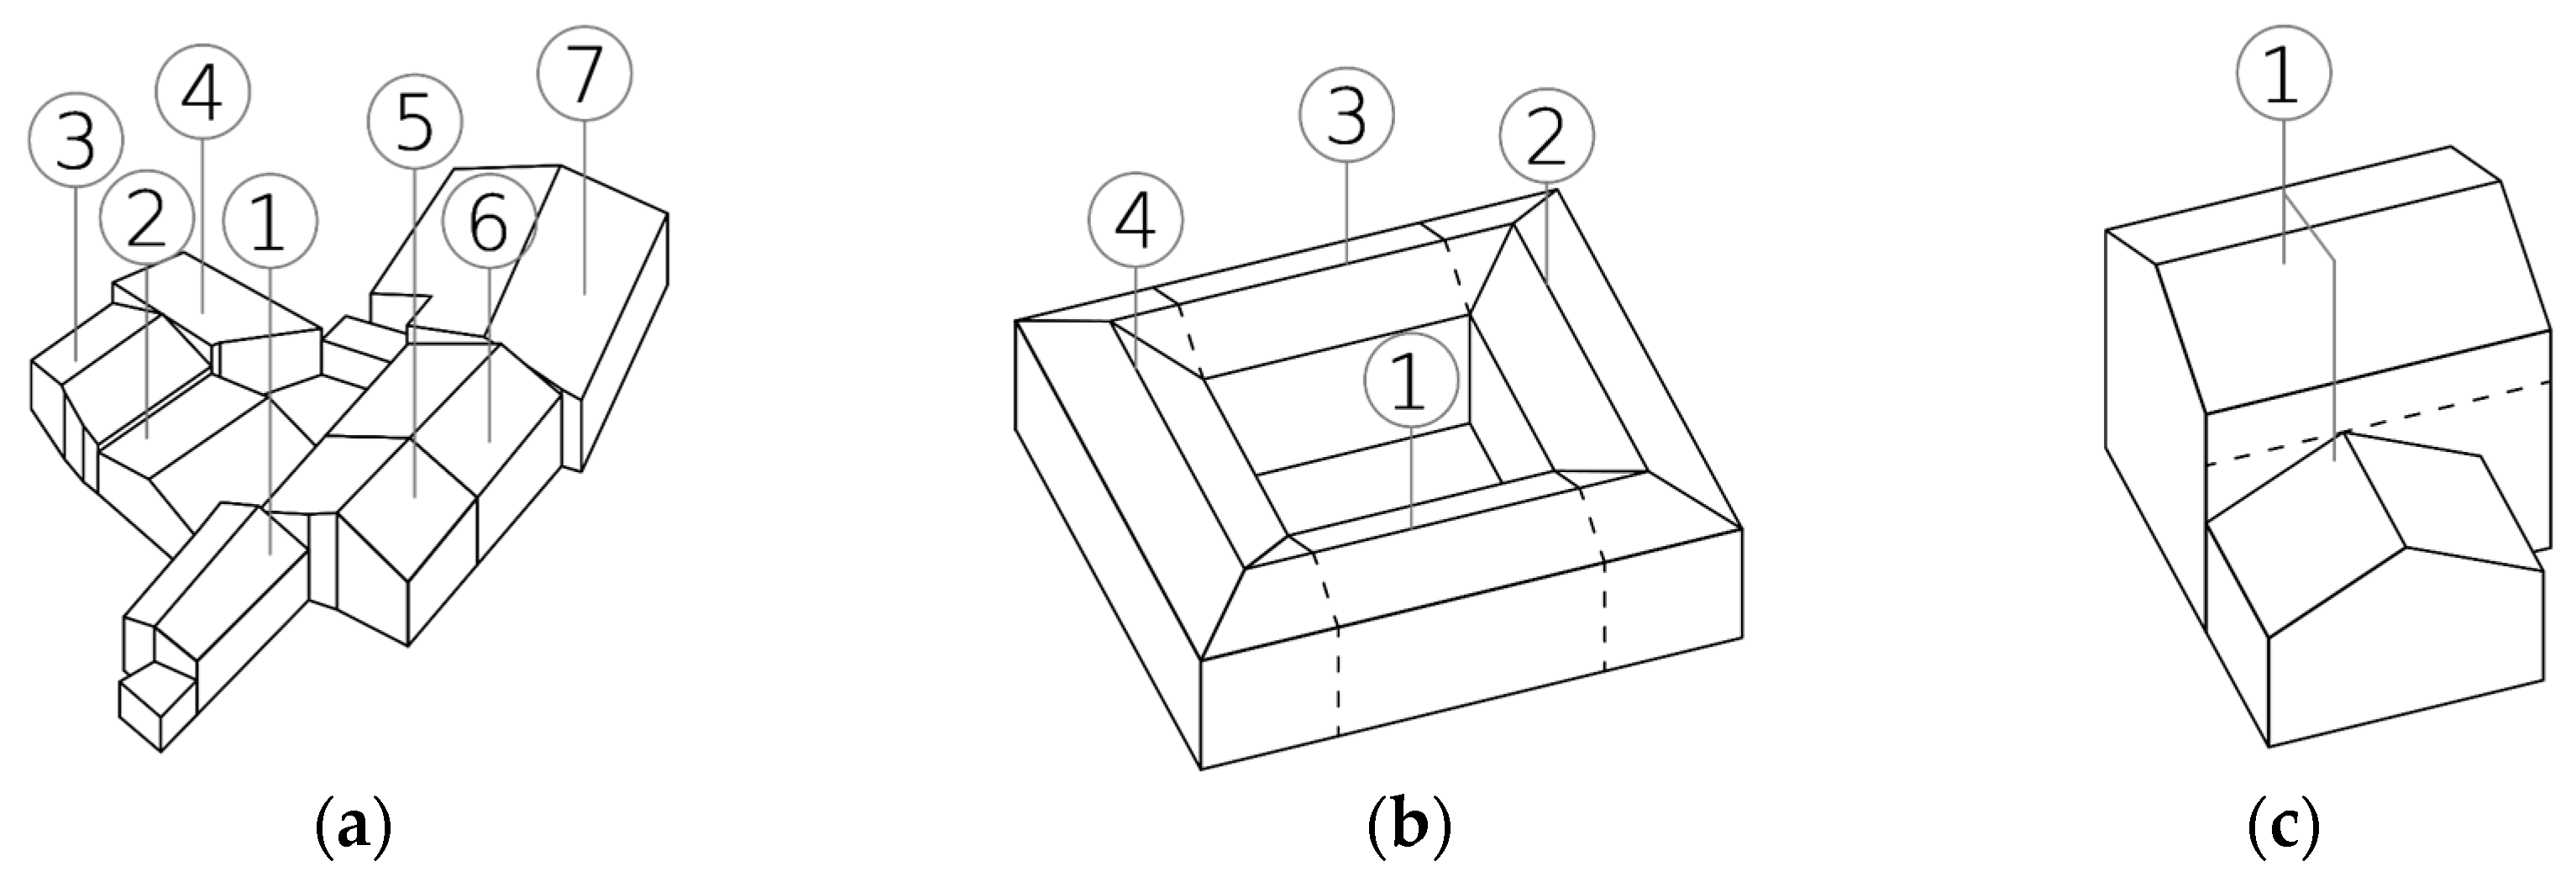
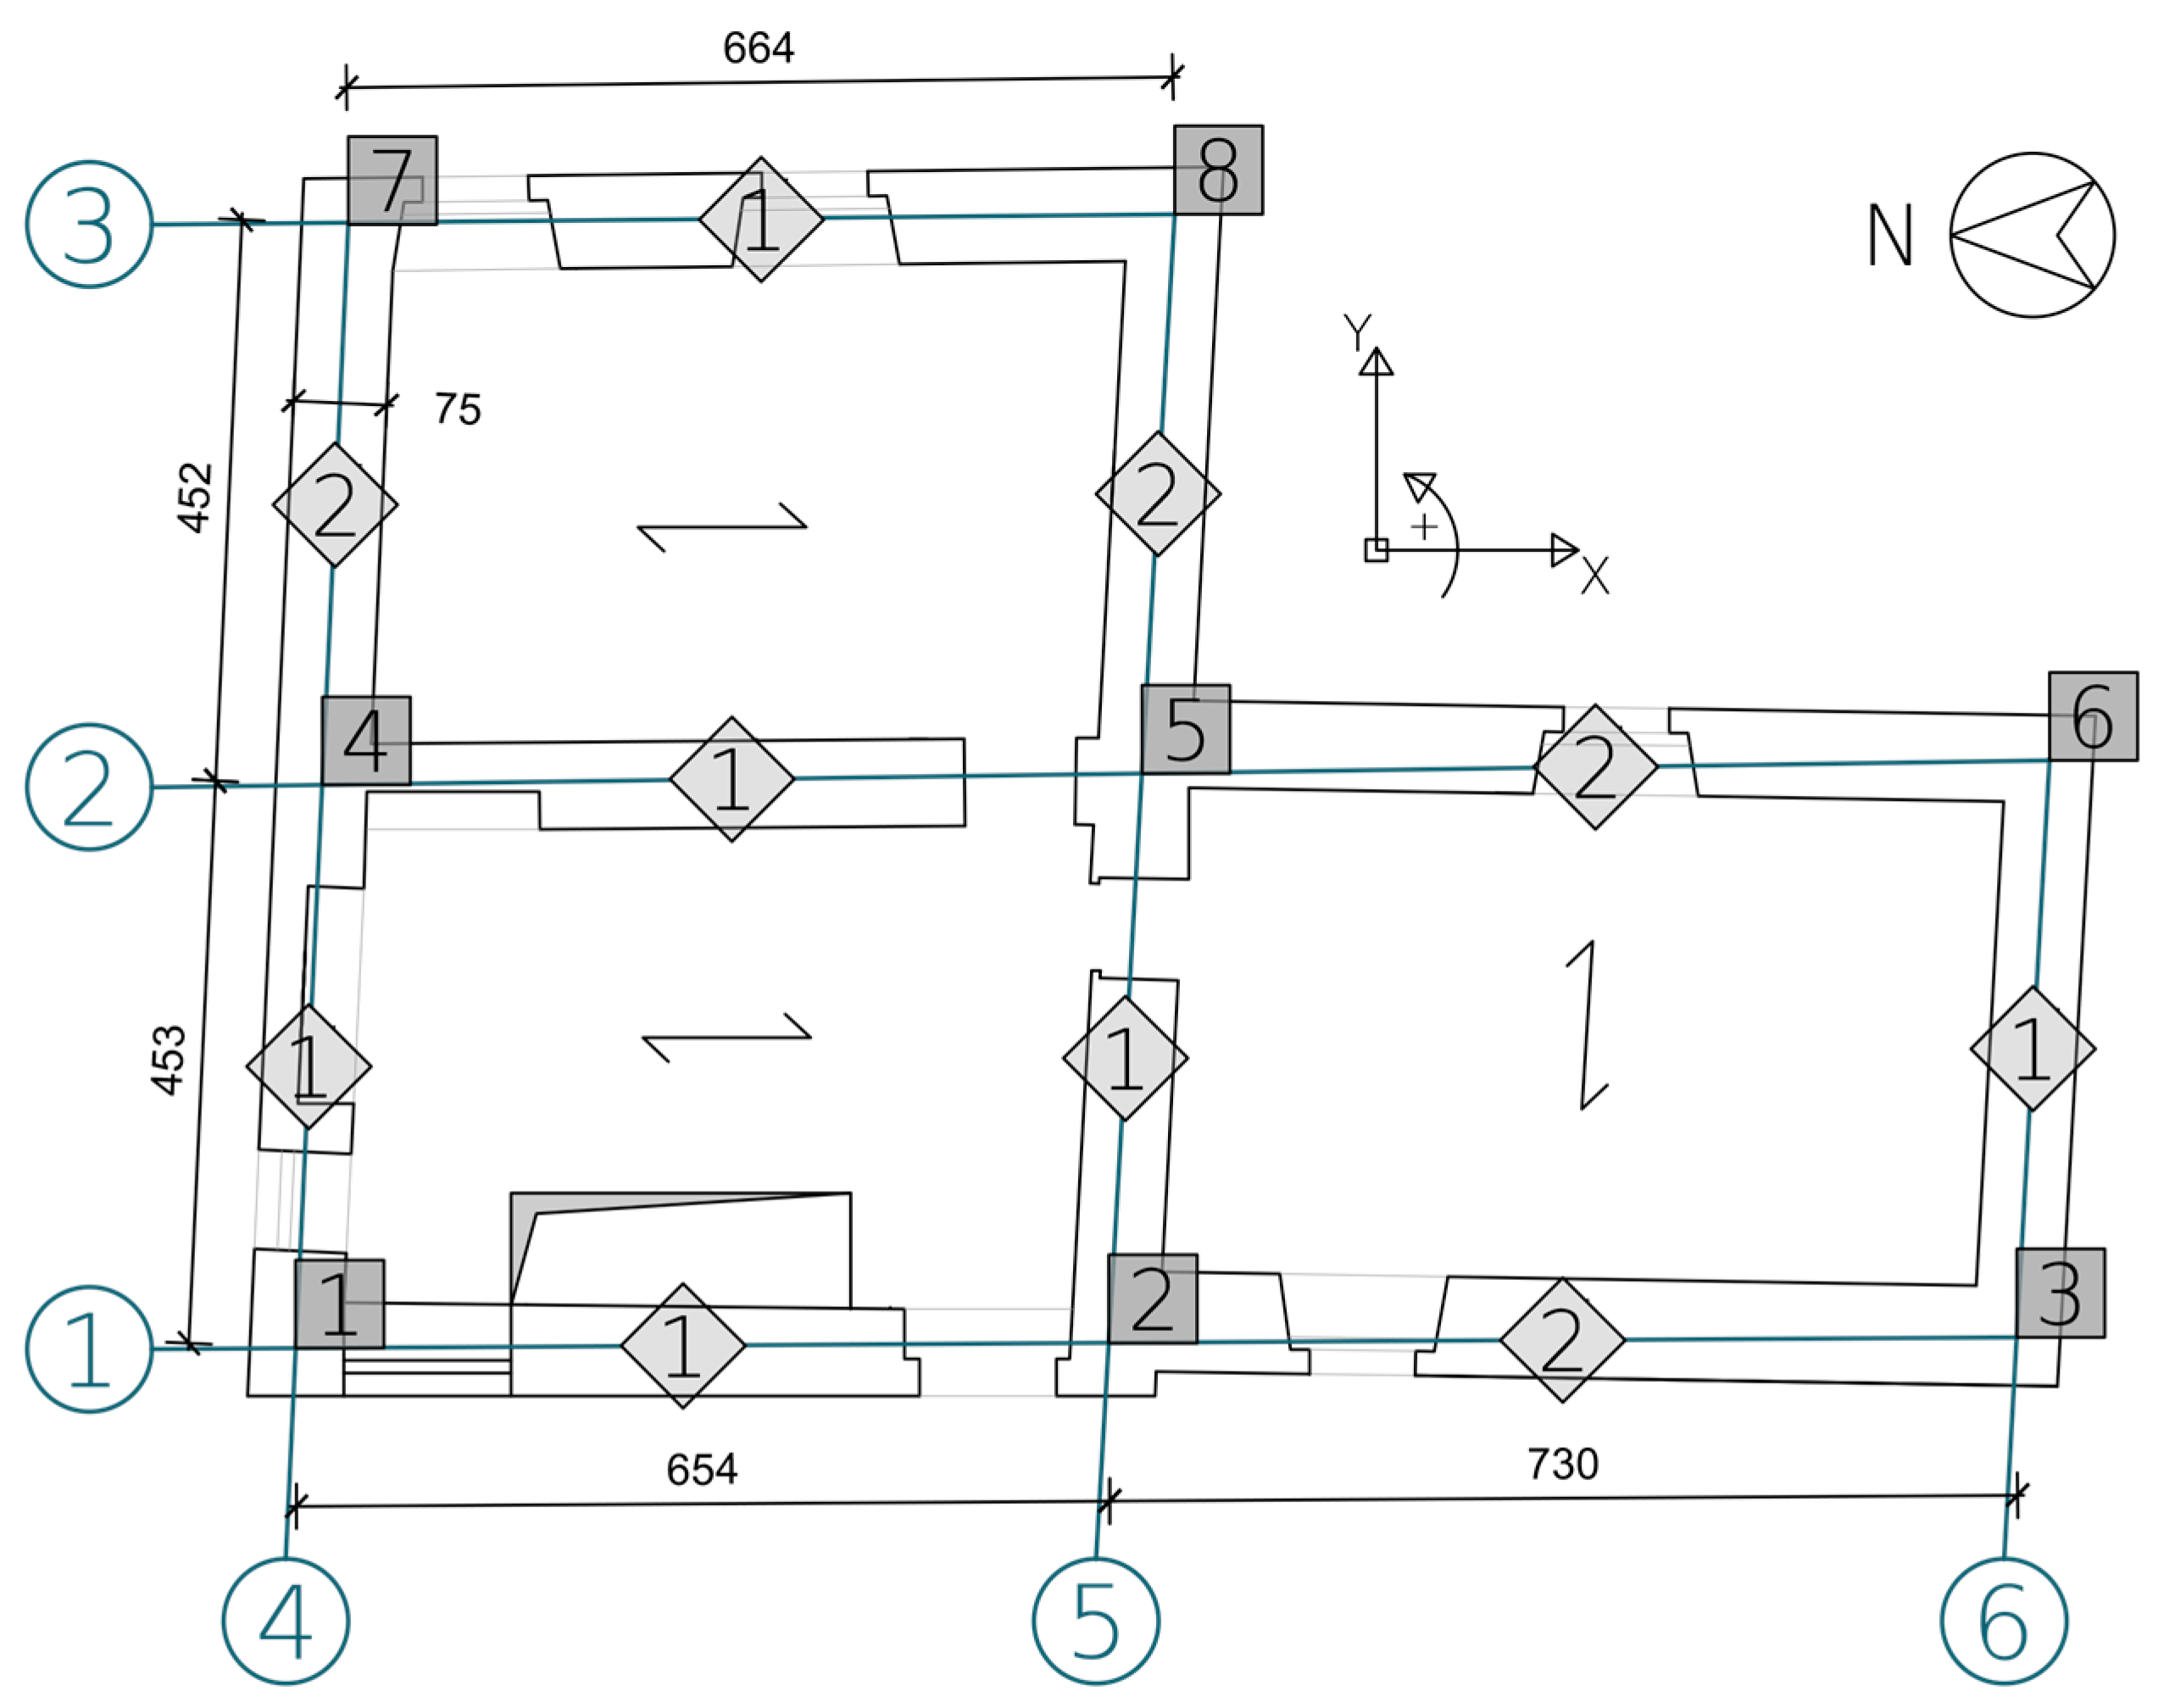
4.3. Structural Layout

The structural layout refers to the loadbearing walls of a building as they appear in the RP (Figure 10). An external reference system is assumed according to an ordinary Cartesian system: the walls are defined as continuous alignments of the loadbearing elements; the direction X or Y is decided whether the direction of a wall falls inside (X) or outside (Y) ±45° around the X axis. When the offset between the midlines of two walls is less than 80 cm, and when walls in the same direction meet at less than 5°, they can be considered as a single wall, with an average position and angle between them.
The walls are represented by their axis, and they must be numbered progressively. At every intersection, and everywhere a discontinuity in a wall is detected (e.g., a change in thickness), there is a node. Nodes are numbered progressively, starting from the first intersection of the first wall, which, assuming a rectangular plan and in the proposed order, would be the bottom left corner of the building.
The nodes delimit the panels, whose numbering restarts at every new wall. The reference axes X and Y of the plan layout are fixed on the first node of the scheme. Walls and/or panels which are linked to the other by a single node must be excluded from the layout. In addition, each panel must have the following bits of information:
  • The number of its start and end nodes;
  • The angle described by the direction of the panel, considering it from the start to the end node, with the positive direction of the X axis;
  • The length, measured between the nodes, and thickness at both the RP and the TP;
  • The total length of the openings, i.e., doors, windows (also blocked), and comprising flues and niches deeper than a half of the thickness of the wall;
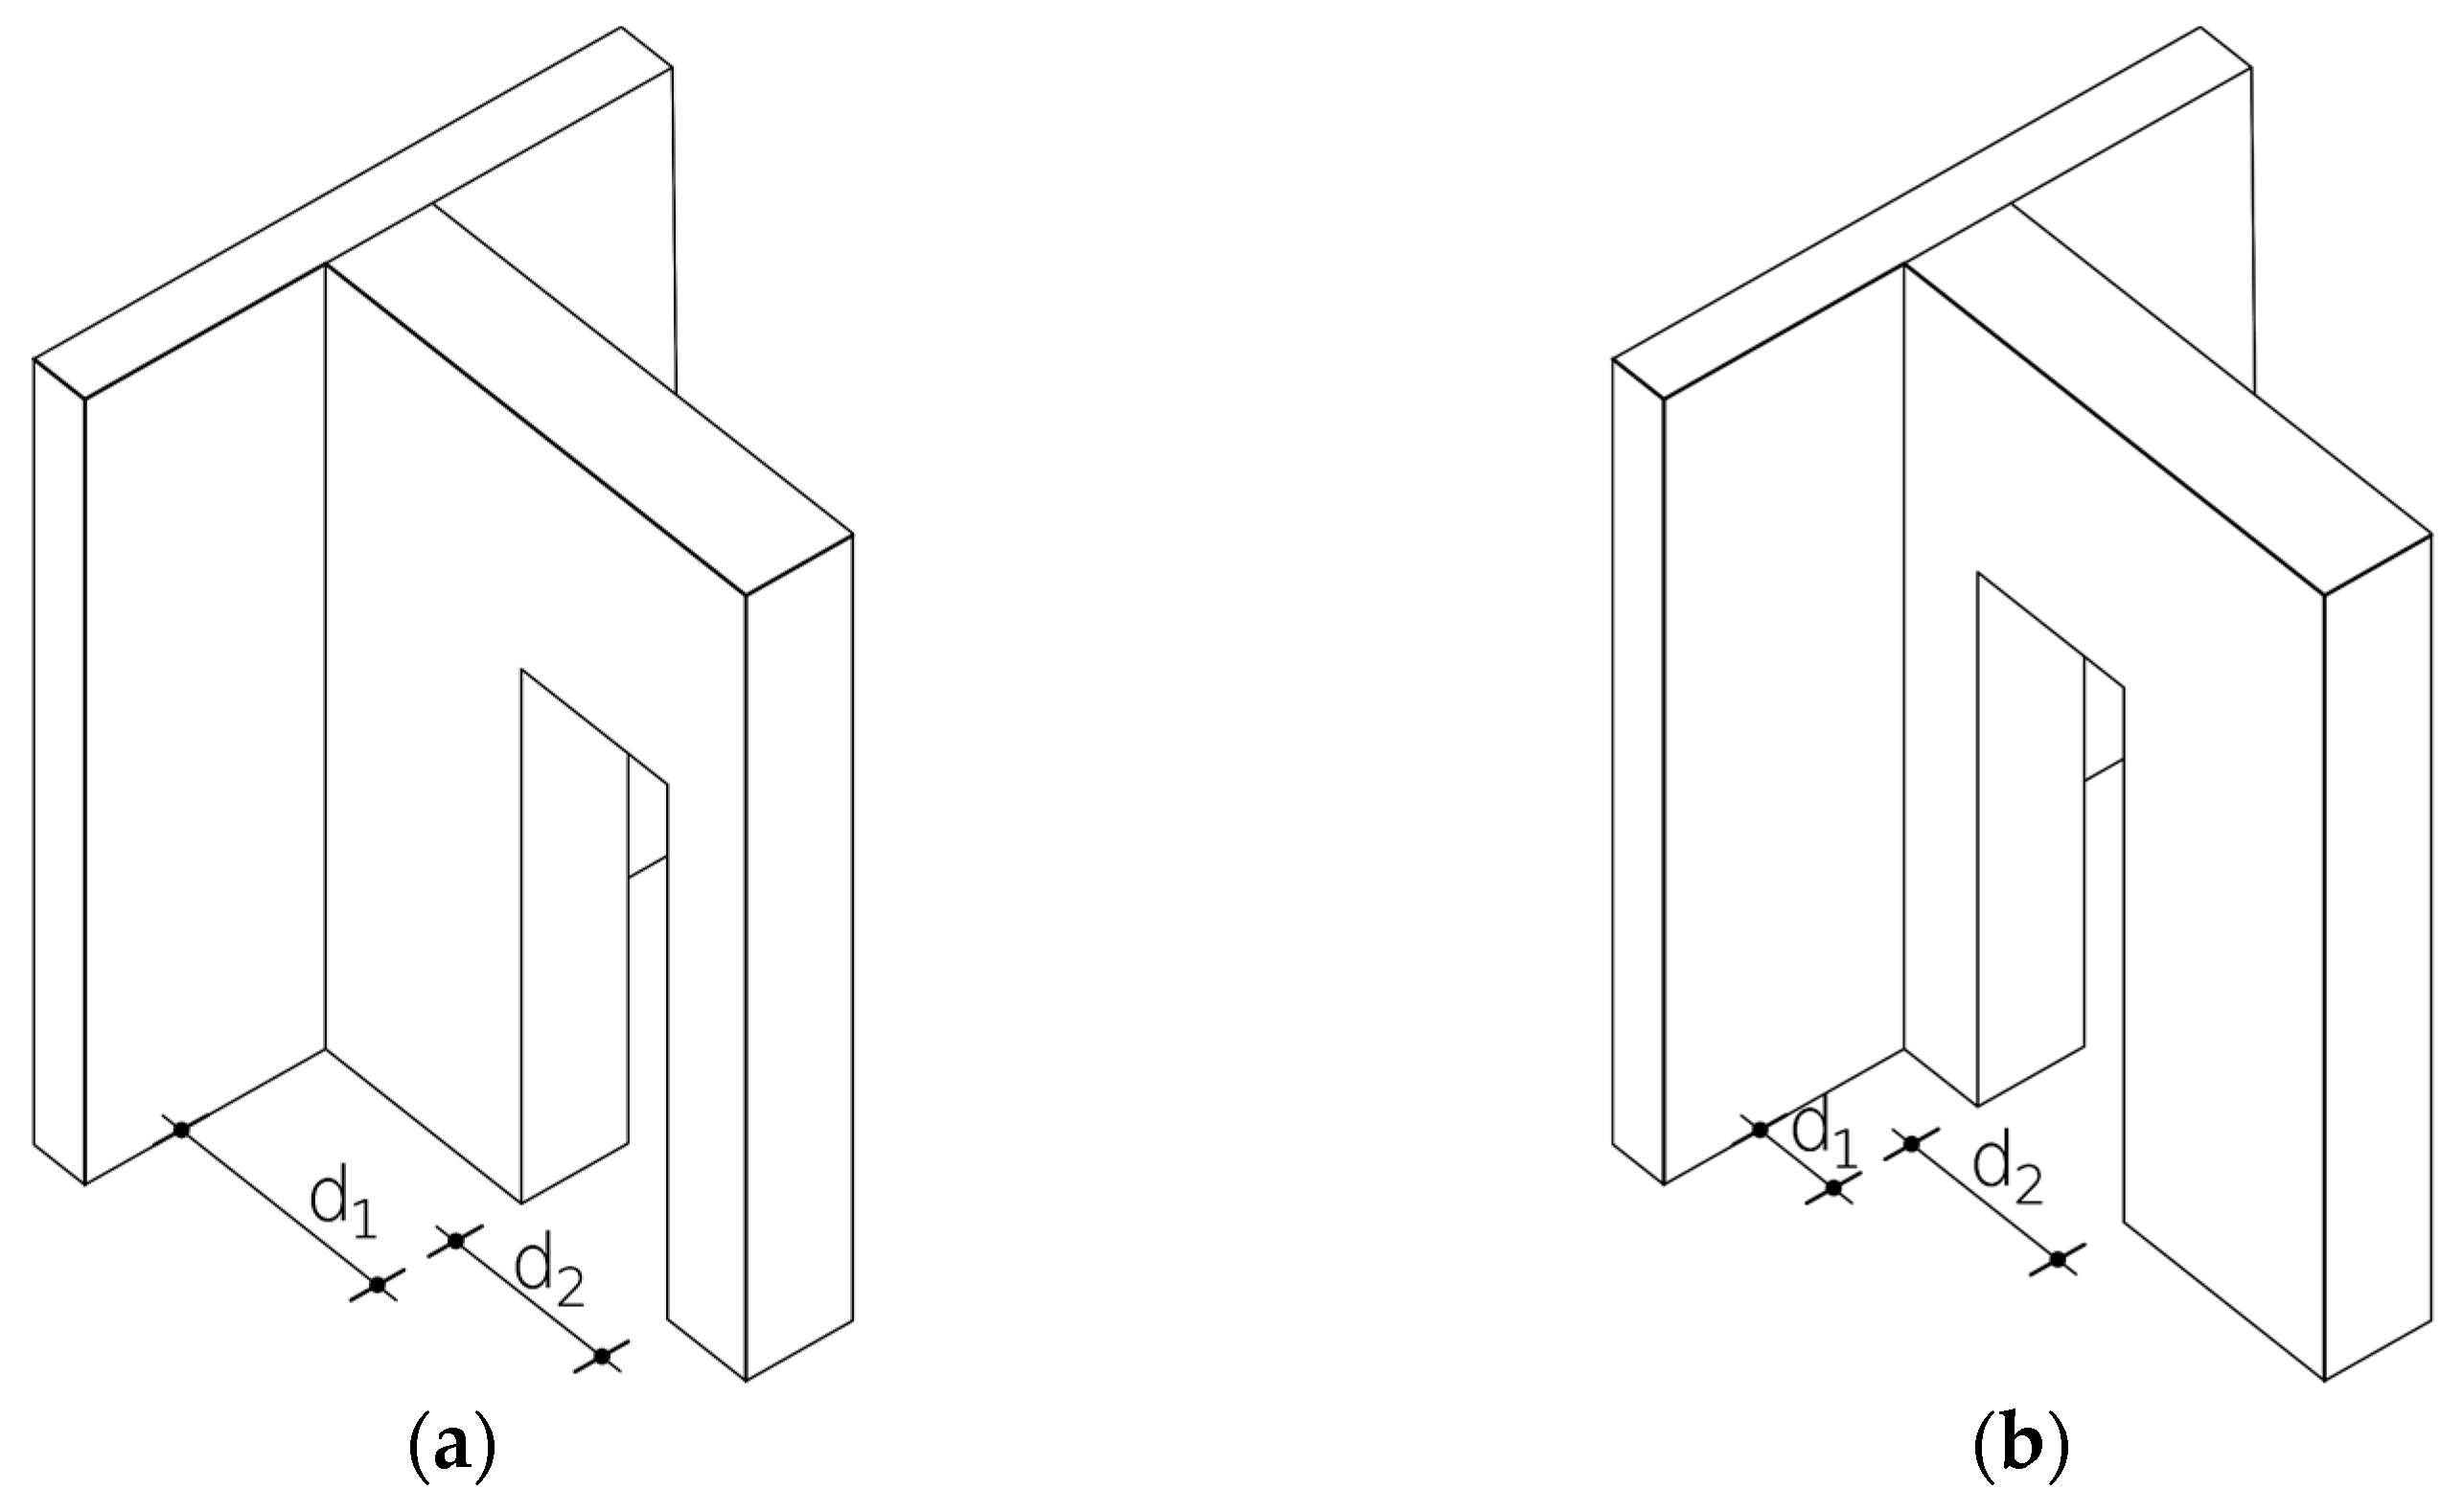
  • A code depending on the distance of the first opening from the start node and of the last opening from the end node, for evaluating the ‘flange effect’ at the intersections with other panels (Figure 11);
  • The number of stories of an adjacent building, if present, or a numeric code when a wall is not a boundary one.
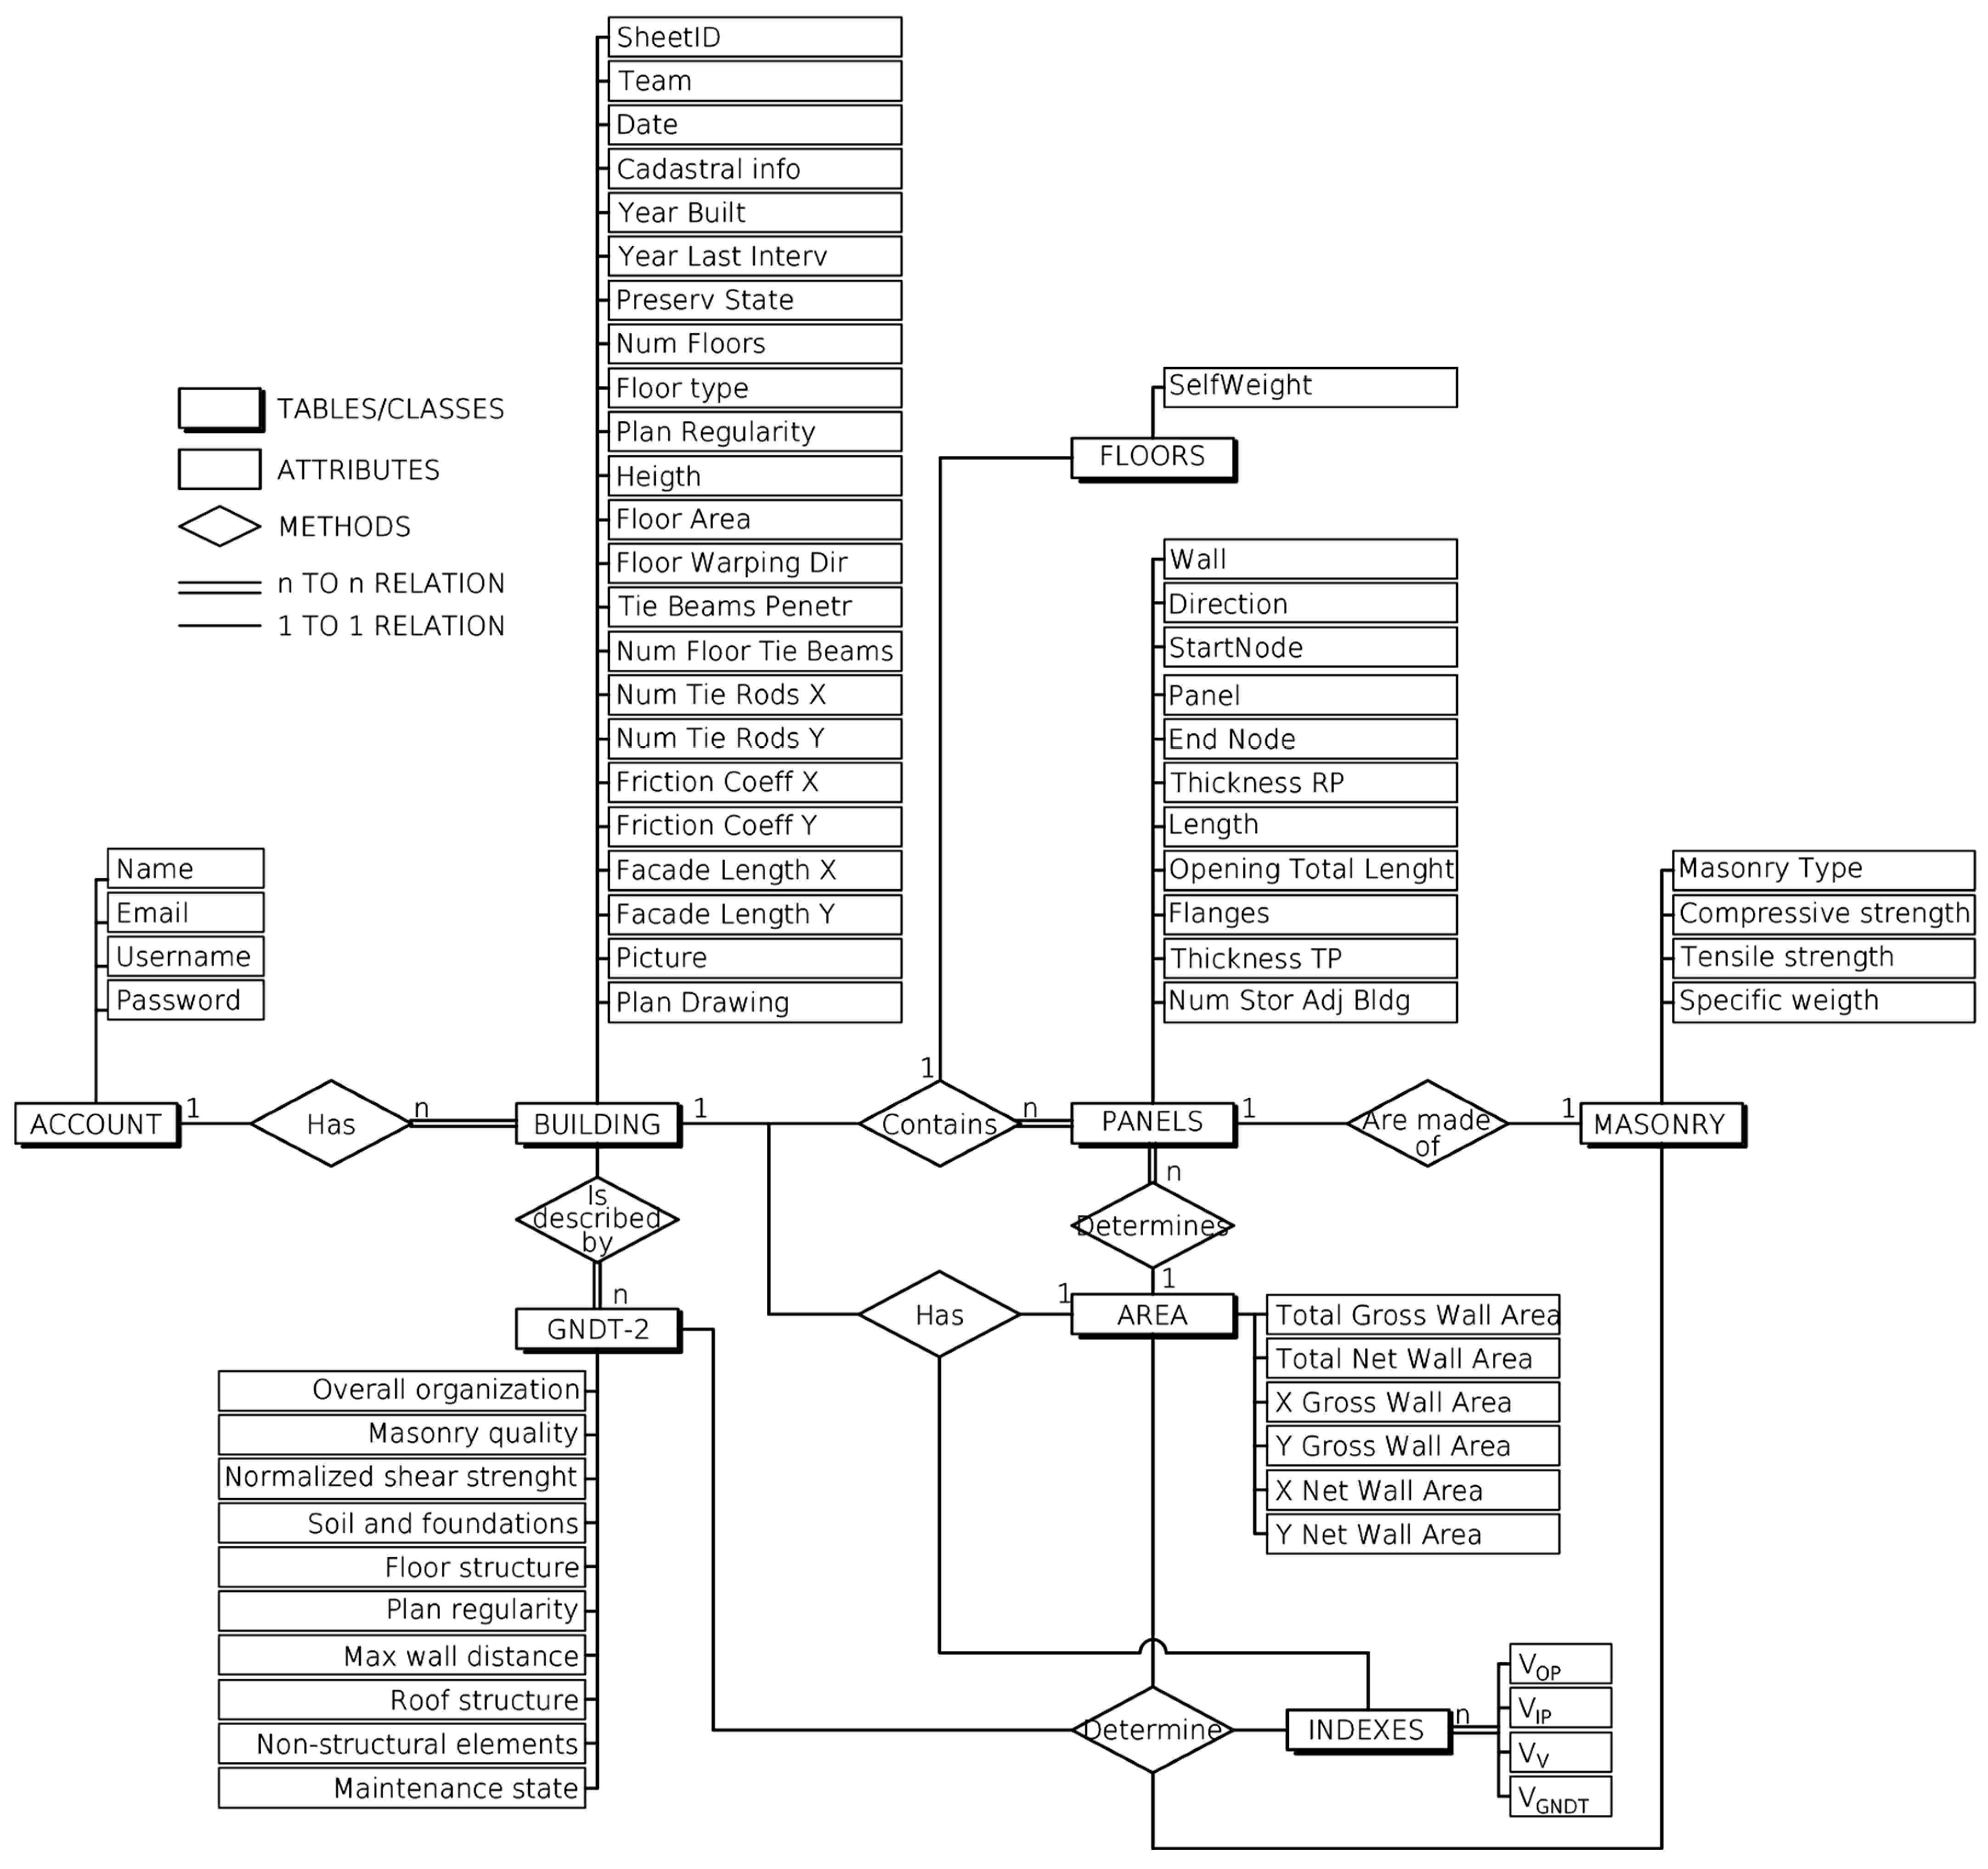
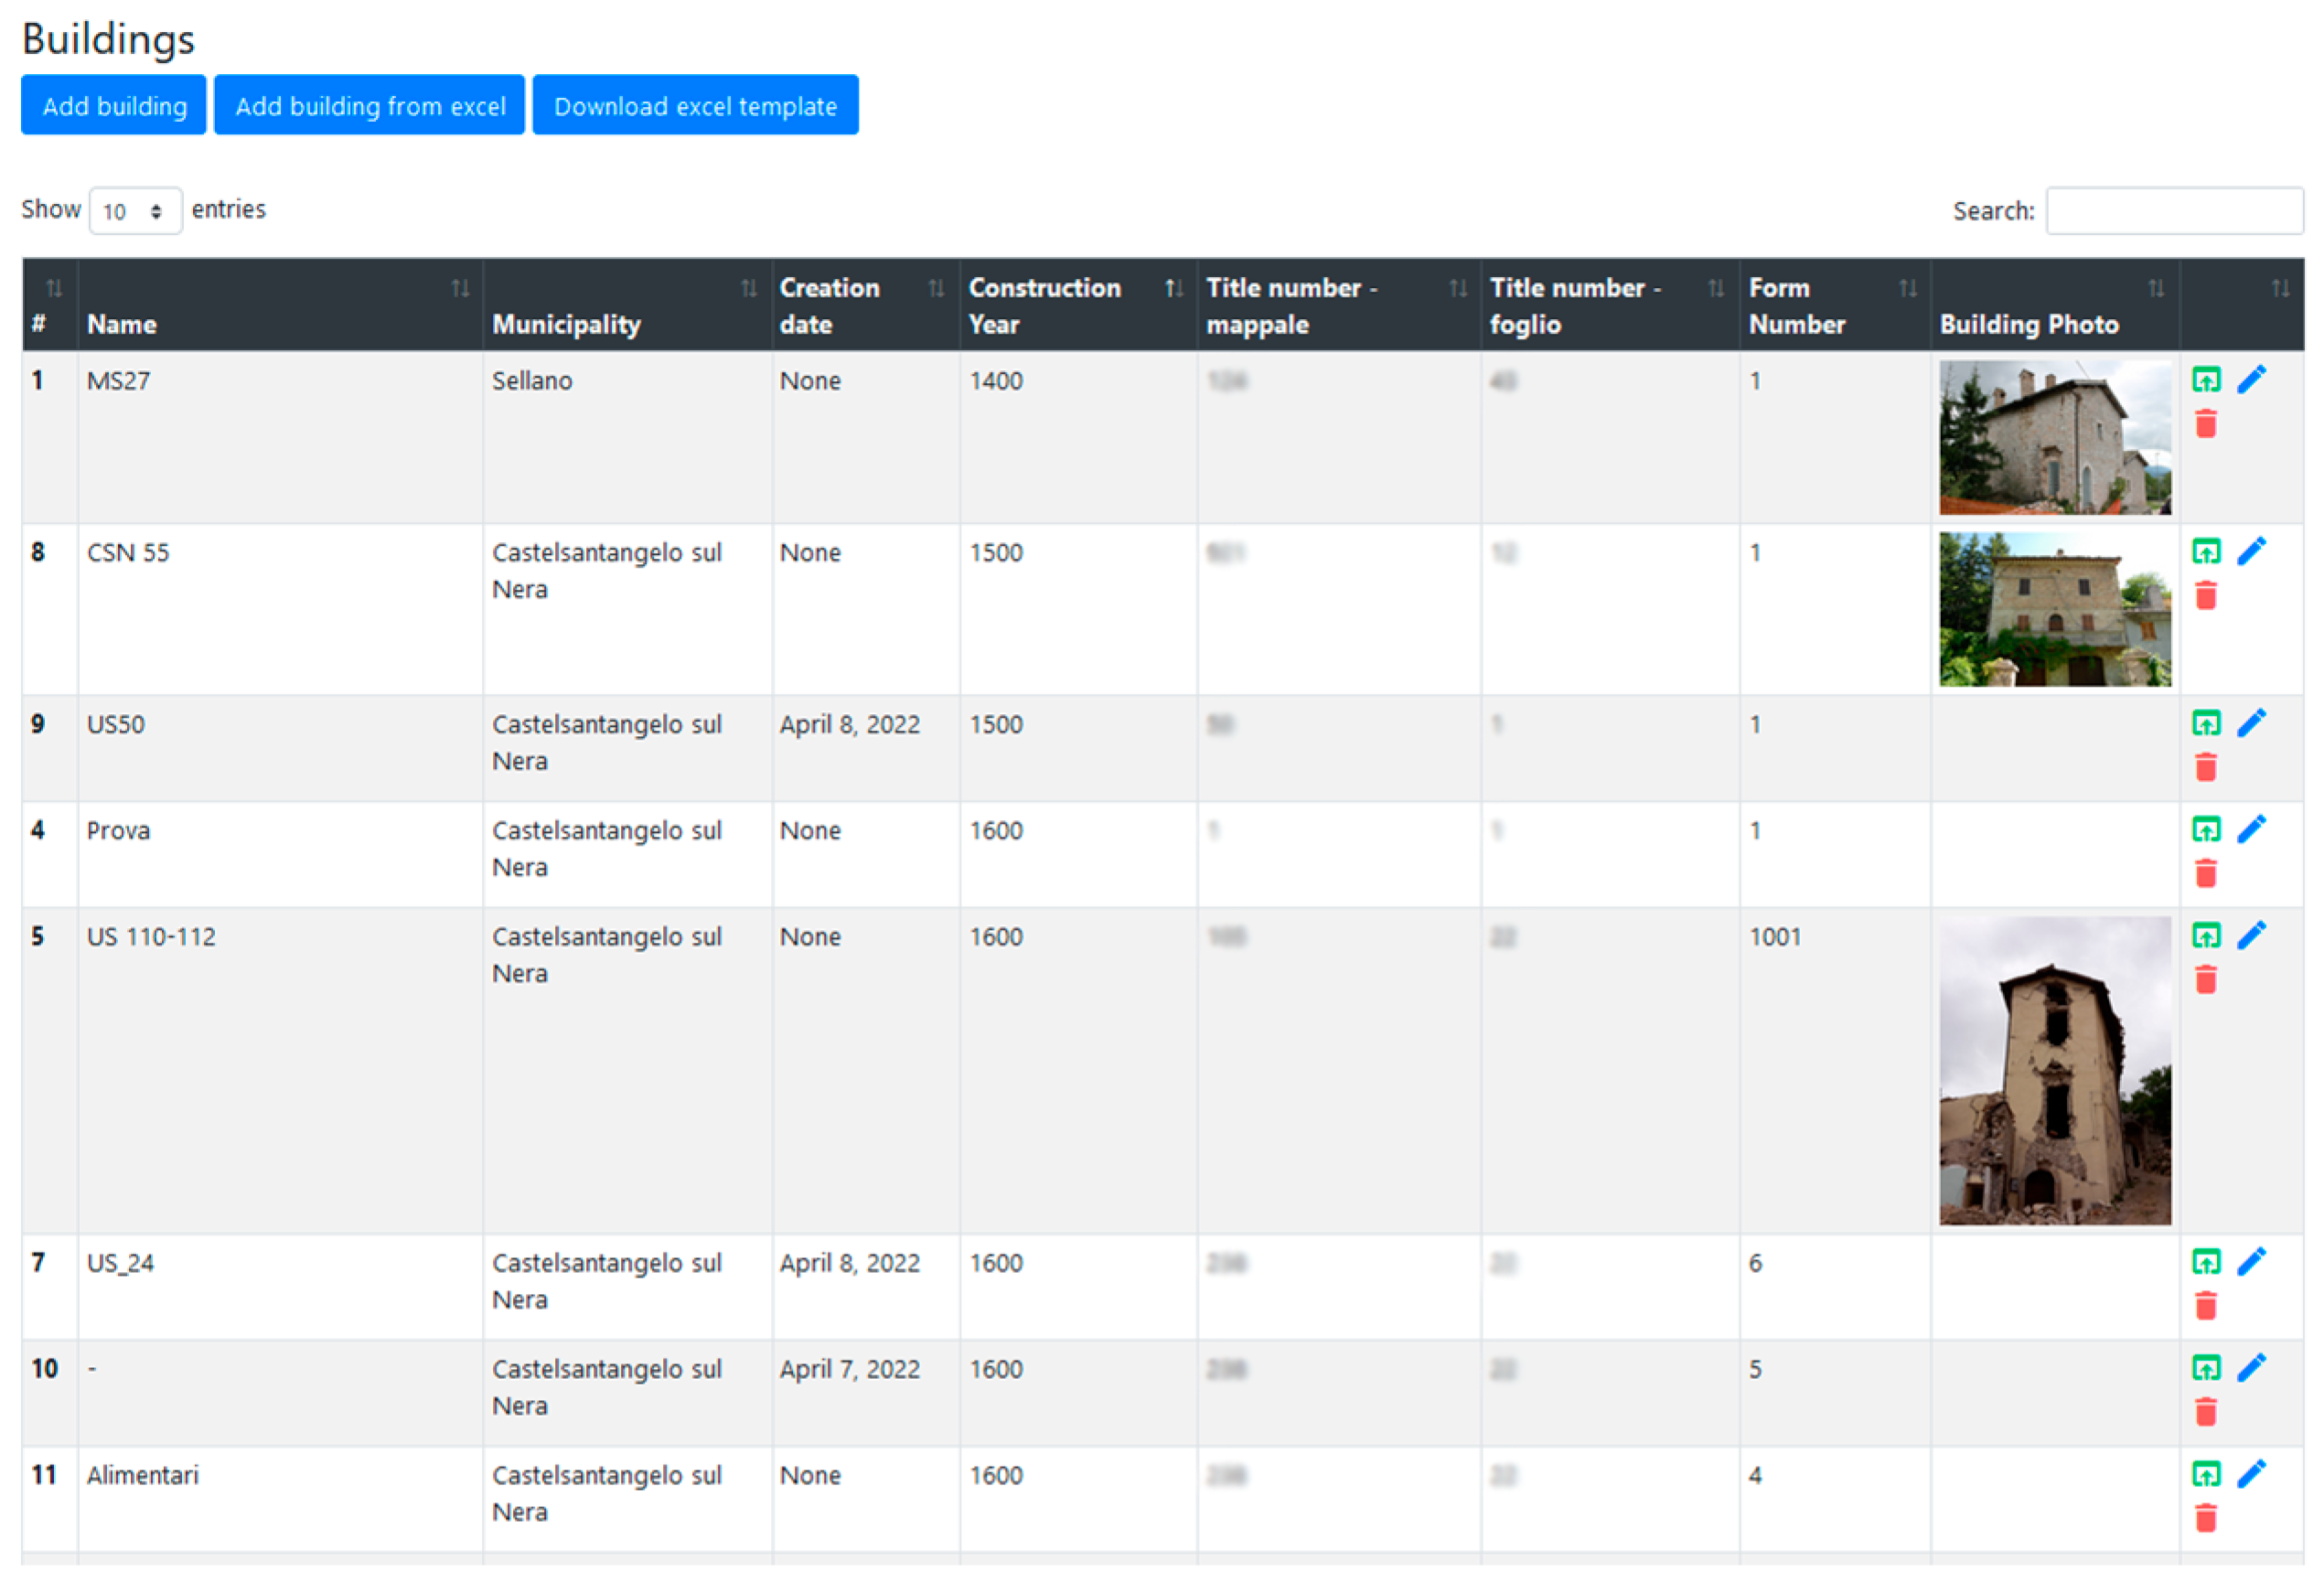
5. New Web Platform

The ‘Vulnus Web’ website [83] is free to use but it is accessible only after registration, as there are personal data which may not be displayed publicly. Each user has their own ID and password and can have access to his/her personal buildings. The structure of the website is rather complex, as it required considerable computational, storage and presentation resources, for which Python [74], Django [84] and Html [85] were used, respectively.

5.1. Back End (Storage)

Input data are stored on a relational database on a remote server and Django manages all the queries for them (create, read, update, delete). The database uses an automatically generated ID field to relate the following tables, thus avoiding potential conflicts (Figure 12):
  • Building table, which contains the overall geometric information and data about a building as they are described in Section 4.1. This table also contains the general identifying data of the building (district, municipality, cadastral data, coordinates), the sheet itself (screener, ID, date of creation) and its building process (year built, year of major restoration works or strengthening). For old buildings, a 100-year precision is allowed (e.g., 1500). This table also stores the partial data for calculations and the outcomes (Equations (1)–(4));
  • GNDT-2 table, which contains the quality class of the vulnerability factors and the partial CLs related to each parameter (Section 4.2);
  • Panels table, which contains the features of the walls and the panels as described in Section 4.3.
In addition, the masonry and the floor types (Table 5 and Table 6), along with the list of the census data of Italian municipalities, are stored on the server and accessed by the program during the input phase.

5.2. Application Logic (Code)

Thanks to the features of Python, the items entered in the procedure are converted into classes and objects, whose attributes match the geometric and vulnerability data defined in Section 4 (Figure 12). Accordingly, the steps of the procedure are converted into methods, at class or object level, to alter their state and define the methods to carry out the calculations. The code runs the calculation of Equations (1) and (2) on those panels of the boundary walls which are indicated as free to move in the input phase; internal walls and those blocked by adjacent buildings are neglected. However, if the adjacent building is shorter than that under examination, the code automatically considers just the parts of Equations (1) and (2) related to the TP alone. Once the values of V′OP and V″OP are determined for each panel, they are summed up and the minimum VOP is determined. The partial values for each local mechanism are stored and can be retrieved and inspected afterwards to compare the behavior of each panel of a building.

5.3. Front End (Website)

The web interface is structured in 19 pages, which contain the main functions of the program following the steps presented in Section 3, from data input to the calculation of the indexes and the fragility curves. The home page (Figure 13) displays the list of buildings (as SUs) created by the user; at the first use, the list is empty. The list contains the following data: (i) unique ID of the building (automatically created); (ii) name of the building; (iii) municipality; (iv) creation date; (v) year built; (vi) cadastral data; (vii) progressive number of the data sheet (optional, only for groups of buildings); (viii) icon of the building; and (ix) action buttons (display, delete, edit).
It is not possible to input two buildings with the same ID or cadastral number. A screener can add the pieces of information referring to a new building sheet through the online form or a preformatted spreadsheet, which can be downloaded from the website. In the former case, the user interacts with the website by means of dropdown menus, textboxes with a hint about the format of the input required (Figure 14). In the latter case, the procedure is quicker, but it requires the insertion of information coded according to the manual [58]. The spreadsheet can be reused as many times as needed, provided that the data inserted changes according to the building. In the spreadsheet, the logical sections of the data form correspond to the sheets called ‘geometry’, ‘walls’ and ‘GNDT-2’.
At the end of the procedure, the website shows the indexes and, based on them, carries out the safety assessment and determines the fragility curve. The partial results are also displayed for each wall, and they can be downloaded in a spreadsheet together with the overall ones.

6. Application and Discussion

To assess the reliability of Vulnus Web in predicting damage in an existing masonry building, it was applied to a building damaged by the 2016 Central Italy earthquake. This building, henceforth MSB, is located in Montesanto of Sellano (PG) and it had been already studied after the Umbria-Marche earthquake occurred in 1997 [62].

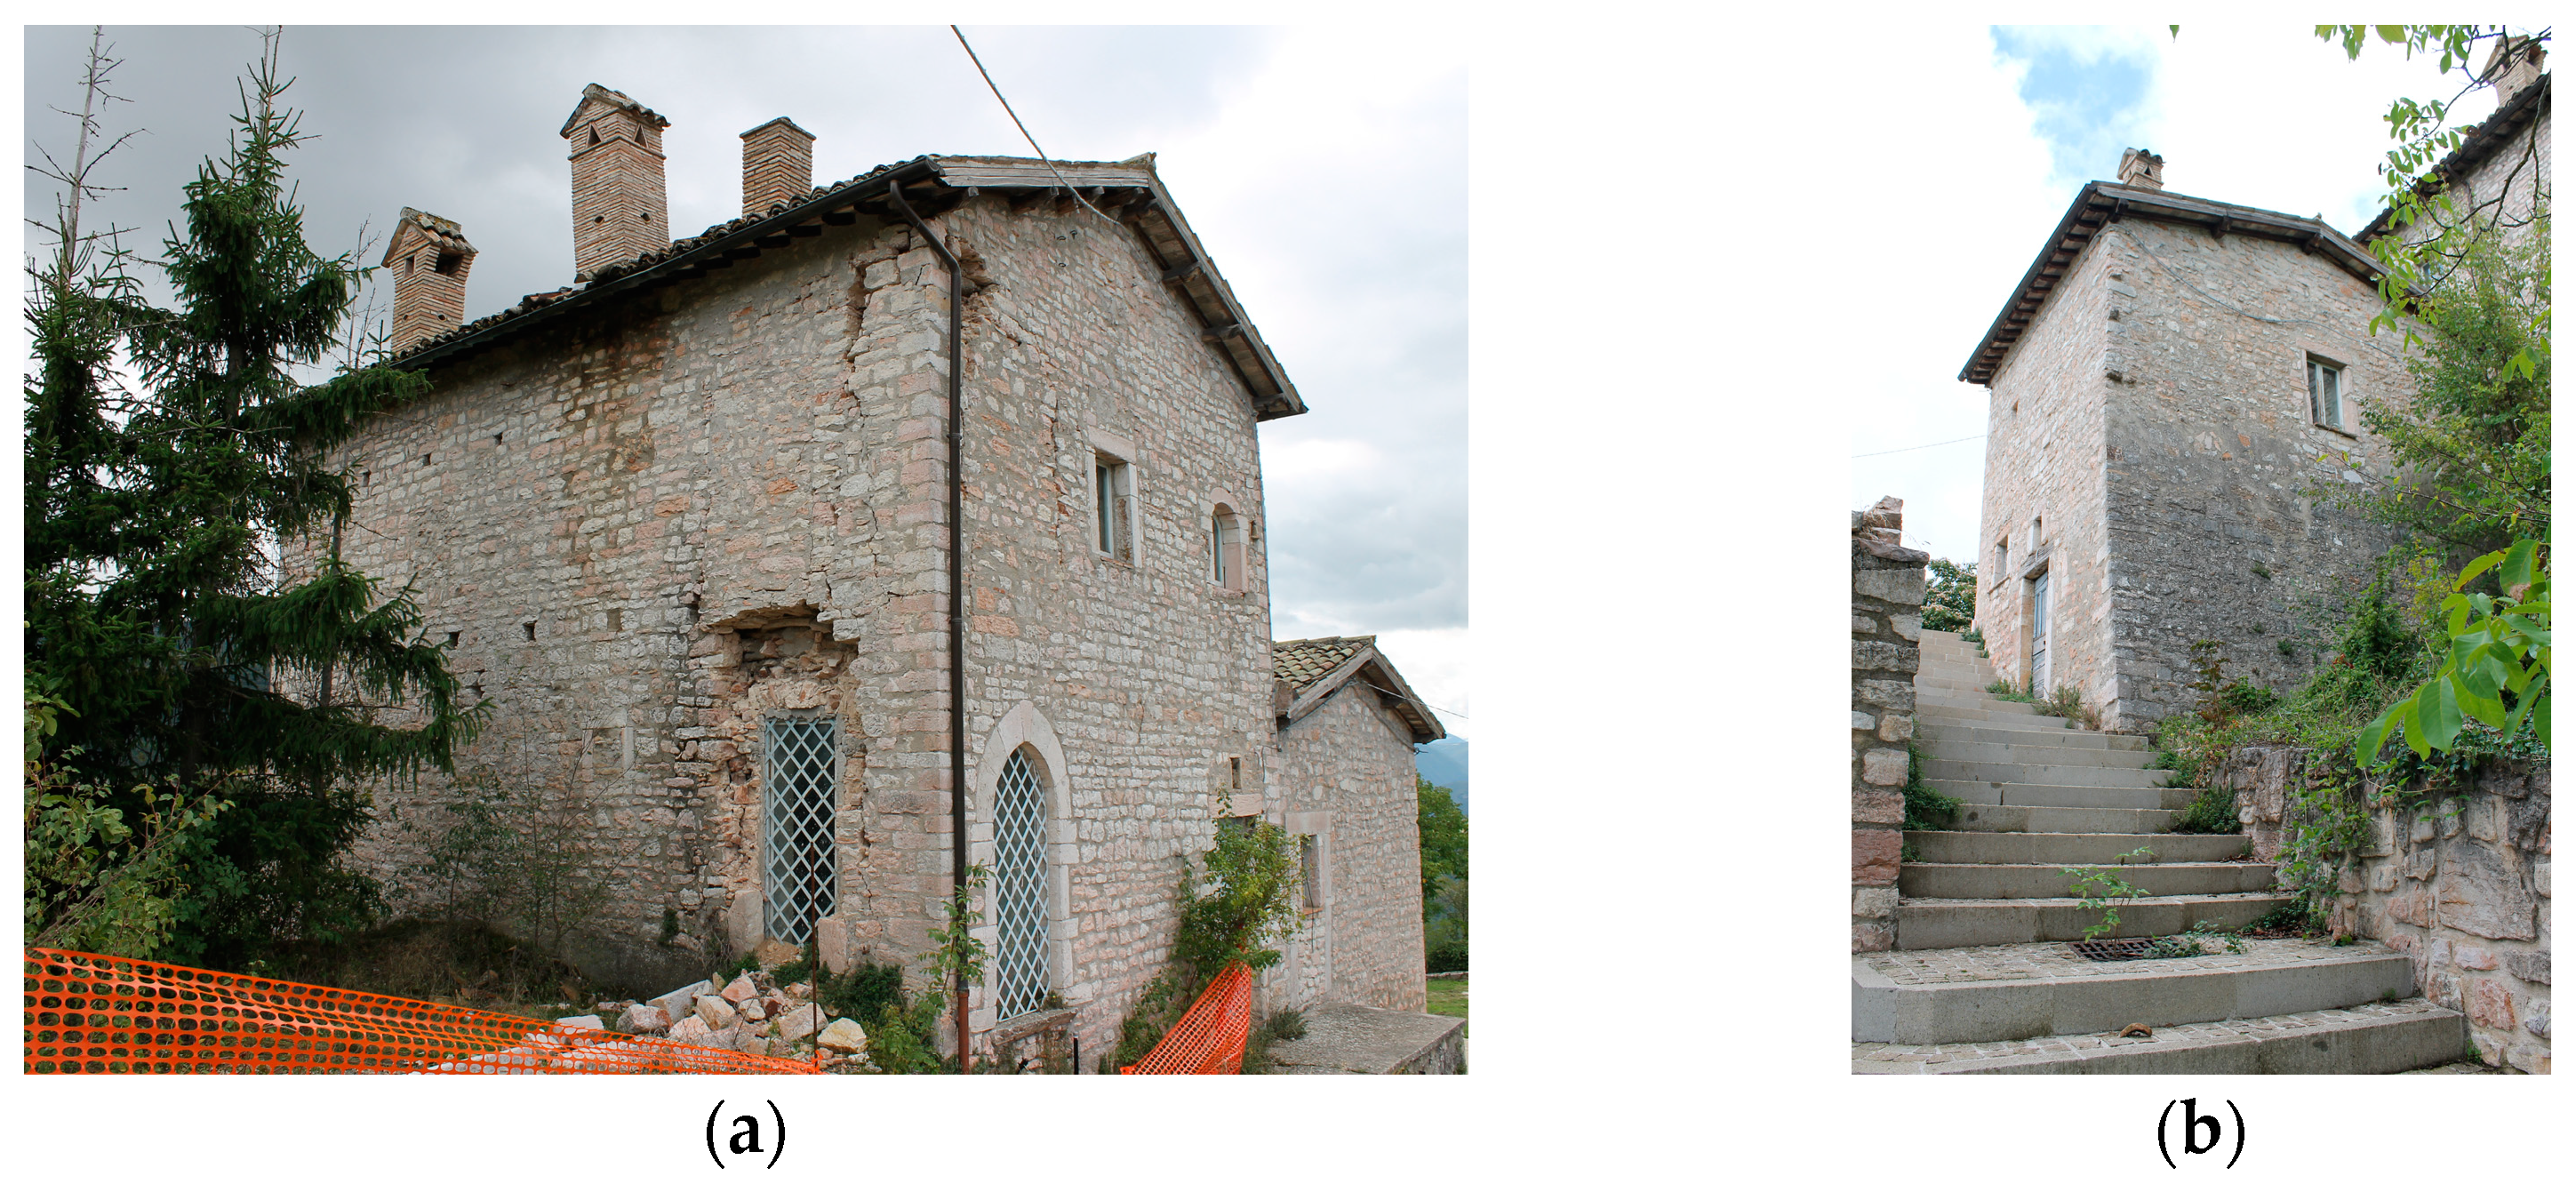
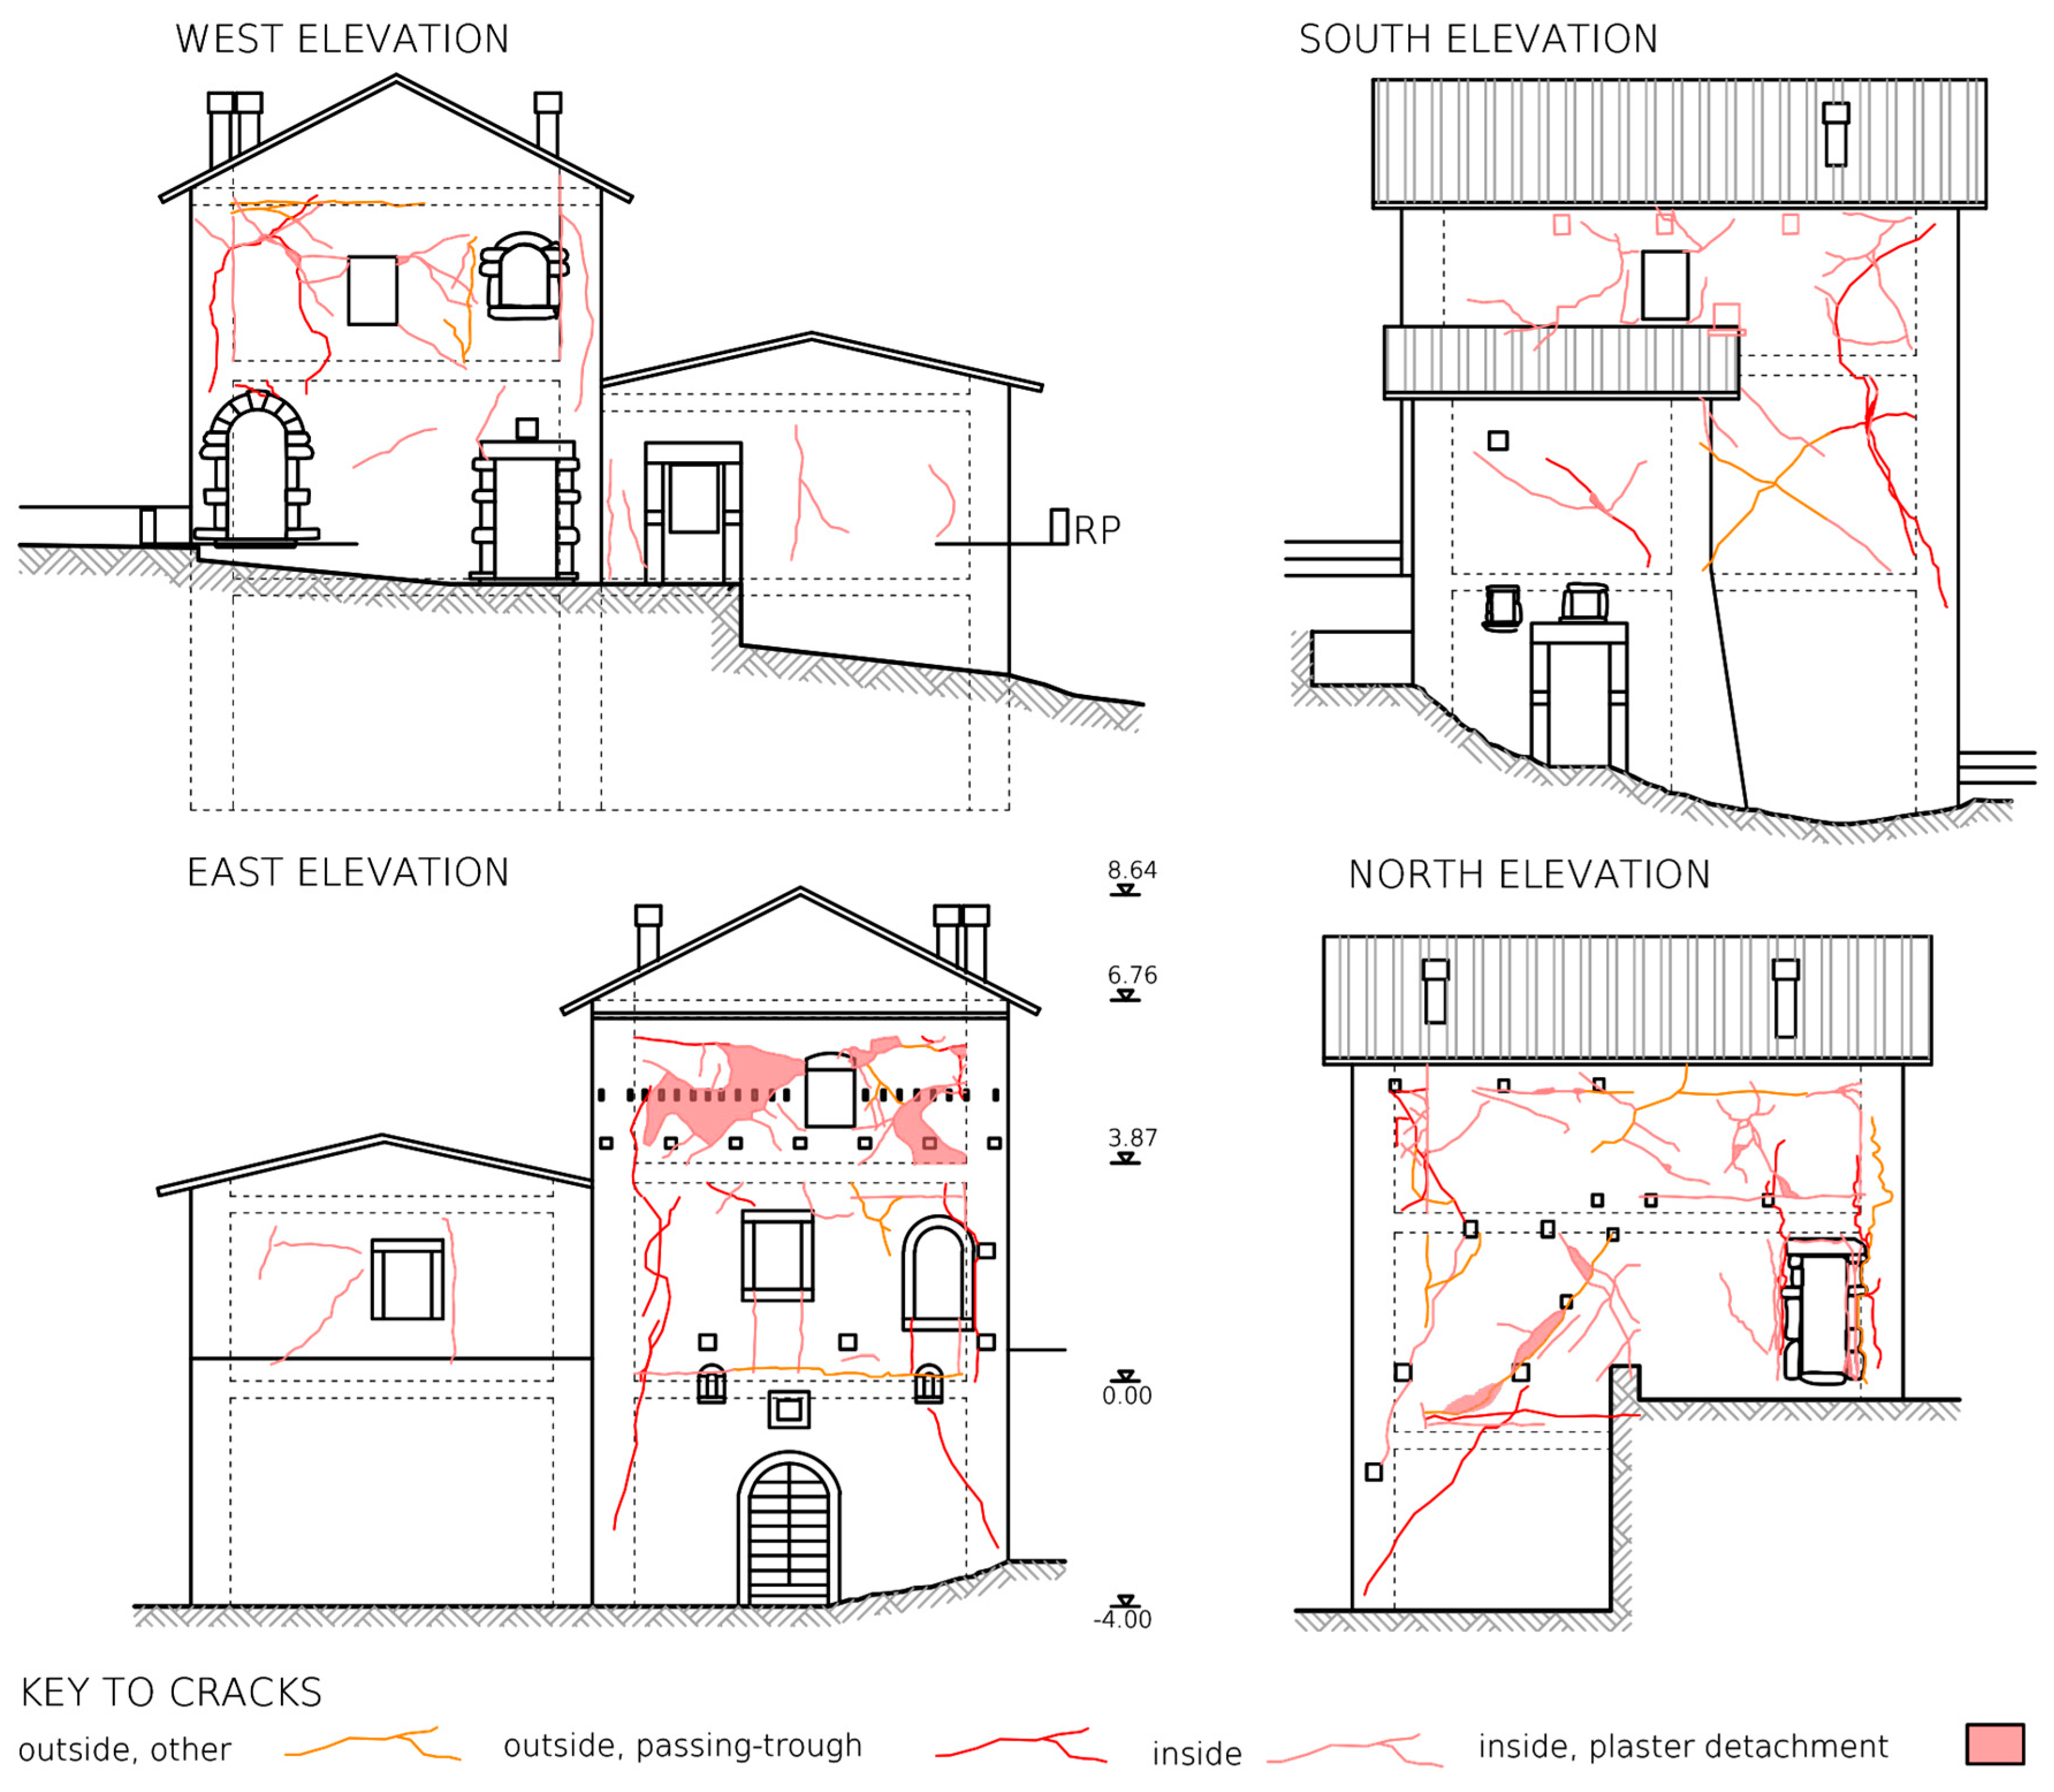
6.1. Description of the Case Study and Data Input

MSB is a three-story masonry building placed almost on the ridge of Montesanto hill. Therefore, just the top two stories are completely above grade, whereas the western part of the ground floor is in contact with the rocky bank of the hill (Figure 15). The walls are made of limestone, roughly hewn and exploiting natural fracture surfaces, and laid in a coursed fashion. This building underwent strengthening interventions in the early 1990s, and a structural rehabilitation in the early 2000s following the earthquake in 1997. The walls were repointed and injected with cement grout and the timber floors were replaced by r.c. and clay block composite slabs with boundary tie beams, chased in the walls. The roof was also rebuilt with a timber structure, but a boundary tie beam was added. The crack pattern (Figure 16) shows that the building had an overall response, with widespread shear cracks over the walls, but some local mechanisms were also triggered, despite the added connection devices and the masonry improvement. For instance, the S-E and N-E corners were delimited by a passing-through crack, from the bottom to the top of the façade; in the north and west façades, the cracks clearly followed the traces of old windows, now blocked. At the time of the earthquake in 2016, the building was used as a vacation home, and it was in good condition.
The input form of Vulnus Web was filled in as shown in Table 7. First, the masonry type and the possible improvements made by interventions were requested (fields 1–2). The improving coefficient can be defined from [81] by crossing the intervention with the masonry type; for coursed rubble, the value suggested for grouting is 1.5. This value was applied to the strength properties of the material. As the RP was assumed at the first story completely above grade, i.e., the first story, the number of floors assumed in the calculation was two (field 4); consequently, the overall height was measured from the level of the RP to the eave line of the taller part (field 5). The building was considered irregular in plan (field 6), as it has an L-shaped plan (Figure 10), but regular in elevation, in Vulnus terms, as the joist direction does not change across the floors (field 10) and the floors are of the same type at each level (field 19). Floors were considered heavy (field 8) and bidirectional (field 9) as they are oriented in both directions in the RP, although it would have been possible to consider them as parallel to the X axis. As all the floors are bordered by tie beams, their number was equal to the number of floors (above the RP) and the friction coefficient among floors and walls was set to 0.6 (fields 15–16). However, their effect was reduced considering that they are chased in the walls, so they cover just half of the thickness of the walls (field 18). There are no tie rods, so their number was set to 0 (fields 12, 14). The peak ground acceleration (pga) at the Damage Limitation (DL) and Severe Damage (SD) limit states (fields 21–22) were defined from [80] as 0.14 g and 0.34 g, respectively, considering the best option for soil conditions (class A, rock) and the worst for the topography of the site (class T4, ridge and slope ≥ 30°).
Figure 10 shows the Vulnus Web plan scheme and Table 8 the corresponding schedule stored in the remote database. The translation of the plan layout into the schedule was operated by the screener at this stage of the work. Internal partitions and stairs were neglected, and only the loadbearing walls were considered. The schedule must be filled out in order, following the progression of the walls and panels in each wall. For each panel, a screener must indicate the items described in Section 4.3. The flange effect was assessed as a function of the ratio between the distance between the first and the last opening from the start (rs) and the end node (re), respectively, of the panel and their width. The possible cases are (Equation (14)):
no opening →N;
rs ≥ 0.5 AND re ≥ 0.5 →O
rs < 0.5 AND re ≥ 0.5 →S
rs ≥ 0.5 AND re < 0.5 →E
rs < 0.5 AND re < 0.5 →B
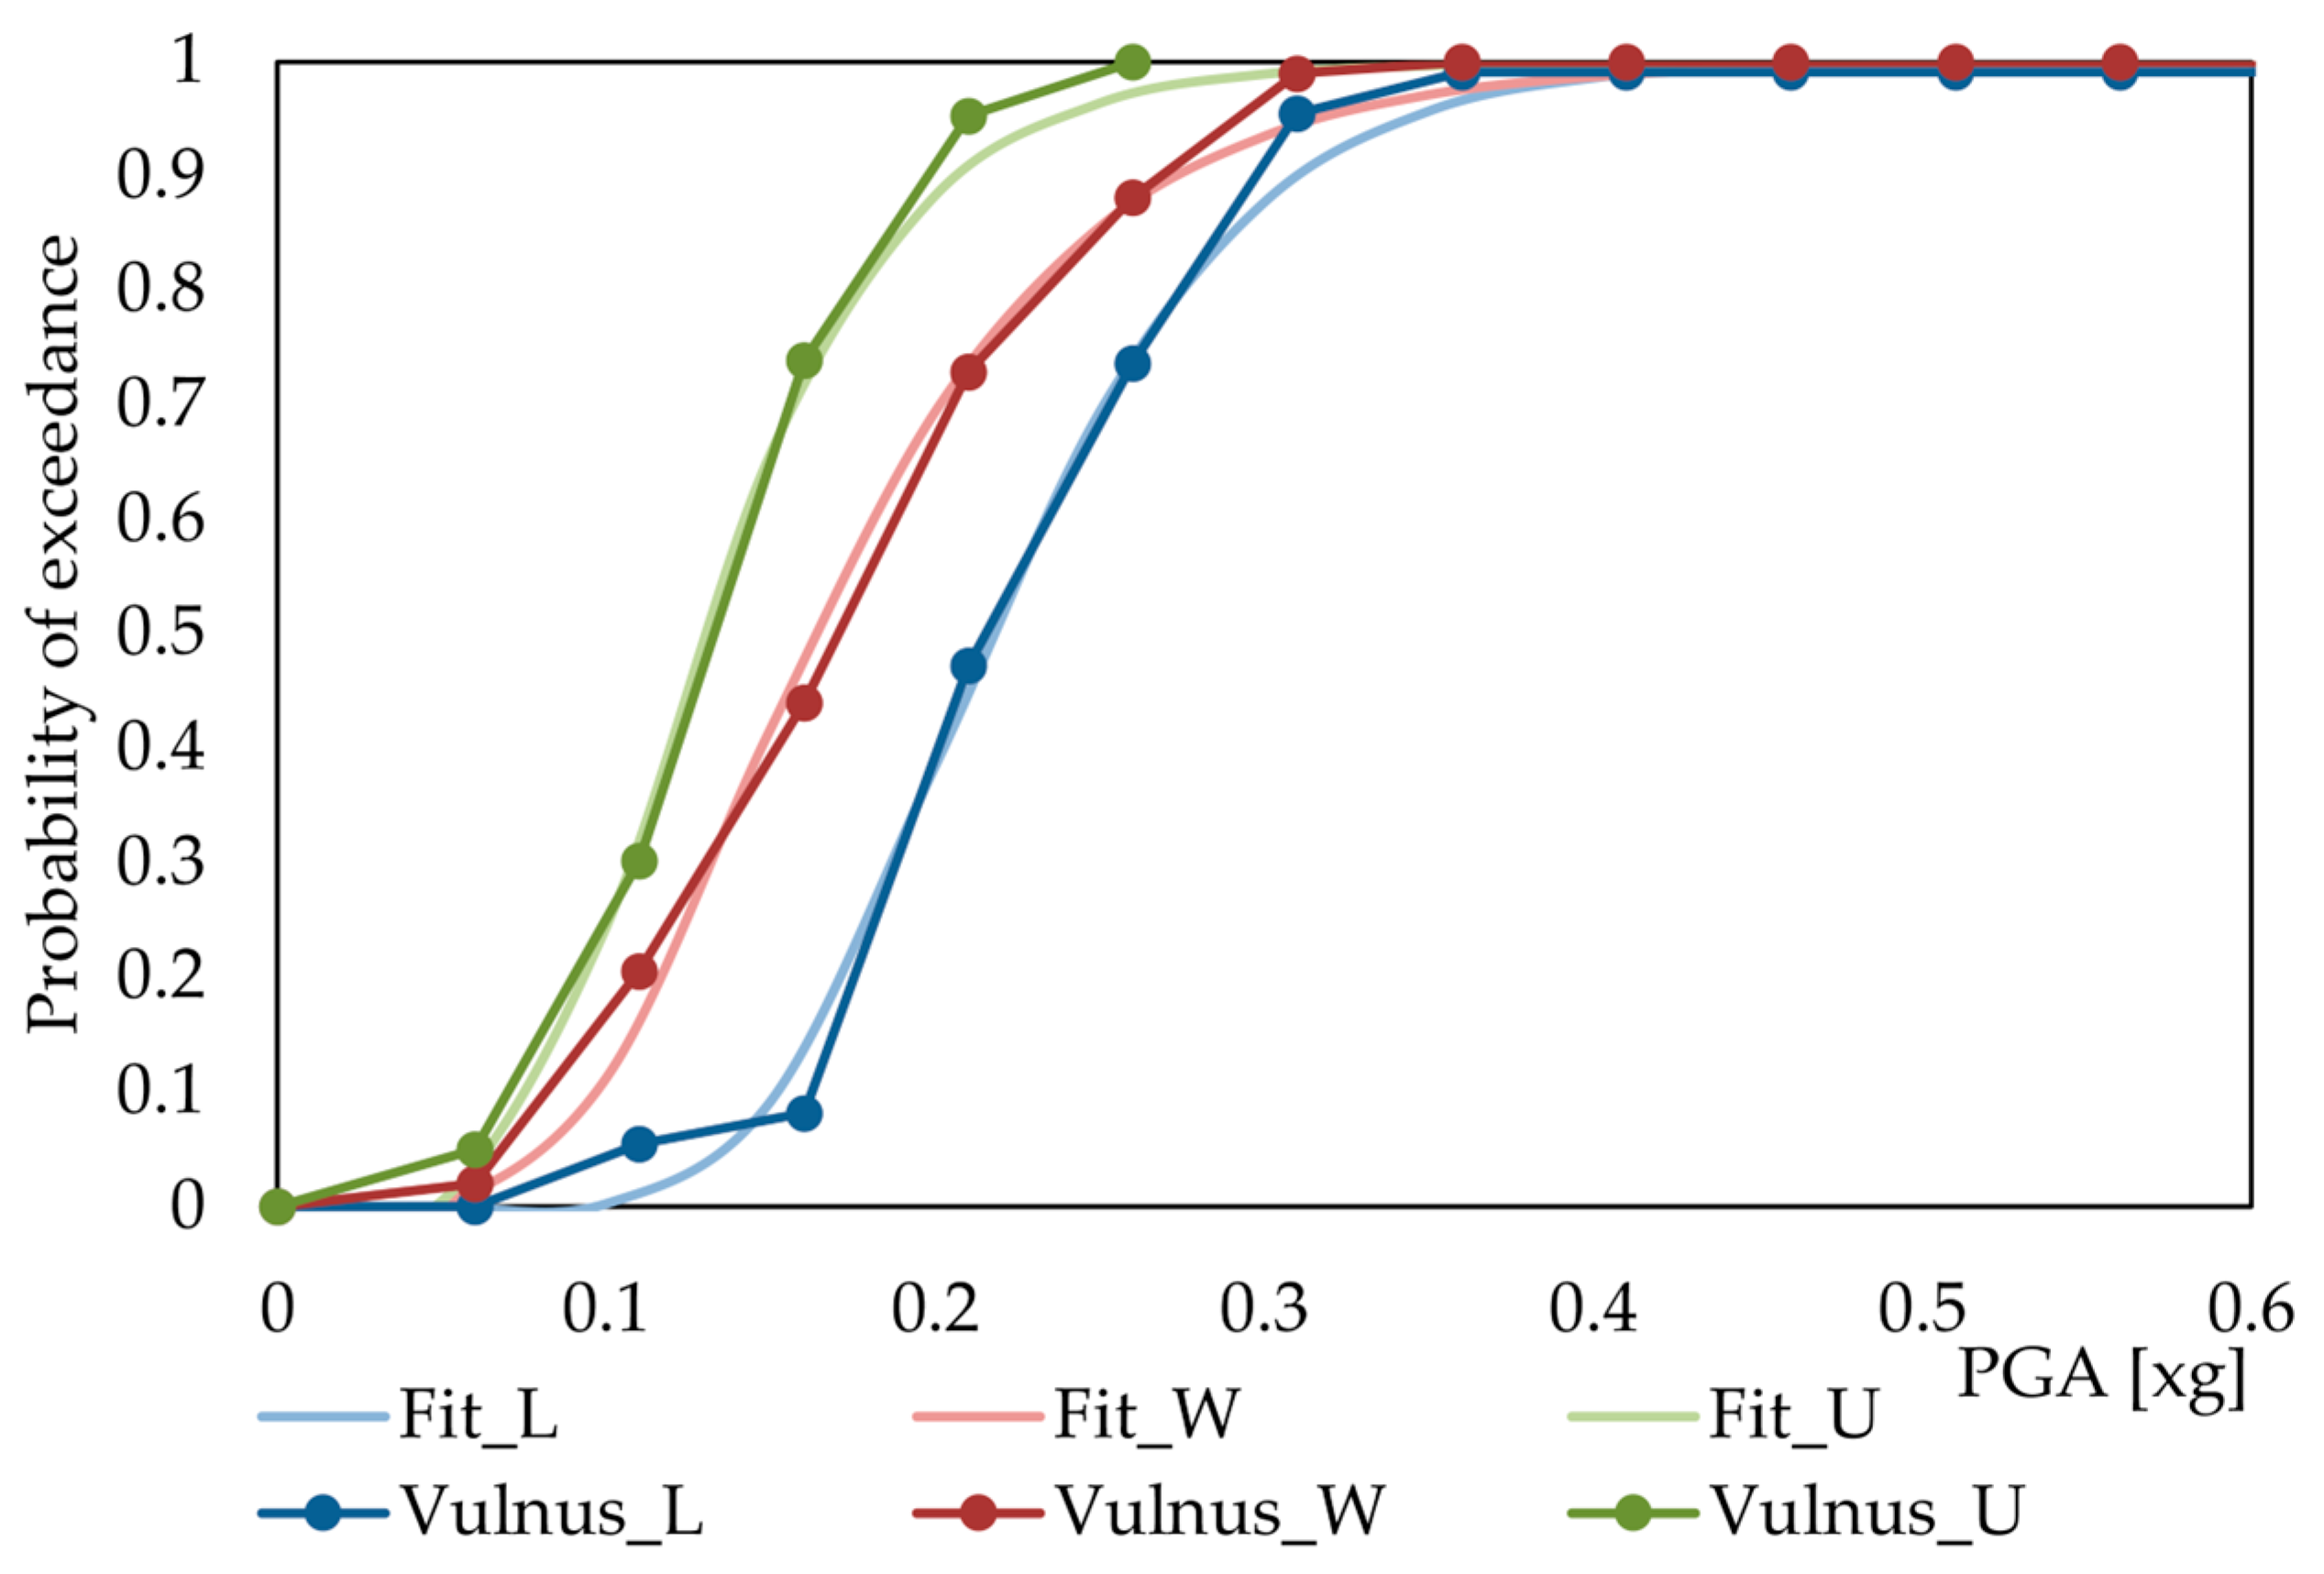
The number of stories of the adjacent building was set to: (i) 0 when a boundary panel looks onto an open space; (ii) to the actual number when a boundary panel is shared with other buildings for more than half of its length; (iii) −1 when the panel is internal.
Table 9 shows the quality class of the GNDT-2 vulnerability factors for the MSB. Since tie beams and rigid slabs were added to the building and the masonry was not made of bricks or blocks, the expected interaction in seismic conditions is poor. Therefore, the overall organization and floor structure were classified as D. The roof has a timber structure which does not thrust out over the boundary walls, although the presence of an added crowning tie beam slightly worsens this good condition. The vertical and the plan irregularity are similarly low, as the building is L-shaped with the ‘flange’ is as long as the main edifice of the building, and there is a one-story difference between these parts. Moreover, the walls are thick compared to their length and, therefore, this parameter was assessed as good. The masonry quality is overall poor; it is slightly improved by the coursing and the grout injections, but the stones are much smaller than the wall thickness and there are no bond stones; the resulting normalized shear strength was low. The soil is rocky but steep, and there are probably no foundations; therefore, the resulting class was low. There are a few chimneys, non-structural ceilings are absent and internal partitions are very small, therefore non-structural elements were rated as good. The maintenance state is also good.

6.2. Results

VOP was calculated as 0.36 and it was obtained for panel 2 of wall 2 (compare Figure 10); Table 10 shows the other partial values of VOP, i.e., V′OP and V″OP. The first panel of the same wall was omitted as it is internal, and the local mechanisms were not calculated. Conversely, panel 1 of wall 5 was considered, as it may appear internal in Figure 10, but it is free at the TP (Figure 16); therefore, the possible local mechanisms were calculated for the TP. The overall overturning appeared as the most probable mechanism, and the vertical cracks (see Figure 15) may be also associated with this failure mode. The main expected ‘horizontal mechanisms’ were the overturning of the flange at the TP alone (Figure 2d), the vertical bending (Figure 2e) and the expulsion of the flange (Figure 2f). Actually, the crack pattern shows that the corners of the building suffered the most substantial damage, as they tended to be expulsed. The index VIP was calculated as 0.328 and the critical direction (i.e., the minimum value) was the X one. Finally, VV was 0.455 and Iv was 0.588; this slight difference was due to the poor-quality class of the factors Overall Organization and Floor Structures (D), given the added rigid floors slabs, which are neglected in VV. These values correspond to a moderate-to-low empirical vulnerability. This was confirmed by the seismic behavior of the building, as it was damaged, but no local mechanism exceeded the first activation, and the walls mostly showed IP cracking. Overall, the vulnerability was assessed as moderate to low, as VOP and VIP were almost equal to the expected pga at SD, and the components V′OP and V″OP were close to the pga at DL.
The fragility curves of MSB (Figure 17) referring to the activation of local mechanisms (DS2–DS3) had median values of 0.129 g, 0.163 g and 0.217 g for the upper, central and lower bounds of the vulnerability function, with standard deviations of 0.121 g, 0.175 g, and 0.160 g, respectively. These values resulted from fitting continuous curves into the discrete ones originally calculated by Vulnus.
Considering the expected pga values for the site, and the pga = 0.277 g measured in the 2016 Central Italy earthquake (station in Castelvecchio (PG) [86], 7 km away from Montesanto), there was a high probability of the activation of a local mechanism (about 85% for the white curve). Indeed, this is what occurred in the building.

7. Conclusions

Vulnus Web has innovated the Vulnus procedure for the simplified assessment of the seismic vulnerability of existing residential masonry buildings, based on their normalized shear strength, the activation of local mechanisms and their qualitative state. These three factors were combined by means of fuzzy set theory in a vulnerability function, the evolution of which is governed by the confidence level acquired for them during a survey; outcomes are a linguistic assessment of vulnerability and a fragility curve.
The main results achieved in this study are as follows:
  • The redefinition of the complete framework of the Vulnus procedure for the seismic vulnerability assessment of masonry buildings is based on simplified input, while also accounting for geometric and qualitative features.
  • The implementation of the procedure through a website improves both its dissemination, as it does not require installation on local devices, and its accessibility, thanks to a responsive user interface. The input phase was also simplified by a preformatted spreadsheet which can be uploaded to the website; likewise, the output can be downloaded from the website.
  • These new features enable the user to deal with building stocks of moderate size (a few hundred buildings), thus exceeding the capabilities of the previous version. The central archiving and management of data also contribute to the creation of a stock which can be analyzed and assessed over the course of a period of time.
  • Vulnus Web represents a transfer of technology from engineering practitioners to the general public, thus contributing to the spread of good practices and knowledge from the scientific community.
  • A trial application on a damaged building showed encouraging results in terms of expected damage (type and position) and an improved correlation with the probability of observing damage related to the activation of local mechanisms.
Among possible future developments, the following should be mentioned: (i) the automation of the qualitative vulnerability assessment, now mostly charged to the screener; (ii) the implementation of the geometric data of the RP from CAD/BIM models; and (iii) a further calibration through application to damaged buildings aimed at increasing the predictive capacity of the procedure. This may include the addition of new local mechanisms and comparison with other state-of-the-art mechanical approaches (e.g., pushover analyses) or vulnerability assessment methods.

Author Contributions

Conceptualization, M.R.V., V.F. and L.S.; methodology, M.R.V., V.F. and L.S.; software, V.F. and L.S.; validation, V.F. and L.S.; formal analysis, V.F. and L.S.; resources, M.R.V.; data curation, V.F. and L.S.; writing—original draft preparation, V.F. and L.S.; writing—review and editing, M.R.V., V.F. and L.S.; visualization, L.S.; supervision, M.R.V.; project administration, M.R.V.; funding acquisition, M.R.V. All authors have read and agreed to the published version of the manuscript.

Funding

This research was funded by DPC-Reluis, Project 2019-21 WP5-WP2.

Institutional Review Board Statement

Not applicable.

Informed Consent Statement

Not applicable.

Data Availability Statement

The data presented in this study are available on request from the corresponding author. The data are not publicly available due to privacy concerns about the personal information related to the buildings.

Acknowledgments

The authors wish to thank R. Vicentini for his help in developing the website.

Conflicts of Interest

The authors declare no conflict of interest.

Appendix A. Vulnus Survey Form

1. Geometric Data and General Description
DatumValueDatumValue
Masonry type Facade length (X axis) [cm]
Masonry improving coefficient Number of tie rods (X axis)
Maintenance state Facade length (Y axis) [cm]
Number of floors Number of tie rods (Y axis)
Height [cm] Friction coefficient (X axis)
Regularity in plan Friction coefficient (Y axis)
Floor area [m2] Number of stories with tie beams
Floor load category Tie beam/wall thickness ratio
Warping direction of diaphragms Vertical irregularity
Regularity of diaphragms
2. Qualitative vulnerability assessment
Vulnerability factorQuality classConfidence Level
Overall organization
Masonry quality
Normalized shear strength
Soil and foundations
Floor structure
Plan irregularity
Vertical irregularity
Max distance between transverse walls
Roof structure
Non-structural elements
Maintenance state
3. Wall schedule
Wall
Direction
Start node
Panel ID
End node
Thickness (RP)
Length
Opening length
Flanges
Thickness (TP)
Number of stories (adjacent building)

References

  1. GlobalABC (Global Alliance for Buildings and Construction); IEA (International Energy Agency); UNEP (the United Nations Environment Programme). GlobalABC Roadmap for Buildings and Construction: Towards a Zero-Emission, Efficient and Resilient Buildings and Construction Sector; IEA: Paris, France, 2020. [Google Scholar]
  2. UN (United Nations). Sendai Framework for Disaster Risk Reduction 2015–2030; UN (United Nations): New York, NY, USA, 2015. [Google Scholar]
  3. European Commission. Communication from the Commission to the European Parliament, the European Council, the European Economic and Social Committee and the Committee of the Regions. In The European Green Deal; European Commission: Luxembourg, 2019. [Google Scholar]
  4. Belleri, A.; Marini, A. Does Seismic Risk Affect the Environmental Impact of Existing Buildings? Energy Build. 2016, 110, 149–158. [Google Scholar] [CrossRef]
  5. Passoni, C.; Marini, A.; Belleri, A.; Menna, C. Redefining the Concept of Sustainable Renovation of Buildings: State of the Art and an LCT-Based Design Framework. Sustain. Cities Soc. 2021, 64, 102519. [Google Scholar] [CrossRef]
  6. Praseeda, K.I.; Venkatarama Reddy, B.V.; Mani, M. Life-Cycle Energy Assessment in Buildings: Framework, Approaches, and Case Studies. In Encyclopedia of Sustainable Technologies; Elsevier: Amsterdam, The Netherlands, 2017; pp. 113–136. ISBN 978-0-12-804792-7. [Google Scholar]
  7. Guidetti, E.; Ferrara, M. Embodied Energy in Existing Buildings as a Tool for Sustainable Intervention on Urban Heritage. Sustain. Cities Soc. 2023, 88, 104284. [Google Scholar] [CrossRef]
  8. DPC National Risk Assessment. Overview of the Potential Major Disasters in Italy: Seismic, Volcanic, Tsunami, Hydrogeological/Hydraulic and Extreme Weather, Droughts and Forest Fire Risks; DPC National Risk Assessment: Roma, Italy, 2018.
  9. Rahnema, H.; Mirasi, S. Seismic and Geotechnical Study of Land Subsidence and Vulnerability of Rural Buildings. Int. J. Geosci. 2012, 3, 878–884. [Google Scholar] [CrossRef]
  10. Li, Y.; Ahuja, A.; Padgett, J.E. Review of Methods to Assess, Design for, and Mitigate Multiple Hazards. J. Perform. Constr. Facil. 2012, 26, 104–117. [Google Scholar] [CrossRef]
  11. Calvi, G.M.; Pinho, R.; Magenes, G.; Bommer, J.J.; Restrepo-Vélez, L.F.; Crowley, H. Development of Seismic Vulnerability Assessment Methodologies over the Past 30 Years. ISET J. Earthq. Technol. 2006, 43, 75–104. [Google Scholar]
  12. Kassem, M.M.; Mohamed Nazri, F.; Noroozinejad Farsangi, E. The Seismic Vulnerability Assessment Methodologies: A State-of-the-Art Review. Ain Shams Eng. J. 2020, 11, 849–864. [Google Scholar] [CrossRef]
  13. FEMA. Rapid Visual Screening of Buildings for Potential Seismic Hazards: A Handbook (FEMA P-154); Federal Emergency Management Agency: Washington, DC, USA, 2015.
  14. Ningthoujam, M.C.; Nanda, R.P. Rapid Visual Screening Procedure of Existing Building Based on Statistical Analysis. Int. J. Disaster Risk Reduct. 2018, 28, 720–730. [Google Scholar] [CrossRef]
  15. Zuccaro, G.; Dolce, M.; De Gregorio, D.; Speranza, E.; Moroni, M. La Scheda Cartis per La Caratterizzazione Tipologico-Strutturale Dei Comparti Urbani Costituiti Da Edifici Ordinari. Valutazione Dell’esposizione in Analisi Di Rischio Sismico. In Proceedings of the 34 Convegno Nazionale GNGTS, Trieste, Italy, 17 November 2015. [Google Scholar]
  16. Sbrogiò, L.; Saretta, Y.; Molinari, F.; Valluzzi, M.R. Multilevel Assessment of Seismic Damage and Vulnerability of Masonry Buildings (MUSE-DV) in Historical Centers: Development of a Mobile Android Application. Sustainability 2022, 14, 7145. [Google Scholar] [CrossRef]
  17. Benedetti, D.; Petrini, V. Sulla Vulnerabilità Sismica Di Edifici in Muratura: Un Metodo Di Valutazione. Ind. Delle Costr. 1984, 149, 66–74. [Google Scholar]
  18. Giovinazzi, S.; Lagomarsino, S. A Macroseismic Method for the Vulnerability Assessment of Buildings. In Proceedings of the 13th World Conference on Earthquake Engineering, Vancouver, BC, Canada, 1–6 August 2004. [Google Scholar]
  19. Ferreira, T.; Vicente, R.; Varum, H.; Costa, A.; Mendes da Silva, J.A.R. Seismic Vulnerability Assessment of the Old City Centre of Seixal, Portugal. Bull. Earthq. Eng. 2012, 11, 1753–1773. [Google Scholar] [CrossRef]
  20. Ferreira, T.M.; Maio, R.; Vicente, R. Seismic Vulnerability Assessment of the Old City Centre of Horta, Azores: Calibration and Application of a Seismic Vulnerability Index Method. Bull. Earthq. Eng. 2017, 15, 2879–2899. [Google Scholar] [CrossRef]
  21. Oliveira, C.S.; Ferreira, M.A.; Oliveira, M.; de Sá, F.M. Planning in Seismic Risk Areas—The Case of Faro—Algarve. A First Approach. In Proceedings of the XIth ANIDIS, CD-Rom, Genova, Italy, 25–29 January 2004. [Google Scholar]
  22. Vicente, R.; Parodi, S.; Lagomarsino, S.; Varum, H.; Silva, J.A.R.M. Seismic Vulnerability and Risk Assessment: Case Study of the Historic City Centre of Coimbra, Portugal. Bull. Earthq. Eng. 2011, 9, 1067–1096. [Google Scholar] [CrossRef]
  23. Ferreira, T.; Vicente, R.; Varum, H. Seismic Vulnerability Assessment of Masonry Facade Walls. In Proceedings of the 14th European Conference on Earthquake Engineering (14 ECEE), Ohrid, Republic of Macedonia, 30 August–3 September 2010. [Google Scholar]
  24. Brando, G.; Cianchino, G.; Rapone, D.; Spacone, E.; Biondi, S. A CARTIS-Based Method for the Rapid Seismic Vulnerability Assessment of Minor Italian Historical Centres. Int. J. Disaster Risk Reduct. 2021, 63, 102478. [Google Scholar] [CrossRef]
  25. Chieffo, N.; Formisano, A.; Landolfo, R.; Milani, G. A Vulnerability Index Based-Approach for the Historical Centre of the City of Latronico (Potenza, Southern Italy). Eng. Fail. Anal. 2022, 136, 106207. [Google Scholar] [CrossRef]
  26. De Santis, S. An Expeditious Tool for the Vulnerability Assessment of Masonry Structures in Post-Earthquake Reconstruction. Bull. Earthq. Eng. 2022, 20, 8445–8469. [Google Scholar] [CrossRef]
  27. Romis, F.; Caprili, S.; Salvatore, W.; Ferreira, T.M.; Lourenço, P.B. An Improved Seismic Vulnerability Assessment Approach for Historical Urban Centres: The Case Study of Campi Alto Di Norcia, Italy. Appl. Sci. 2021, 11, 849. [Google Scholar] [CrossRef]
  28. Angeletti, P.; Bellina, A.; Guagenti, E.; Moretti, A.; Petrini, V. Comparison between Vulnerability Assessment and Damage Index, Some Results. In Proceedings of the Ninth World Conference on Earthquake Engineering, Tokio-Kyoto, Japan, 2–9 August 1988; Volume 3, pp. 181–186. [Google Scholar]
  29. Guagenti, E.; Petrini, V. Il Caso Delle Vecchie Costruzioni. In Proceedings of the VI Convengo ANDIS, L’ingegneria Sismica in Italia, Milano, Italy, 4–6 October 1989. [Google Scholar]
  30. Shabani, A.; Kioumarsi, M.; Zucconi, M. State of the Art of Simplified Analytical Methods for Seismic Vulnerability Assessment of Unreinforced Masonry Buildings. Eng. Struct. 2021, 239, 112280. [Google Scholar] [CrossRef]
  31. D’Ayala, D.; Speranza, E. Definition of Collapse Mechanism and Seismic Vulnerability of Historic Masonry Buildings. Earthq. Spectra 2003, 19, 479–509. [Google Scholar] [CrossRef]
  32. MIBAC. Linee Guida per La Valutazione e Riduzione Del Rischio Sismico Del Patrimonio Culturale Allineate Alle Nuove Norme Tecniche per Le Costruzioni (d.m. 14 Gennaio 2008); MIBAC: Roma, Italy, 2010; Volume 26. [Google Scholar]
  33. Bernardini, A.; Gori, R.; Modena, C. Application of Coupled Analytical Models and Experimental Knowledge to Seismic Vulnerability Analyses of Masonry Buildings. In Earthquake Damage Evaluation and Vulnerability Analysis of Building Structures; Koridze, A., Ed.; Engineering Aspects of Earthquake Phenomena; Omega Scientific: Singapore, 1990; Volume 3, pp. 163–179. [Google Scholar]
  34. Borzi, B.; Crowley, H.; Pinho, R. Simplified Pushover-Based Earthquake Loss Assessment (SP-BELA) Method for Masonry Buildings. Int. J. Archit. Herit. 2008, 2, 353–376. [Google Scholar] [CrossRef]
  35. Sansoni, C.; da Silva, L.C.M.; Marques, R.; Pampanin, S.; Lourenço, P.B. SLaMA-URM Method for the Seismic Vulnerability Assessment of UnReinforced Masonry Structures: Formulation and Validation for a Substructure. J. Build. Eng. 2023, 63, 105487. [Google Scholar] [CrossRef]
  36. Arrighetti, A.; Fratini, F.; Minutoli, G.; Pancani, G. Historical Seismic Events and Their Traces on Medieval Religious Buildings. In Handbook of Cultural Heritage Analysis; D’Amico, S., Venuti, V., Eds.; Springer: Cham, Switzerland, 2022; Volume 2, pp. 2181–2210. ISBN 978-3-030-60016-7. [Google Scholar]
  37. Rodríguez-Pascua, M.Á.; Silva, P.G.; Giner-Robles, J.L.; Perucha, M.Á.; Roquero, E.; Bardají, T.; Elez, J.; Pérez-López, R. Earthquake Archaeological Effects (EAEs) for Identification of Seismic Damage and Intensity Assessments in the Cultural Heritage. In Handbook of Cultural Heritage Analysis; D’Amico, S., Venuti, V., Eds.; Springer International Publishing: Cham, Switzerland, 2022; pp. 1779–1789. ISBN 978-3-030-60015-0. [Google Scholar]
  38. Zadeh, L.A. Fuzzy Sets. Inf. Control 1965, 8, 338–353. [Google Scholar] [CrossRef]
  39. Asadi, Y.; Samany, N.N.; Ezimand, K. Seismic Vulnerability Assessment of Urban Buildings and Traffic Networks Using Fuzzy Ordered Weighted Average. J. Mt. Sci. 2019, 16, 677–688. [Google Scholar] [CrossRef]
  40. Bektaş, N.; Lilik, F.; Kegyes-Brassai, O. Development of a Fuzzy Inference System Based Rapid Visual Screening Method for Seismic Assessment of Buildings Presented on a Case Study of URM Buildings. Sustainability 2022, 14, 16318. [Google Scholar] [CrossRef]
  41. Ketsap, A.; Hansapinyo, C.; Kronprasert, N.; Limkatanyu, S. Uncertainty and Fuzzy Decisions in Earthquake Risk Evaluation of Buildings. Eng. J. 2019, 23, 89–105. [Google Scholar] [CrossRef]
  42. Moseley, J.; Dritsos, S. Rapid Assessment of Seismic Vulnerability Using Fuzzy Logic. In Proceedings of the Third Conference on Earthquake Engineering and Engineering Seismology, Athens, Greece, 5 November 2008; p. 15. [Google Scholar]
  43. Roy, K.S.; Hassan, M.J.; Islam, K.; Islam, N. Application of the Fuzzy Set Theory to the Seismic Vulnerability Assessment. In Proceedings of the Fifth International Conference on Geotechnique, Construction Materials and Environment, Osaka, Japan, 16–18 November 2015. [Google Scholar]
  44. Tesfamariam, S.; Saatcioglu, M. Risk-Based Seismic Evaluation of Reinforced Concrete Buildings. Earthq. Spectra 2008, 24, 795–821. [Google Scholar] [CrossRef]
  45. Tesfamariam, S.; Saatcioglu, M. Seismic Vulnerability Assessment of Reinforced Concrete Buildings Using Hierarchical Fuzzy Rule Base Modeling. Earthq. Spectra 2010, 26, 235–256. [Google Scholar] [CrossRef]
  46. Martins, L.; Silva, V.; Crowley, H.; Cavalieri, F. Vulnerability Modellers Toolkit, an Open-Source Platform for Vulnerability Analysis. Bull. Earthq. Eng. 2021, 19, 5691–5709. [Google Scholar] [CrossRef]
  47. Porter, K.; Hellman, S.; Hortacsu, A. FEMA ROVER Version 2 and ROVER ATC-20, Mobile Earthquake Safety Software. In Proceedings of the Improving the Seismic Performance of Existing Buildings and Other Structures, San Francisco, CA, USA, 10–12 December 2015; American Society of Civil Engineers: San Francisco, CA, USA, 2015; pp. 787–796. [Google Scholar]
  48. Columbro, C.; Eudave, R.R.; Ferreira, T.M.; Lourenço, P.B.; Fabbrocino, G. On the Use of Web Mapping Platforms to Support the Seismic Vulnerability Assessment of Old Urban Areas. Remote Sens. 2022, 14, 1424. [Google Scholar] [CrossRef]
  49. Bernardini, A. Vulnus: Calibrazione e Impostazione Della Nuova Base Di Dati Oracle. In La Vulnerabilità Degli Edifici; Bernardini, A., Ed.; CNR-GNDT: Roma, Italy, 2000. [Google Scholar]
  50. Bernardini, A.; Gori, R.; Modena, C. A Knowledge Based Survey of Masonry Buildings Form Seismic Vulnerability Evaluations. Cah. Cent. Eur. Geodyn. Seismol. 1992, 6, 291–301. [Google Scholar]
  51. ISTAT. 15° Censimento Della Popolazione e Delle Abitazioni Website and Data Warehouse; ISTAT: Roma, Italy, 2011.
  52. Ferrini, M.; Melozzi, A.; Pagliazzi, A.; Scarparolo, S. Valutazione Della Vulnerabilità Sismica per Edifici in Muratura: Modifiche Ed Integrazioni Introdotte Dalla Regione Toscana al Manuale per La Compilazione Della Scheda Di II Livello. In Proceedings of the XI Convegno Nazionale ANIDIS “L’ingegneria sismica in Italia”, Genova, Italy, 25–29 January 2004. [Google Scholar]
  53. Bernardini, A.; Modena, C.; Zaupa, F. Valutazione Dello Stato Di Consistenza Strutturale Di Edifici in Muratura Nell’area Sismica Del Monte Baldo. In Proceedings of the Atti Del 2° Convegno Nazionale L’ingegneria sismica in Italia, Rapallo, Italy, 6–9 June 1984; pp. 3193–3204. [Google Scholar]
  54. Bernardini, A.; Modena, C. A Simple Theoretical Model for a Statistical Evaluation of the Vulnerability of Masonry Buildings. In Proceedings of the International Conference on Recostruction, Restauration and urban Planning of Towns and Regions in Seismic Prone Areas, Skopje, North Macedonia, 5–9 November 1985; pp. 365–372. [Google Scholar]
  55. Bernardini, A.; Modena, C. Databases and Seismic Reliability Analyses of Large Groups of Masonry Buildings: A Microcomputer Procedure. In Proceedings of the Microcomputers in Engineering. Development and Application Software; Schrefler, B.A., Lewis, R.W., Eds.; Pineridge Press: Swansea, UK, 1986; pp. 369–380. [Google Scholar]
  56. Bernardini, A.; Modena, C. The Vulnerability of Masonry Buildings Typologies in a Seismic Area. In Proceedings of the 8th European Conference on Earthquake Engineering; Laboratorio Nacional De Engenharia Civil: Lisboa, Italy, 1986; pp. 57–64. [Google Scholar]
  57. Bernardini, A.; Modena, C. Application of the Fuzzy Sets Theory to the Reliability Evaluations of Structural Systems. In Proceedings of the International Symposium on Fuzzy Systems and Knowledge Engineering, Guangzhou/Guiyang, China, 10–16 July 1987. [Google Scholar]
  58. Bernardini, A. (Ed.) Manuale d’uso Del Programma Vulnus 4. Procedura Automatica per Analisi Di Vulnerabilità Sismica Di Edifici in Muratura; IRIS: London, UK, 2009.
  59. Bernardini, A.; Gori, R.; Modena, C. A Theoretical Model for Seismic Damage Forecasting of Masonry Buildings. In Proceedings of the 9th European Conference on Earthquake Engineering, Moscow, 1990; EAEE: New York, NY, USA, 1990; Volume 9, pp. 313–322. [Google Scholar]
  60. Bernardini, A.; Gori, R.; Modena, C. A Structural Model for Continuous Masonry Building Systems in Historical Centres. In Proceedings of the International Technical Conference “Structural Conservation of Stone Masonry”, Athens, Greece, 31 October–3 November 1989. [Google Scholar]
  61. Munari, M.; Valluzzi, M.R.; Saisi, A.; Cardani, G.; Modena, C.; Binda, L. The Limit Analysis of Macro-Elements in Masonry Aggregate Buildings as a Methodology for the Seismic Vulnerability Study: An Application to Umbrian City Centers. In Proceedings of the 11th Canadian Masonry Symposium, Toronto, ON, Canada, 31 May–3 June 2009. [Google Scholar]
  62. Valluzzi, M.R.; Munari, M.; Modena, C.; Binda, L.; Cardani, G.; Saisi, A. Multilevel Approach to the Vulnerability Analysis of Historic Buildings in Seismic Areas Part 2: Analytical Interpretation of Mechanisms for Vulnerability Analysis and Structural Improvement. Int. J. Restor. Build. Monum. 2007, 13, 427–442. [Google Scholar] [CrossRef]
  63. da Porto, F.; Munari, M.; Prota, A.; Modena, C. Analysis and Repair of Clustered Buildings: Case Study of a Block in the Historic City Centre of L’Aquila (Central Italy). Constr. Build. Mater. 2013, 38, 1221–1237. [Google Scholar] [CrossRef]
  64. Munari, M.; Valluzzi, M.R.; Cardani, G.; Anzani, A.; Binda, L.; Modena, C. Seismic Vulnerability Analyses of Masonry Aggregate Buildings in the Historical Centre of Sulmona (Italy). In Proceedings of the 13th International Conference on Structural Faults and Repair, Edinburgh, UK, 15–17 June 2010. [Google Scholar]
  65. Grunthal, G. (Ed.) Cahiers du Centre Européen de Géodynamique et de Séismologie. In European Macroseismic Scale 1998 (EMS-98); Musée National d’Histoire Naturelle: Luxembourg, 1998; Volume 15. [Google Scholar]
  66. Sbrogiò, L.; Valluzzi, M.R.; Cardani, G. Recenti sviluppi sulle previsioni di vulnerabilità sismica di Campi Alto di Norcia alla luce degli interventi di riparazione e/o consolidamento e del sisma Centro Italia. In Proceedings of the Atti del XVIII Convegno ANIDIS L’ingegneria Sismica in Italia, Ascoli Piceno, Italy, 15–19 September 2019; Pisa University Press: Pisa, Italy, 2019. [Google Scholar]
  67. Donà, M.; Carpanese, P.; Follador, V.; Sbrogiò, L.; da Porto, F. Mechanics-Based Fragility Curves for Italian Residential URM Buildings. Bull. Earthq. Eng. 2021, 19, 3099–3127. [Google Scholar] [CrossRef]
  68. Vettore, M.; Donà, M.; Carpanese, P.; Follador, V.; da Porto, F.; Valluzzi, M.R. A Multilevel Procedure at Urban Scale to Assess the Vulnerability and the Exposure of Residential Masonry Buildings: The Case Study of Pordenone, Northeast Italy. Heritage 2020, 3, 1433–1468. [Google Scholar] [CrossRef]
  69. Follador, V.; Carpanese, P.; Donà, M.; da Porto, F. Effect of Retrofit Interventions on Seismic Fragility of Italian Residential Masonry Buildings. Int. J. Disaster Risk Reduct. Submitt. Manuscr. 2023. [Google Scholar] [CrossRef]
  70. Follador, V.; Donà, M.; Carpanese, P.; da Porto, F. Fragility Curves for Italian Residential Masonry Buildings with Retrofit Interventions. In Proceedings of the 8th ECCOMAS Thematic Conference on Computational Methods in Structural Dynamics and Earthquake Engineering, Athens, Greece, 28–30 June 2021; pp. 3083–3097. [Google Scholar]
  71. Chieffo, N.; Formisano, A. Comparative Seismic Assessment Methods for Masonry Building Aggregates: A Case Study. Front. Built Environ. 2019, 5, 123. [Google Scholar] [CrossRef]
  72. Cocco, G.; D’Aloisio, A.; Spacone, E.; Brando, G. Seismic Vulnerability of Buildings in Historic Centers: From the “Urban” to the “Aggregate” Scale. Front. Built Environ. 2019, 5, 78. [Google Scholar] [CrossRef]
  73. Cattari, S.; Alfano, S.; Ottonelli, D.; Saler, E.; da Porto, F. Comparative Study on Two Analytical Mechanical-Based Methods for Deriving Fragility Curves Targeted to Masonry School Buildings. In Proceedings of the 8th ECCOMAS Thematic Conference on Computational Methods in Structural Dynamics and Earthquake Engineering, Athens, Greece, 28–30 June 2021; pp. 3155–3175. [Google Scholar]
  74. Python. Available online: https://www.python.org/ (accessed on 16 February 2023).
  75. Bernardini, A.; Gori, R.; Modena, C. Misure Sfuocate in Un Sistema Esperto per La Diagnosi Di Vulnerabilità Sismica Di Edifici in Muratura; Università di Padova-Istituto Scienza e Tecnica delle Costruzioni: Padova, Italy, 1992. [Google Scholar]
  76. Modena, C.; Bernardini, A.; Gori, R. A Research on the Seismic Vulnerability of Existing Masonry Buildings. In Proceedings of the CIB -W23 Wall Structures; The Masonry Society: Austin, YX, USA, 1988. [Google Scholar]
  77. Turnšek, V.; Čačovič, F. Some Experimental Results on the Strength of Brick Masonry Walls. In Proceedings of the 2nd International Brick Masonry Conference, Stoke-on-Trent, UK, 12–15 April 1970; pp. 149–156. [Google Scholar]
  78. Bernardini, A.; Gori, R.; Modena, C. A Knowledge Based Methodology for A-Priori Estimates of Earthquake Induced Economical Lossess in Old Urban Nuclei. In Proceedings of the Sixth International Conference on Applications of Statistics and Probability in Civil Engineering, Mexico City, Mexico, 17–21 June 1991; Esteva, L., Ruiz, S.E., Eds.; pp. 1037–1044. [Google Scholar]
  79. Saretta, Y.; Sbrogiò, L.; Valluzzi, M.R. Seismic Response of Masonry Buildings in Historical Centres Struck by the 2016 Central Italy Earthquake. Calibration of a Vulnerability Model for Strengthened Conditions. Constr. Build. Mater. 2021, 299, 123911. [Google Scholar] [CrossRef]
  80. MIT. Ministry of Infrastructures and Transportations, Ministerial Decree 17/01/2018, Aggiornamento Delle «Norme Tecniche per Le Costruzioni»; MIT: Rome, Italy, 2018. (In Italian) [Google Scholar]
  81. MIT. Ministry of Infrastructures and Transportations, Regulation No. 7/2019, Istruzioni per l’applicazione Dell’«Aggiornamento Delle “Norme Tecniche per Le Costruzioni”» Di Cui al Decreto Ministeriale 17 Gennaio 2018; MIT: Rome, Italy, 2019. (In Italian) [Google Scholar]
  82. CNR-GNDT, Istruzioni per la compilazione della scheda di II livello. In CNR-GNDT Rilevamento Dell’esposizone e Vulnerabilità Sismica Degli Edifici, 1993, Roma. Available online: https://protezionecivile.regione.abruzzo.it/agenzia/files/rischio%20sismico/verificheSism/Manuale_e_scheda_GNDT_II_livello.pdf (accessed on 10 April 2023).
  83. Vulnus Web. Available online: https://vulnus.dicea.unipd.it/ (accessed on 10 April 2023).
  84. Django. Available online: https://www.djangoproject.com/ (accessed on 10 April 2023).
  85. Html. Available online: https://html.spec.whatwg.org/ (accessed on 10 April 2023).
  86. Itaca INGV. Available online: https://itaca.mi.ingv.it/ItacaNet_32/#/home (accessed on 16 February 2023).
Figure 1. ‘Vertical’ local mechanisms: (a) overall overturning; (b) overturning at top story; (c) vertical bending at top story.
Sustainability 15 06787 g001
Figure 2. ‘Horizontal’ local mechanisms developing at story level: (a) horizontal bending; (b) compression at midsection; (c) overall overturning of masonry flange; (d) overturning of flange at top story; (e) vertical bending of flange at top story; (f) expulsion of flange at top story.
Sustainability 15 06787 g002
Figure 3. Loading schemes of masonry walls in Vulnus: (a) boundary walls, letters as in Equations (1) and (2); (b) resisting arch in thickness of internal walls (shaded area) loaded in OOP direction by seismic load (aW) and consequent thrust (H) on external walls.
Sustainability 15 06787 g003
Figure 4. Vulnus membership functions to any quality class (Q) according to confidence level (CL) for any given GNDT-2 factor.
Sustainability 15 06787 g004
Figure 5. Building vulnerability domain in Vulnus: hyperbolae in thick dashed lines represent crisp boundaries, whereas thin dash-dot lines correspond to fuzzy limits. The vulnerability function Vu in 3D space is projected on inclined axis.
Sustainability 15 06787 g005
Figure 6. Subdivision of structural units (numbers in circles) in: (a) town blocks; (b) large buildings; (c) detached buildings with vertical irregularities.
Sustainability 15 06787 g006
Figure 7. Possible positions of reference plan (RP): (a) sloping site with boundary walls underground for more than 2/3 of their length; (b) sloping site with boundary walls underground for less than 2/3 of their length; (c) flat site, repeated floor plan; (d) flat site, ground plan different from typical floor plan; (e) flat site, weaker intermediate story.
Sustainability 15 06787 g007
Figure 8. Number of stories in Vulnus: (a) 2 stories; (b) 2.5 stories owing to basement; (c) 2.5 stories owing to mezzanine; (d) 2.5 stories owing to habitable loft; (e) 2 stories on sloping site; (f) 1 story on sloping site.
Sustainability 15 06787 g008
Figure 9. Vertical irregularity of floors: (a) change in warping direction; (b) double-height floor; (c) additional loads or changes in floor type; (d) structural slabs in habitable loft.
Sustainability 15 06787 g009
Figure 10. Plan layout with Vulnus scheme (wall axis in circles, nodes in squares, panels in diamonds).
Sustainability 15 06787 g010
Figure 11. Effectiveness of masonry flange according to position of opening: (a) effective flange (d1 > d2); (b) ineffective flange (d1 < d2).
Sustainability 15 06787 g011
Figure 12. Scheme of classes, their attributes, and methods of Vulnus code. The attributes and main classes correspond to tables in relational database.
Sustainability 15 06787 g012
Figure 13. Homepage of Vulnus website after login.
Sustainability 15 06787 g013
Figure 14. Website form for data input.
Sustainability 15 06787 g014
Figure 15. MSB external views: (a) from north-west; (b) from south-east.
Sustainability 15 06787 g015
Figure 16. MSB elevations and crack pattern; dashed lines outline internal floors and walls (adapted from [62]).
Sustainability 15 06787 g016
Figure 17. Fragility curves for MSB: central probability (W), lower (L) and upper (U) bounds according to fuzzy sets of VOP, VIP and VV; discrete values calculated by Vulnus Web (Vulnus) and fitted continuous curves (Fit).
Sustainability 15 06787 g017
Table 1. Vulnerability factors and weights for their linear combination in GNDT-2 and Vulnus.
#Vulnerability Factor (VF)CodeGNDT-2 Weight
(wi)
Vulnus Weight (wi,Vulnus)
1Overall organization (box likeness)OO1.500.00
2Masonry qualityMQ0.250.15
3Normalized shear strengthNS1.500.00
4Soil and foundationsSF0.750.75
5Floor structureFL0.50–1.250.50
6Plan irregularityPI0.500.00
7Vertical irregularityVI0.5–1.000.50
8Max distance between transverse wallsTW0.250.00
9Roof structureRF0.50–1.500.50
10Non-structural elementsNE0.250.25
11Maintenance stateMS1.000.50
Table 2. GNDT-2 and Vulnus vulnerability scores related to each quality class.
Quality ClassGNDT-2 Score (vi)Vulnus Score (vi,Vulnus)
A00
B5–1515
C15–2530
D4545
Table 3. GNDT-2 and Vulnus vulnerability scores related to each quality class.
Confidence LevelCodeObtained from/Sources
Very goodVDirect complete inspection, in situ testing, accurate drawings
GoodGPictures, archival documents, direct partial/quick inspection, oral information
Basic BReasonable hypotheses, expert knowledge of the screener, analogies with similar buildings
Unknown URandom guess, as no information is available
Table 4. Vulnus floor load categories (r.c. stands for reinforced concrete).
TypeDescriptiong1 + g2 [kN/m2]g2,eq [kN/m2]q [kN/m2]
Unknown-2.60.42.0
Very lightTimber1.10.42.0
Lightr.c./steel joists and jack arches2.60.42.0
Moderater.c. and clay blocks composite systems, without overlay4.10.42.0
Heavyr.c. and clay blocks composite systems, with overlay5.60.42.0
Very heavyr.c. and clay blocks composite systems, without overlay, structural vaults7.10.42.0
Table 5. Masonry types and mechanical properties of materials available in Vulnus (adapted from [81]).
TypeCompressive StrengthTensile StrengthSpecific Weight
[kg/cm2][kg/cm2][kg/m3]
Unknown10.00.802100
Random fieldstone, pebbles10.00.271900
Random rubble, uncoursed20.20.532000
Random rubble, coursed26.00.842100
Tuff, random rubble14.00.421600
Tuff, ashlar20.00.601600
Stone ashlar58.01.352200
Solid clay bricks, lime mortar26.00.751800
Table 6. GNDT-2 and Vulnus vulnerability scores related to each quality class.
ParameterGNDT-2
Quality Class
DescriptionCoefficient
Plan regularityARectangular, compact1.00
BRectangular oblong; L, U, H, T shapes with small flanges1.00
CRectangular very oblong; L, U, H, T shapes with medium flanges1.10
DL, U, H, T shapes with large flanges; 1.10
Maintenance stateAGood1.00
BSlight material degradation1.00
CMaterial degradation and/or fine cracks (up to 1 mm)0.75
DHeavy material degradation and/or moderate cracks (up to 5 mm)0.50
Table 7. GNDT-2 and Vulnus vulnerability scores related to each quality class for MSB.
#Input FieldValue
1Masonry typeCoursed rubble
2Masonry improving coefficient1.5
3Maintenance stateGood
4Number of floors2
5Height [cm]676
6Regularity in planIrregular
7Floor area [m2]111.84
8Floor load categoryHeavy (composite clay-r.c. system)
9Warping direction of diaphragmsBidirectional
10Regularity of diaphragmsRegular (repeated at every story)
11Façade length (X axis) [cm]1384
12Number of tie rods (X axis)0
13Façade length (Y axis) [cm]902
14Number of tie rods (Y axis)0
15Friction coefficient (X axis)0.6 (tie beams)
16Friction coefficient (Y axis)0.6 (tie beams)
17Number of stories with tie beams2 (all stories)
18Tie beam/wall thickness ratio0.5
19Vertical irregularityNo
Table 8. Vulnus schedule for geometric data input of MSB. In flange effect row, following keys are used: N = no opening, O = none, S = start node, E = end node, B = both; in number of stories, −1 indicates internal wall.
Wall1122344556
Direction000008787878787
Start node1245714253
Panel ID1212112121
End node2356847586
Thickness (RP)72807070707575707570
Length654730660730664453451459450464
Opening length2671209012024020008100
FlangesBREOSENONN
Thickness (TP)72807070707575707570
Number of stories (adjacent building)00−10000100
Table 9. GNDT-2 and Vulnus vulnerability scores related to each quality class for MSB.
Vulnerability FactorQuality ClassConfidence Level
Overall organizationDB
Masonry qualityCB
Normalized shear strengthCB
Soil and foundationsCU
Floor structureDB
Plan irregularityDV
Vertical irregularityCV
Max distance between transverse wallsAV
Roof structureBB
Non-structural elementsBV
Maintenance stateAV
Table 10. Partial values of V′OP and V″OP for panels of MSB. It is specified in brackets if horizontal mechanism happens at start (S) or end (E) node of panel.
WallPanelVertical MechanismV′OPHorizontal MechanismV″OP
111a0.2112d (S)0.177
121a0.1932d (E)0.189
21
221a0.1972d (S)0.163
311a0.2062d (E)0.184
411a0.1792f (S)0.248
421a0.1612f (E)0.201
511b0.1682d (S)0.255
521a0.1612e (E)0.256
611a0.1612e (E)0.225
Disclaimer/Publisher’s Note: The statements, opinions and data contained in all publications are solely those of the individual author(s) and contributor(s) and not of MDPI and/or the editor(s). MDPI and/or the editor(s) disclaim responsibility for any injury to people or property resulting from any ideas, methods, instructions or products referred to in the content.

