

Evaluation and Implication of the Policies towards China’s Carbon Neutrality

Abstract
:1. Introduction

2. Method
2.1. Data
2.2. Related Policies
3. Results
3.1. CO2 Emissions
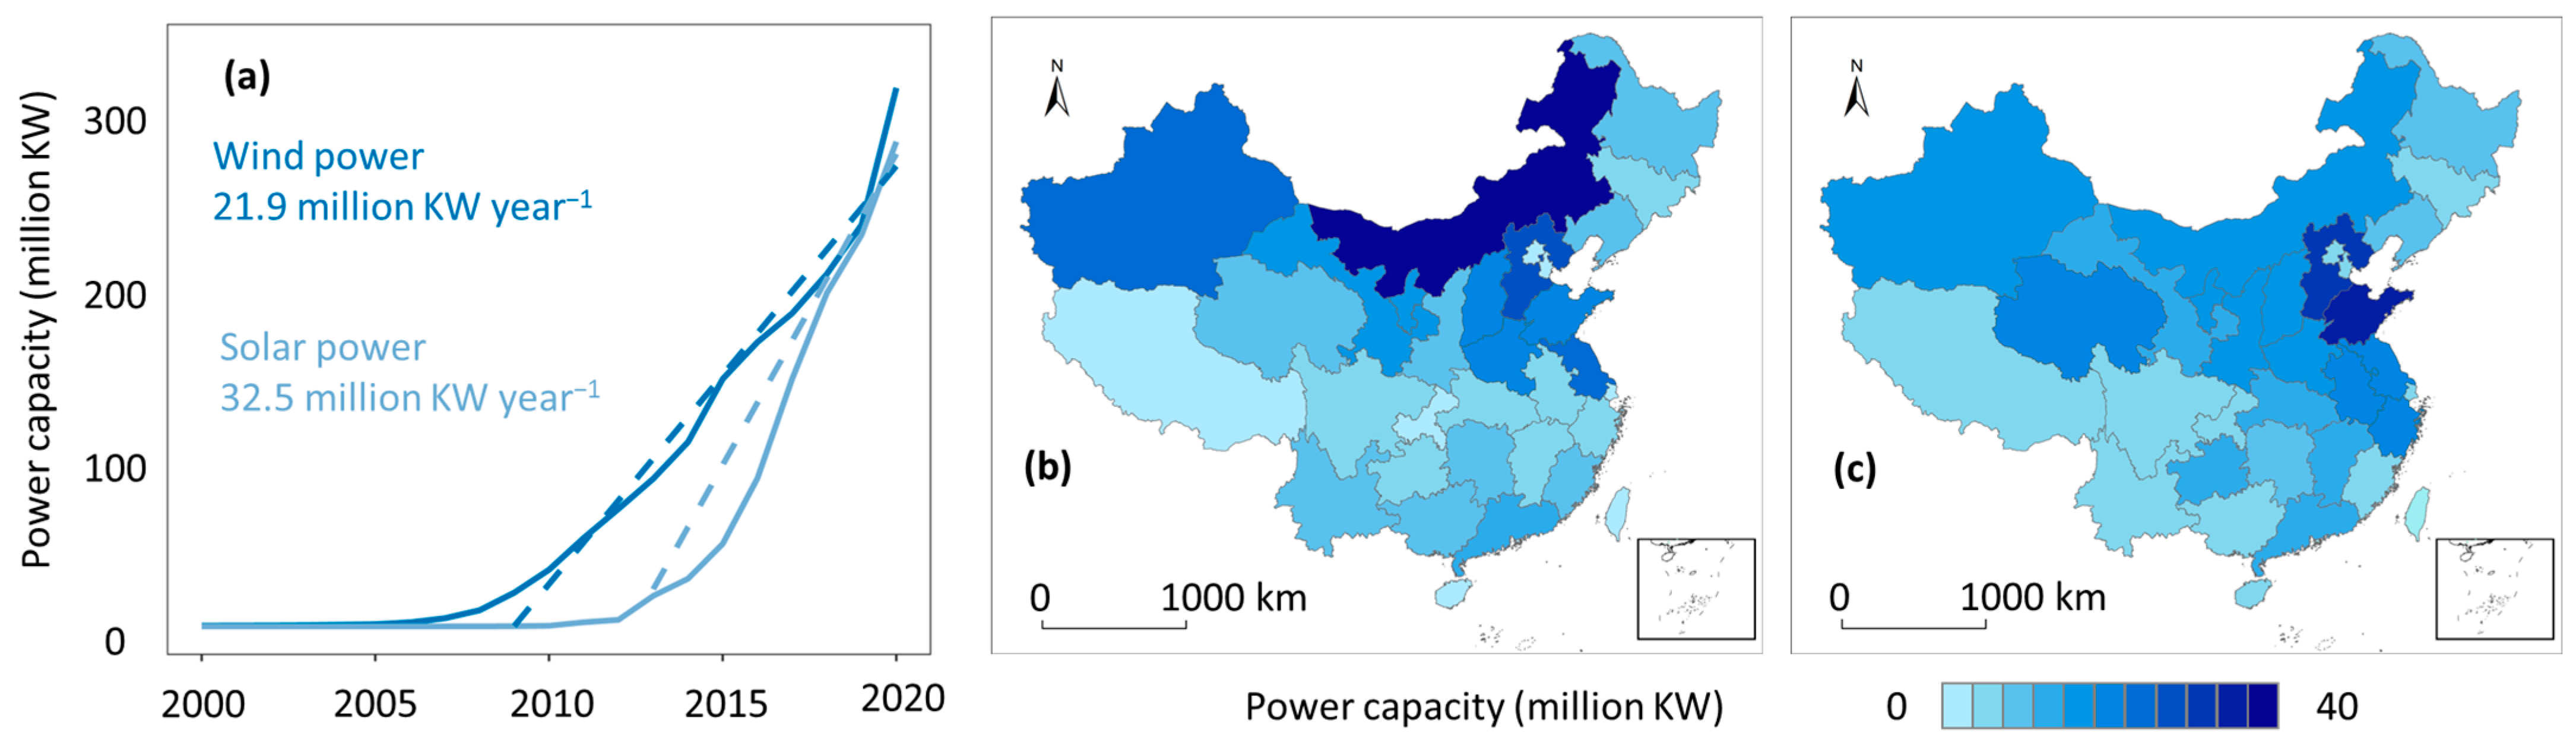
3.2. Clean Energy
3.3. Forest Recovery
4. Discussion and Implication
4.1. CO2 Abatement
4.2. Terrestrial Carbon Sink Dynamics
4.3. Carbon Peak and Neutrality Laws and Policies
4.3.1. Refinement of the National Carbon Emissions Trading Mechanism
- China should expedite carbon emissions trading legislation and establish a dedicated regulatory authority. Several government departments in China have formulated carbon emissions trading policies and can supervise carbon emissions trading by analyzing the experience of pilot areas and the policies and regulations that have been formulated in China. This can lead to confusion in the regulation of carbon emissions trading. The carbon emissions trading mechanism in some pilot areas is operating well and can play a positive role in reducing carbon emissions. However, there are still some areas where carbon emissions have not been reduced. Therefore, it is necessary to promulgate a unified legal system [80], including laws, administrative regulations, and policies. Under a unified carbon emissions trading legal system, a dedicated carbon emissions regulatory authority can promote the same emission reduction effect in each region;
- The carbon emissions trading mechanism should set flexible and strict carbon emission allowances. Strict carbon emission allowances will bring greater cost and pressure to enterprises, while loose carbon emission allowances will reduce the enthusiasm of enterprises to reduce emissions [81]. Therefore, the setting of carbon emission allowances will affect the emission reduction effect of the carbon emissions trading mechanism. The formulation of carbon emission allowances should consider the social cost of carbon [82]. When the social cost of carbon is the same as the marginal abatement cost [83], the carbon emissions trading mechanism is more efficient. From the experience of Beijing and Shanghai, the carbon emission allowances in these two regions are not fixed but constantly change according to the market. The carbon reduction effect of these two regions is also better than that of other pilot regions. Therefore, the carbon allowances in national carbon emissions trading should be set flexibly and strictly according to the social cost of carbon and market changes;
- China’s carbon emissions trading mechanism should clarify the legal responsibilities and penalties of participants. During the pilot process of carbon emissions trading, some regions did not complete the emission reduction targets, and some companies did not strictly abide by the trading rules. However, they have not suffered any serious adverse consequences. This is because carbon emissions trading policies and regulations do not clearly define the responsibilities and penalties for breaking the rules. Therefore, local governments and enterprises have no incentive to actively participate in carbon emissions trading. Therefore, it is necessary to stipulate the legal responsibilities and punishment measures of all parties, including the government and enterprises, in the formulation of a nationally unified carbon emissions trading law.
4.3.2. Stringent Emission Regulation Legislation and Policies
4.3.3. Laws and Policies towards Increasing Carbon Sink
Author Contributions
Funding
Institutional Review Board Statement
Informed Consent Statement
Data Availability Statement
Conflicts of Interest
References
- Le Quéré, C.; Andrew, R.M.; Friedlingstein, P.; Sitch, S.; Hauck, J.; Pongratz, J.; Pickers, P.A.; Korsbakken, J.I.; Peters, G.P.; Canadell, J.G.; et al. Global carbon budget 2018. Earth Syst. Sci. Data 2018, 10, 2141–2194. [Google Scholar] [CrossRef]
- Straneo, F.; Heimbach, P. North Atlantic warming and the retreat of Greenland’s outlet glaciers. Nature 2013, 504, 36–43. [Google Scholar] [CrossRef] [PubMed]
- Hari, V.; Rakovec, O.; Markonis, Y.; Hanel, M.; Kumar, R. Increased future occurrences of the exceptional 2018–2019 Central European drought under global warming. Sci. Rep. 2020, 10, 1–10. [Google Scholar] [CrossRef] [PubMed]
- Tack, J.; Barkley, A.; Nalley, L.L. Effect of warming temperatures on US wheat yields. Proc. Natl. Acad. Sci. USA 2015, 112, 6931–6936. [Google Scholar] [CrossRef]
- Checa-Garcia, R.; Shine, K.P.; Hegglin, M.I. The contribution of greenhouse gases to the recent slowdown in global-mean temperature trends. Environ. Res. Lett. 2016, 11, 094018. [Google Scholar] [CrossRef]
- Liu, Z.; Deng, Z.; He, G.; Wang, H.; Zhang, X.; Lin, J.; Qi, Y.; Liang, X. Challenges and opportunities for carbon neutrality in China. Nat. Rev. Earth Environ. 2022, 3, 141–155. [Google Scholar] [CrossRef]
- Friedlingstein, P.; O′sullivan, M.; Jones, M.W.; Andrew, R.M.; Zaehle, S. Global carbon budget 2020. Earth Syst. Sci. Data 2020, 12, 3269–3340. [Google Scholar] [CrossRef]
- Peng, S.; Piao, S.; Bousquet, P.; Ciais, P.; Li, B.; Lin, X.; Tao, S.; Wang, Z.; Zhang, Y.; Zhou, F. Inventory of anthropogenic methane emissions in mainland China from 1980 to 2010. Atmos. Chem. Phys. 2016, 16, 14545–14562. [Google Scholar] [CrossRef]
- The State Council, The People’s Republic of China. 2021. Available online: http://english.www.gov.cn/policies/latestreleases/202110/25/content_WS61760047c6d0df57f98e3c21.html (accessed on 1 August 2022).
- The State Council, The People’s Republic of China. 2001. Available online: http://www.gov.cn/gongbao/content/2001/content_60699.htm (accessed on 1 August 2022). (In Chinese)
- The State Council, The People’s Republic of China. 2011. Available online: http://www.gov.cn/2011lh/content_1825838.htm (accessed on 1 August 2022). (In Chinese)
- The Central People’s Government of the People’s Republic of China. 2009. Available online: http://www.gov.cn/ldhd/2009-11/26/content_1474016.htm (accessed on 1 August 2022). (In Chinese)
- The Central People’s Government of the People’s Republic of China. 2015. Available online: http://www.gov.cn/xinwen/2015-06/30/content_2887330.htm (accessed on 1 August 2022). (In Chinese)
- Duan, H.; Zhou, S.; Jiang, K.; Bertram, C.; Harmsen, M.; Kriegler, E.; van Vuuren, D.P.; Wang, S.-Y.; Fujimori, S.; Tavoni, M.; et al. Assessing China’s efforts to pursue the 1.5 C warming limit. Science 2021, 372, 378–385. [Google Scholar] [CrossRef]
- Qi, Y.; Wu, T.; He, J.; King, D.A. China’s carbon conundrum. Nat. Geosci. 2013, 6, 507–509. [Google Scholar] [CrossRef]
- Liu, Z.; Guan, D.; Crawford-Brown, D.; Qiang, Z.; He, K.; Liu, J. A low-carbon road map for China. Nature 2013, 500, 143–145. [Google Scholar] [CrossRef] [PubMed]
- Hu, Y.; Ren, S.; Wang, Y.; Chen, X. Can carbon emission trading scheme achieve energy conservation and emission reduction? Evidence from the industrial sector in China. Energy Econ. 2020, 85, 104590. [Google Scholar] [CrossRef]
- Martin, R.; Muûls, M.; Wagner, U.J. The Impact of the EU ETS on Regulated Firms: What is the evidence after nine years? Rev. Environ. Econ. Policy 2014, 10, 16. [Google Scholar]
- Zhang, X.; Han, L.; Han, L.; Zhu, L. How well do deep learning-based methods for land cover classification and object detection perform on high resolution remote sensing imagery? Remote Sens. 2020, 12, 417. [Google Scholar] [CrossRef]
- Chen, X.; Lin, B. Towards carbon neutrality by implementing carbon emissions trading scheme: Policy evaluation in China. Energy Policy 2021, 157, 112510. [Google Scholar] [CrossRef]
- Wang, W.; Xie, P.; Li, C.; Luo, Z.; Zhao, D. The key elements analysis from the mitigation effectiveness assessment of Chinese pilots carbon emission trading system. China Popul. Resour. Environ. 2018, 28, 26–34. [Google Scholar]
- Guan, D.; Shan, Y.; Liu, Z.; He, K. Performance assessment and outlook of China’s emission-trading scheme. Engineering 2016, 2, 398–401. [Google Scholar] [CrossRef]
- IEA. 2020. Available online: https://www.iea.org/reports/chinas-emissions-trading-scheme (accessed on 1 August 2022).
- The State Council, The People’s Republic of China. 2016. Available online: http://www.gov.cn/xinwen/2016-03/17/content_5054992.htm (accessed on 1 August 2022). (In Chinese)
- The State Council, The People’s Republic of China. 2021. Available online: http://www.gov.cn/xinwen/2021-03/13/content_5592681.htm (accessed on 1 August 2022). (In Chinese)
- Minx, J.C.; Lamb, W.F.; Callaghan, M.W.; Fuss, S.; Hilaire, J.; Creutzig, F.; Amann, T.; Beringer, T.; de Oliveira Garcia, W.; Hartmann, J.; et al. Negative emissions—Part 1: Research landscape and synthesis. Environ. Res. Lett. 2018, 13, 063001. [Google Scholar] [CrossRef]
- Farquhar, G.D.; von Caemmerer, S.; Berry, J.A. A biochemical model of photosynthetic CO2 assimilation in leaves of C3 species. Planta 1980, 149, 78–90. [Google Scholar] [CrossRef]
- Woodwell, G.M.; Whittaker, R.H.; Reiners, W.A.; Likens, G.E.; Delwiche, C.C.; Botkin, D. B The Biota and the World Carbon Budget: The terrestrial biomass appears to be a net source of carbon dioxide for the atmosphere. Science 1978, 199, 141–146. [Google Scholar] [CrossRef]
- Odum, E.P. The Strategy of Ecosystem Development: An understanding of ecological succession provides a basis for resolving man’s conflict with nature. Science 1969, 164, 262–270. [Google Scholar] [CrossRef] [PubMed]
- Besnard, S.; Carvalhais, N.; Arain, M.A.; Black, A.; De Bruin, S.; Buchmann, N.; Cescatti, A.; Chen, J.; Clevers, J.G.; Desai, A.R.; et al. Quantifying the effect of forest age in annual net forest carbon balance. Environ. Res. Lett. 2018, 13, 124018. [Google Scholar] [CrossRef]
- Pugh, T.A.M.; Lindeskog, M.; Smith, B.; Poulter, B.; Almut, A.; Vanessa, H.; Calle, L. Role of forest regrowth in global carbon sink dynamics. Proc. Natl. Acad. Sci. USA 2019, 116, 4382–4387. [Google Scholar] [CrossRef] [PubMed]
- Nabuurs, G.J.; Arets, E.J.M.M.; Schelhaas, M.J. European forests show no carbon debt, only a long parity effect. For. Policy Econ. 2017, 75, 120–125. [Google Scholar] [CrossRef]
- Wang, J.; Feng, L.; Palmer, P.I.; Liu, Y.; Fang, S.; Bösch, H.; O’Dell, C.W.; Tang, X.; Yang, D.; Liu, L.; et al. Large Chinese land carbon sink estimated from atmospheric carbon dioxide data. Nature 2020, 586, 720–723. [Google Scholar] [CrossRef] [PubMed]
- Wang, Y.; Wang, X.; Wang, K.; Chevallier, F.; Zhu, D.; Lian, J.; He, Y.; Tian, H.; Li, J.; Zhu, J.; et al. The size of the land carbon sink in China. Nature 2022, 603, E7–E9. [Google Scholar] [CrossRef] [PubMed]
- Fang, J.; Chen, A.; Peng, C.; Zhao, S.; Ci, L. Changes in forest biomass carbon storage in China between 1949 and 1998. Science 2001, 292, 2320–2322. [Google Scholar] [CrossRef]
- Piao, S.; Fang, J.; Ciais, P.; Peylin, P.; Huang, Y.; Sitch, S.; Wang, T. The carbon balance of terrestrial ecosystems in China. Nature 2009, 458, 1009–1013. [Google Scholar] [CrossRef]
- Guo, Z.D.; Hu, H.F.; Li, P.; Li, N.; Fang, J.Y. Spatio-temporal changes in biomass carbon sinks in China’s forests from 1977 to 2008. Sci. China Life Sci. 2013, 56, 661–671. [Google Scholar] [CrossRef]
- Fang, J.; Yu, G.; Liu, L.; Hu, S.; Chapin, F.S. Climate change, human impacts, and carbon sequestration in China. Proc. Natl. Acad. Sci. USA 2018, 115, 4015–4020. [Google Scholar] [CrossRef]
- Zhang, Y.; Peng, C.; Li, W.; Tian, L.; Zhu, Q.; Chen, H.; Fang, X.; Zhang, G.; Liu, G.; Mu, X.; et al. Multiple afforestation programs accelerate the greenness in the ‘Three North’ region of China from 1982 to 2013. Ecol. Indic. 2016, 61, 404–412. [Google Scholar] [CrossRef]
- Shan, Y.; Huang, Q.; Guan, D.; Hubacek, K. China CO2 emission accounts 2016–2017. Sci. Data 2020, 7, 1–9. [Google Scholar] [CrossRef] [PubMed]
- Yang, Y.; Shi, Y.; Sun, W.; Chang, J.; Zhu, J.; Chen, L.; Wang, X.; Guo, Y.; Zhang, H.; Yu, L.; et al. Terrestrial carbon sinks in China and around the world and their contribution to carbon neutrality. Sci. China Life Sci. 2022, 65, 861–895. [Google Scholar] [CrossRef] [PubMed]
- IPCC. 2006 IPCC Guidelines for National Greenhouse Gas Inventories; IPCC: Geneva, Switzerland, 2006. [Google Scholar]
- Zhu, Z.; Piao, S.; Myneni, R.B.; Huang, M.; Zeng, Z.; Canadell, J.G.; Ciais, P.; Sitch, S.; Friedlingstein, P.; Arneth, A.; et al. Greening of the Earth and its drivers. Nat. Clim. Chang. 2016, 6, 791–795. [Google Scholar] [CrossRef]
- Huang, K.; Xia, J.; Wang, Y.; Ahlström, A.; Chen, J.; Cook, R.B.; Cui, E.; Fang, Y.; Fisher, J.B.; Huntzinger, D.N.; et al. Enhanced peak growth of global vegetation and its key mechanisms. Nat. Ecol. Evol. 2018, 2, 1897–1905. [Google Scholar] [CrossRef] [PubMed]
- Solaymani, S. CO2 emissions patterns in 7 top carbon emitter economies: The case of transport sector. Energy 2019, 168, 989–1001. [Google Scholar] [CrossRef]
- China Statistics Press. China Energy Statistical Yearbook 2021; China Statistics Press: Beijing, China, 2021; ISBN 978-7-5037-9625-8.
- Zhang, Y.J.; Liang, T.; Jin, Y.L.; Shen, B. The impact of carbon trading on economic output and carbon emissions reduction in China’s industrial sectors. Appl. Energy 2020, 260, 114290. [Google Scholar] [CrossRef]
- Kruitwagen, L.; Story, K.T.; Friedrich, J.; Byers, L.; Skillman, S.; Hepburn, C. A global inventory of photovoltaic solar energy generating units. Nature 2021, 598, 604–610. [Google Scholar] [CrossRef]
- Chen, C.; Park, T.; Wang, X.; Piao, S.; Xu, B.; Chaturvedi, R.K.; Fuchs, R.; Brovkin, V.; Ciais, P.; Fensholt, R. China and India lead in greening of the world through land-use management. Nat. Sustain. 2019, 2, 122–129. [Google Scholar] [CrossRef]
- Meng, S.; Pang, Y.; Huang, C.; Li, Z. Improved forest cover mapping by harmonizing multiple land cover products over China. GIScience Remote Sens. 2022, 59, 1570–1597. [Google Scholar] [CrossRef]
- Ukkola, A.M.; Prentice, I.C.; Keenan, T.F.; Albert, I.J.M.; Van Dijk, A.I.; Viney, N.R.; Myneni, R.B.; Bi, J. Reduced streamflow in water-stressed climates consistent with CO2 effects on vegetation. Nat. Clim. Change 2016, 6, 75–78. [Google Scholar] [CrossRef]
- Zhu, Z.; Wang, H.; Harrison, S.P.; Prentice, I.C.; Qiao, S.; Tan, S. Optimality principles explaining divergent responses of alpine vegetation to environmental change. Glob. Change Biol. 2023, 29, 126–142. [Google Scholar] [CrossRef] [PubMed]
- Liu, Y.Y.; Van Dijk AI, J.M.; De Jeu, R.A.M.; Canadell, J.G.; McCabe, M.F.; Evans, J.P.; Wang, G.J. Recent reversal in loss of global terrestrial biomass. Nat. Clim. Chang. 2015, 5, 470–474. [Google Scholar] [CrossRef]
- Qiu, B.; Chen, G.; Tang, Z.; Lu, D.; Wang, Z.; Chen, C. Assessing the Three-North Shelter Forest Program in China by a novel framework for characterizing vegetation changes. ISPRS J. Photogramm. Remote Sens. 2017, 133, 75–88. [Google Scholar] [CrossRef]
- Wang, Y.; Zhao, H. The impact of China’s carbon trading market on regional carbon emission efficiency. China Popul. Resour. Environ. 2019, 29, 50–58. [Google Scholar]
- He, J.; Li, Z.; Zhang, X.; Wang, H.; Dong, W.; Chang, S.; Ou, X.; Guo, S.; Tian, Z.; Gu, A. Comprehensive report on China’s long-term low-carbon development strategies and pathways. Chin. J. Popul. Resour. Environ. 2020, 18, 263–295. [Google Scholar] [CrossRef]
- Jiang, K.; He, C.; Dai, H.; Liu, J.; Xu, X. Emission scenario analysis for China under the global 1.5 °C target. Carbon Manag. 2018, 9, 481–491. [Google Scholar] [CrossRef]
- Zhongying, W.; Sandholt, K. Thoughts on China’s energy transition outlook. Energy Transit. 2019, 3, 59–72. [Google Scholar] [CrossRef]
- Song, D.; Jiao, H.; Te, F.C. Overview of the photovoltaic technology status and perspective in China. Renew. Sustain. Energy Rev. 2015, 48, 848–856. [Google Scholar] [CrossRef]
- Wang, S.; Zhang, L.; Fu, D.; Wu, T.; Tong, Q. Selecting photovoltaic generation sites in Tibet using remote sensing and geographic analysis. Sol. Energy 2016, 133, 85–93. [Google Scholar] [CrossRef]
- Tong, D.; Farnham, D.J.; Duan, L.; Zhang, Q.; Lewis, N.S.; Caldeira, K.; Davis, S.J. Geophysical constraints on the reliability of solar and wind power worldwide. Nat. Commun. 2021, 12, 1–12. [Google Scholar] [CrossRef] [PubMed]
- Yang, X.; Jia, Z.; Ci, L. Assessing effects of afforestation projects in China. Nature 2010, 466, 315. [Google Scholar] [CrossRef] [PubMed]
- Karjalainen, T.; Kellomäki, S.; Pussinen, A. Role of Wood-Based Products in Absorbing Atmospheric Carbon; The Finnish Society of Forest Science: Helsinki, Finland, 1994; Volume 28, pp. 67–80. [Google Scholar]
- Bais-Moleman, A.L.; Sikkema, R.; Vis, M.; Reumerman, P.; Theurl, M.C.; Erb, K.-H. Assessing wood use efficiency and greenhouse gas emissions of wood product cascading in the European Union. J. Clean. Prod. 2018, 172, 3942–3954. [Google Scholar] [CrossRef]
- Churkina, G.; Organschi, A.; Reyer, C.P.O.; Ruff, A.; Vinke, K.; Liu, Z.; Reck, B.K.; Graedel, T.E.; Schellnhuber, H.J. Buildings as a global carbon sink. Nat. Sustain. 2020, 3, 269–276. [Google Scholar] [CrossRef]
- He, M.; Luis, S.; Rita, S.; He, M.; Sousa, L.R.; Sousa, R.L.; Gomes, A.; Vargas, E.; Zhang, N. Risk assessment of CO2 injection processes and storage in carboniferous formations: A review. J. Rock Mech. Geotech. Eng. 2011, 3, 39–56. [Google Scholar] [CrossRef]
- Yang, Y.; Roderick, M.L.; Zhang, S.; Mcvicar, T.R.; Donohue, R.J. Hydrologic implications of vegetation response to elevated CO2 in climate projections. Nat. Clim. Chang. 2019, 9, 44–48. [Google Scholar] [CrossRef]
- Feng, X.; Fu, B.; Piao, S.; Wang, S.; Ciais, P.; Zeng, Z.; Lü, Y.; Yuan, Z.; Li, Y.; Jiang, X.; et al. Revegetation in China’s Loess Plateau is approaching sustainable water resource limits. Nat. Clim. Chang. 2016, 6, 1019–1022. [Google Scholar] [CrossRef]
- Li, Y.; Piao, S.; Li, L.Z.X.; Chen, A.P.; Wang, X.H.; Ciais, P.; Huang, L.; Lian, X.; Peng, S.S.; Zeng, Z.Z.; et al. Divergent hydrological response to large-scale afforestation and vegetation greening in China. Sci. Adv. 2018, 4, eaar4182. [Google Scholar] [CrossRef]
- Tan, S.; Wu, B.; Yan, N.; Zeng, H. Satellite-based water consumption dynamics monitoring in an extremely arid area. Remote Sens. 2018, 10, 1399. [Google Scholar] [CrossRef]
- Ptichnikov, A.V.; Shvarts, E.A.; Popova, G.A.; Baibar, A.S. The Role of Forests in the Implementation of Russia’s Low-Carbon Development Strategy. In Doklady Earth Sciences; Pleiades Publishing: Moscow, Russia, 2022; Volume 507, pp. 981–985. [Google Scholar]
- Mcleod, E.; Chmura, G.L.; Bouillon, S.; Salm, R.; Björk, M.; Duarte, C.M.; Lovelock, C.E.; Schlesinger, W.H.; Silliman, B.R. A blueprint for blue carbon: Toward an improved understanding of the role of vegetated coastal habitats in sequestering CO2. Front. Ecol. Environ. 2011, 9, 552–560. [Google Scholar] [CrossRef]
- Nahlik, A.M.; Fennessy, M.S. Carbon storage in US wetlands. Nat. Commun. 2016, 7, 1–9. [Google Scholar] [CrossRef] [PubMed]
- Saunois, M.; Stavert, A.R.; Poulter, B.; Bousquet, P.; Zhuang, Q. The global methane budget 2000–2017. Earth Syst. Sci. Data 2020, 12, 1561–1623. [Google Scholar] [CrossRef]
- Ma, Z.; Melville, D.S.; Liu, J.; Chen, Y.; Yang, H.; Ren, W.; Zhang, Z.; Piersma, T.; Li, B. Rethinking China’s new great wall. Science 2014, 346, 912–914. [Google Scholar] [CrossRef] [PubMed]
- Wang, X.; Xiao, X.; Xu, X.; Zou, Z.; Chen, B.; Qin, Y.; Zhang, X.; Dong, J.; Liu, D.; Pan, L.; et al. Rebound in China’s coastal wetlands following conservation and restoration. Nat. Sustain. 2021, 4, 1076–1083. [Google Scholar] [CrossRef]
- China Daily. 2017. Available online: http://english.mee.gov.cn/News_service/media_news/201703/t20170322_408586.shtml (accessed on 1 April 2022).
- Liu, L.; Xu, W.; Yue, Q.; Teng, X.; Hu, H. Problems and countermeasures of coastline protection and utilization in China. Ocean. Coast. Manag. 2018, 153, 124–130. [Google Scholar] [CrossRef]
- Cui, L.-B.; Fan, Y.; Zhu, L.; Bi, Q.-H. How will the emissions trading scheme save cost for achieving China’s 2020 carbon intensity reduction target? Appl. Energy 2014, 136, 1043–1052. [Google Scholar] [CrossRef]
- Liu, L.; Chen, C.; Zhao, Y. China’s carbon-emissions trading: Overview, challenges and future. Renew. Sustain. Energy Rev. 2015, 49, 254–266. [Google Scholar] [CrossRef]
- Xie, Z. China’s Carbon Emissions Trading: Lessons from the Pilot Systems. Policy Perspect. 2016, 23, 94–123. [Google Scholar] [CrossRef]
- EPA (USA Environmental Protection Agency), The Social Cost of Carbon. 2015. Available online: http://www3.epa.gov/climatechange/EPAactivities/economics/scc.html (accessed on 11 July 2022).
- Austan, G.; Levitt, S.; Syverson, C. Microeconomics; Worth: New York, NY, USA, 2012. [Google Scholar]
- National People’s Congress of China (NPC of China). Constitution of People’s Republic of China; National People’s Congress of China (NPC of China): Beijing, China, 1982.


| Fuel | NVC (TJ/t) | CC (t/TJ) |
|---|---|---|
| Diesel oil | 0.043 | 74.1 |
| Coke | 0.028 | 107 |
| Coal | 0.021 | 101 |
| Kerosene | 0.043 | 71.9 |
| Gasoline | 0.043 | 74.1 |
| Fuel oil | 0.042 | 77.4 |
| Gas | 0.039 | 56.1 |
| Crude | 0.042 | 73.3 |
| Region | Reduction Rate in Stage I (%) | Reduction Rate in Stage II (%) | Quota (%) | Company Numbers | Industry Proportion (%) | Urbanization Rate (%) |
|---|---|---|---|---|---|---|
| Beijing | 0.7 | −6.0 | 40 | 415 | 19.3 | 86.5 |
| Tianjin | 7.1 | −2.3 | 55 | 114 | 43.4 | 83.3 |
| Shanghai | 3.1 | −0.1 | 57 | 191 | 34.2 | 89.3 |
| Chongqing | 7.8 | −2.8 | 60 | 242 | 46.3 | 59.7 |
| Guangdong | 7.0 | 2.1 | 54 | 200 | 46.8 | 69.5 |
| Hubei | 6.1 | 1.0 | 35 | 138 | 46.1 | 57.2 |
Disclaimer/Publisher’s Note: The statements, opinions and data contained in all publications are solely those of the individual author(s) and contributor(s) and not of MDPI and/or the editor(s). MDPI and/or the editor(s) disclaim responsibility for any injury to people or property resulting from any ideas, methods, instructions or products referred to in the content. |
© 2023 by the authors. Licensee MDPI, Basel, Switzerland. This article is an open access article distributed under the terms and conditions of the Creative Commons Attribution (CC BY) license (https://creativecommons.org/licenses/by/4.0/).
Share and Cite
Wang, S.; Tan, S.; Xu, J. Evaluation and Implication of the Policies towards China’s Carbon Neutrality. Sustainability 2023, 15, 6762. https://doi.org/10.3390/su15086762
Wang S, Tan S, Xu J. Evaluation and Implication of the Policies towards China’s Carbon Neutrality. Sustainability. 2023; 15(8):6762. https://doi.org/10.3390/su15086762
Chicago/Turabian StyleWang, Shenghang, Shen Tan, and Jiaming Xu. 2023. "Evaluation and Implication of the Policies towards China’s Carbon Neutrality" Sustainability 15, no. 8: 6762. https://doi.org/10.3390/su15086762