Article

Predicting Raw Milk Price Based on Depth Time Series Features for Consumer Behavior Analysis

1
School of Economics and Management, Northeast Agricultural University, Harbin 150038, China
2
School of Economics and Management, Heilongjiang Institute of Technology, Harbin 150038, China
3
School of Computer Science, Northwestern Polytechnical University, Xi’an 710060, China
*
Author to whom correspondence should be addressed.
Sustainability 2023, 15(8), 6647; https://doi.org/10.3390/su15086647
Submission received: 7 March 2023 / Revised: 8 April 2023 / Accepted: 13 April 2023 / Published: 14 April 2023

Abstract

:
The dairy industry has a long supply chain that involves dairy farmers, enterprises, consumers, and the government. The stable growth of consumer groups is the driving force for the sustainable development of the dairy industry. However, in recent years, sustainable development of the dairy industry has faced great challenges due to the constant changes in the global climate environment and the increasing uncertainty of the international economic environment. Therefore, it is essential to systematically monitor and accurately predict the consumption market of dairy products to ensure that the government, dairy enterprises, and dairy farmers can share information in a timely manner and take effective measures to cope with the changes in the dairy consumption market without disturbing the normal pricing mechanism of the dairy market. The purpose of the conducted research is to systematically monitor and accurately predict the dairy product consumption market while consistently delivering dependable forecasts of consumer behavior in the dairy industry. In this paper, we proposed a raw milk price prediction framework (RMP-CPR) to analyze consumer behavior based on the relationship between milk price and dairy consumption. This study concludes that dairy consumption behavior can be predicted accurately by predicting the price of raw milk based on the proposed framework (RMP-CPR). Our research explores a new angle for studying consumer behavior. The results can assist dairy enterprises in developing accurate marketing strategies based on the forecast results of dairy consumption, thereby enhancing their competitiveness in the market. Policymakers can also use the forecast results of the development trend of the dairy consumption market to adjust corresponding policies in a timely manner. This can help to balance the interests among consumers, dairy enterprises, dairy farmers, and other relevant stakeholders and effectively maintain the sustainable and healthy development of the dairy market.

1. Introduction

Milk is rich in vitamins and protein and is a very common food in the world [1]. Milk and dairy consumption in Asian countries has increased significantly in recent years according to the statistics from the Organization for Economic Cooperation and Development (OECD), and the Food and Agriculture Organization (FAO). Because the development of the dairy consumption market determines the interests of consumers, dairy enterprises, dairy farmers, government departments, and other multi-stakeholders, the development of the dairy consumption market plays an important role in social economic development. Therefore, how to regulate milk prices reasonably and guide consumer behavior for releasing consumption potential in the dairy industry is a great challenge in the development of the market economy. The purpose of the conducted research is to systematically monitor and accurately predict the dairy product consumption market, while consistently delivering dependable forecasts of consumer behavior in the dairy industry. Our accurate prediction of consumption in the dairy products market can provide reliable information on the change in dairy consumption for the government, dairy enterprises, and dairy farmers, and help them develop reasonable marketing programs and countermeasure mechanisms to cope with the change in the dairy consumption market. It can stimulate the purchase intention of dairy consumers sustainably without disturbing the normal pricing mechanism in the dairy market.
Nowadays, the need for research on the consumption behavior of dairy consumers is becoming more and more topical. Consumer purchasing behavior analysis plays an important role in the development of the market [2] and is approached with the commodity price as a key factor [3]. Price is the monetary expression of the value of goods and an important factor when people choose goods [4]. A high price will increase the cost of consumer input and reduce consumer surplus with the expected income determined. Therefore, regardless of other external conditions, the fluctuation of commodity prices is closely related to sales volume. The hypothesis we propose is that there exists a direct relationship between the consumer behavior of dairy products and dairy prices and that the consumption volume of dairy products can be accurately predicted based on the prices of dairy products.
Price and family cost decreased the probability of products being chosen [5], which affects consumption behavior. There have been studies on the consumption behavior of milk and dairy consumers with key factors: quality, availability, pricing, variety, brand image, and advertisement [6]. Some studies have found that high milk prices have a negative impact on the consumption of fresh milk products [7]. As for the socio-economic characteristics of consumers, age, education, and income revealed positive impacts on willingness to pay [8]. Scholars identify time concerns, high prices, and value for money as the most significant value barriers [9]. Demographic and socioeconomic factors, such as price, availability, awareness, and convenience, could affect dietary behavior [10]. Food curiosity and food price inflation were identified as relevant for both willingness to buy and willingness to pay a price premium [11]. By virtue of low price elasticity, increased prices may negatively affect the household resources available to purchase other key sources of nutrients [12]. As the core raw material of milk production, the price of fresh milk will be transmitted to the downstream milk retail price along the milk industry chain [13]. Many scholars have studied the behavior of dairy consumers from the perspective of influencing factors in product consumer behavior. However, few studies have quantitatively analyzed consumer behavior through a commodity price fluctuation trend. Our research has established a framework which can accurately predict the changes of dairy prices in the short term. Based on this, combined with the price elasticity coefficient of dairy demand monitored at an early stage, the recent consumption of dairy products can be relatively accurately calculated.
As one of the most important factors affecting the price of commercial products, the price fluctuation of raw materials will affect the price of products to a certain extent. As a widely used agricultural product, the price of raw milk also has various fluctuations as do all kinds of products. The forms of product price prediction are various, introducing price into a time series for forecasting is one of the mainstream forms of price forecasting, and there are many mainstream research methods for time series prediction at home and abroad at present. One is the traditional regression method represented by AR, ARIMA, Lasso, Ridge, etc. The autoregressive conditional heteroskedasticity (ARCH) model is a statistical model for time series data that describes the variance of the current error term or innovation as a function of the actual sizes of the previous time periods’ error terms [14]. The ARCH model has demonstrated its ability in its wide use [15,16] and shows a certain stability to the volatility series, but its predictive ability in long-term volatility has shown some deficiencies; Ridge Regression [17] and Lasso [18] are very popular in economics topics and prediction tasks [19,20,21]. The advantage of Ridge Regression is that it has an analytical solution that is easy to calculate. The coefficient related to the least relevant prediction factor is reduced to zero, but it will never be accurate to zero [22]. The choice of parameters has a great impact on the Lasso model, especially in the model where explanatory variables have very low correlations and there are relatively few effects [23]. ARIMA [24] is applicable to linear time series and is more robust and effective than related models with more complex structures in short-term prediction, but it does not work well for nonlinear time series [25]. To a certain extent, regression methods often have a fast modeling speed. Even in the case of huge amounts of data, these models can run at a fast speed. However, when they are used for nonlinear data such as product prices, the fitting effect is sometimes slightly insufficient.
In recent years, with the rise of artificial intelligence technology, the time series prediction methods represented by the BP neural network, the RNN, LSTM, transformers and the SVM have been widely used. For the nonlinearity and complexity of time series prediction, the deep learning method has the ability to identify the structure and pattern of data [26,27,28]. The SVM (Support Vector Machine) estimates regression using a set of linear functions that are defined in a high-dimensional space [29]. Researchers used optimized GA-SVM to predict vehicle speed based on a driver–vehicle–road–traffic system [30]. Kaytez et al. [31] applied SVM to electricity consumption forecasting. Though SVM is simple and robust, it is difficult to implement for large-scale training samples and sensitive to parameter selection [32]. The RNN (Recurrent Neural Network) is a class of artificial neural networks which can exhibit temporal dynamic behavior [33] and can be applied to a financial or time series forecast [34]. The RNN is applicable to short-term memory tasks and is also insensitive to data from a long time prior but can be difficult to train. LSTM, improved from the RNN, is widely used in time series prediction [35,36] and has been proven to be superior to the ARIMA algorithm in time series prediction [37]. LSTM has the ability to analyze and exploit the interactions or patterns existing in data through a self-learning process, but the amount of computation will be large and time-consuming when the network is deep. The famous Informer model [38] modified from the transformer shows its strong ability to capture the long-term trend of time series, but it has shown some deficiencies in the ability to capture periodic patterns. In general, the above methods show strong operability and applicability in the research of time series. However, many unsupervised time series research models are similar to those in CV and NLP fields which have strong inductive bias and are not suitable for modeling time series in many cases [39]. The existing methods also rarely capture features of time series from a different granularity, which is important for learning different levels of semantics to improve the generalization ability of the model. At present, these methods still have some limitations in solving the problem of sequence prediction alone.
There are no or very few studies that focus on the quantitative prediction of consumer behavior. In this paper, we propose a framework to accurately predict raw milk price in the coming year after hundreds of experimental comparisons of raw milk price data in mainland China from 2008 to 2022. On this basis, the corresponding consumption of dairy products can be calculated by combining the market price of fresh milk and the price elasticity coefficient of demand. Through the designed framework, policy makers can stimulate consumers through reasonable prices and extensive and effective means of product value publicity, further promote the increase in dairy consumption, and promote the sustainable development of the dairy industry.

2. Materials and Methods

2.1. Workflow

A flowchart of the proposed pipeline for the raw price milk prediction is shown in Figure 1. First, raw milk price data are collected and preprocessed for the milk price analysis. Because raw milk price data are not available with digital documents, we collect the raw milk price data manually and complete missing information through text mining.
Then, the representations of raw milk price are used on the common segments from two subseries of the price in the contextual-based representation to make contextual semantics consistent. Last, the price of raw milk can be predicted based on the Convolutional Neural Network with the features of the known price.

2.2. Data Preprocessing

Because raw milk price data are not available with digital documents, we collected the raw milk price data manually referring to the China Dairy Industry Yearbook as shown in Figure 2. We collected 864 items of raw milk price data from 2008 to 2022. However, the weekly data from 2016 to 2022 are missing, which means the China Dairy Industry Yearbook does not provide complete data. Therefore, we tried to extract the published data from the website using text mining. First, information from the webpage was analyzed, and extraction rules were made to clarify the target information. Then, we extracted the metadata and manually verified the extracted information. After integrating the information, we completed the missing weekly data and the annual average price data in the raw milk price data.

2.3. Representation Learning of Raw Milk Price Data

From the perspective of data format and content, raw milk price data can be regarded as time series data. The time series can be defined as X = { x 1 , x 2 , , x L } , where each x i represents the price at time stamp i, and L is the length of the sequence for the input price. We tried to represent raw milk price with time stamps based on the deep learning network for downstream raw milk price prediction. Therefore, the target is to train a nonlinear embedding function φ θ , and this function can map each x i to its representation γ i R L × K that can represent its feature. The input time series x i can have multiple dimensions as F , where F is the feature dimension of the raw milk price data. The representation γ i has a dimension of K , where K represents the dimension of the representation of raw milk price at a certain time point, and the length of the input and output in the nonlinear embedding function φ θ remains the same.

2.3.1. Latent Representation Layer

The purpose of the latent representation layer is to map the price data to a high-dimensional latent vector. This layer consists of a fully connected layer with a noise mask. First, the time stamps and prices in the raw milk price data were encoded by a fully connected layer. Then, the noise masks were incorporated into the initial representations of raw milk prices in order to prevent the representation learning model overfitting. In the fully connected layer, the linear transformation for the raw milk price can be defined as follows:
V = W X + b
where V represents the price latent vectors, W is parameters to be learned by the model, and b is the bias parameters of vectors. X represents the initial representations of raw milk prices and x i , t X is the input x i at timestamp t . Because there is a limited amount of sequence data, we sampled the price data in segments by noise mask in order to make the feature integration process more robust. First, in order to relieve overfitting, noise masks were added in the processed price data before training the price data. The price latent vector v i = v i , k was masked with a binary mask m a s k 0 , 1 L after the price data were projected as input. The noise mask process follows Bernoulli distribution with the probability p set to 0.5. Finally, we obtained the latent representations of the raw milk price data with the noise mask.

2.3.2. Deep Convolutional Layer

The raw milk price is represented through the latent representation layer. In the deep convolutional layer, the CNN will extract the contextual representation at each timestamp, which has multiple residual blocks, and each block contains two 1D convolutional layers with a dilation parameter.
  • Sample selection
The available raw milk price data span from 2016 to 2022 and contain 358 items of price data. These data with time stamps can be represented based on the deep learning network. The samples of the raw milk price data have to be effectively selected due to the small amount of data for the representation model training. Therefore, we randomly sampled the series of raw milk price by overlapping any two segments of the original price data inspired by TS2Vec [39]. For time series input x i R L × F , two segments S e g m = { x m } , S e g n = { x n } with overlapped series will be randomly sampled and satisfied S e g m S e g m . It is found by analyzing the raw milk price data that the factors affecting the fluctuation of raw milk price include seasonal factors and policy factors; a small overlap cannot fully represent the context of the price fluctuations. Therefore, a threshold λ is defined to limit the length of the overlapped series and ensure full contextual information. The sample can be selected as follows:
S e g t a r g e t = S e g m S e g n
where S e g m S e g n λ , S e g m S e g n represents the length of the overlapped sequences, and λ indicates the overlapped minimum length. Random sampling by controlling the length of the overlapped portion can fully obtain the contextual representation of the shared part. In the model training, the target is to make the differences between the contextual representations on the overlapped segments reduced and to represent the raw milk price fully.
  • Contextual representations
In the deep convolutional layer, the CNN will extract the contextual representation at each timestamp where there are two views for the contextual representation of raw milk price, including temporal comparison and sample comparison.
Samples with shared price sequence fragments were selected through the above process. Then, the latent representations of the raw milk price data were obtained in the representation layer. Therefore, the price data at each time stamp can be seen as a vector with a dimension of K , and the similarity between different representations of raw milk price can be calculated based on cosine similarity. The similarity between Representation γ 1 and Representation γ 2 is defined as follows:
c o S i m ( γ 1 , γ 2 ) = γ 1 γ 2 γ 1 γ 1
where γ represents the length of vector γ . At the same time stamp, the similarity of the representations on overlapping fragments of one sample can be calculated based on Formula (3). Similarly, we can calculate the similarity of representations at different time stamps on the same sample or at the same timestamp on different samples. In other words, we can quantify the differences in the view of the sample and time based on cosine similarity as follows:
S i m ( m , n , u , v ) = c o S i m ( γ m , u , γ n , v ) , m = n a n d u = v c o S i m ( γ m , u , γ n , v ) , m n o r u v
where γ m , u is the representation of the index m on a segment of a sample at time u, and γ n , v indicates the representation of the index n on the other overlapped segment of the same sample at time v. Therefore, the loss functions in the two views for the contextual representation of raw milk price can be defined based on Formula (4). Temporal comparison measures the information difference at each time stamp on the overlapped segments of one sample. The loss function for temporal comparison is defined as follows:
t L o s s m , u = log e x p ( S i m ( m , m , u , u ) ) v T e x p ( S i m ( m , m , u , v ) )
where T represents the time stamp set of the overlapped segments for the sample m. This loss function for temporal comparison is used to calculate the information loss at each time stamp on the overlapped segments of one sample. Similarly, the sample comparison is defined to measure the information difference within and between samples at the same time. The loss function for sample comparison can be defined as follows:
s L o s s m , u = log e x p ( S i m ( m , m , u , u ) ) n S e x p ( S i m ( m , n , u , u ) )
where S represents the sample set. This loss function for sample comparison is used to calculate the information loss between samples at the same time. Therefore, the loss function of the model can be defined based on the temporal comparison and sample comparison as follows:
L o s s = 1 S L m S u L t L o s s m , u + s L o s s m , u
where S represents the sample set, and L is the time stamp set of the sample. S and L are the number of elements in the collections.

2.4. Predicting Raw Milk Price Based on the CNN

The features of raw milk price can be represented with a contextual-based representation model. Here, we predict the raw milk price based on the Convolutional Neural Network (CNN) with the features of the known price.
The one-dimensional convolution network is applied to process the sequential data of the raw milk price. First, the sequential data are transformed to the three-dimensional tensor by the 2 × 2 convolution kernel in the convolution layer. Then, the activation function ReLU is used to eliminate the data less than 0 as follows:
R e L U = x , x > 0 0 , x 0
We used the fully connected layer to change the three-dimensional tensor into a one-dimensional tensor, and then the final predicted value was obtained through two linear transformations.

3. Results

3.1. Dataset

We manually collected data on dairy consumption, including raw milk prices, corn and soybean meal prices, packaged fresh milk sales prices, and dairy consumption by urban residents in China. As the concentrate feed for dairy cows, corn and soybean meal are the main parts of the production cost of dairy cows, so the price of corn and soybean meal is taken as the factor of the production cost of raw milk. There are 432 items of price data for corn and soybean meal from 2008 to 2022, including the monthly data of corn and soybean meal from 2008 to 2015 and weekly data from 2016 to 2022. At the same time, we collected the price of raw milk in the same period as corn and soybean meal. The monthly data of the above prices were obtained from the 2013 edition and the 2016 edition of the China Dairy Industry Yearbook, while the weekly data were manually collated from the monitoring data published on the official website of the Ministry of Agriculture and Rural Affairs of China. The price data of packaged fresh milk in 31 regions of China from 2008 to 2019 were collected from the China Dairy Industry Yearbook for a total of 372 items. The national annual average price data were missing and obtained through manual calculation.

3.2. Evaluation Indicator

In order to evaluate the accuracy of the price prediction methods, we applied Mean Absolute Error (MAE) and Mean Squared Error (MSE), which are the most commonly used indicators in predicting sequence data. Mean Absolute Error (MAE) is a measure of errors between paired observations expressing the same phenomenon, which is widely applied in comparisons of predicted versus observed, subsequent time versus initial time, and one measurement technique versus an alternative technique. MAE is defined as follows:
M A E = i = 1 n X i Y i n
where X i and Y i are the i-th elements of vector X and Y , respectively, and n is the dimension in the space where the vectors are found. The closer the MSE value is to 0, the better the model is in predicting the future price. Mean Squared Error (MSE) measures how close a regression line is to a set of data points. It is a risk function corresponding to the expected value of the squared error loss. MSE is usually used as the loss function of the regression problem and can also be used to compare prediction results. MSE can be defined as follows:
M S E = 1 n i = 1 n Y i Y i 2
where n is the number of samples, and Y represents the vector for observed values of the variables being predicted, with Y being the predicted values. Like MAE, the closer to 0, the better the prediction effect of the model.

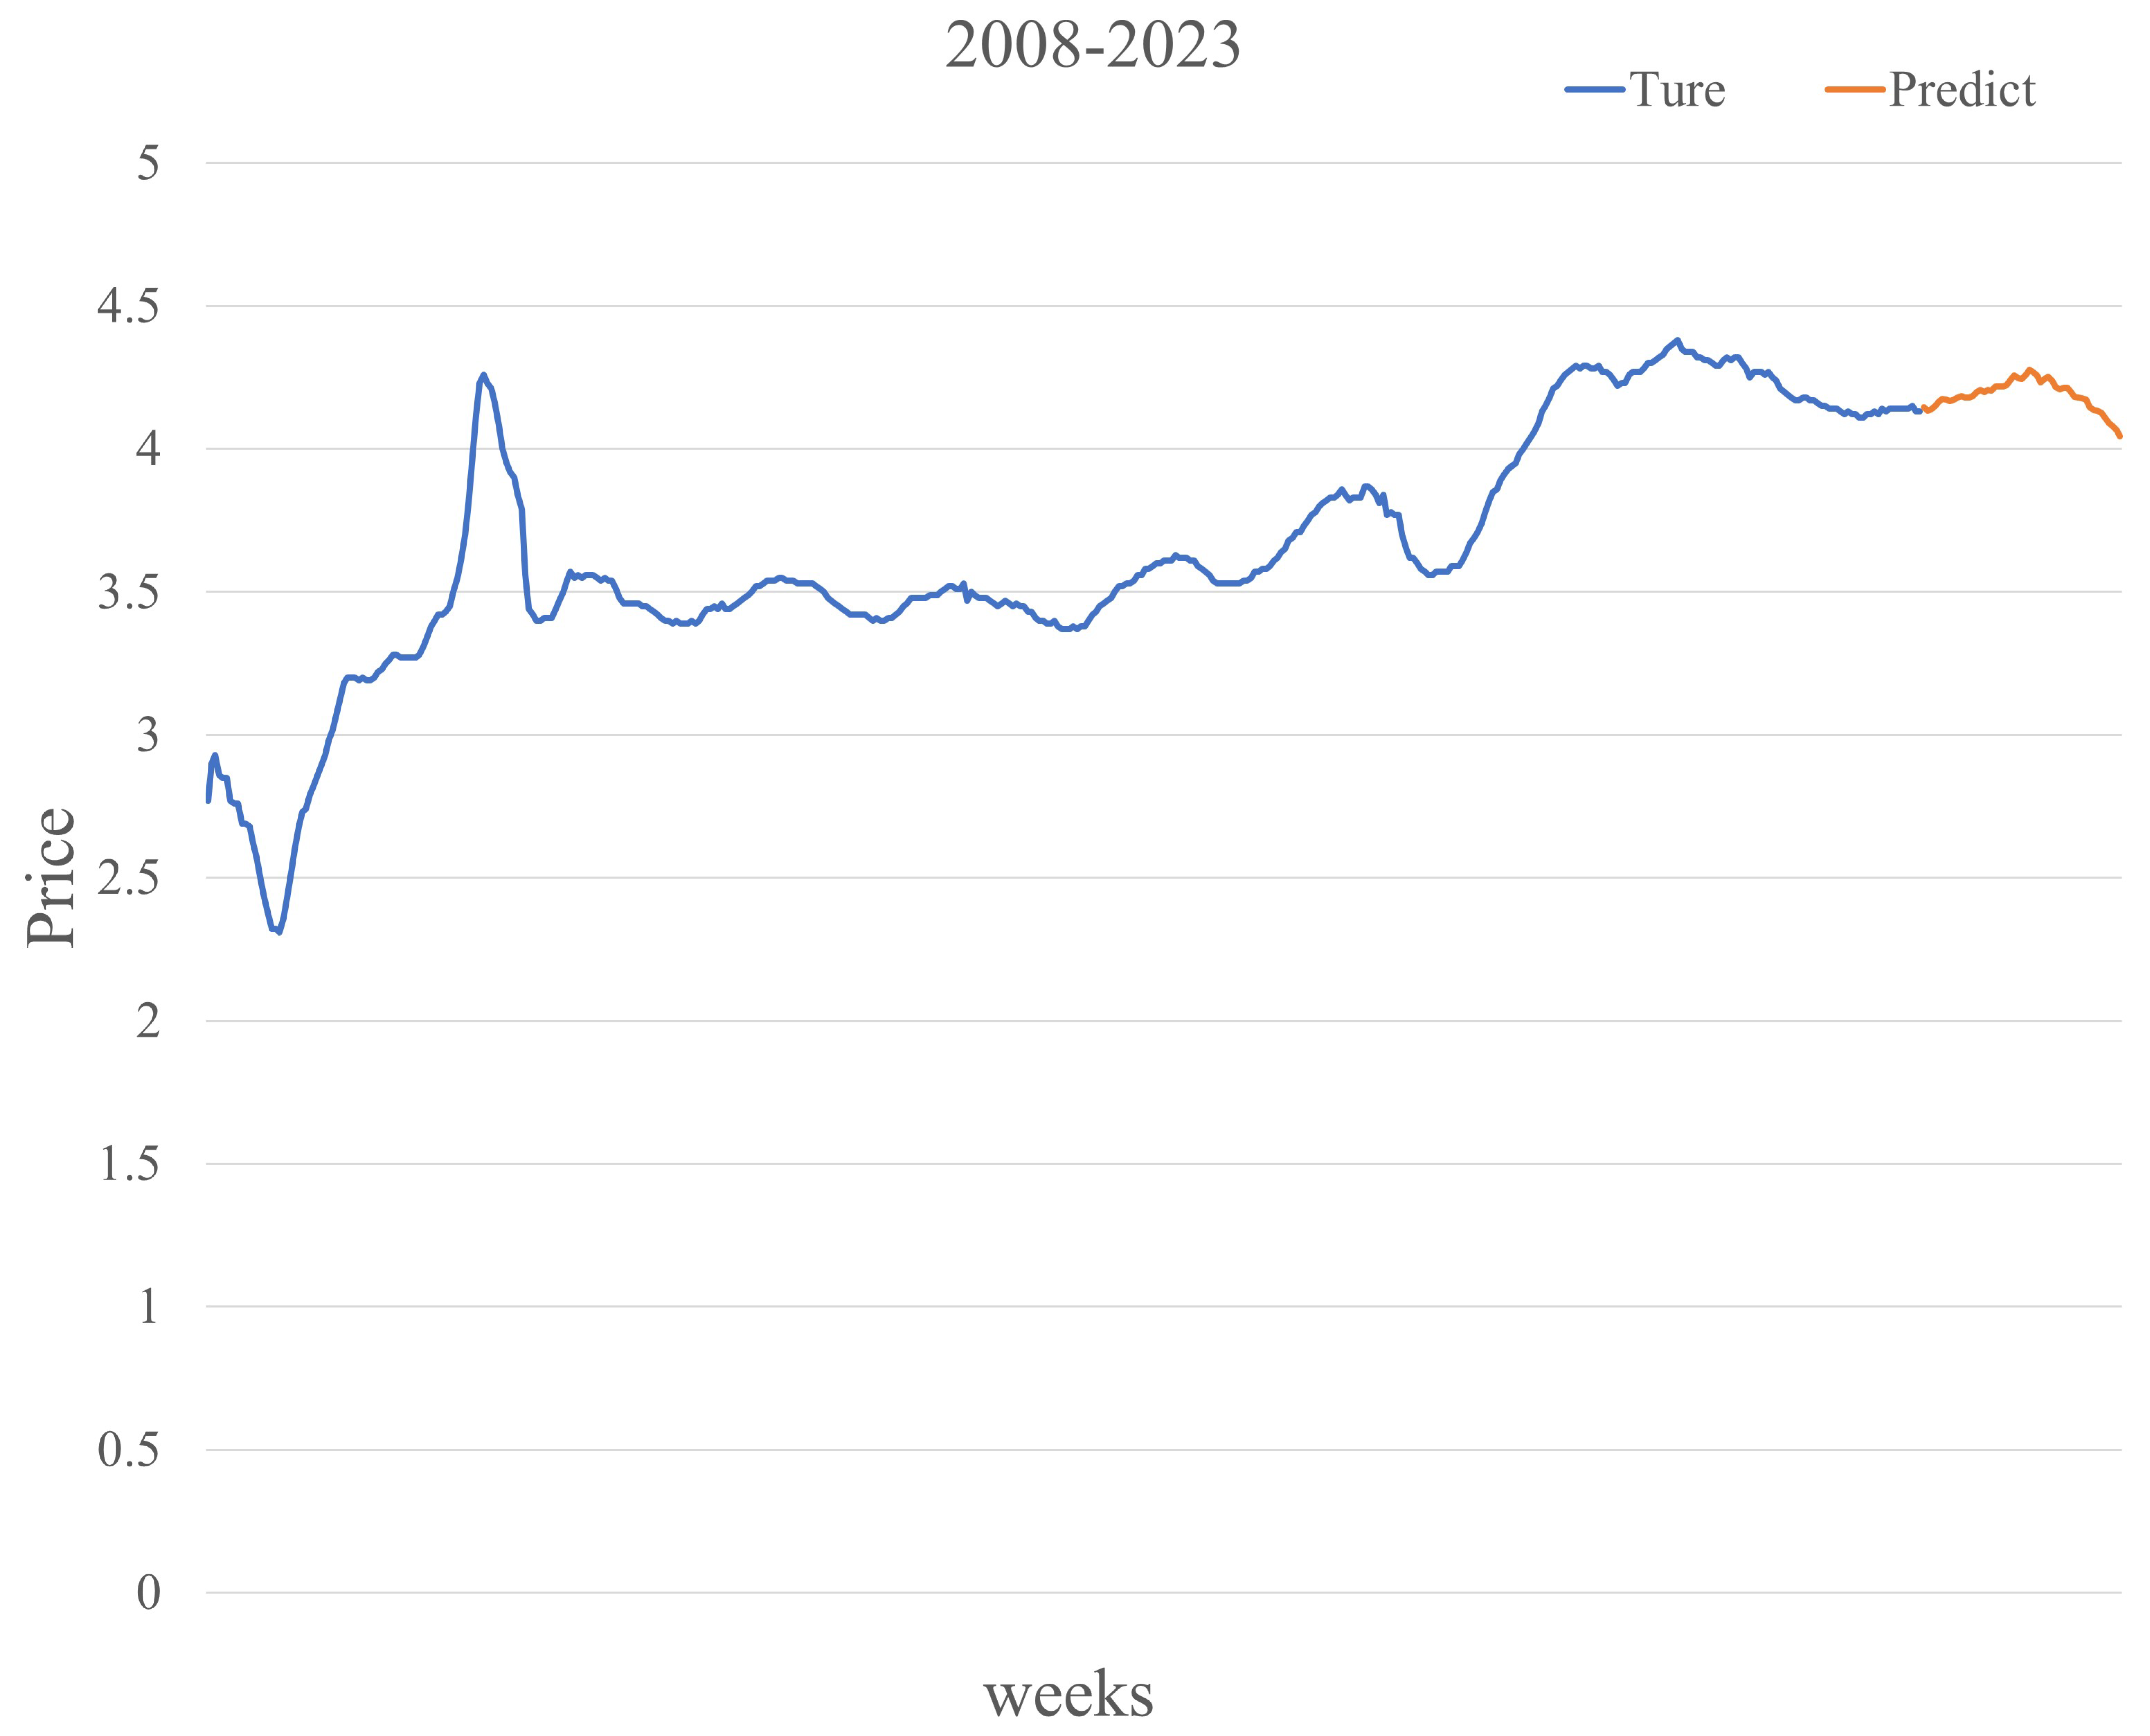
3.3. Performance of the Framework

Through the above process, we predicted the raw milk price based on the learned representations of the price sequential data. Here, the performance of RMP-CPR is represented based on MSE and MAE. The results show that the MSE and MAE are 1.5971 × 10⁻⁴ and 9.8805 × 10⁻³, respectively, in predicting the raw milk price, which indicates that the proposed framework RMP-CPR has good performance for predicting the price of raw milk.
To further validate the reliability of RMP-CPR, we conducted five experiments to compare our method with classical price forecasting methods, including long short-term memory (LSTM), Stochastic Gradient Descent (SGD), Ridge Regression, and Lasso Regression. MSE and MAE are taken as the evaluation indicators for these prediction methods. Here, the raw milk price is represented based on the contextual-based representation layer (CRL) and predicted by these above methods. The test results are seen in Table 1. The proposed framework RMP-CPR, which consists of the CRL and CNN, has better performance than the other methods. The prediction methods based on linear regression are all good at predicting the raw milk price with the lower values of MSE and MAE because the features of the price are represented fully in the contextual-based representation layer. LSTM is not as good as the CNN in the downstream method for price predicting because it is more suitable for short sequences. In general, RMP-CPR has higher accuracy in predicting the price of raw milk in the future.

4. Discussion

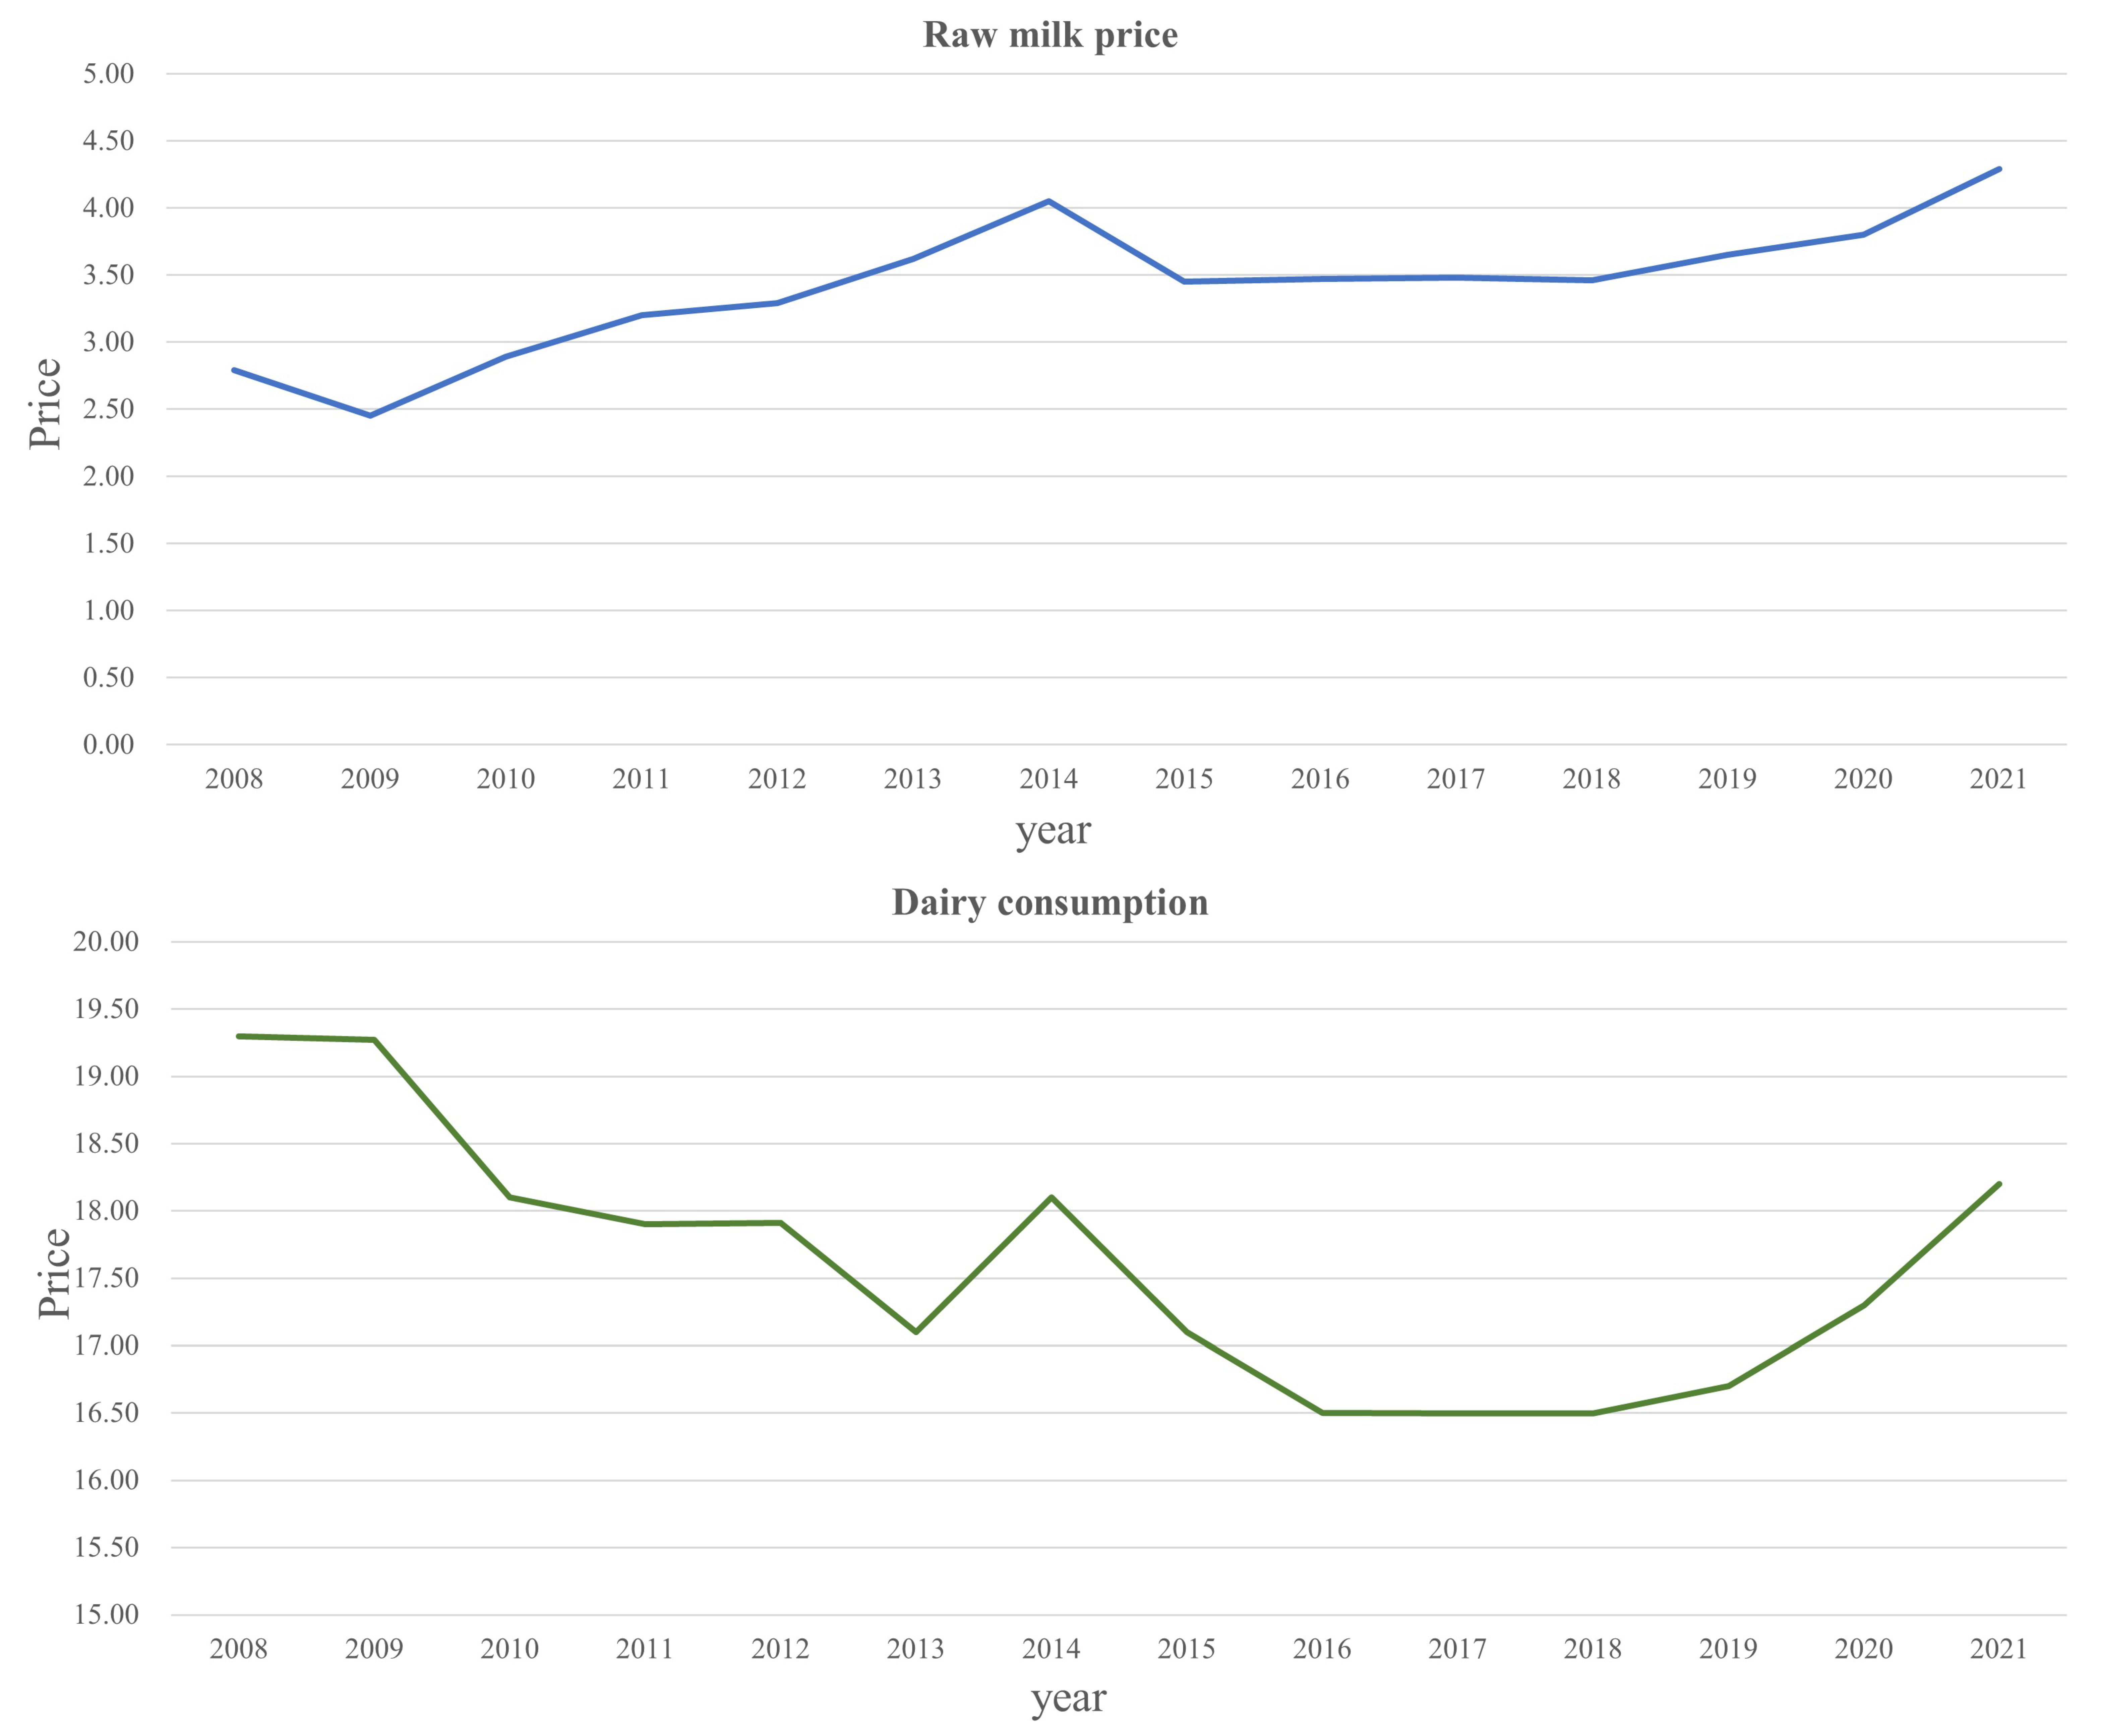
4.1. Factors Affecting Raw Milk Price

In this study, the price and time stamp from the integrated data are encoded in the contextual-based representation layer. Then, the encoded information of the raw milk is used to predict the price. In fact, there are other factors affecting the raw milk price, such as corn and soybean meal. As the concentrate feed for dairy cows, corn and soybean meal are the main parts of the production cost of dairy cows, so the price of corn and soybean meal is taken as the factor of the production cost of raw milk. Here, we introduced the price of corn and soybean meal to represent raw milk price at every moment and conduct the experiments using the five methods described above, as shown in Figure 3. It was found that the performance of the models cannot be improved by the representation of raw milk price with corn and soybean meal price encoded. For example, the experimental results of the CRL–Ridge considering the corn and soybean meal price has a 0.002 lower MAE than that of the original method, as shown in Table 2. The CRL–LSTM with the corn and soybean meal price encoded decreased by 0.0003 with MSE as the test indicator.
In fact, although corn and soybean meal are the main parts of the production cost of dairy cows, their price is often regulated by the government. As can be seen in Figure 4, the price trend of corn and soybean meal does not completely change with the price of raw milk due to external factors. If there is enough corn and soybean meal price data, the corn and soybean meal price can be used to enhance the prediction for raw milk price with the irregular price data during the regulation period abandoned. We considered that in order to ensure more scientific and rigorous research, we will include more influential factors related to the fluctuation of raw milk price, such as breeding cost and international milk price, into our data analysis in future research.

4.2. Consumer Purchasing Behavior Analysis Based on Raw Milk Price Fluctuation

Raw milk, which is the natural udder secretions of healthy cows, can be divided into cow milk, goat milk, camel milk, and so on [40]. According to the statistics released by the National Bureau of Statistics, the output of fresh cow milk in China accounted for 97.1% of total raw milk production in 2019. Therefore, raw milk in this paper refers to fresh cow’s milk. Raw milk, accounting for more than 70% of milk production cost [41], is the main raw material of milk production. The production of raw milk is located in the middle reaches of the dairy industry chain, and its price fluctuation will extend the transmission of the industrial chain and then affect the prices of downstream milk products [42].
As shown in Figure 5, the price of raw milk has an overall upward trend from 2008 to 2019, while the per capita dairy consumption of urban residents is following a downward trend. However, during certain periods of time, changes in price and dairy consumption cannot follow the pattern of price being a negative factor in consumers’ preferences [5]. Through analysis of historical data, it is found that some events and changes in the natural environment have occurred during these periods, affecting the dairy market. For example, the price and consumption of raw milk had a downward trend from 2008 to 2009, when the domestic dairy market fell into a crisis of trust affected by quality problems with dairy products. Dairy market demand was still depressed, even if the price of raw milk was reduced. Because of foot-and-mouth disease in 2013, the high temperature in summer led to a reduction in milk production. Therefore, the price of raw milk rose rapidly with milk consumption. Due to COVID-19 in 2019, people realized the importance of health, and their awareness of food with high nutritional value, such as milk, has significantly improved. Meanwhile, affected by the epidemic, the production capacity of dairy products was low. Thus, the consumption of dairy products was on the rise with the price of raw milk.
Price had a significant effect on the choice of products. The most common measure of consumers’ sensitivity to price is known as price elasticity of demand, which was proposed by Alfred Marshall to reflect the sensitivity of commodity demand to price changes. Price elasticity of demand can be defined as follows:
E = Q 2 Q 1 P 2 P 1 · P 1 + P 2 Q 1 + Q 2
where Q i is the dairy consumption at time i, and P j is the price of raw milk at time j. Therefore, change in consumption can be reflected according to raw milk price trends based on the demand elasticity coefficient. First, the mean value of the price elasticity of demand is calculated based on the collected annual data of raw milk prices from 2016 to 2022. Then, the predicted price and demand elasticity coefficient are applied to predict the dairy consumption in the future by Formula (11).
We predicted the raw milk price in the next year based on RMP-CPR. As shown in Figure 6, the raw milk price is estimated at 4.14 yuan/kg at the beginning of the year and 4.04 yuan/kg at the end of the year, with a slight increase in the middle of the year. In fact, according to the data provided by the official website of China’s Ministry of Agriculture, the average price of raw milk in mainland China in the first week of January 2023 was 4.12 yuan, which is close to the data value we predicted. Overall, the price of raw milk is expected to be stable in the coming year. According to our prediction results of raw milk price, using the elastic coefficient Formula (11), we can estimate that the price of raw milk in 2023 will be 4.18 yuan/kg, and the consumption of urban residents will be 18.45 kg per person. Overall, the price of raw milk in the last three years shows a downward trend, and the per capita consumption of dairy products shows an upward trend with 18.20 kg per person for 2021. Therefore, given the growing willingness to buy foods rich in high-quality protein and vitamins such as milk, dairy enterprises can improve product structure, develop high-end dairy products and functional dairy products, and employ other means to promote consumer consumption upgrade so as to expand the market share of dairy products to achieve the effect of improving the profitability of dairy enterprises. At the same time, government departments can adopt tax incentives, government subsidies, and other policy means in a timely manner to balance the interest relationship among dairy farmers, dairy enterprises, and consumers.
Consumption is the quantitative value of consumer behavior, and the steady growth of consumption is the goal and driving force of dairy industry development. In this study, by establishing an RMP-CPR prediction model, the price of raw milk can be predicted more accurately, and the consumption behavior of dairy consumers can be predicted accordingly. Predicting dairy consumption through dairy prices has important significances for dairy producers, distributors, and policymakers. By tracking changes in dairy consumption, dairy producers and distributors can anticipate the demand for dairy products and adjust supply to meet it. This information can help businesses make informed decisions about production, distribution, and pricing. Policymakers can use data on dairy prices and consumption to inform decisions about agricultural subsidies, trade policies, and food safety regulations. Overall, dairy producers, distributors, and policymakers can take corresponding measures to respond to market changes in time by the accurate forecasts of dairy prices and dairy consumption to ensure the sustained and healthy development of the dairy market.

5. Conclusions

It is a topical issue to analyze consumer purchasing behavior in the development of the dairy market. In this study, we designed a framework to predict raw milk price, and consumer purchasing behavior analysis was approached with price as a key factor. We first preprocessed the raw milk price data using manual collection and text mining and built the dataset of the raw milk price. The contextual-based representation model was applied to represent raw milk price. Last, the raw milk price was predicted based on the CNN with learned representations of the price. We analyzed the change in dairy consumption according to the raw milk price trend based on the demand elasticity coefficient. Results showed that our computational framework has good performance in predicting the future trend of raw milk prices, and the consumption behavior was analyzed based on raw milk price. The excellent performance of this framework is mainly reflected in the following aspects: (1) Since integrated digital price data are not available, a complete dataset of raw milk price was constructed to provide data support for accurate price prediction and research on dairy consumption behavior. (2) In order to fully capture features of the price data, we performed a pipeline to fully represent the price data from different views and accurately predict the price trend of raw milk. (3) With the representations of raw milk price, we analyzed the impact of raw milk price on consumer behavior based on the demand elasticity coefficient, providing guidance for dairy market research.
Our experiment effectively validated the hypothesis that we proposed. Through the RMP-CPR framework, we predicted that the price of raw milk in mainland China at the beginning of 2023 would be 4.14 yuan/kg. In fact, the actual value of raw milk in mainland China at the beginning of 2023 was 4.12 yuan/kg, and our prediction accuracy exceeded 95%. Furthermore, we calculated that the per capita consumption of dairy products in urban areas of mainland China in 2023 would be 18.45 kg per person, representing a 6.6% increase compared to the actual dairy product consumption in 2020. Our estimation indicates that the consumption of dairy products in mainland China has been steadily increasing over the past three years, which aligns with the actual development trend of dairy product consumption in mainland China. Our research has important practical significance to guide the sustainable and stable development of the dairy industry. For market analysis, by examining dairy prices, analysts can gain insights into consumer demand and market supply. This information can help businesses make informed decisions on production and pricing strategies, leading to better financial outcomes. By predicting dairy consumption through dairy prices, businesses can anticipate changes in consumer behavior and adjust their marketing strategies accordingly. For policymakers, predicting dairy consumption through dairy prices can also be useful for governments when making policy decisions related to the dairy industry. For example, if dairy prices are expected to rise, the government may need to consider implementing policies to help mitigate the impact of higher prices on consumers, such as subsidies or price controls. For public health professionals, if dairy prices increase, consumers may switch to alternative protein sources, which may have different nutritional profiles. Public health professionals can better understand how dietary patterns may shift and how they may affect public health through predicting changes in dairy consumption. In summary, on the premise of not disturbing the normal market pricing mechanism, all stakeholders of the dairy industry can take corresponding measures in a timely manner according to the systematic monitoring of the price and consumption of dairy products to maintain the sustainable development of the dairy industry.

Author Contributions

Z.L. performed data collection and preprocessing. With the guidance of C.L., Z.L. finished the algorithm design, and A.Z. performed validation. Z.L. was the major contributor in writing the manuscript. All authors have read and agreed to the published version of the manuscript.

Funding

This research received no external funding.

Institutional Review Board Statement

Not applicable.

Informed Consent Statement

Not applicable.

Data Availability Statement

The raw data supporting the conclusions are included in the article. Please contact the authors for further inquiries.

Acknowledgments

Cuixia Li is the corresponding author of this article. Thanks to Ru Yang for supporting our research.

Conflicts of Interest

The authors declare no conflict of interest.

References

  1. Scholz-Ahrens, K.E.; Ahrens, F.; Barth, C.A. Nutritional and health attributes of milk and milk imitations. Eur. J. Nutr. 2020, 59, 19–34. [Google Scholar] [CrossRef] [PubMed]
  2. Kurajdova, K.; Táborecka-Petrovicova, J. Literature review on factors influencing milk purchase behaviour. Int. Rev. Manag. Mark. 2015, 5, 9–25. [Google Scholar]
  3. Ilie, D.M.; Lădaru, G.-R.; Diaconeasa, M.C.; Stoian, M. Consumer Choice for Milk and Dairy in Romania: Does Income Really Have an Influence? Sustainability 2021, 13, 12204. [Google Scholar] [CrossRef]
  4. Ali, B.J.; Anwar, G. Marketing Strategy: Pricing strategies and its influence on consumer purchasing decision. Environ. Health Res. 2021, 5, 26–39. [Google Scholar] [CrossRef]
  5. Kaliji, S.A.; Mojaverian, S.M.; Amirnejad, H.; Canavari, M. Factors affecting consumers’ dairy products preferences. AGRIS -Line Pap. Econ. Inform. 2019, 11, 3–11. [Google Scholar] [CrossRef] [Green Version]
  6. Kumar, A.A.; Babu, S. Factors influencing consumer buying behavior with special reference to dairy products in Pondicherry state. Int. Mon. Ref. J. Res. Manag. Technol. 2014, 3, 65–73. [Google Scholar]
  7. Mehmood, A.; Mushtaq, K.; Ali, A.; Hassan, S.; Hussain, M.; Tanveer, F. Factors Affecting Consumer Behavior Towards Consumption of Fresh Milk. Pak. J. Life Soc. Sci. 2018, 16, 113–116. [Google Scholar]
  8. Zhou, H.; Nanseki, T. Traceability System of Dairy Products and Its Impacts on Consumer Behavior in China: An Application of Multinominal Logit Model. In Agricultural Innovation in Asia: Efficiency, Welfare, and Technology; Springer: Berlin/Heidelberg, Germany, 2023; pp. 149–157. [Google Scholar]
  9. Le Ha, N.T.; Linh, N.P.T. Green Marketing Practices and Consumer Behavior of Organic Food. Int. J. Inf. Bus. Manag. 2023, 15, 27–41. [Google Scholar]
  10. Vakili, V.; Vakili, K.; Zamiri Bidari, M.; Azarshab, A.; Vakilzadeh, M.M.; Kazempour, K. Effect of Social Beliefs on Consumption of Dairy Products and Its Predicting Factors Based on the Transtheoretical Model: A Population-Based Study. J. Environ. Public Health 2023, 2023, 5490068. [Google Scholar] [CrossRef]
  11. Rombach, M.; Dean, D.L.; Bitsch, V. “Got Milk Alternatives?” Understanding Key Factors Determining US Consumers’ Willingness to Pay for Plant-Based Milk Alternatives. Foods 2023, 12, 1277. [Google Scholar] [CrossRef]
  12. Alonso, S.; Angel, M.D.; Muunda, E.; Kilonzi, E.; Palloni, G.; Grace, D.; Leroy, J.L. Consumer Demand for Milk and the Informal Dairy Sector Amidst COVID-19 in Nairobi, Kenya. Curr. Dev. Nutr. 2023, 7, 100058. [Google Scholar] [CrossRef] [PubMed]
  13. Vavra, P.; Goodwin, B.K. Analysis of Price Transmission along the Food Chain; OECD Publishing: Berlin, Germany, 2005. [Google Scholar]
  14. Engle, R.F. Autoregressive conditional heteroscedasticity with estimates of the variance of United Kingdom inflation. Econom. J. Econom. Soc. 1982, 50, 987–1007. [Google Scholar] [CrossRef]
  15. Ilbeigi, M.; Castro-Lacouture, D.; Joukar, A. Generalized autoregressive conditional heteroscedasticity model to quantify and forecast uncertainty in the price of asphalt cement. J. Manag. Eng. 2017, 33, 04017026. [Google Scholar] [CrossRef]
  16. Joukar, A.; Nahmens, I. Volatility forecast of construction cost index using general autoregressive conditional heteroskedastic method. J. Constr. Eng. Manag. 2016, 142, 04015051. [Google Scholar] [CrossRef]
  17. Hoerl, A.E.; Kennard, R.W. Ridge regression: Biased estimation for nonorthogonal problems. Technometrics 2000, 42, 80–86. [Google Scholar] [CrossRef]
  18. Tibshirani, R. Regression shrinkage and selection via the lasso. J. R. Stat. Soc. Ser. B 1996, 58, 267–288. [Google Scholar] [CrossRef]
  19. Yang, X.; Wen, W. Ridge and lasso regression models for cross-version defect prediction. IEEE Trans. Reliab. 2018, 67, 885–896. [Google Scholar] [CrossRef]
  20. Wang, S.; Ji, B.; Zhao, J.; Liu, W.; Xu, T. Predicting ship fuel consumption based on LASSO regression. Transp. Res. Part D Transp. Environ. 2018, 65, 817–824. [Google Scholar] [CrossRef]
  21. Pereira, J.M.; Basto, M.; Da Silva, A.F. The logistic lasso and ridge regression in predicting corporate failure. Procedia Econ. Financ. 2016, 39, 634–641. [Google Scholar] [CrossRef] [Green Version]
  22. Masini, R.P.; Medeiros, M.C.; Mendes, E.F. Machine learning advances for time series forecasting. J. Econ. Surv. 2021, 37, 76–111. [Google Scholar] [CrossRef]
  23. Su, W.; Bogdan, M.; Candes, E. False discoveries occur early on the lasso path. Ann. Stat. 2017, 45, 2133–2150. [Google Scholar] [CrossRef] [Green Version]
  24. Adebiyi, A.A.; Adewumi, A.O.; Ayo, C.K. Comparison of ARIMA and Artificial Neural Networks Models for Stock Price Prediction. J. Appl. Math. 2014, 2014, 614342. [Google Scholar] [CrossRef] [Green Version]
  25. Siami-Namini, S.; Tavakoli, N.; Namin, A.S. A comparison of ARIMA and LSTM in forecasting time series. In Proceedings of the 2018 17th IEEE International Conference on Machine Learning and Applications (ICMLA), Orlando, FL, USA, 17–20 December 2018; pp. 1394–1401. [Google Scholar]
  26. Wang, Y.; Juan, L.; Peng, J.; Wang, T.; Zang, T.; Wang, Y. Explore potential disease related metabolites based on latent factor model. BMC Genom. 2022, 23, 269. [Google Scholar] [CrossRef] [PubMed]
  27. Liu, X.; Zhang, Y.; Shen, Y.; Shang, X.; Wang, Y. CircRNA-Disease Association Prediction based on Heterogeneous Graph Representation. In Proceedings of the 2022 IEEE International Conference on Bioinformatics and Biomedicine (BIBM), Las Vegas, NV, USA, 6–9 December 2022; pp. 2411–2417. [Google Scholar]
  28. Wang, Y.; Liu, X.; Shen, Y.; Song, X.; Wang, T.; Shang, X.; Peng, J. Collaborative deep learning improves disease-related circRNA prediction based on multi-source functional information. Brief. Bioinform. 2023, 24, bbad069. [Google Scholar] [CrossRef] [PubMed]
  29. Tay, F.E.; Cao, L. Application of support vector machines in financial time series forecasting. Omega 2001, 29, 309–317. [Google Scholar] [CrossRef]
  30. Li, Y.; Chen, M.; Lu, X.; Zhao, W. Research on optimized GA-SVM vehicle speed prediction model based on driver-vehicle-road-traffic system. Sci. China Technol. Sci. 2018, 61, 782–790. [Google Scholar] [CrossRef]
  31. Kaytez, F.; Taplamacioglu, M.C.; Cam, E.; Hardalac, F. Forecasting electricity consumption: A comparison of regression analysis, neural networks and least squares support vector machines. Int. J. Electr. Power Energy Syst. 2015, 67, 431–438. [Google Scholar] [CrossRef]
  32. Wang, S.; Yu, L.; Tang, L.; Wang, S. A novel seasonal decomposition based least squares support vector regression ensemble learning approach for hydropower consumption forecasting in China. Energy 2011, 36, 6542–6554. [Google Scholar] [CrossRef]
  33. Dupond, S. A thorough review on the current advance of neural network structures. Annu. Rev. Control 2019, 14, 200–230. [Google Scholar]
  34. Di Persio, L.; Honchar, O. Recurrent neural networks approach to the financial forecast of Google assets. Int. J. Math. Comput. Simul. 2017, 11, 7–13. [Google Scholar]
  35. Schmidhuber, J. Deep learning in neural networks: An overview. Neural Netw. 2015, 61, 85–117. [Google Scholar] [CrossRef] [PubMed] [Green Version]
  36. Gamboa, J.C.B. Deep learning for time-series analysis. arXiv 2017, arXiv:1701.01887. [Google Scholar]
  37. Siami-Namini, S.; Namin, A.S. Forecasting economics and financial time series: ARIMA vs. LSTM. arXiv 2018, arXiv:1803.06386. [Google Scholar]
  38. Zhou, H.; Zhang, S.; Peng, J.; Zhang, S.; Li, J.; Xiong, H.; Zhang, W. Informer: Beyond efficient transformer for long sequence time-series forecasting. In Proceedings of the AAAI Conference on Artificial Intelligence, Virtual, 2–9 February 2021; pp. 11106–11115. [Google Scholar]
  39. Yue, Z.; Wang, Y.; Duan, J.; Yang, T.; Huang, C.; Tong, Y.; Xu, B. Ts2vec: Towards universal representation of time series. In Proceedings of the AAAI Conference on Artificial Intelligence, Virtual, 22 February–1 March 2022; pp. 8980–8987. [Google Scholar]
  40. Quigley, L.; O’Sullivan, O.; Stanton, C.; Beresford, T.P.; Ross, R.P.; Fitzgerald, G.F.; Cotter, P.D. The complex microbiota of raw milk. FEMS Microbiol. Rev. 2013, 37, 664–698. [Google Scholar] [CrossRef] [Green Version]
  41. Yudina, E.; Konovalov, S. Development Issues and prospects of milk processing enterprises. In Proceedings of the International Scientific Conference the Fifth Technological Order: Prospects for the Development and Modernization of the Russian Agro-Industrial Sector (TFTS 2019), Omsk, Russia, 15 October 2019; pp. 436–439. [Google Scholar]
  42. Kresova, S.; Hess, S. Identifying the Determinants of Regional Raw Milk Prices in Russia Using Machine Learning. Agriculture 2022, 12, 1006. [Google Scholar] [CrossRef]
Figure 1. Flowchart of the RMP-CPR workflow. The raw milk price data are manually collected and preprocessed for the milk price analysis. Then, the raw milk price on common segments from two subseries of the price in the contextual-based representation layer is learnt to make contextual semantics consistent. Last, the price of raw milk can be predicted based on the Convolutional Neural Network with the representations of the known price.
Sustainability 15 06647 g001
Figure 2. Flowchart of the raw milk price data preprocessing.
Sustainability 15 06647 g002
Figure 3. Performance evaluation of the price prediction methods based on different information. In (A), the performance of the methods with corn and soybean meal price is presented. These methods are evaluated in (B) with raw milk price and time stamps.
Sustainability 15 06647 g003
Figure 4. Price trends for raw milk and corn and soybean meal from 2016 to 2022.
Sustainability 15 06647 g004
Figure 5. Trend of raw milk price and dairy consumption from 2008 to 2021.
Sustainability 15 06647 g005
Figure 6. Trend of raw milk price in 2023.
Sustainability 15 06647 g006
Table 1. Performance comparison of different methods.
MethodMAEMSE
CRL + LSTM0.0113361670.00021248289
CRL + Ridge0.0092563530.00017419514
CRL + LASSO0.0108210150.00019183145
CRL + SGD0.0136668490.0003022581
CRL + CNN0.0098805230.00015970702
Table 2. Performance of different methods with corn and soybean meal price.
LSTMRidgeLASSOSGDCNN
MAE0.0291854830.0110067620.0120515030.0127685960.009396474
MSE0.0009641750.0001932560.0002301740.0002801580.000166165
Disclaimer/Publisher’s Note: The statements, opinions and data contained in all publications are solely those of the individual author(s) and contributor(s) and not of MDPI and/or the editor(s). MDPI and/or the editor(s) disclaim responsibility for any injury to people or property resulting from any ideas, methods, instructions or products referred to in the content.

