1. Introduction
The urban environment is riddled with space constraints related to residential, commercial, and industrial activities. The inefficient use of urban space may not be evident immediately, but would become apparent in the future. Hence, there must be careful urban planning, with analysis of different scenarios for long-term cases to prevent deterioration of land [
1]. In most developing countries, especially India, sustainable urban development has often been neglected, leading to overcrowding and overuse of resources in urban areas. Efficient development requires solving urbanization issues, such as transportation, land use, and population control. [
2]. Of all the resources, land use for transportation is concerning since the land and buildings use up much of the available space. Unchecked development in Chennai, the capital of the southern Indian state of Tamil Nādu, has rapidly converted agricultural and other vacant land types into unapproved structures for residential and commercial applications [
3]. Since it is a coastal city, the development is not uniform in all directions due to the ocean barrier on the eastern side. Instead, there is a disproportionate increase in population in the western and southern parts of the city, and its outer limits. As a result, 21.54% of the farmlands are degraded in the northern part of coastal Tamil Nādu [
4]. Such unapproved urbanization means that traffic volume often exceeds capacity, resulting in congestion and, as a consequence, causing time delays and pollution.
The primary importance of the study is that most cities in India are experiencing unplanned development because of urbanization. Higher demand for transportation results from both the massive migration of people from rural to urban regions, and natural growth. Indian cities are experiencing worrisome growth in their human and vehicle populations, yet their road networks are not designed to handle the volume of traffic seen today [
5].
Economic and transportation systems are mutually dependent on one another due to the interdependence of their supply and demand. The main component of a transportation system is the infrastructure that grants access to a certain degree of transportation supply. A number of models have been developed to assess the availability of transportation, and the enabling or restricting implications it has on mobility.
Thus, unplanned urbanization leads to the mixing of industrial and residential locations in a single region, which endangers human lives. Unplanned urbanization does not mean illegal construction. However, delays in setting specific guidelines by city corporations may lead to residential houses and commercial industries being built in the same region, especially in suburban regions outside large cities such as Chennai. Once the houses and industries are built, relocating the residents or companies from the regions is deemed impossible due to the significant capital costs involved. Demolition can be an option in case of illegal construction. However, since the buildings are often not illegal, no mitigating action can be taken once problems emerge.
Suburban areas experience significant physical and socioeconomic changes as cities continue to sprawl. The population growth rate of the suburban areas of Chennai is around 3.5%, higher than the city’s overall growth rate of 2.54% [
6]. Unregulated growth, low-quality housing, and inadequate infrastructure facilities are significant problems in the suburban areas of Chennai [
7]. In the greater Chennai metropolitan region, settlements are growing rapidly due to urban sprawl. However, the development of these settlements is not of the same order. Some settlements are growing more than others; however, the road network does keep up with the same development, resulting in plethora of issues. Hence, it is essential to study the suburban areas and analyze their growth patterns, to project future growth levels and their impacts on transportation facilities.
There are lack of system dynamics-based studies specific to Indian cities, especially Chennai. Due to the unique nature of urban expansion in Indian cities, it is necessary to analyze these factors in the Indian context. This is also necessary to make predictive analyses for the future. Hence, this paper analyzes the various factors of urban expansion and how these factors affect the transportation sector and traffic in Indian cities. The paper also predicts the future growth levels of traffic, and studies their impact on the transportation sector.
The next section briefly describes the urbanization problems posed to developing countries, and the problems faced in the Indian city of Chennai. The following section also identifies research gaps, addresses the literature review and related studies, and defines the study’s objectives. The research methodology, data collection, study region, and types of analysis used are described in
Section 3, while
Section 4 discusses the three scenarios in detail.
Section 5 presents the research findings and model development, while
Section 6 concludes the research and defines the potential scope of future studies.
2. Literature Review
A study on the river sediments in the Adyar and Cooum rivers was previously carried out by Saravanan et al. [
8]. These two rivers are the main means of drainage in Chennai, and are both highly polluted. Analysis of the sediment quality shows that they are highly polluted with various hard metals. Upon comparison, Chennai’s rivers were found to be the fifth-most polluted rivers in the world. This has mainly been attributed to the unplanned growth rate in the city and irresponsible management of the water bodies. The lack of strict enforcement has led to regular domestic and industrial water dumping directly into the rivers. There is also a delay in constructing adequate water treatment plants for the city; hence, most of the water from the sewers enters the rivers without any form of treatment. The growth dynamics of the Chennai Metropolitan Area (CMA) have been studied by Sekar and Kanchanamala, [
7], and the factors influencing this growth have been analyzed. The population was selected for the period between 1991 and 2001, and the policies and future development for the CMA have been reviewed.
Unchecked urbanization also led to floods in Chennai in December 2015. The prediction of runoff in the watershed of the Adyar river was studied by Sheena et al. [
9] during the storm in 2005 and floods in 2015. ArcGIS has been used for analyzing the city’s hydrology and the Adyar river’s watershed region. The results show that a staggering 1.07 billion cubic meters of water flowed into the ocean during the final three months of 2015. The Chennai floods were also studied by Faiz Ahmed and Kranthi [
10], and the damage assessment was assessed using vulnerability mapping. The damage incurred was assessed by mapping the watershed regions using data from Landsat-8 OLI, Sentinel-1, and CartoDEM-3. Geospatial techniques and spatial analyst tools were used, and it is seen that around 18% of the CMA area and 21% of the overall population were severely affected. The regions have been segregated into three types based on their vulnerability to flooding.
The above studies show that the various problems in Chennai and its urban regions are due to unplanned urbanization and t government failure to take necessary steps to curb this problem. The land along the road has developed into different types of buildings and establishments, which have further increased the traffic and the number of driveways. However, only a certain number of lanes can be built if urbanization is not checked due to a rapid increase in number of the buildings on either side. As a result, the roads cannot be widened, leading to more congestion and the deterioration of the road’s capacity to move people and goods efficiently. This reduced efficiency of the road will eventually require an increase in the number of lanes, creating a vicious cycle of unchecked development [
11].
Presently, system dynamics (SD) is developed by Forrester [
12], which is an approach based on computer-aided design, policy analysis, feedback control theory, and model system feedback [
13]. It applies emotional problems arising from different ecological systems characterized by mutual interaction, dependence on each other, circular causality, etc. [
14]. In addition, the SD model has been widely utilized by sustainability professionals to facilitate detailed analysis of the interactive human and environmental systems [
15]. The dynamic land use dataset is essential for numerous sectors, including environmental science, ecology, hydrology, farming, geology, and urban sprawl [
16].
Among the previous literature, the SD model has been implemented widely for river basins, watersheds and regions [
17,
18]. However, there is still a need for SD models that adequately integrate the various physical, social, and economic factors that determine unchecked urbanization’s current and future dynamics. However, few studies have focused on urbanization’s impact on the population and economy. Therefore, to remove this research gap, an SD model was constructed to simulate the current conditions and future scenarios of urbanization development in suburban Chennai.
From the literature, very few studies are based only on land use- and transport-balancing concepts in their infant stage. This is especially true for developing countries such as India. Moreover, there is a lack of research in the area of balancing both infrastructure and development, and an inadequate level of work to establish the land’s carrying capacity and the road network’s balancing capacity.
From the previous literature, only Sheena et al. [
9] and Ahmed and Kranthi [
10] used Chennai as a case study. However, there has not been a focus on traffic growth related to urbanization. Saravanan et al. [
8] studied the damage to the rivers. However, they did not discuss system dynamics. Though system dynamics analyses have been performed in other countries [
15], there is limited literature focused on India. There is no consistent understanding of the selection of model limits and model sectors in the reviewed literature. Although specific trends appear, there is still no unified approach to validating system dynamics models using a behavioural replication test. Some knowledge gaps are present in the environmental and social effects of urban growth. To develop a sustainable smart city, a proper balance of land use and transportation should be built systematically, on which the planning of future traffic and transportation needs depends. Hence, this study intends to develop a system dynamics model using Stella simulation software.
3. Methodology
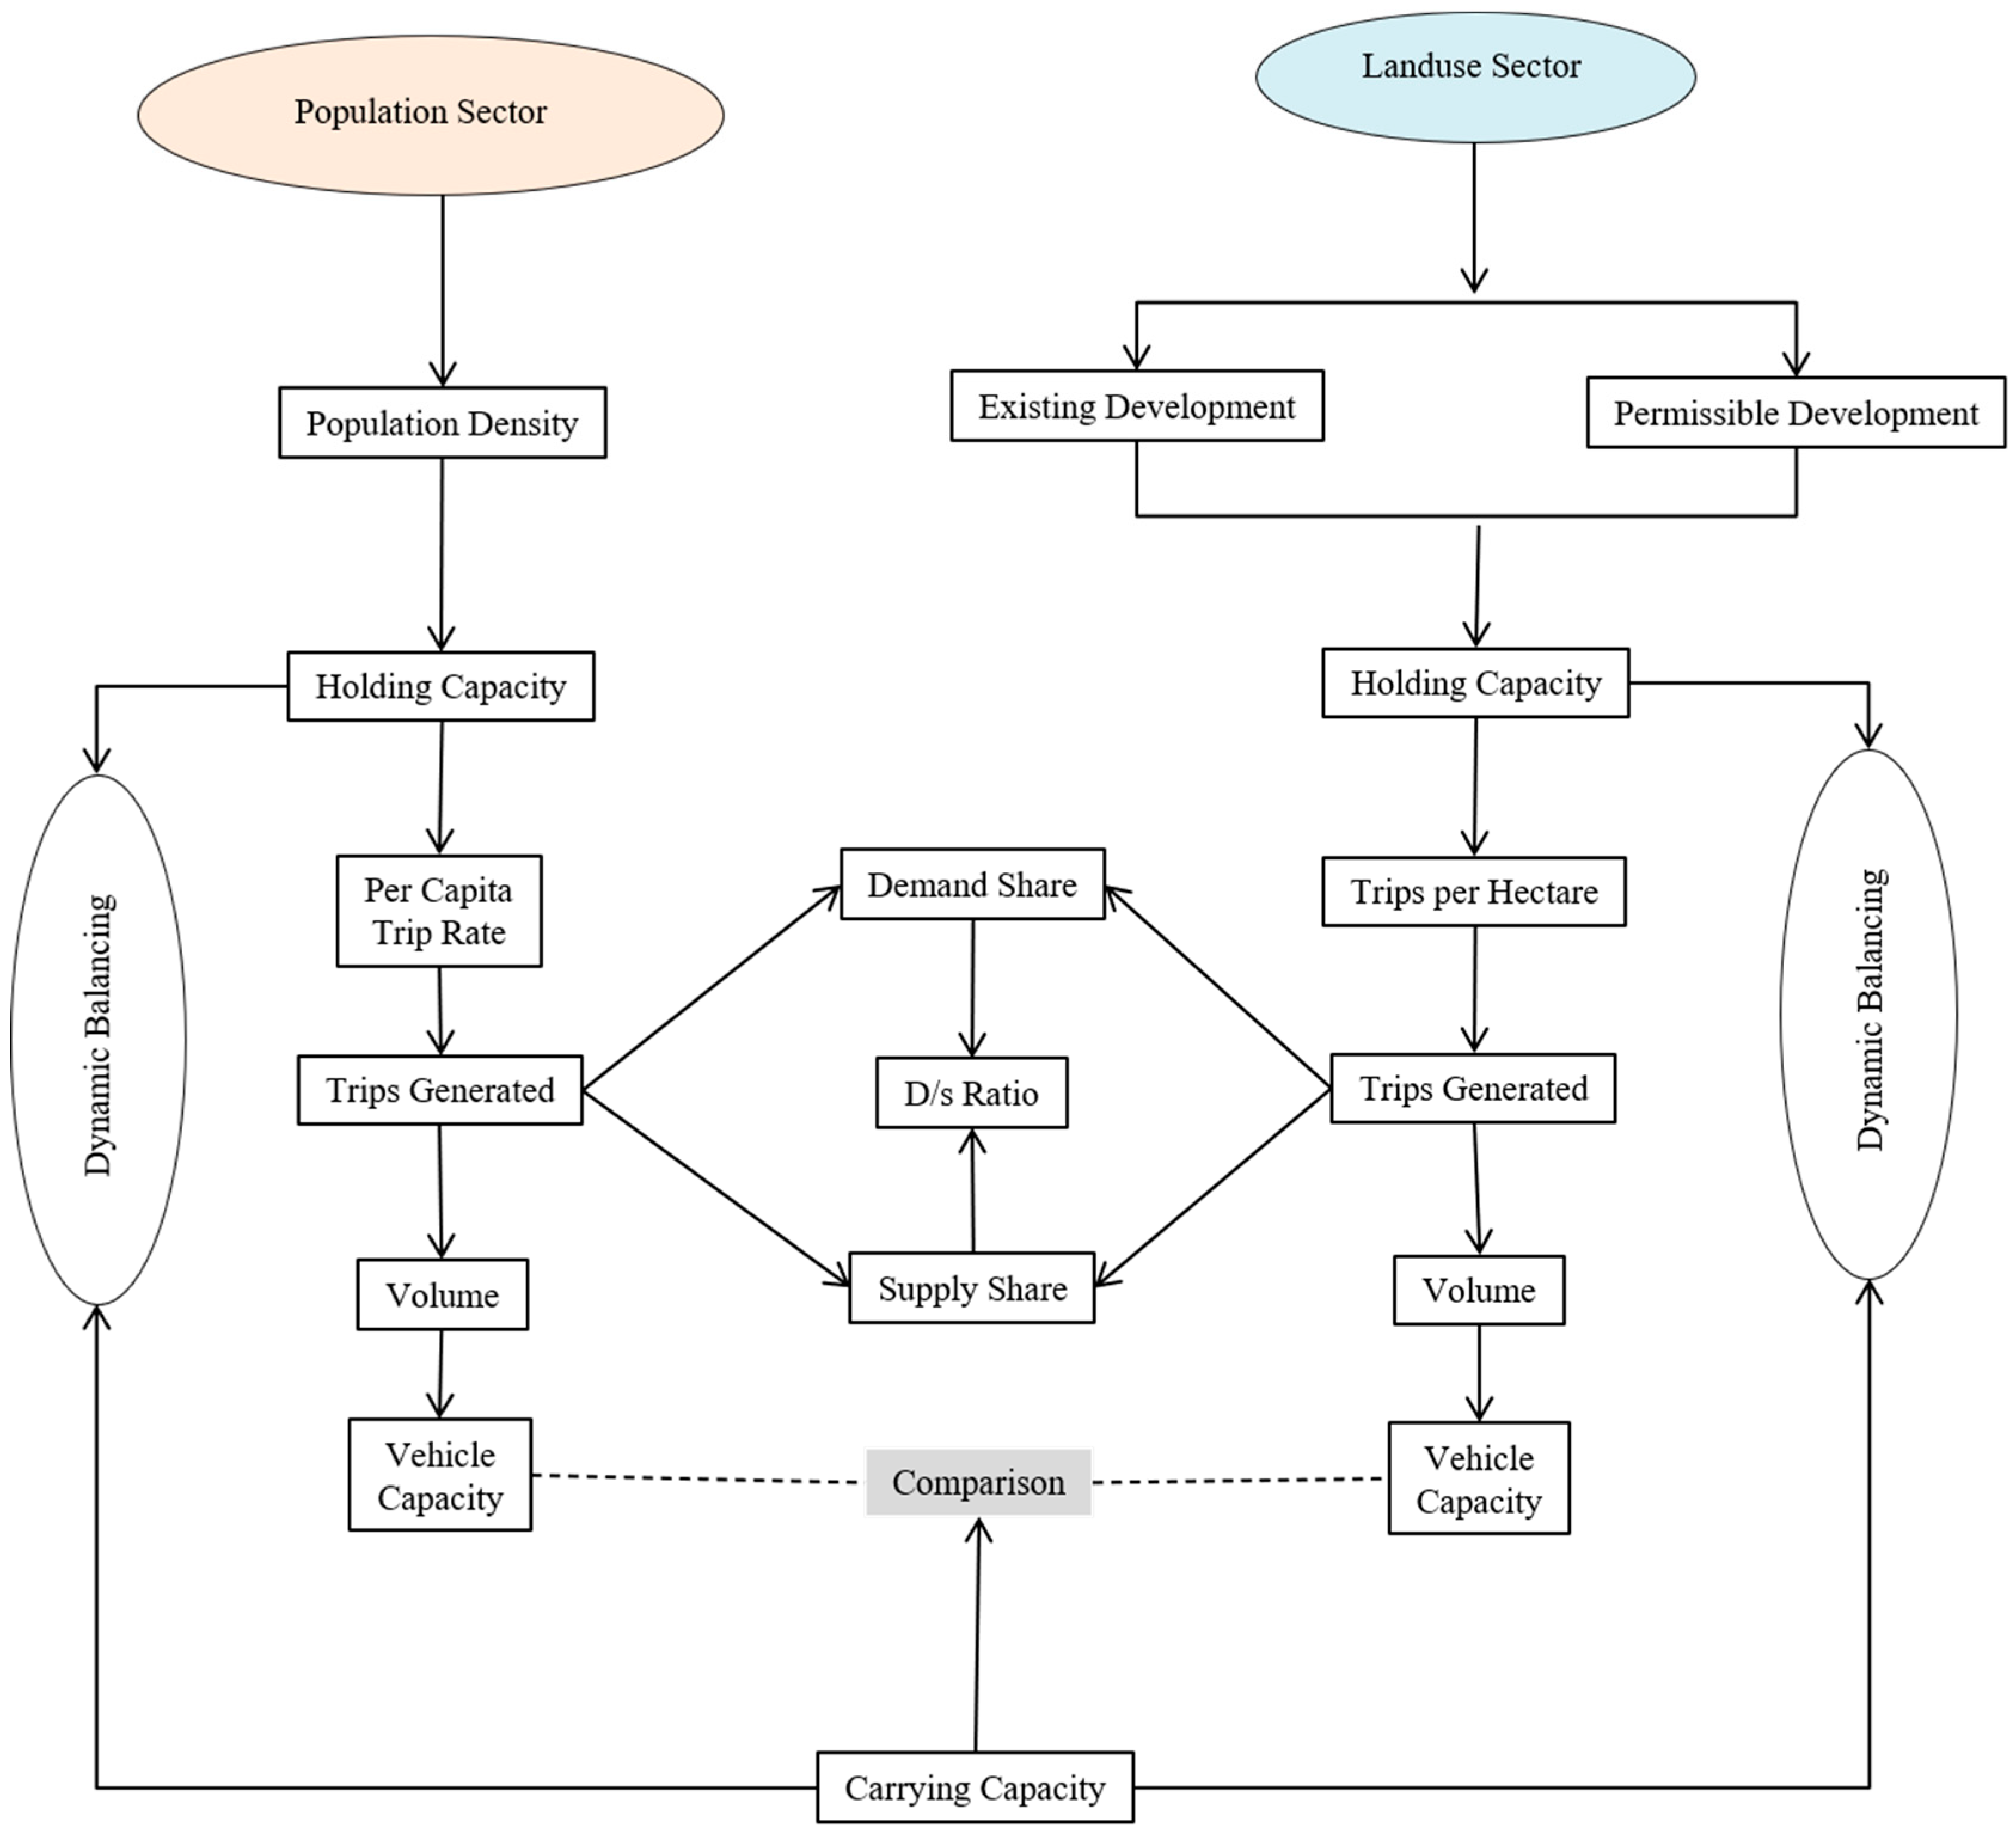
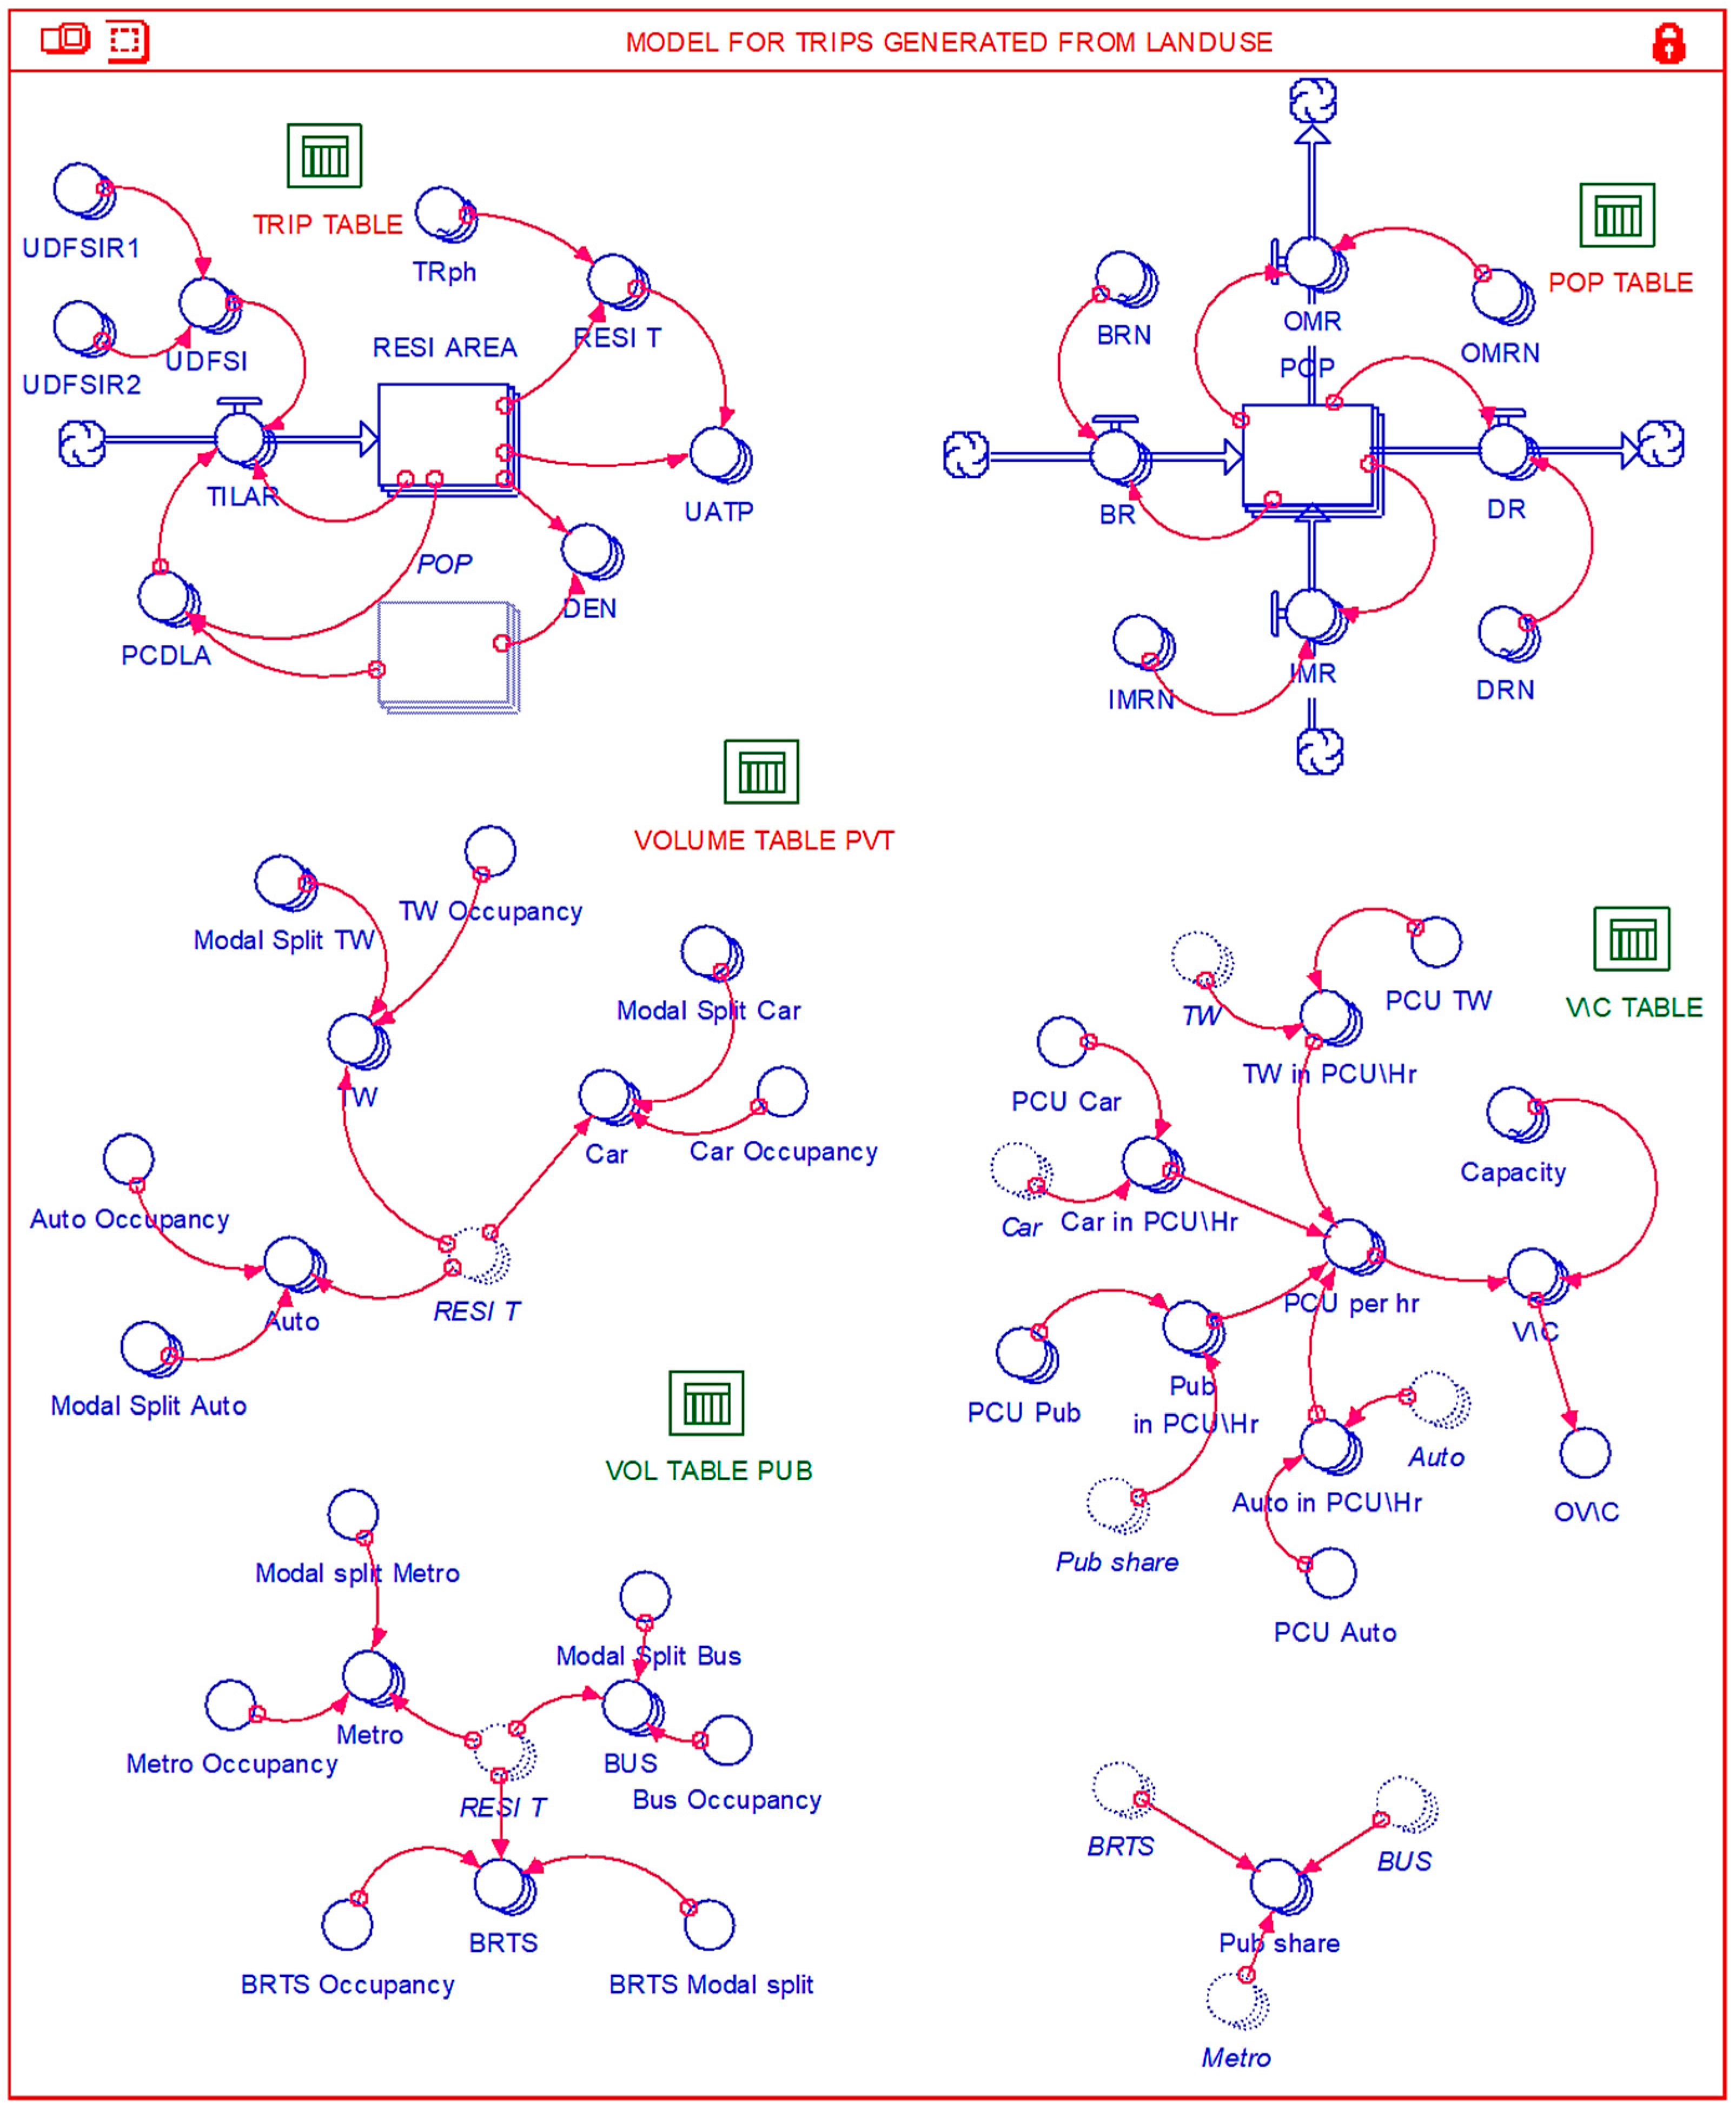
In this paper, a system dynamics model relating to transport and land use was built, as shown in
Figure 1. The novelty in this work lay in the new attempt to determine the trips generated concerning Chennai.
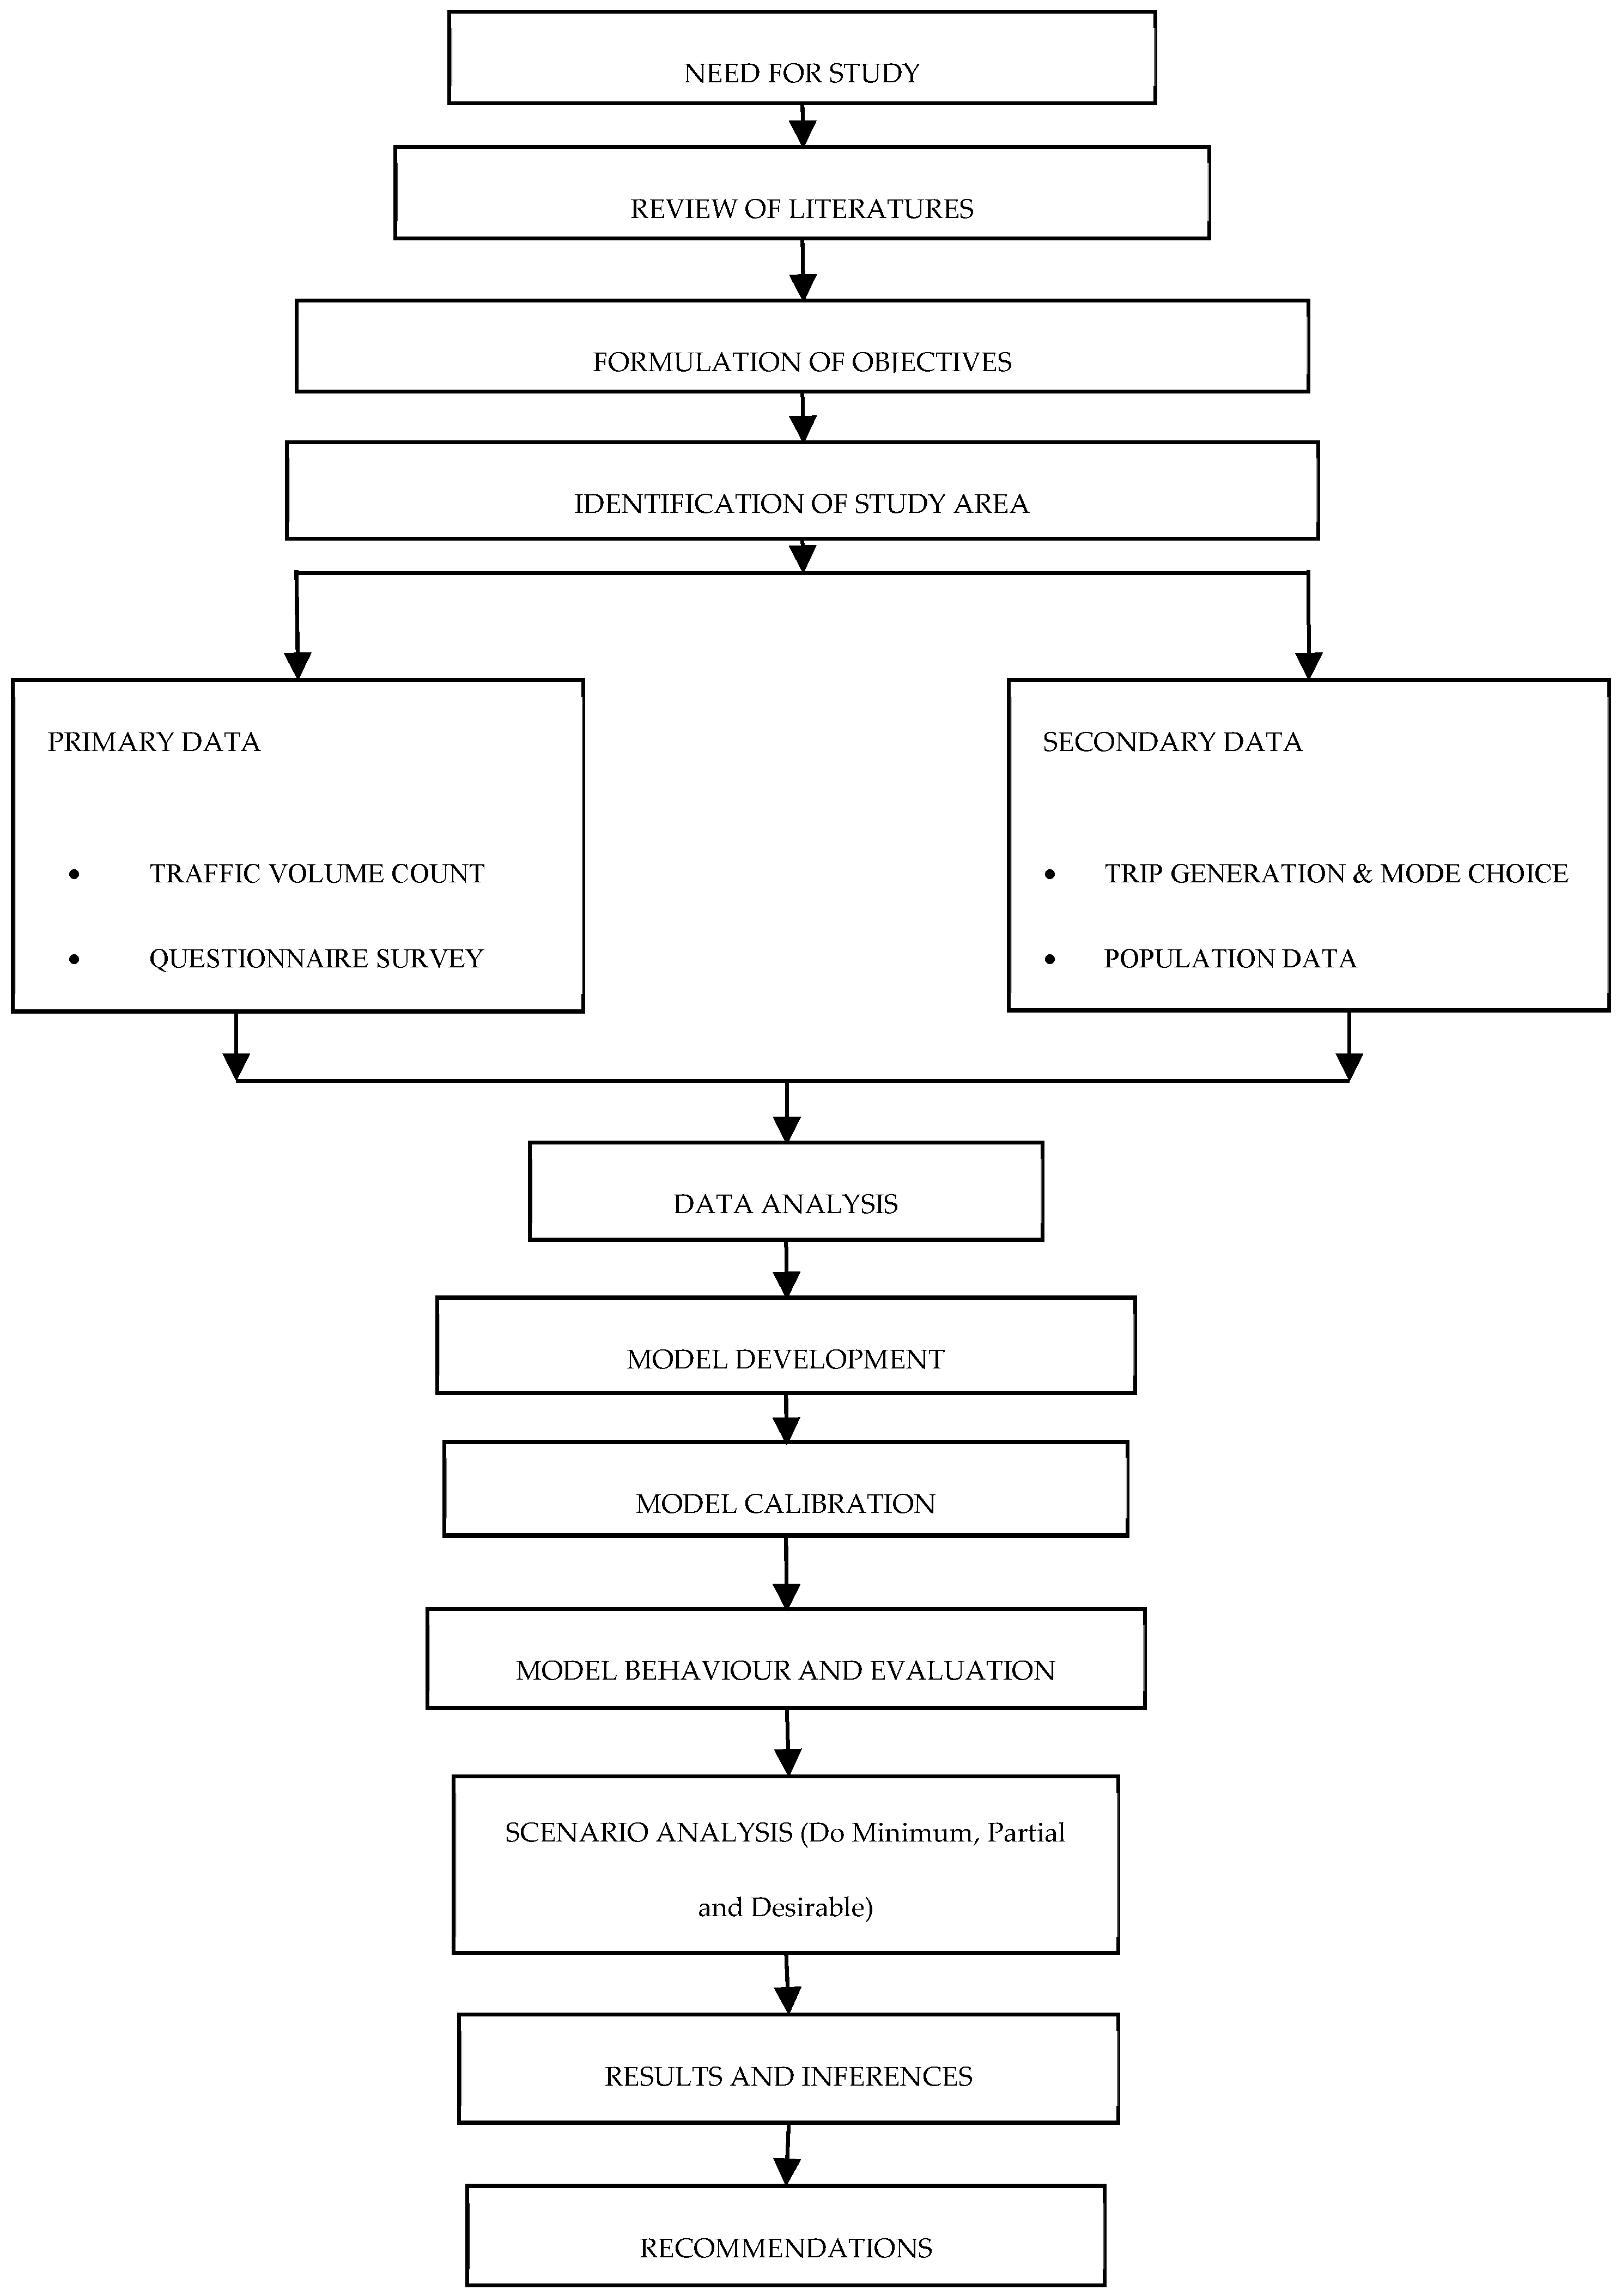
The trips were calculated for the type of land used and compared to conventional methods. Since the geopolitical scenario and the regulation were unique in India, the study was performed from the Indian perspective to study the dynamic model’s specific relevance to Chennai. Thee simulation period was taken as 20 years; the base year was 2011 and the horizon year was 2031. Data relating to vehicular growth, population, and land use in the present scenario was collected and simulated to predict future demand and supply. The holding capacity of the land use for present and future demand was simulated. The model was subjected to various scenario analyses to study the interaction between transport and land use in the study area under various conditions. The generated trips were calculated based on trip rate per hectare (TRpH) and per capita trip rate (PCTR) measures. The TRpH was the average trip rate in each hectare of the selected field, while the PCTR was the average number of trips per person. The impacts of the government policies to achieve sustainability in transport infrastructure concerning economic development were analyzed at a macro level. A comparison of the results under various scenario options was carried out to determine the advantages of adopting the tested policy measures. Based on the results, suitable recommendations for policies were provided. The impact of these scenarios, quantified as the quality of life and level of service, were analyzed in this study. The flow of this research is shown in
Figure 2.
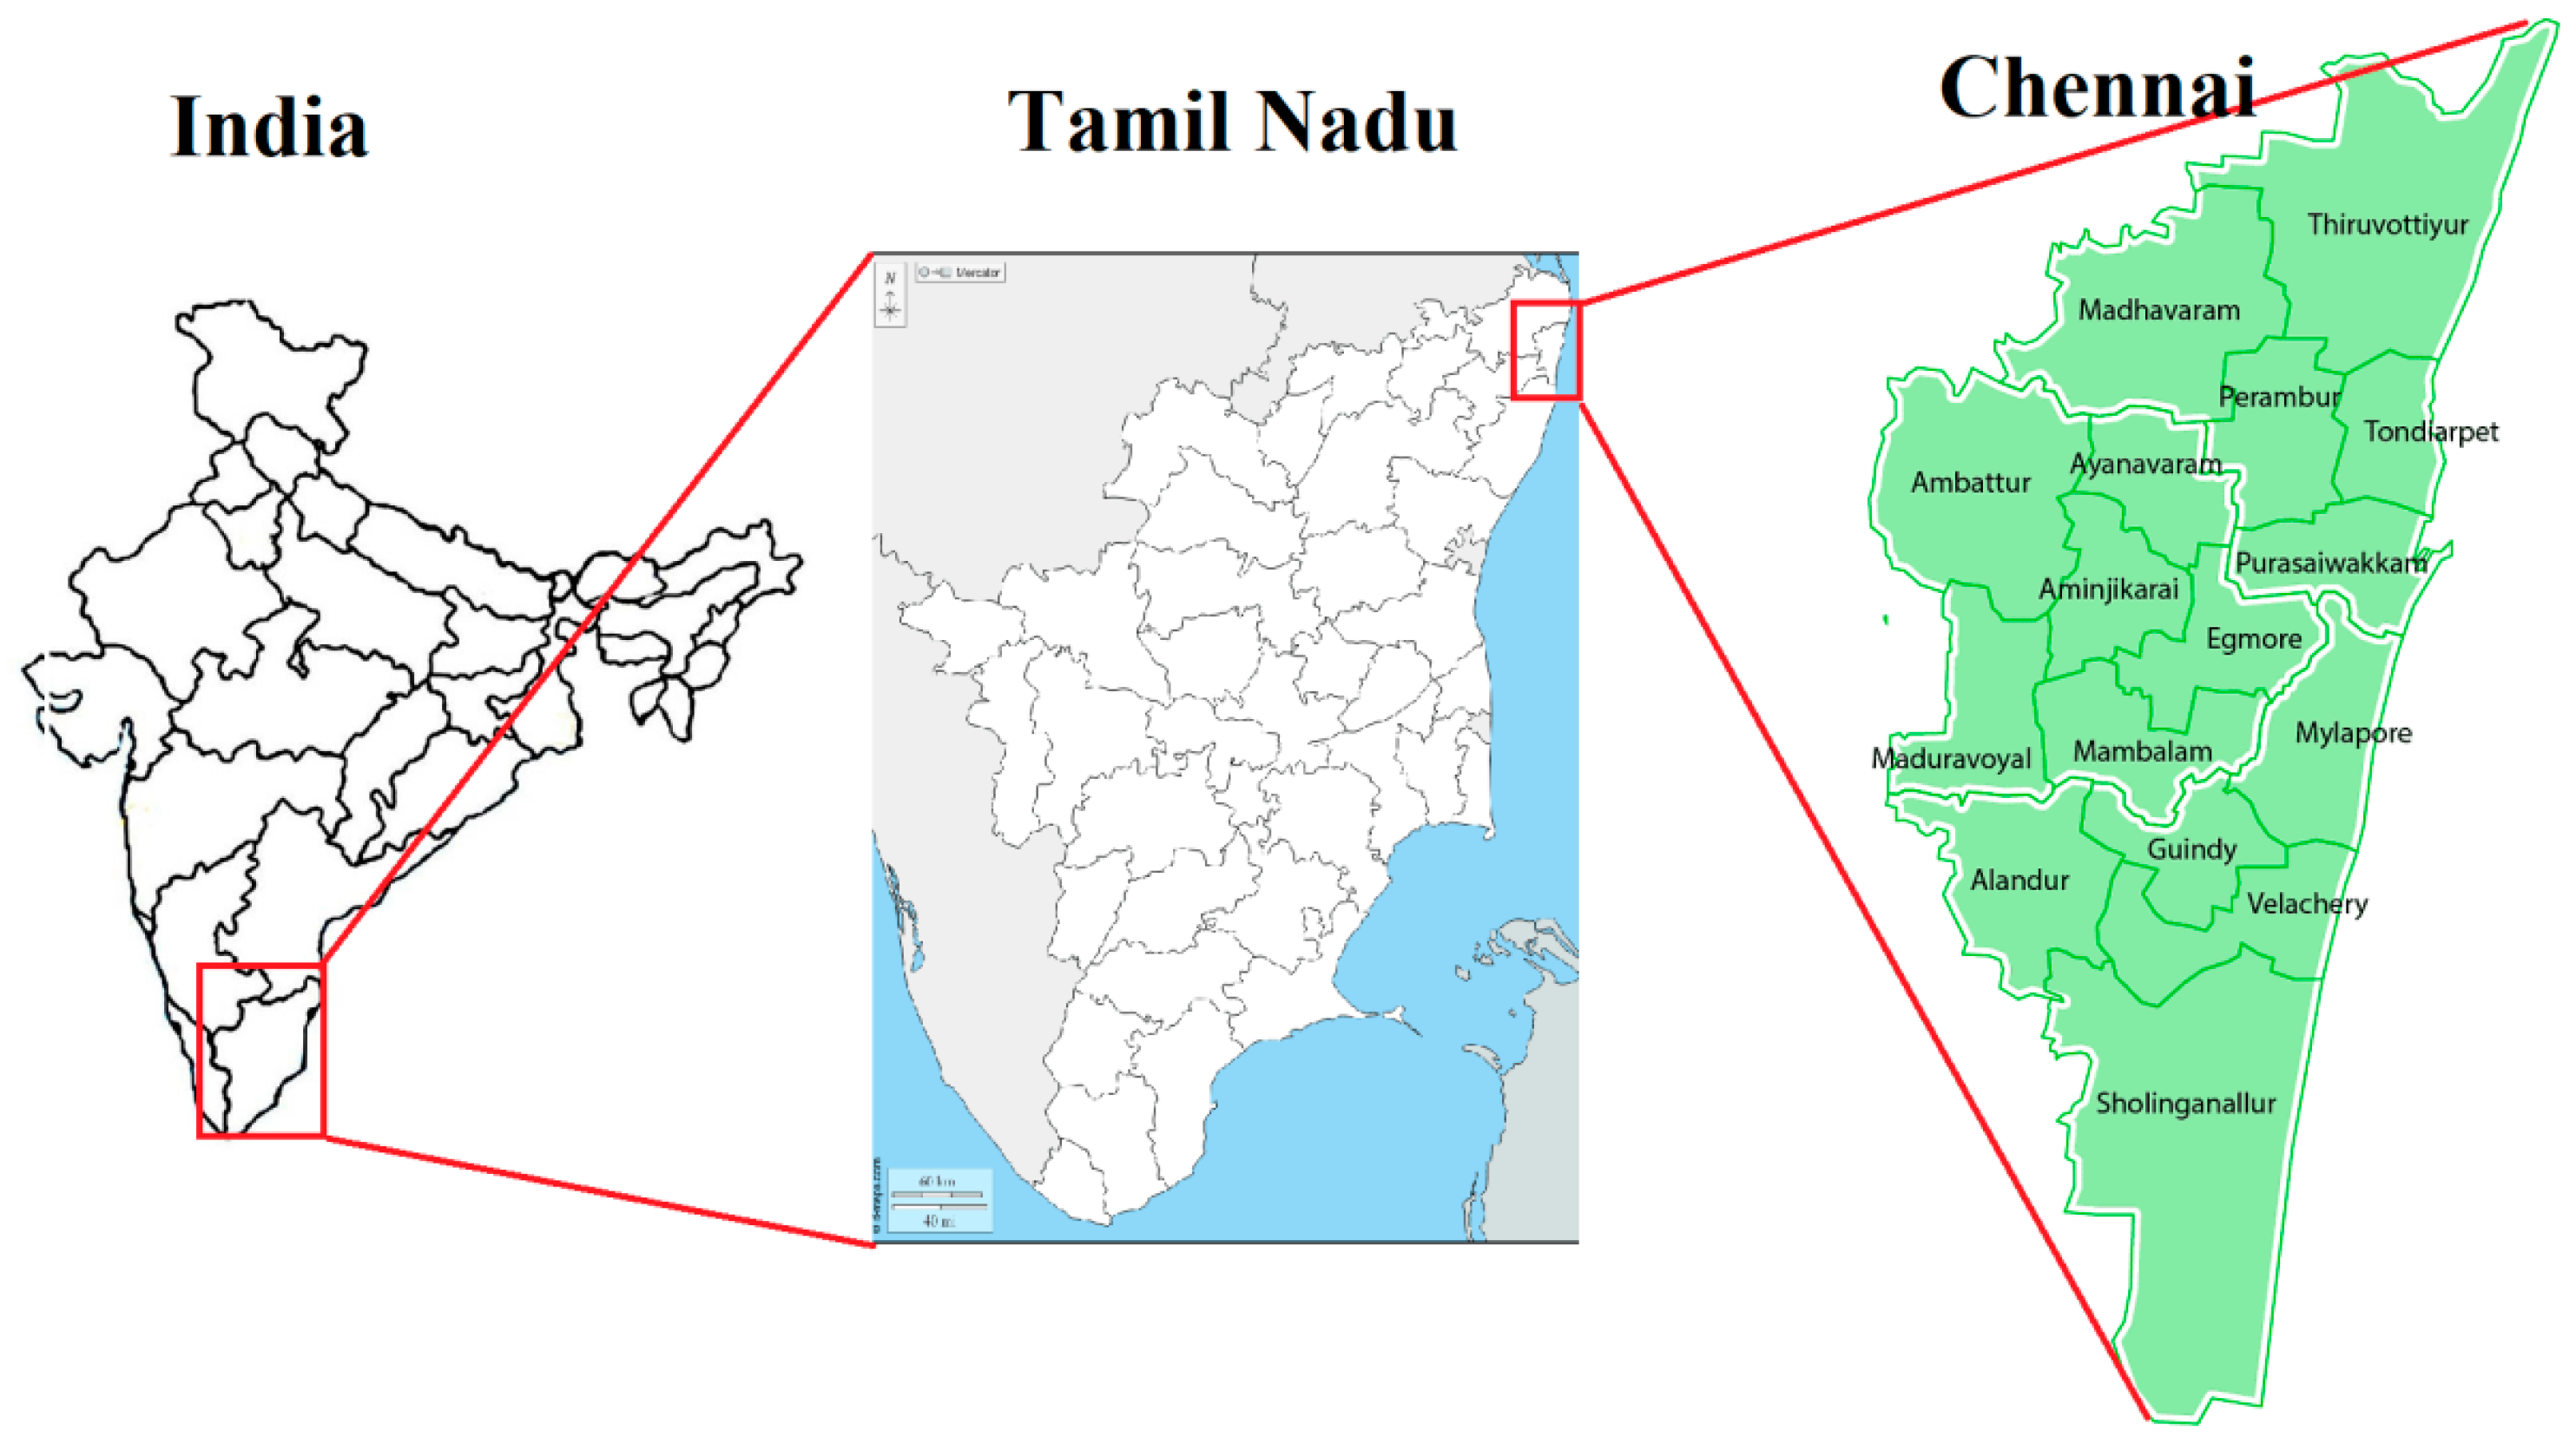
3.1. Study Area
The southern area of Chennai, surrounding Old Mahabalipuram Road (OMR) and East Coast Road (ECR), was selected as the study area. Chennai is located in the southern state of Tamil Nādu. Its location is shown in
Figure 3.
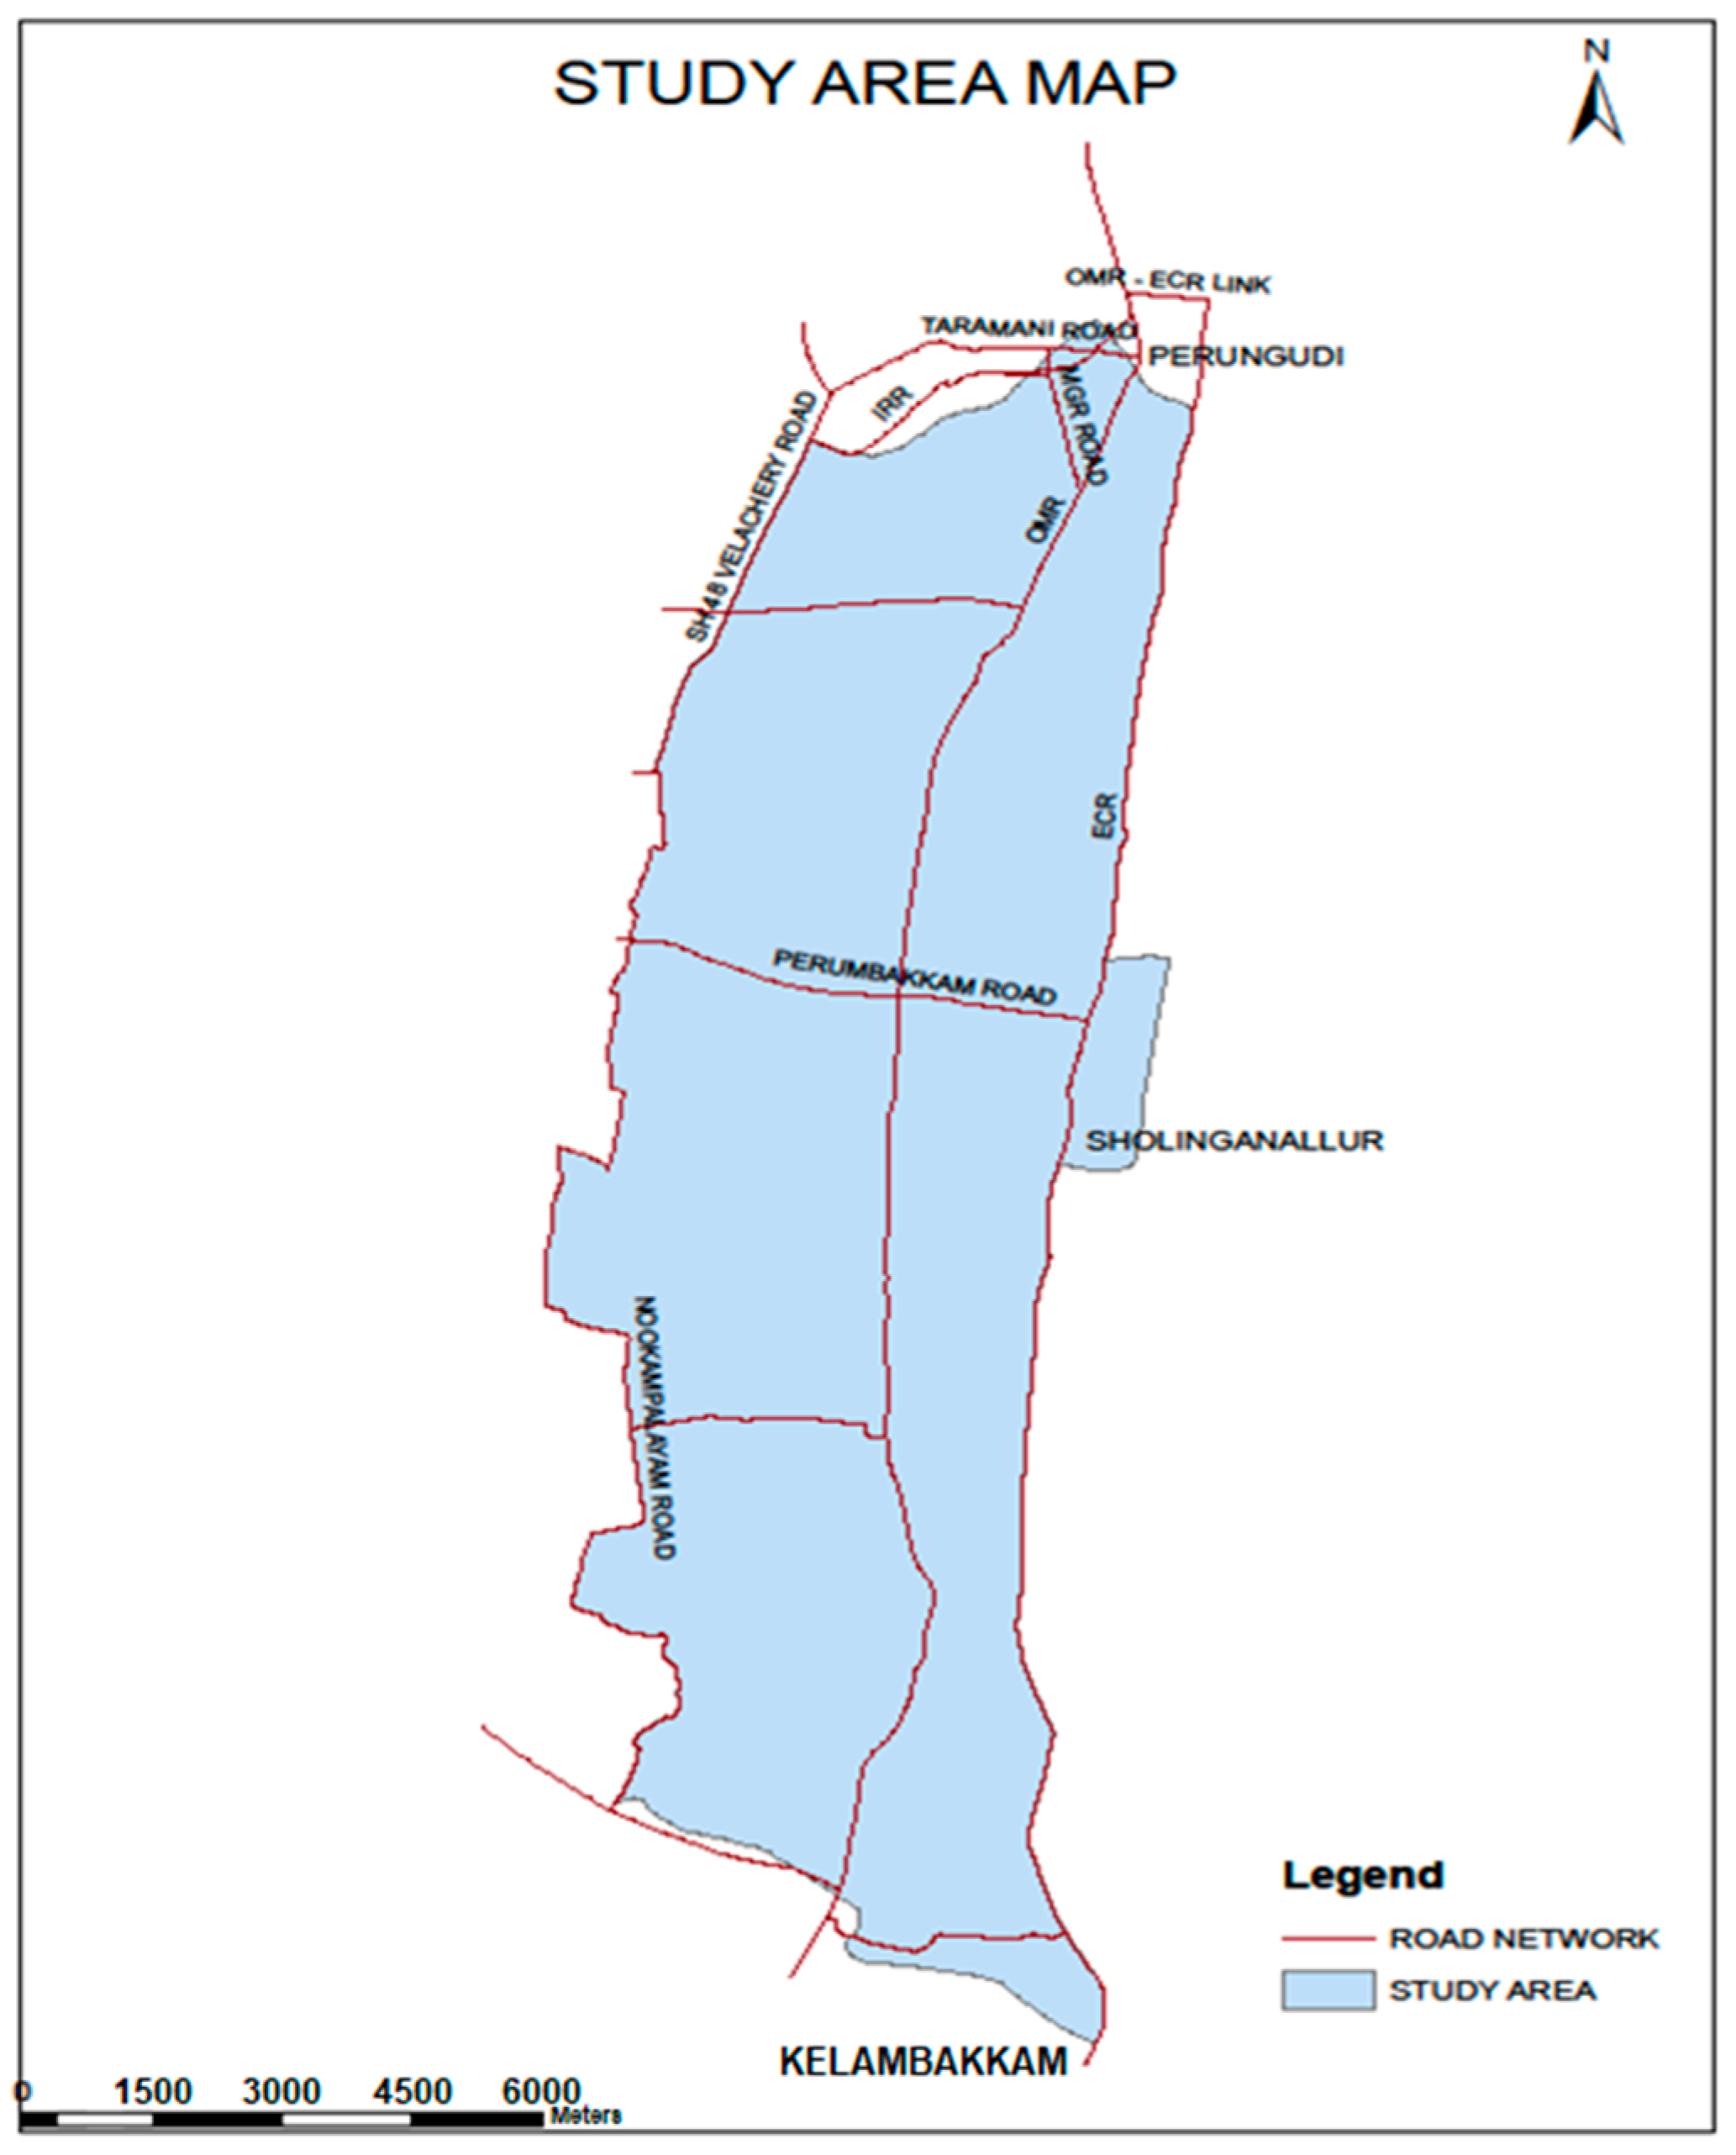
The study region is highlighted in
Figure 4, and extended from Perungudi in the city’s north to Kelambakkam in the city’s south, as well as along the ECR and up to Nookampalayam Road to the city’s west. The IT corridor is present along the OMR; hence, this region was selected by considering the adjacent regions surrounding this corridor.
3.2. Data Collection and Analysis
The holding capacity of the roads was one of the main factors influencing traffic congestion. The holding capacity was determined by considering traffic volume as primary data, while demography, land use and, norms on basic infrastructures was secondary data. Hence, both primary and secondary data had to be collected for this experiment. The collected data are briefly discussed.
3.2.1. Primary Data Collection
The primary data collection involved local trips bounded in the study area. It was achieved by conducting traffic volume surveys at three locations along Old Mahabalipuram Road between 3:30 p.m. and 8:30 p.m.
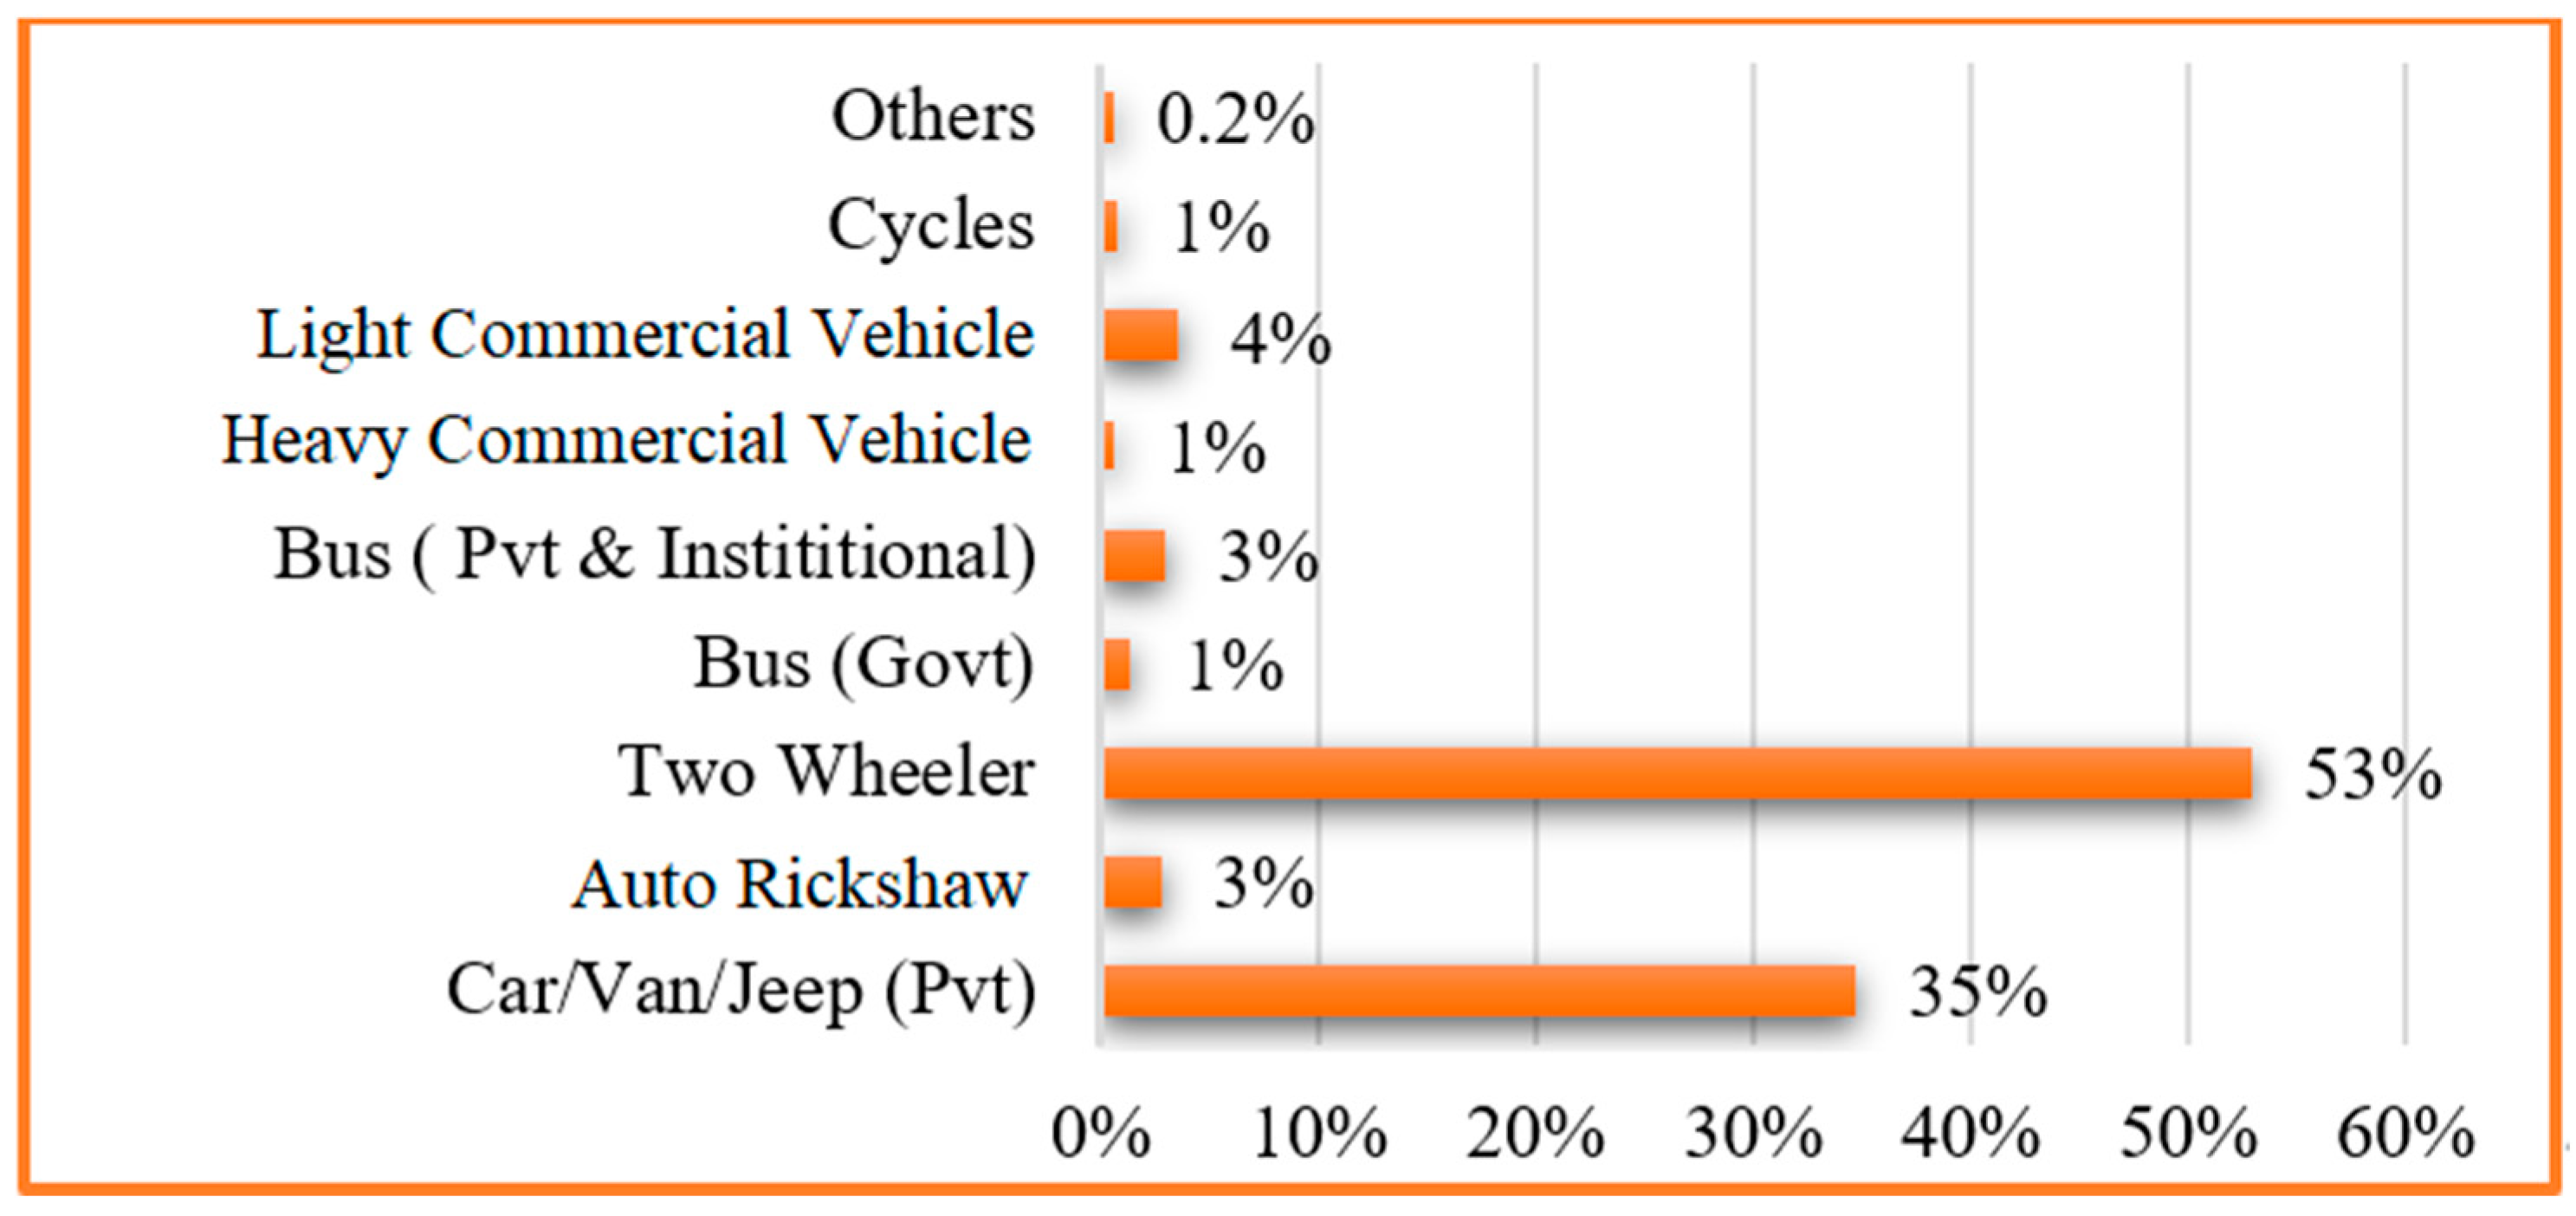
Figure 5 illustrates the vehicle composition of the Chennai IT corridor. Vehicles were separated by type and counted for analysis.
Figure 5 shows that two-wheelers and cars had the highest proportion of the total vehicle volume, at around 53% and 35%, respectively. Buses, which consisted of private, institutional, and public transportation, made up only 4% of the total vehicles. This seems to be an unhealthy proportion where environmental and level of service (LOS) considerations are concerned. Environmentally friendly vehicles, such as bicycles, made up a mere 1% of the total number of vehicles, which is an alarming statistic for a large city.
3.2.2. Trip Rate Data
The trip rate was the number of trips a person makes across a given area. The number of trips that each person takes over a certain time was also considered, and various parameters were used to measure this variable. For example, the trip rate per hectare (TRpH) was the average trip rate for every hectare in the selected region, as shown in Equation (1).
Equation (1) was calculated by surveying the study area, and deriving the trips generated per hectare based on the trip data. The collected TRpH was given in
Table 1.
The term simple loop referred to a system in which one variable influences another cyclically. For example, variable A may influence variable B, which in turn influences variable C and variable D. Researchers may or may not need multiple variables to complete the loop. A positive effect was indicated using the ‘+’ sign, while a negative effect was indicated with the ‘−’ sign. The causal loop for all models s shown in
Figure 6. It can be seen that the population variable had a positive impact on four other variables, which were in-migration, out-migration, birth and death. In contrast, the inverse had a negative impact.
3.2.3. Land Use Data
Land use was defined as the management and modification of existing land into a different type of land. In this case, it is the conversion of agricultural, forested, and wasteland into urban land. The conversion of land use must be productive in a planned urban region, given the limited land available for urban use. This paper extracted the land area corresponding to every land use type from Geo referencing. A land use map was created using ARCGIS 10.2.2, and the classifications were specified via Erdas 2014 and using LISS III data from Bhuvan [
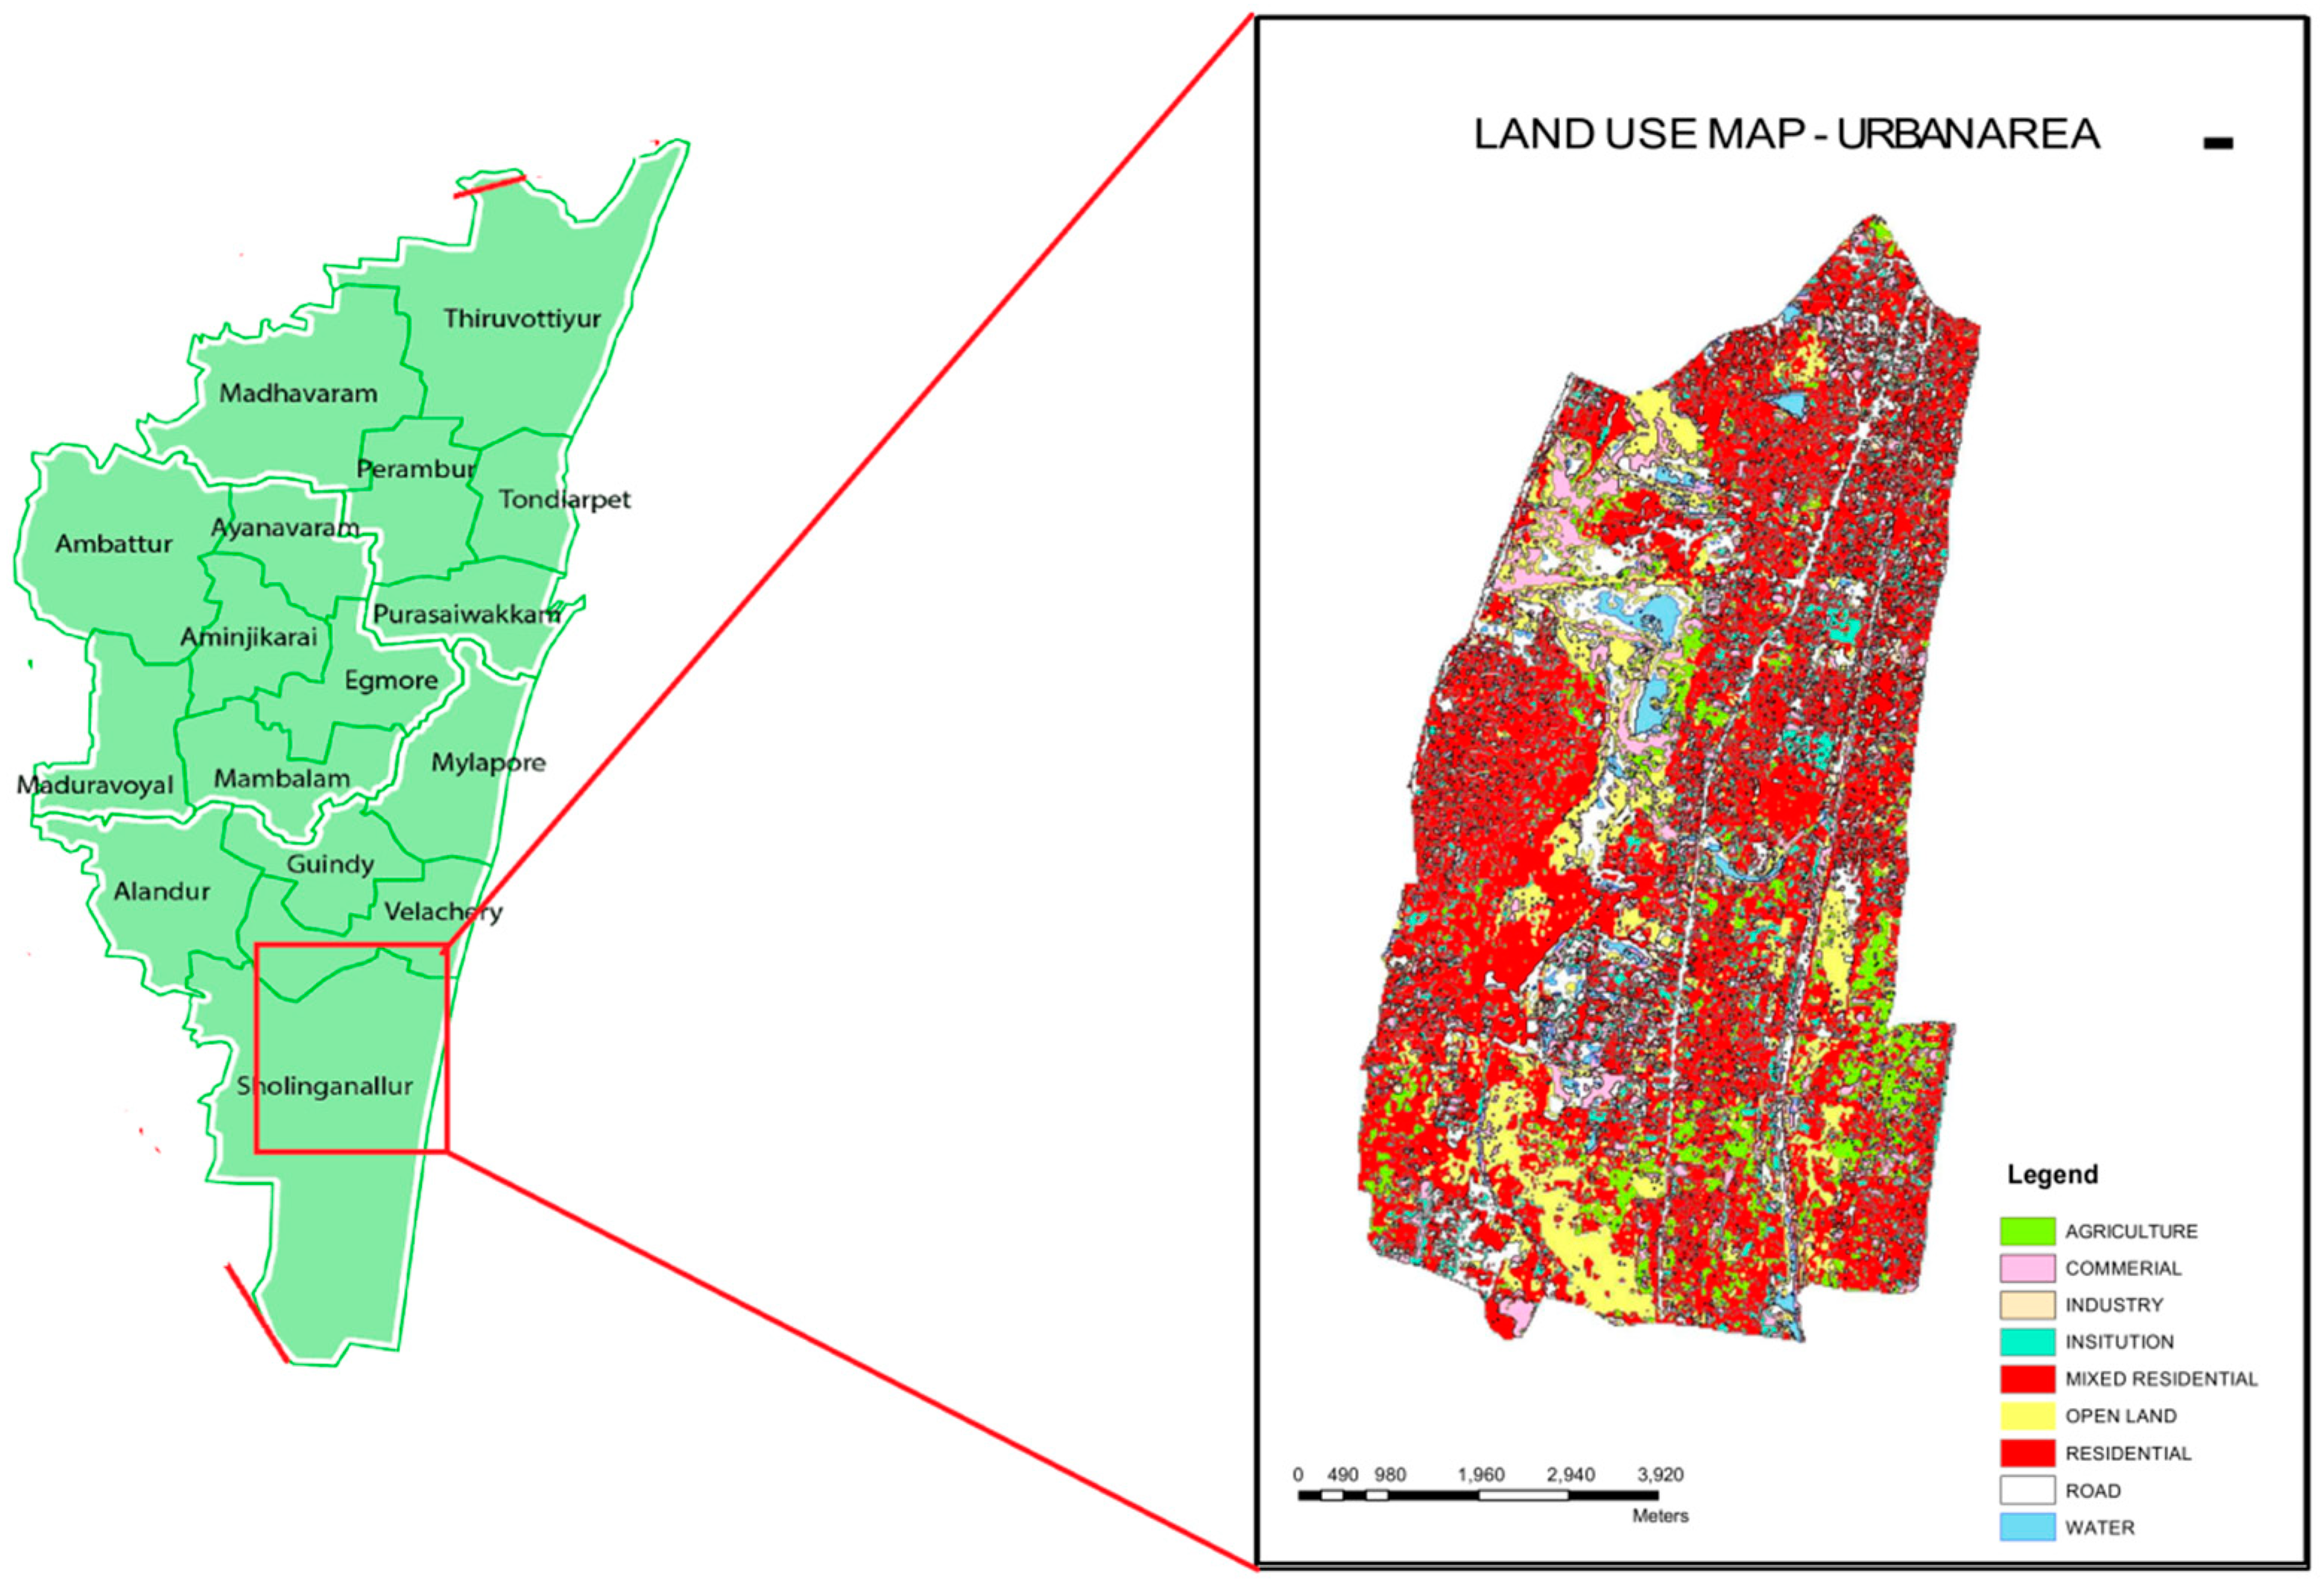
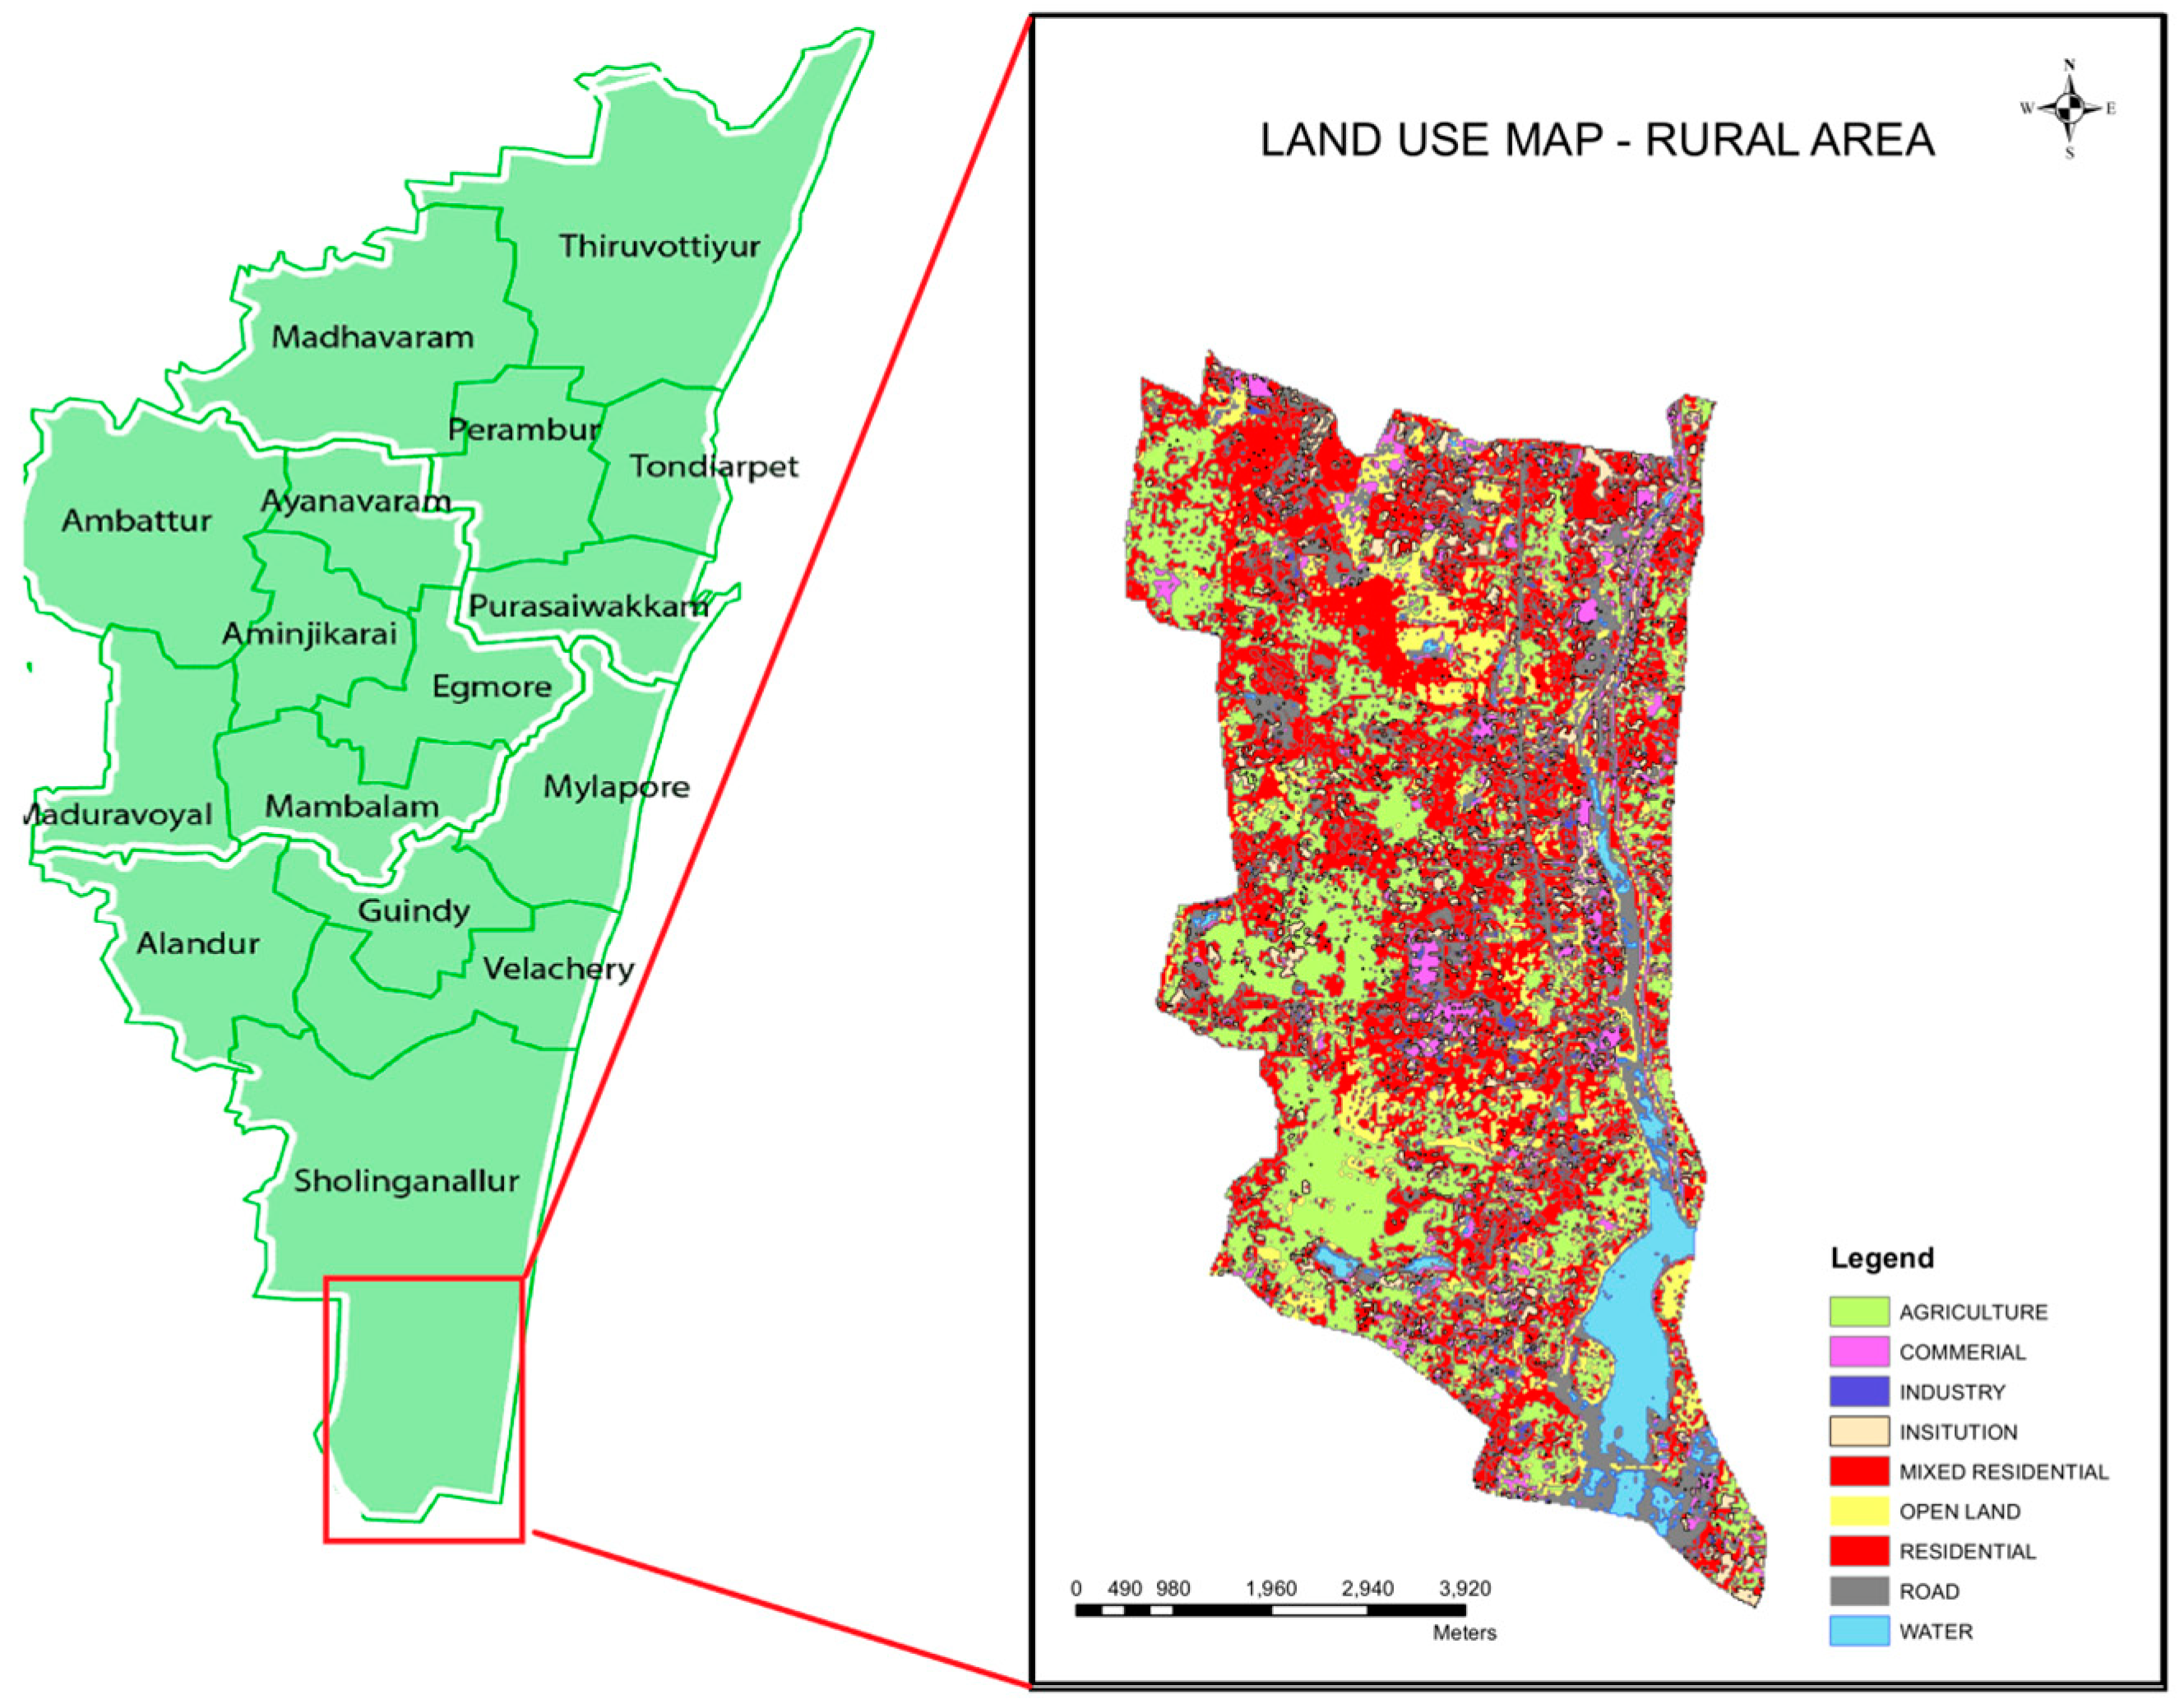
19]. The urban and rural regions were split into two sections: the areas located from Perungudi to Sholinganallur were regarded as urban areas, while the areas between Siruseri to Kelambakkam were regarded as rural regions. The land use data for both rural and urban regions from satellite data in 2021 is given in
Figure 7 and
Figure 8, while the composition for the residential area is given in
Table 2.
Figure 7 and
Figure 8 show that the urban region consisted mainly of residential buildings, and a mixture of residential and other buildings. The total residential portion of urban land was around 21.39%. On the other hand, the rural region had more agricultural land and contained a larger area of water bodies. The percentage of residential land was comparatively higher than urban at 32.55%. The availability of open land was negligible in both regions.
3.2.4. Secondary Data Collection
The demography data for rural and urban areas was collected as secondary data from the 2011 Indian Census. This data defined of nature of the local population, and is quantitative in nature.
3.3. System Design
Stella, a tool for system dynamics, was used in this work. Stella is an object-oriented programming environment, where models can be designed by linking different parameters to create a single framework, which makes the structure of the model become clear. The model integrated various data collected through primary or secondary data, such as population, births, deaths, birth rate, and death rate. The tool also created the difference equations automatically based on these inputs.
4. Scenarios
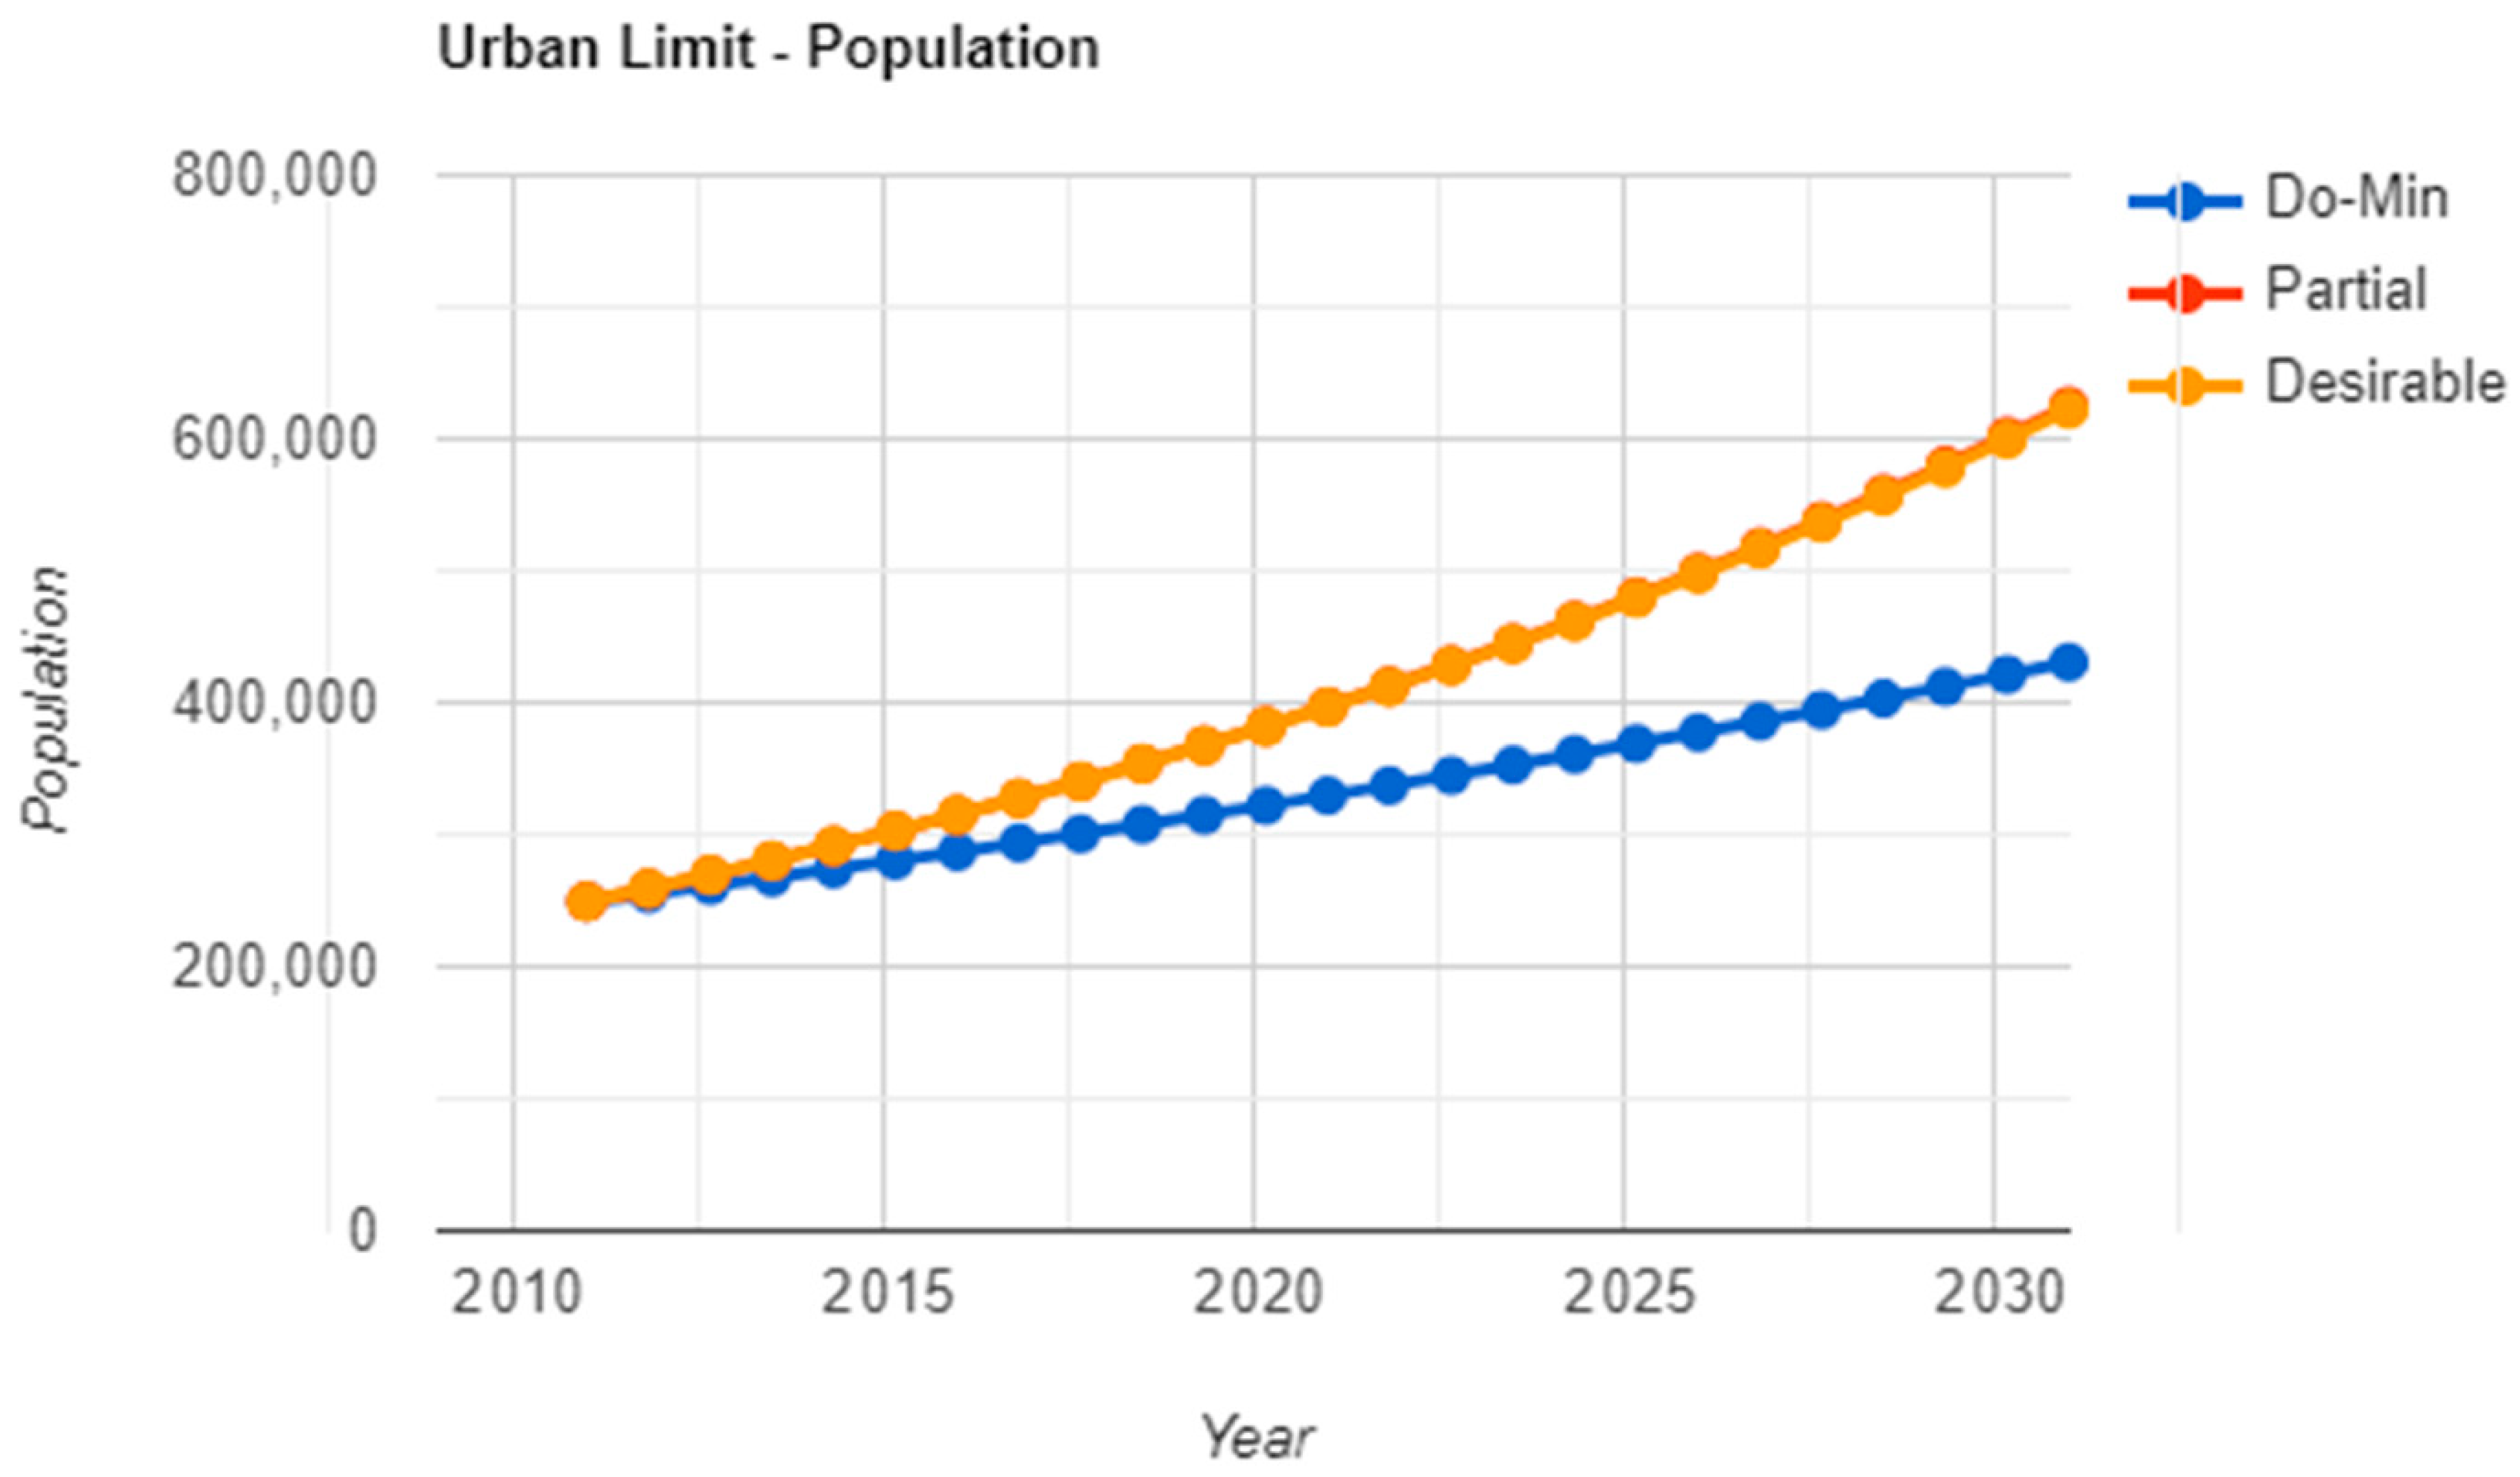
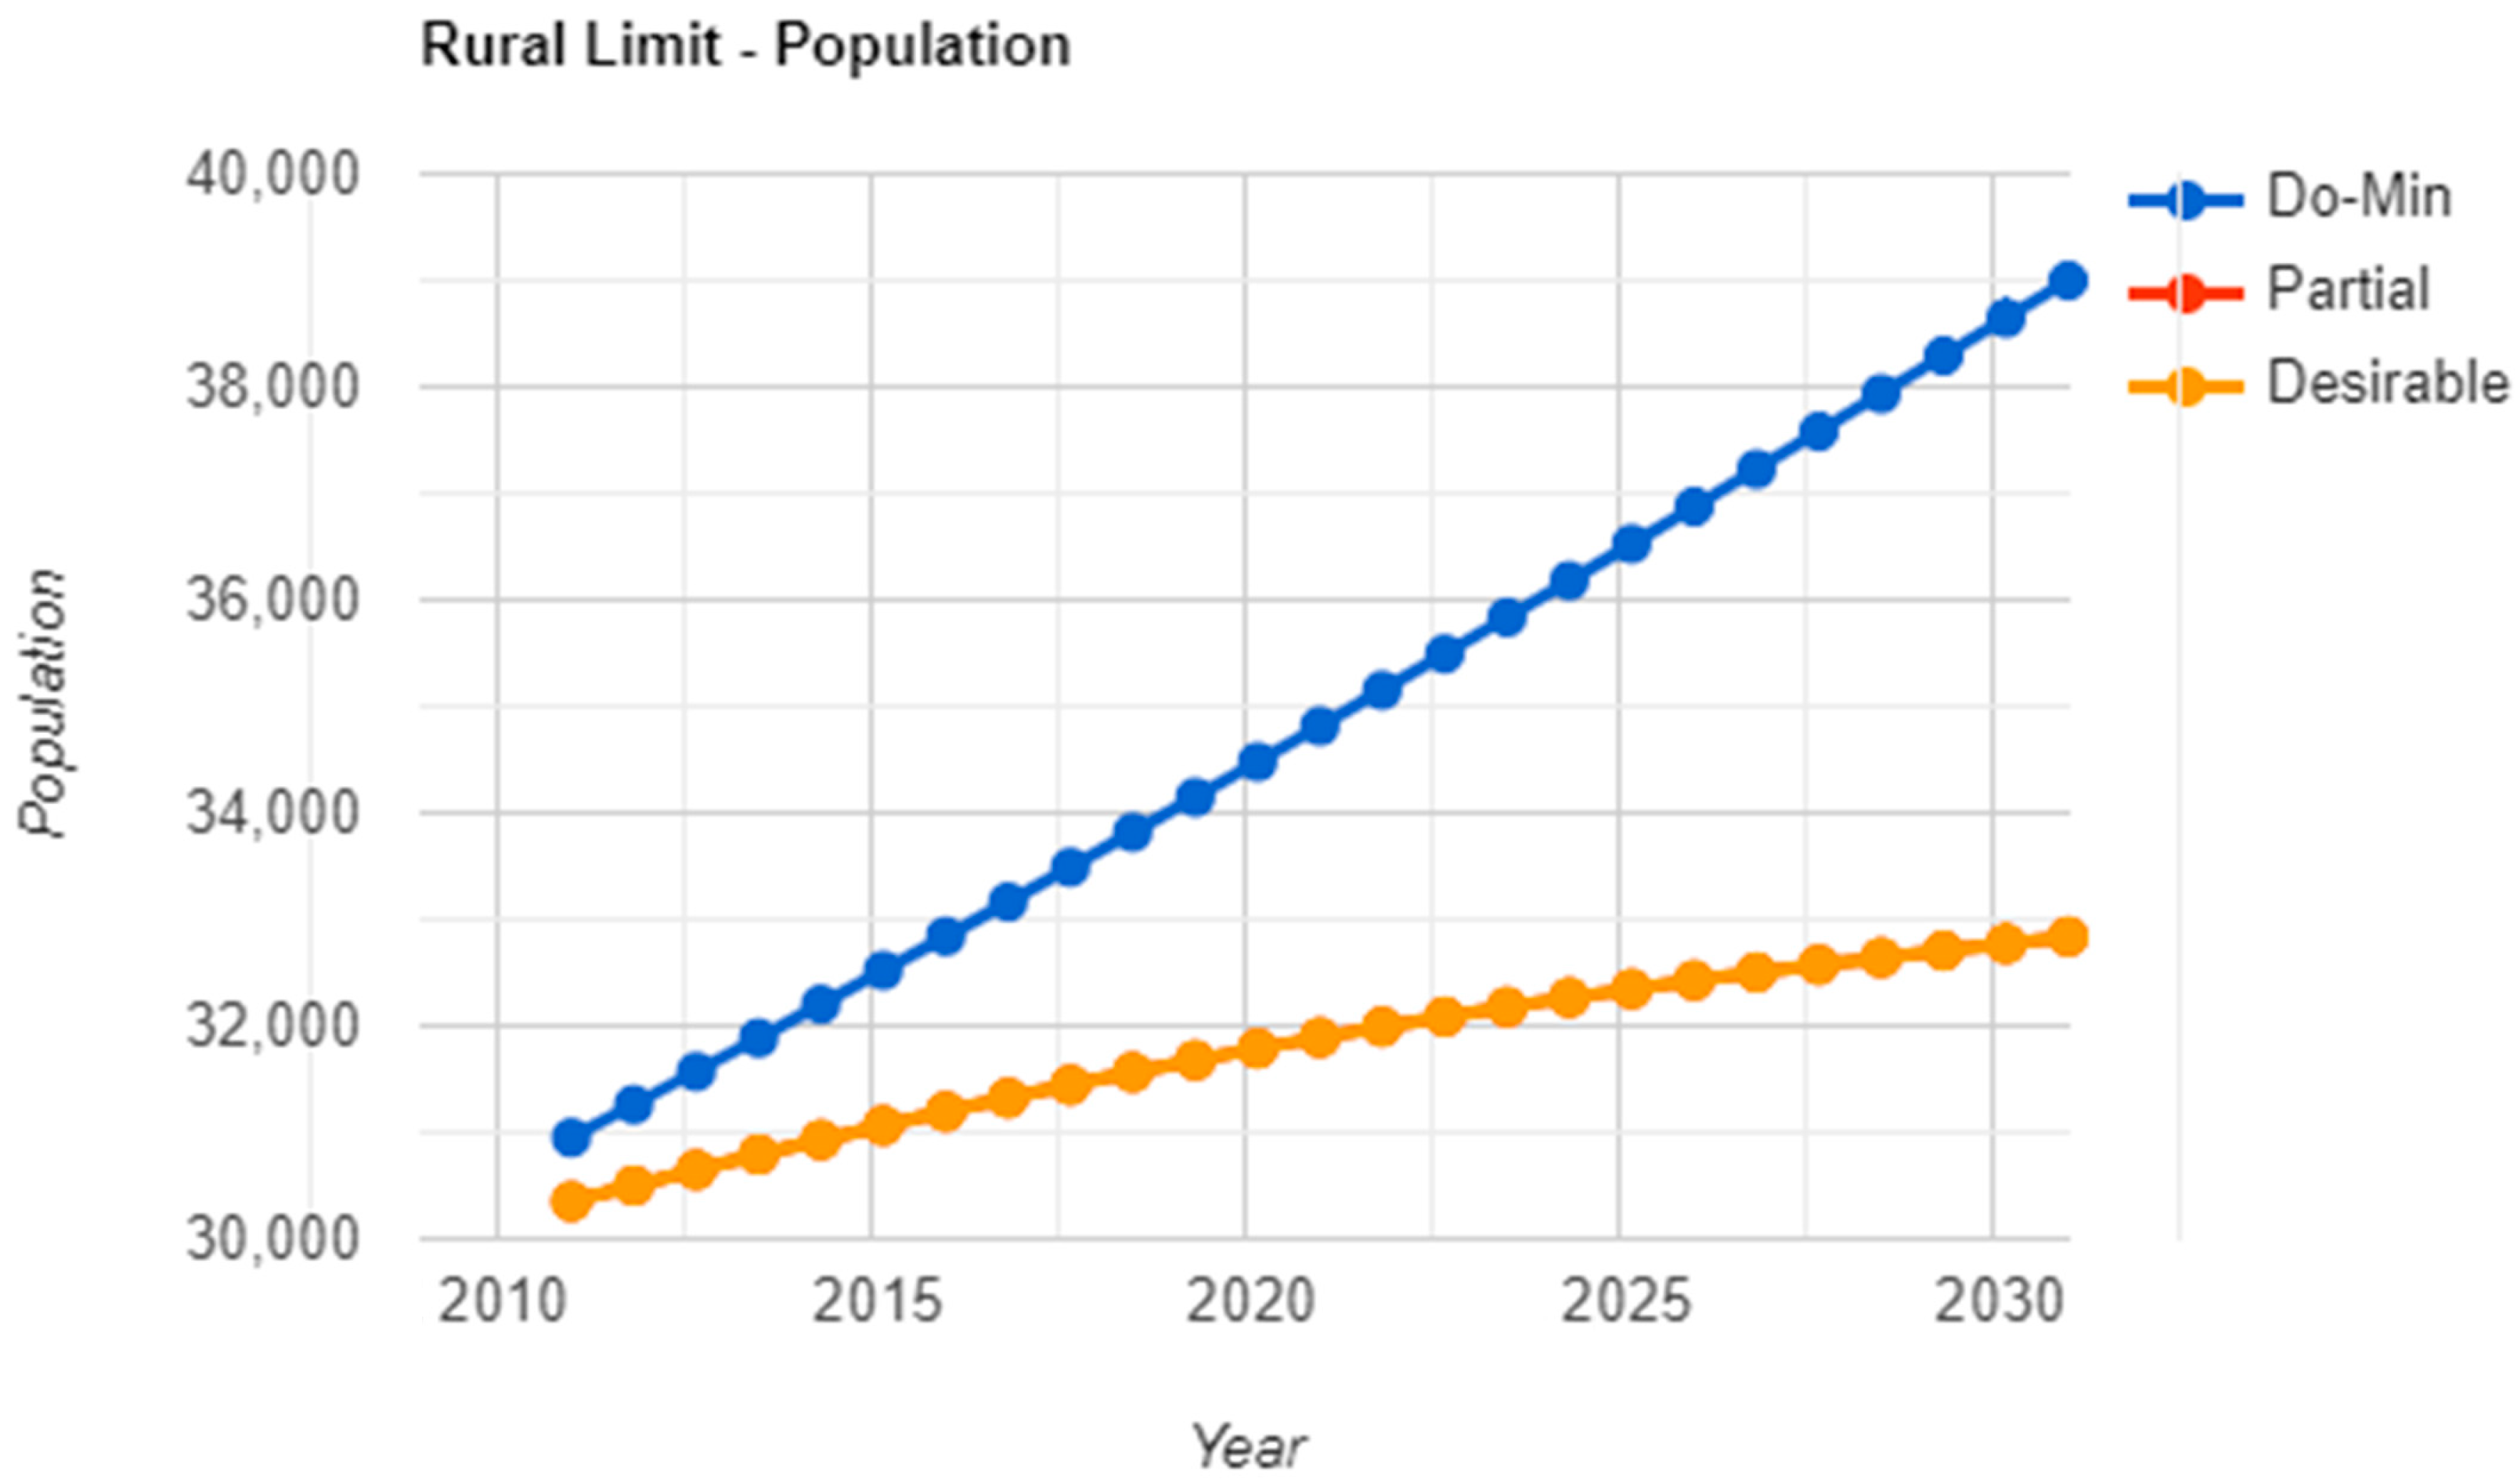
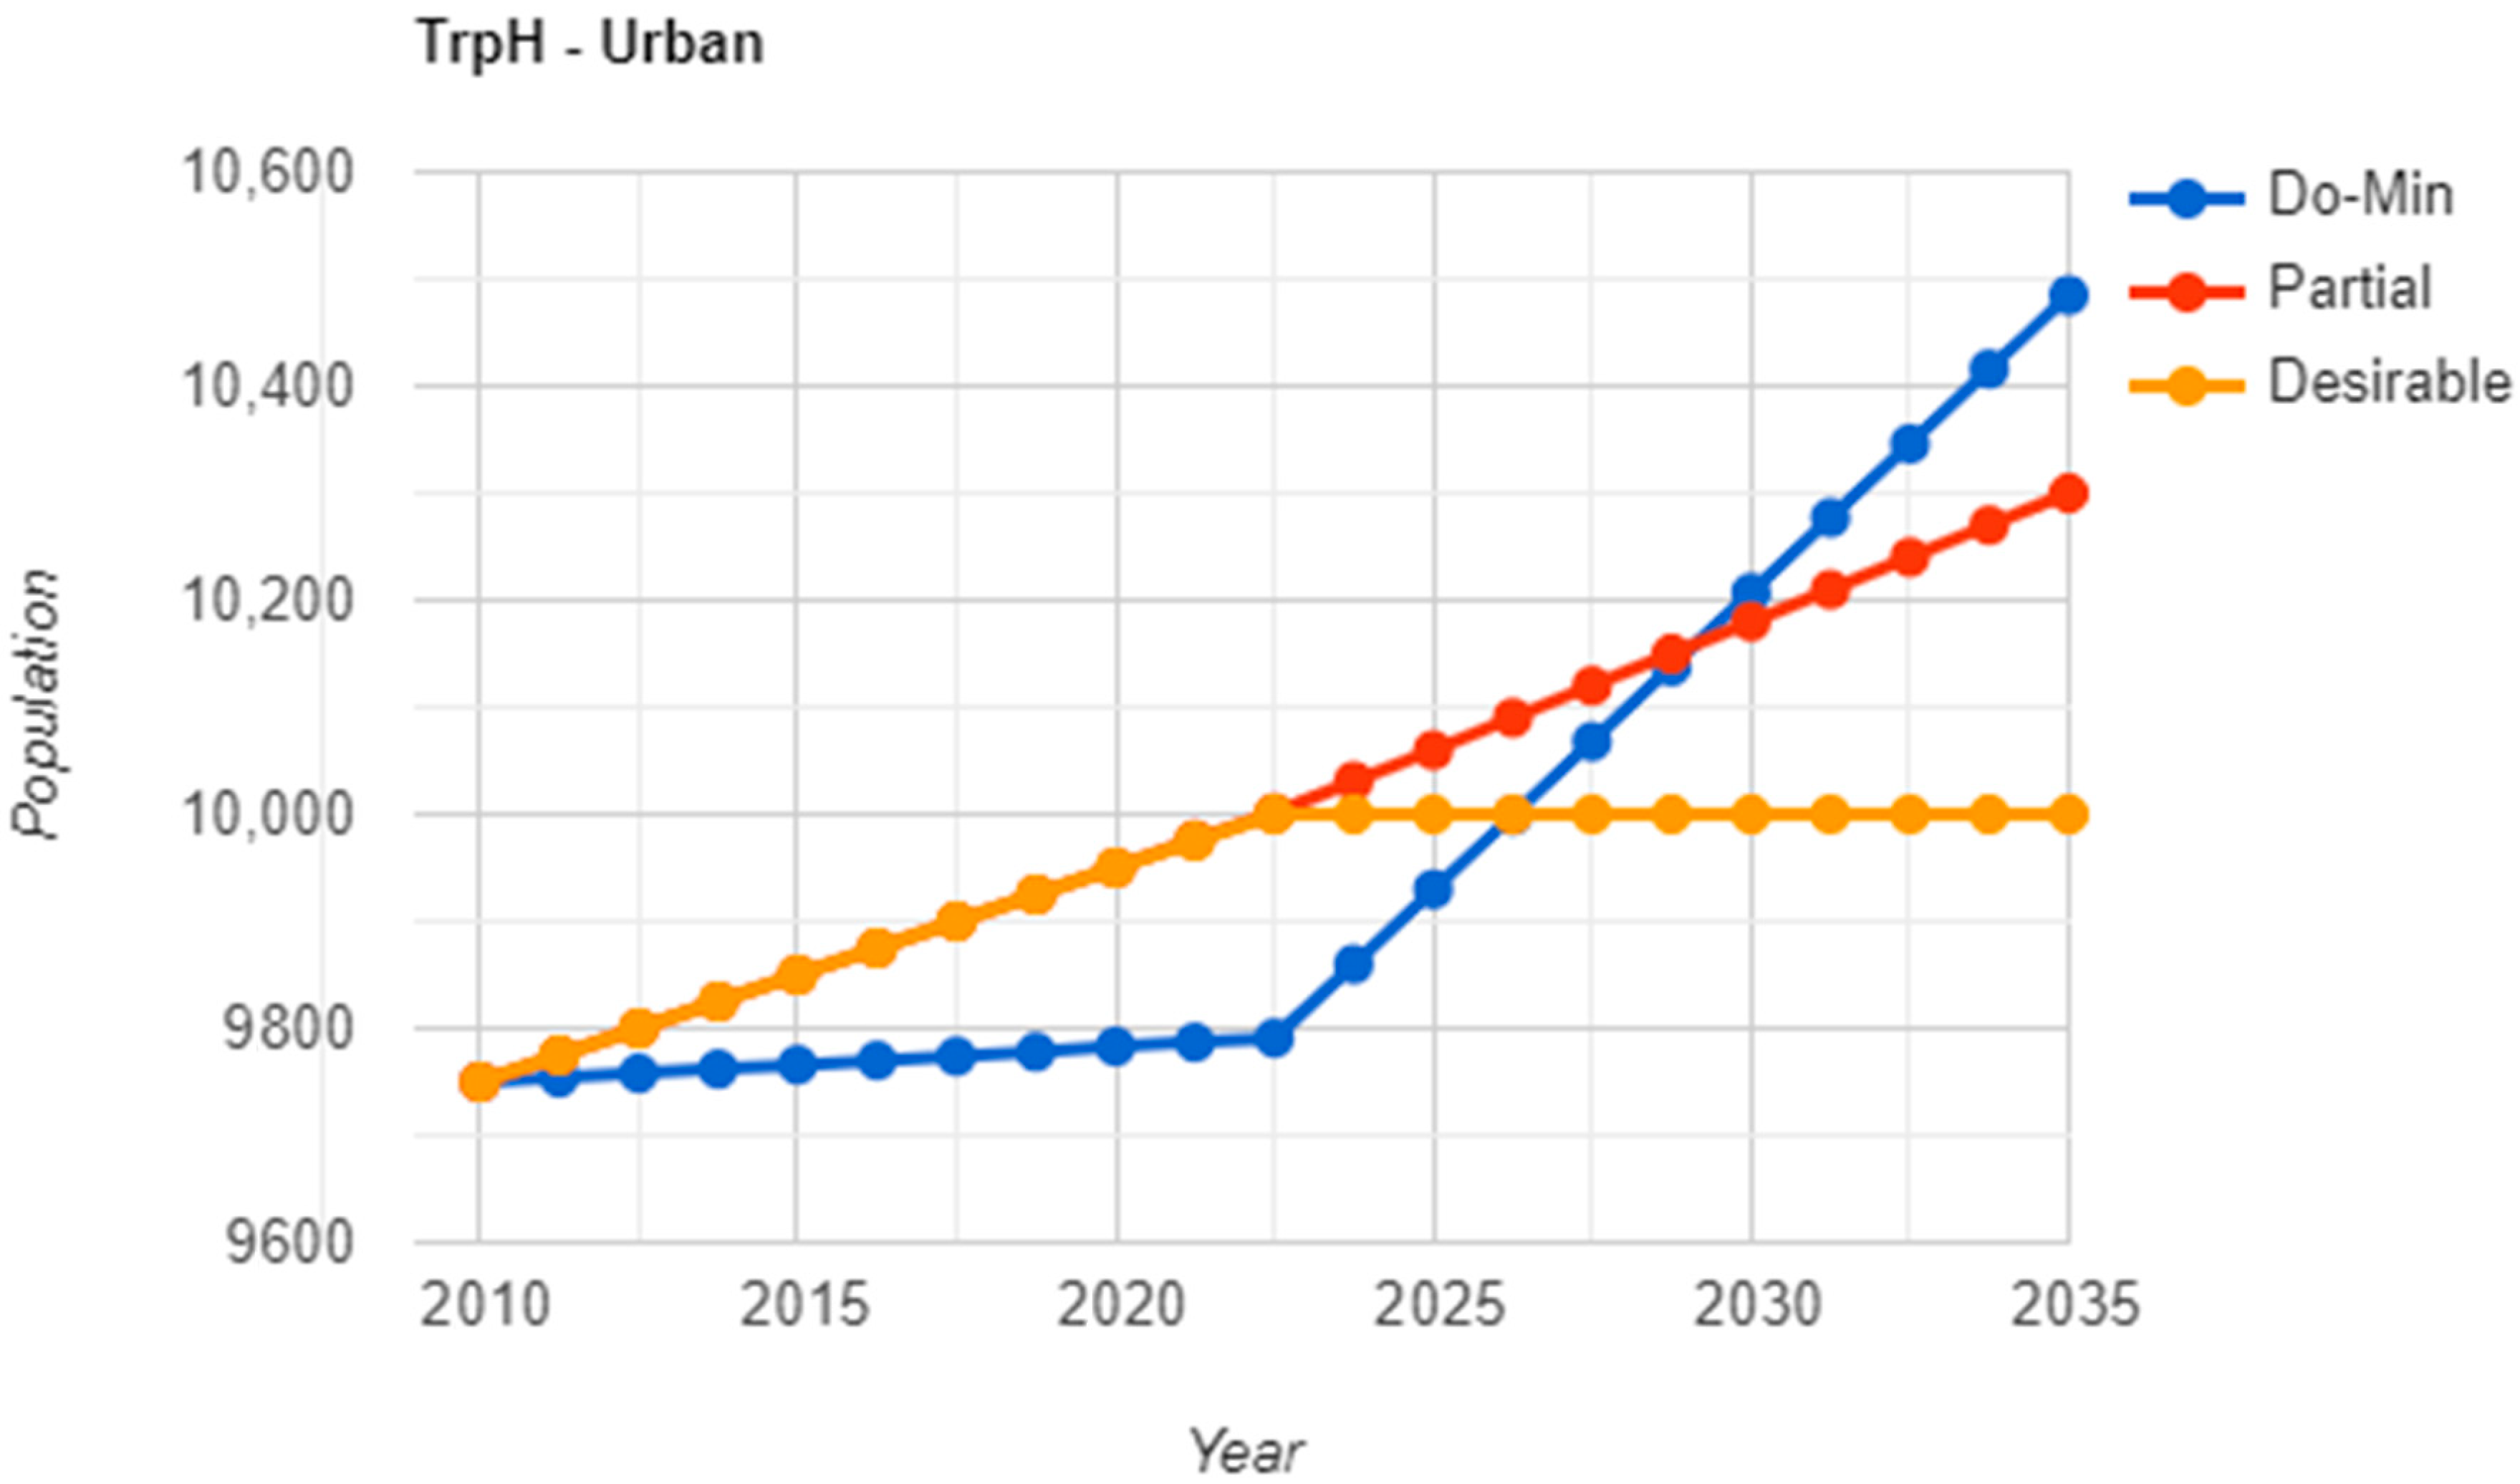
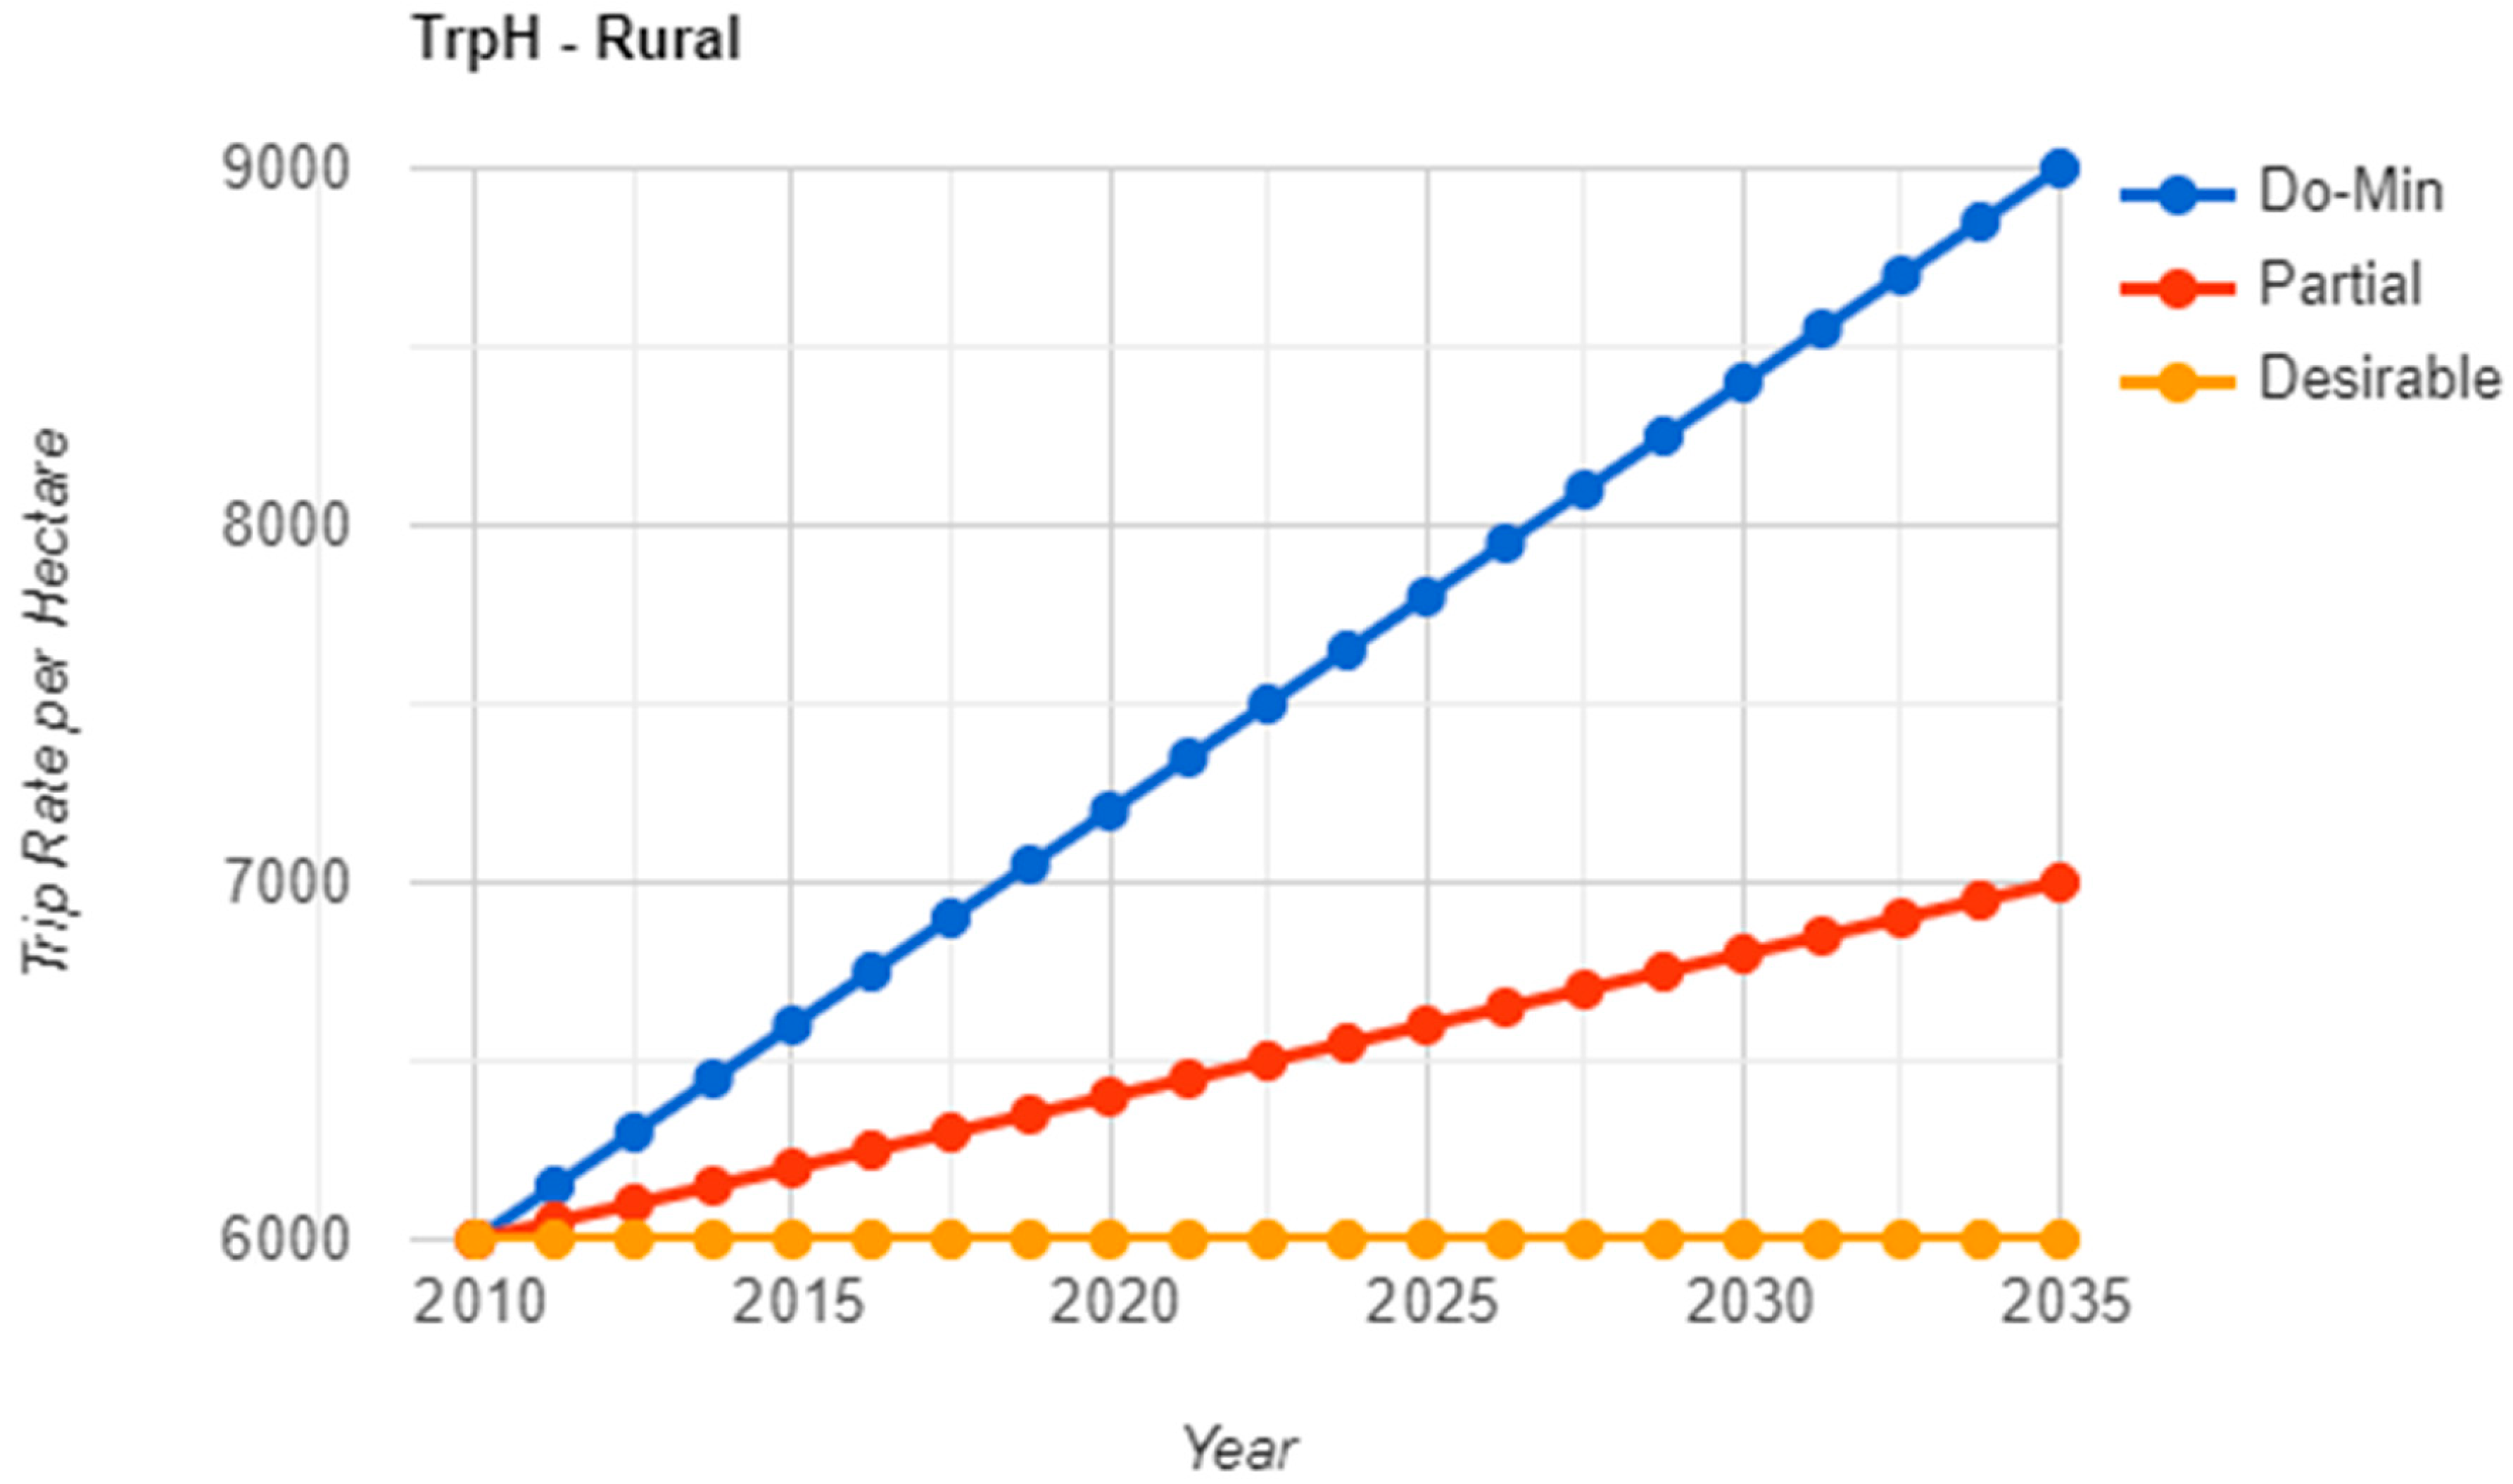
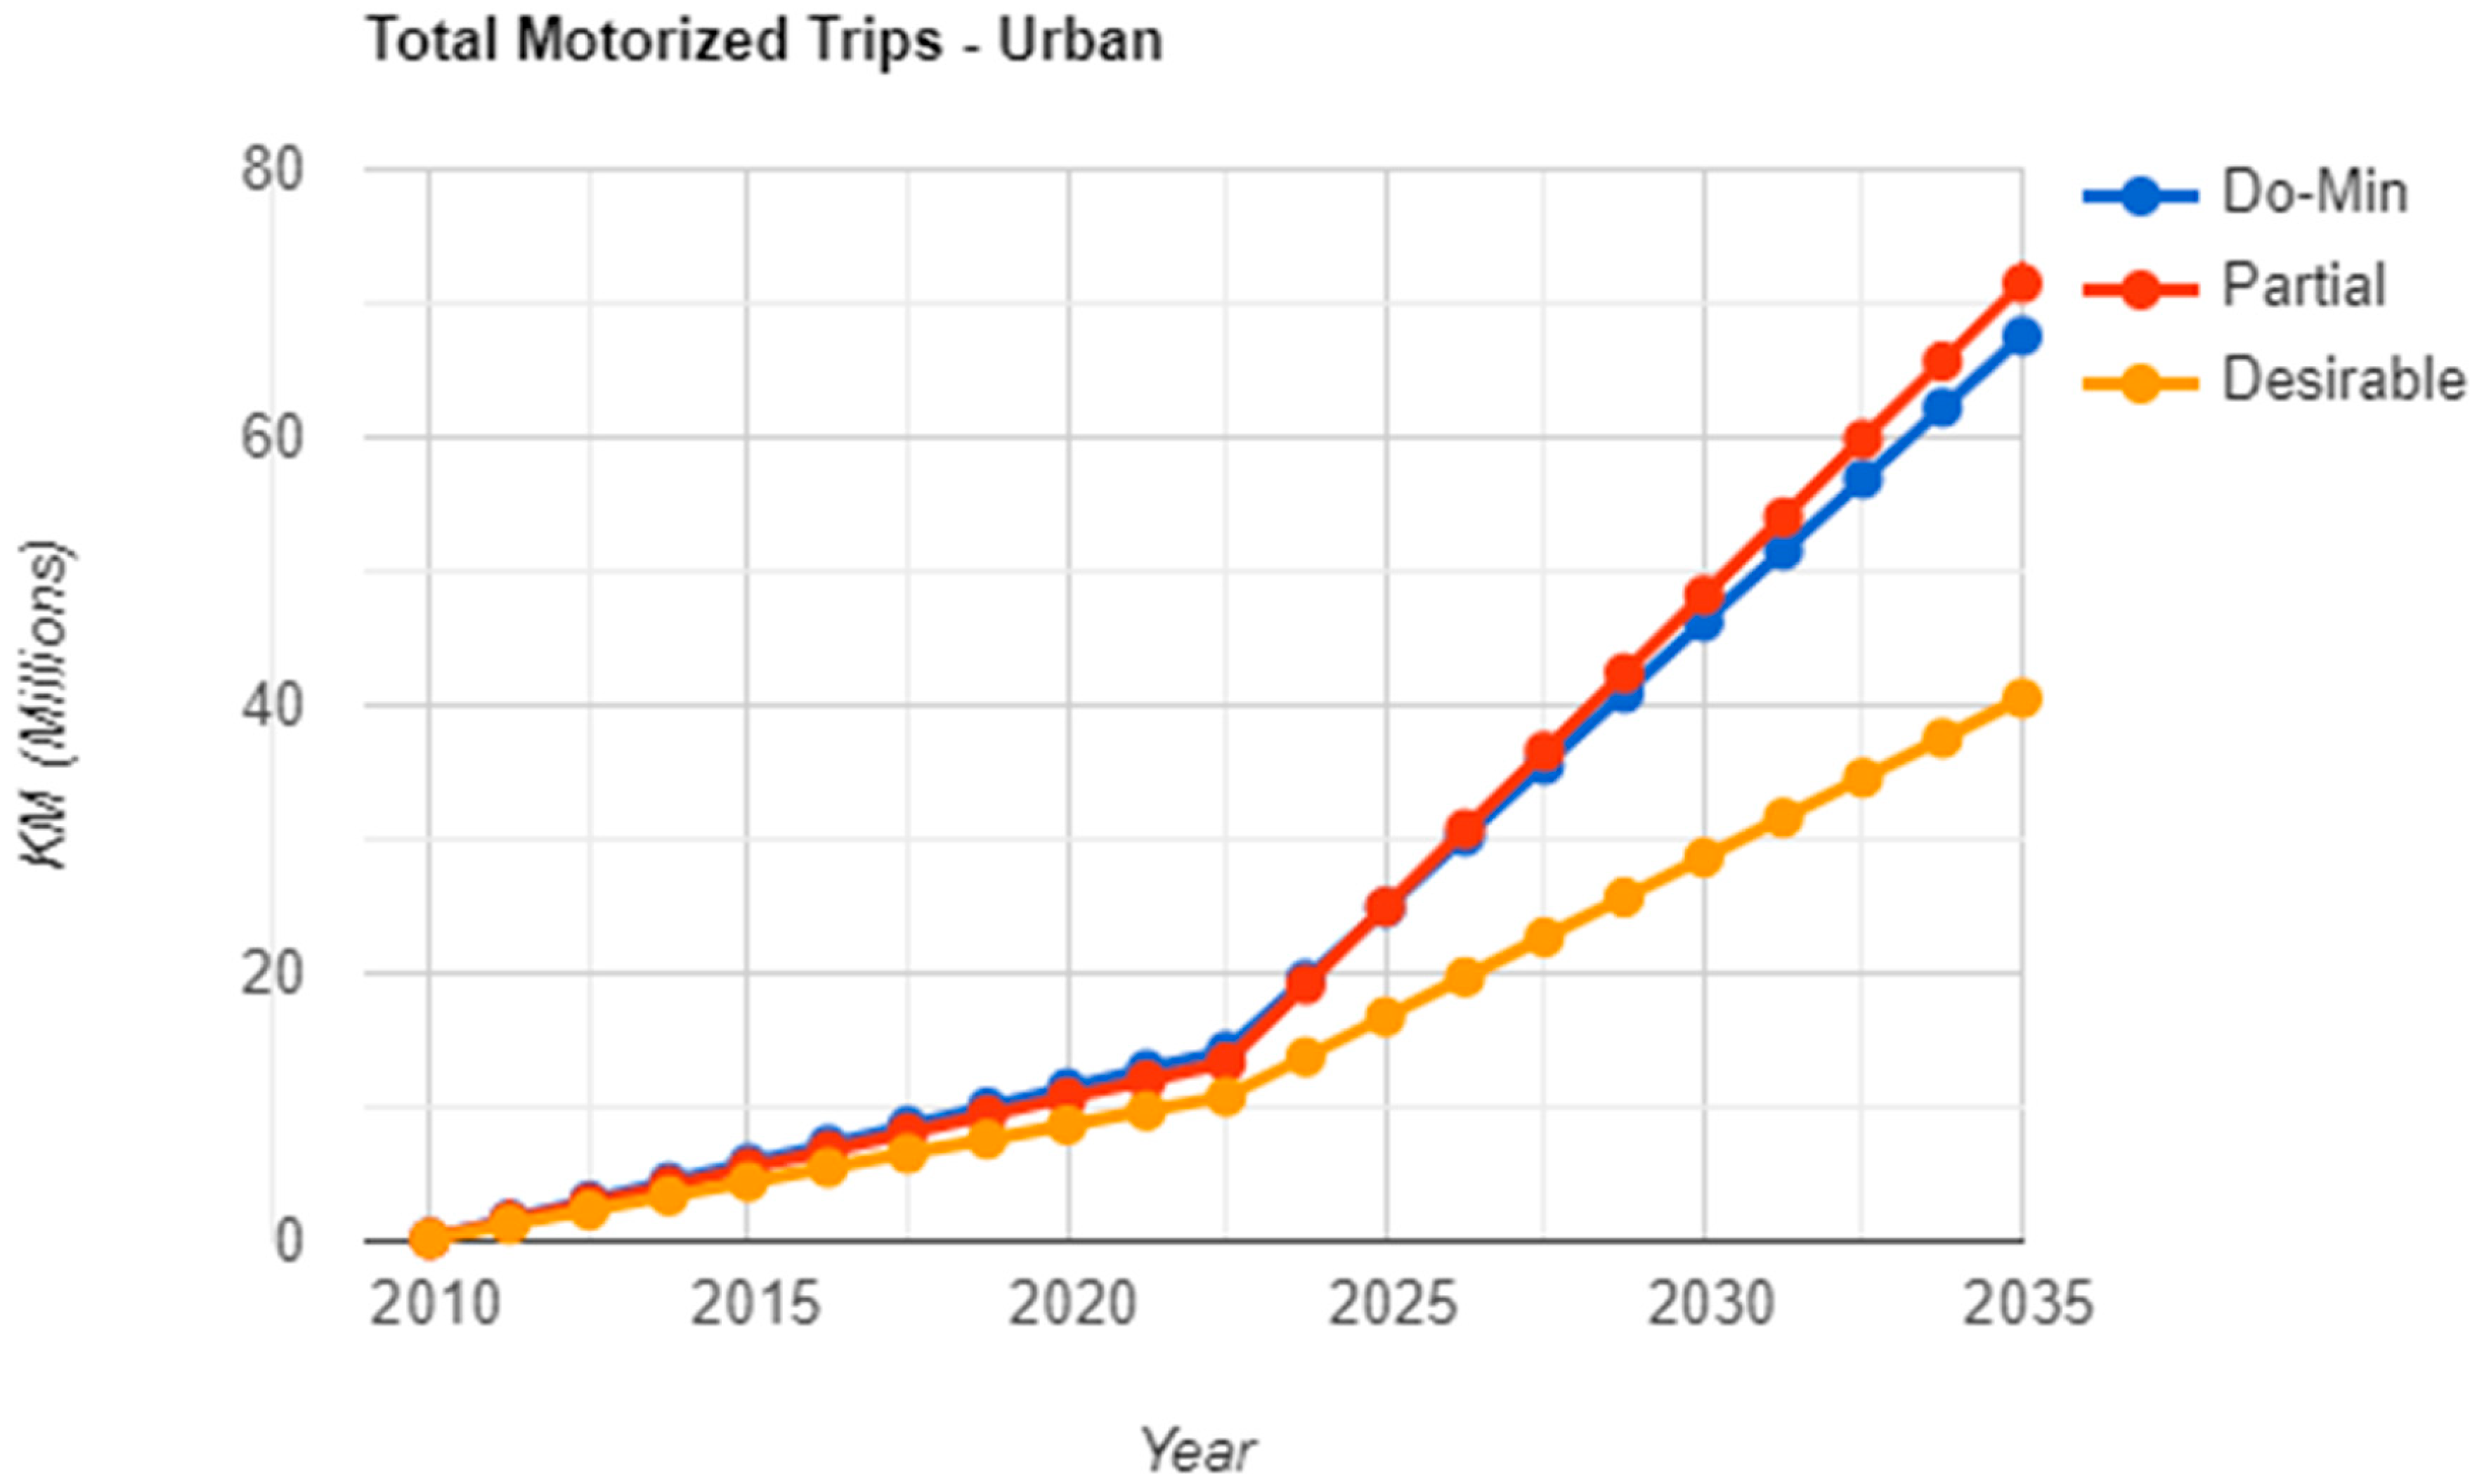
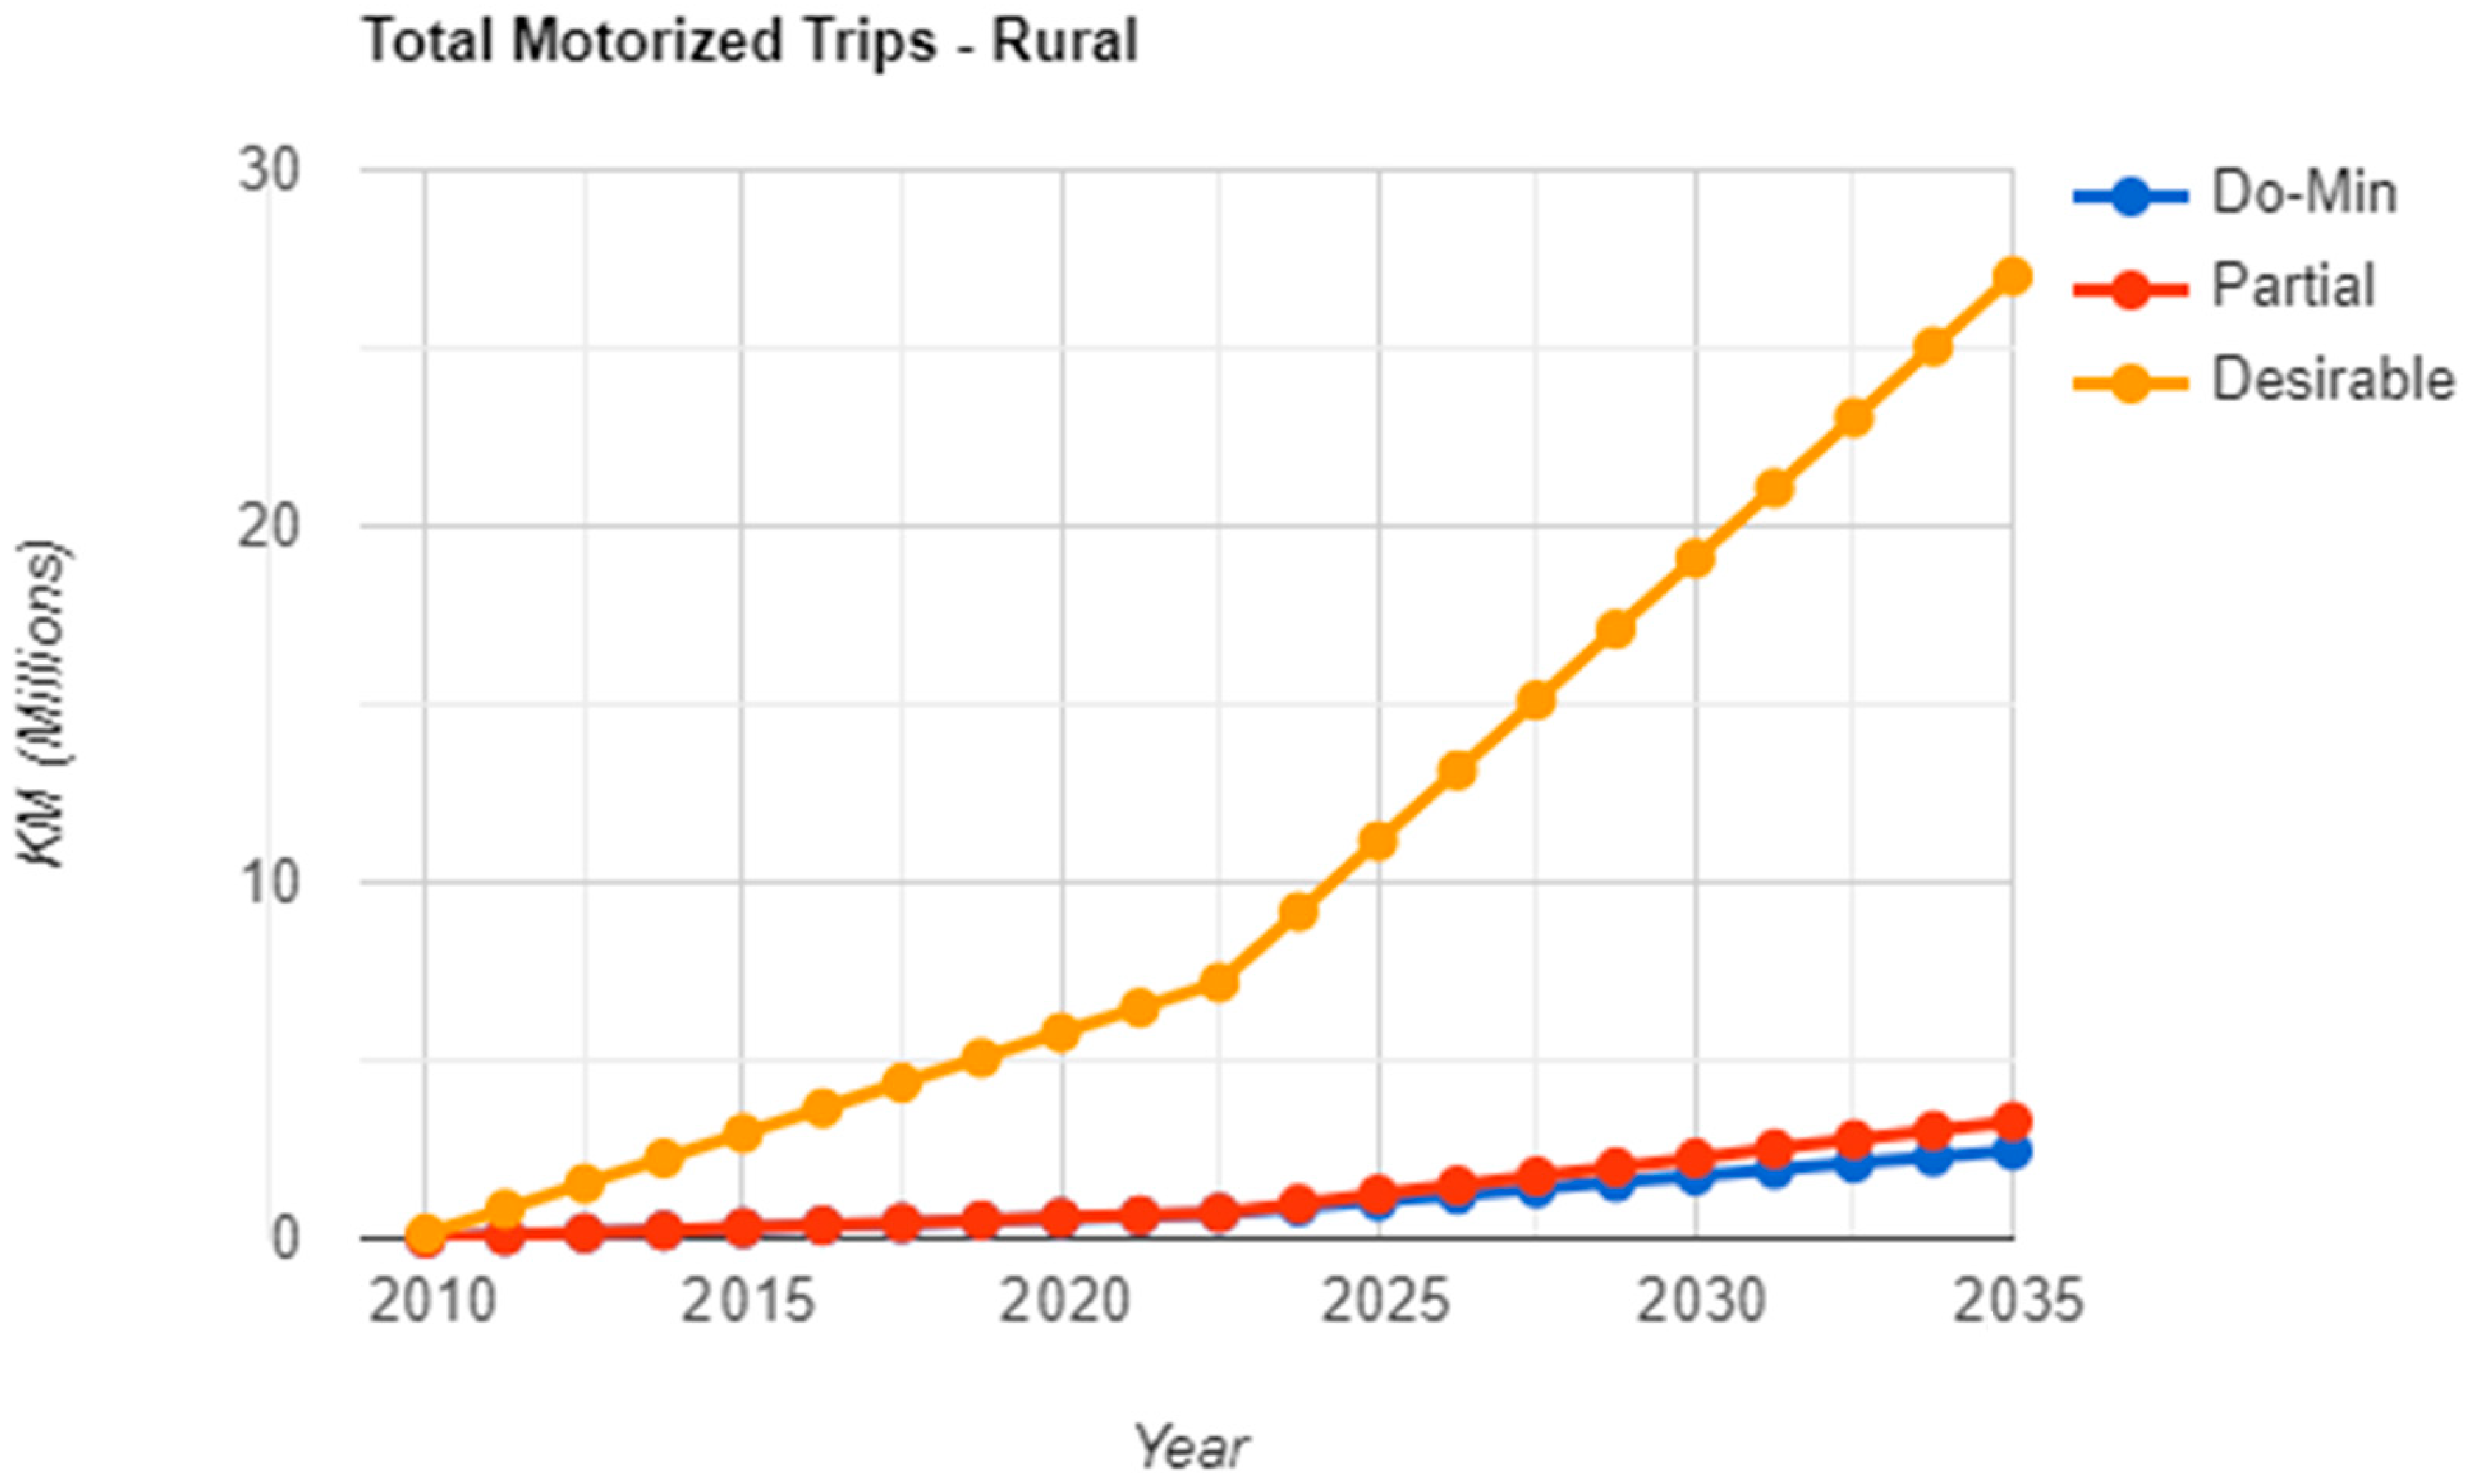
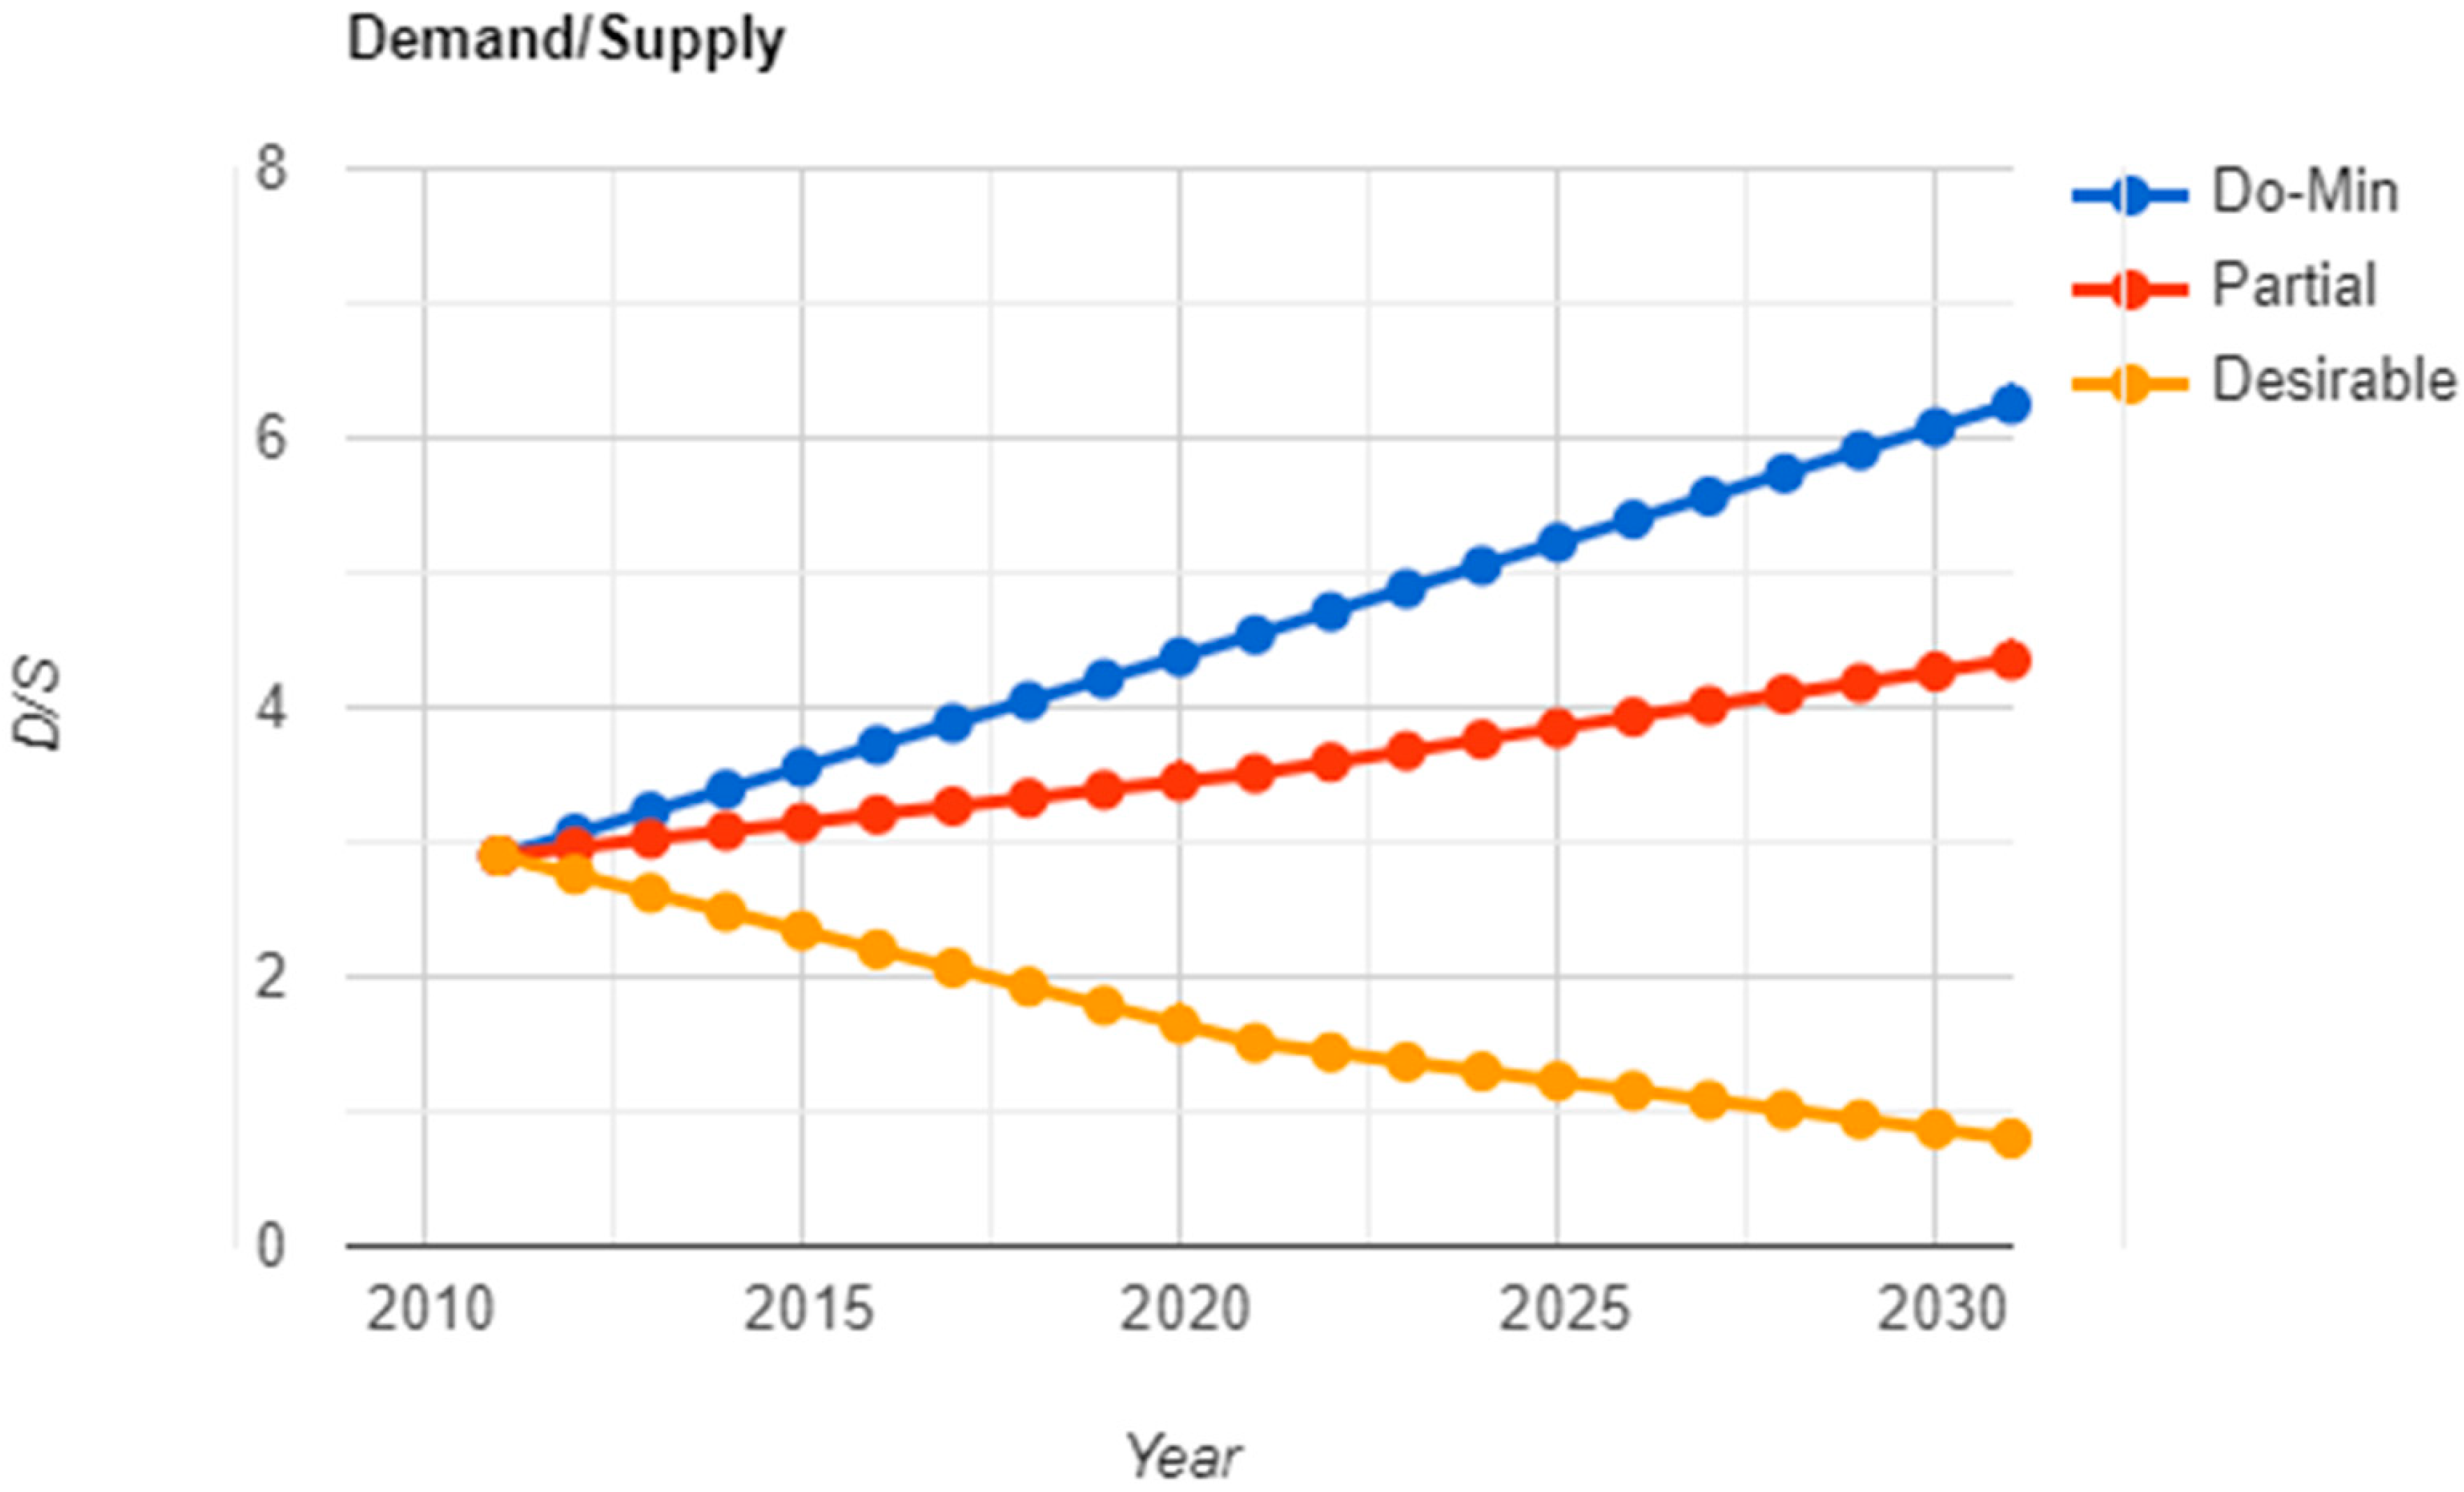
Three different scenarios were considered for predicting the variables for the years 2021 and 2031. They are do minimum (Do-Min), partial, and desirable. The parameters measured were the population growth, land use, etc.
In the Do-Min scenario, the existing trend was allowed to continue with no novel innovations or implementations. With the current trend, the various parameters, such as land use and population, were measured. The next scenario was known as partial, where 50% of the new proposals were assumed to be implemented soon. The proposed desirable scenario simulated the implementation of all the proposals, and the perspective parameters were measured for the future. In the desirable method, the population density was maintained at 500 people per hectare based on the holding capacity of each region. The parameters for birth rate, death rate, in migration rate and out migration rate are shown in
Table 3.
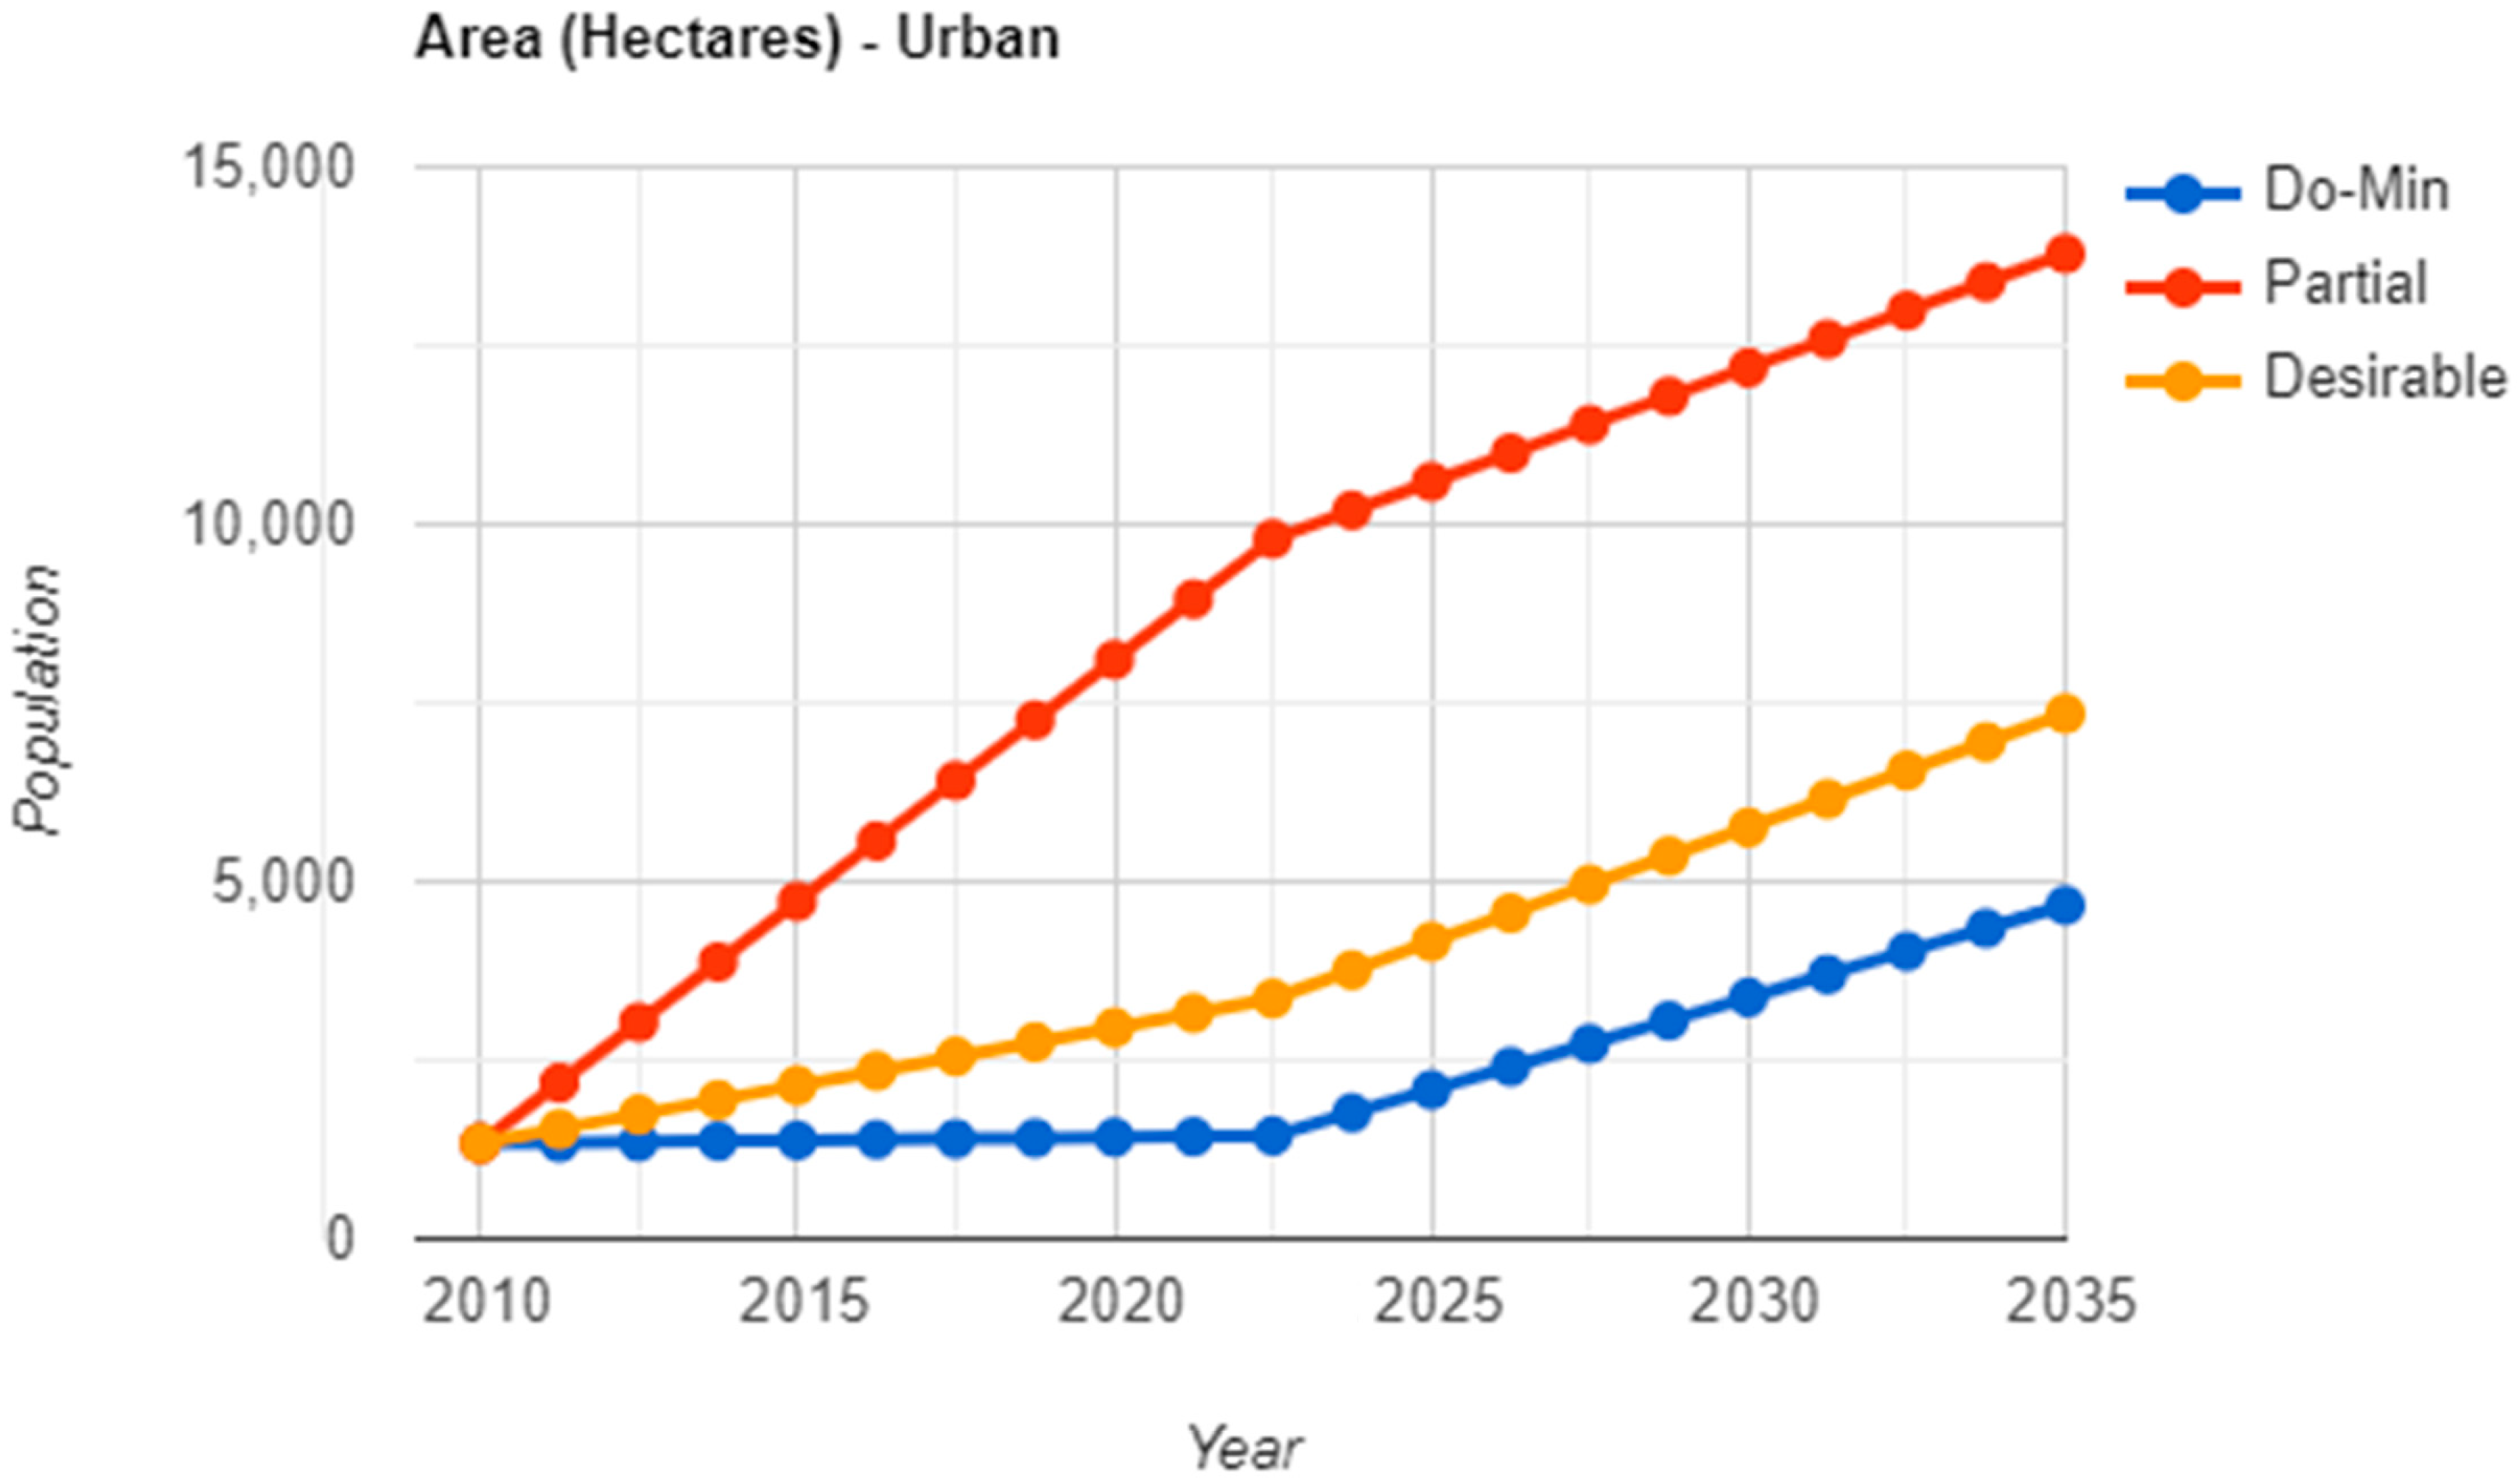
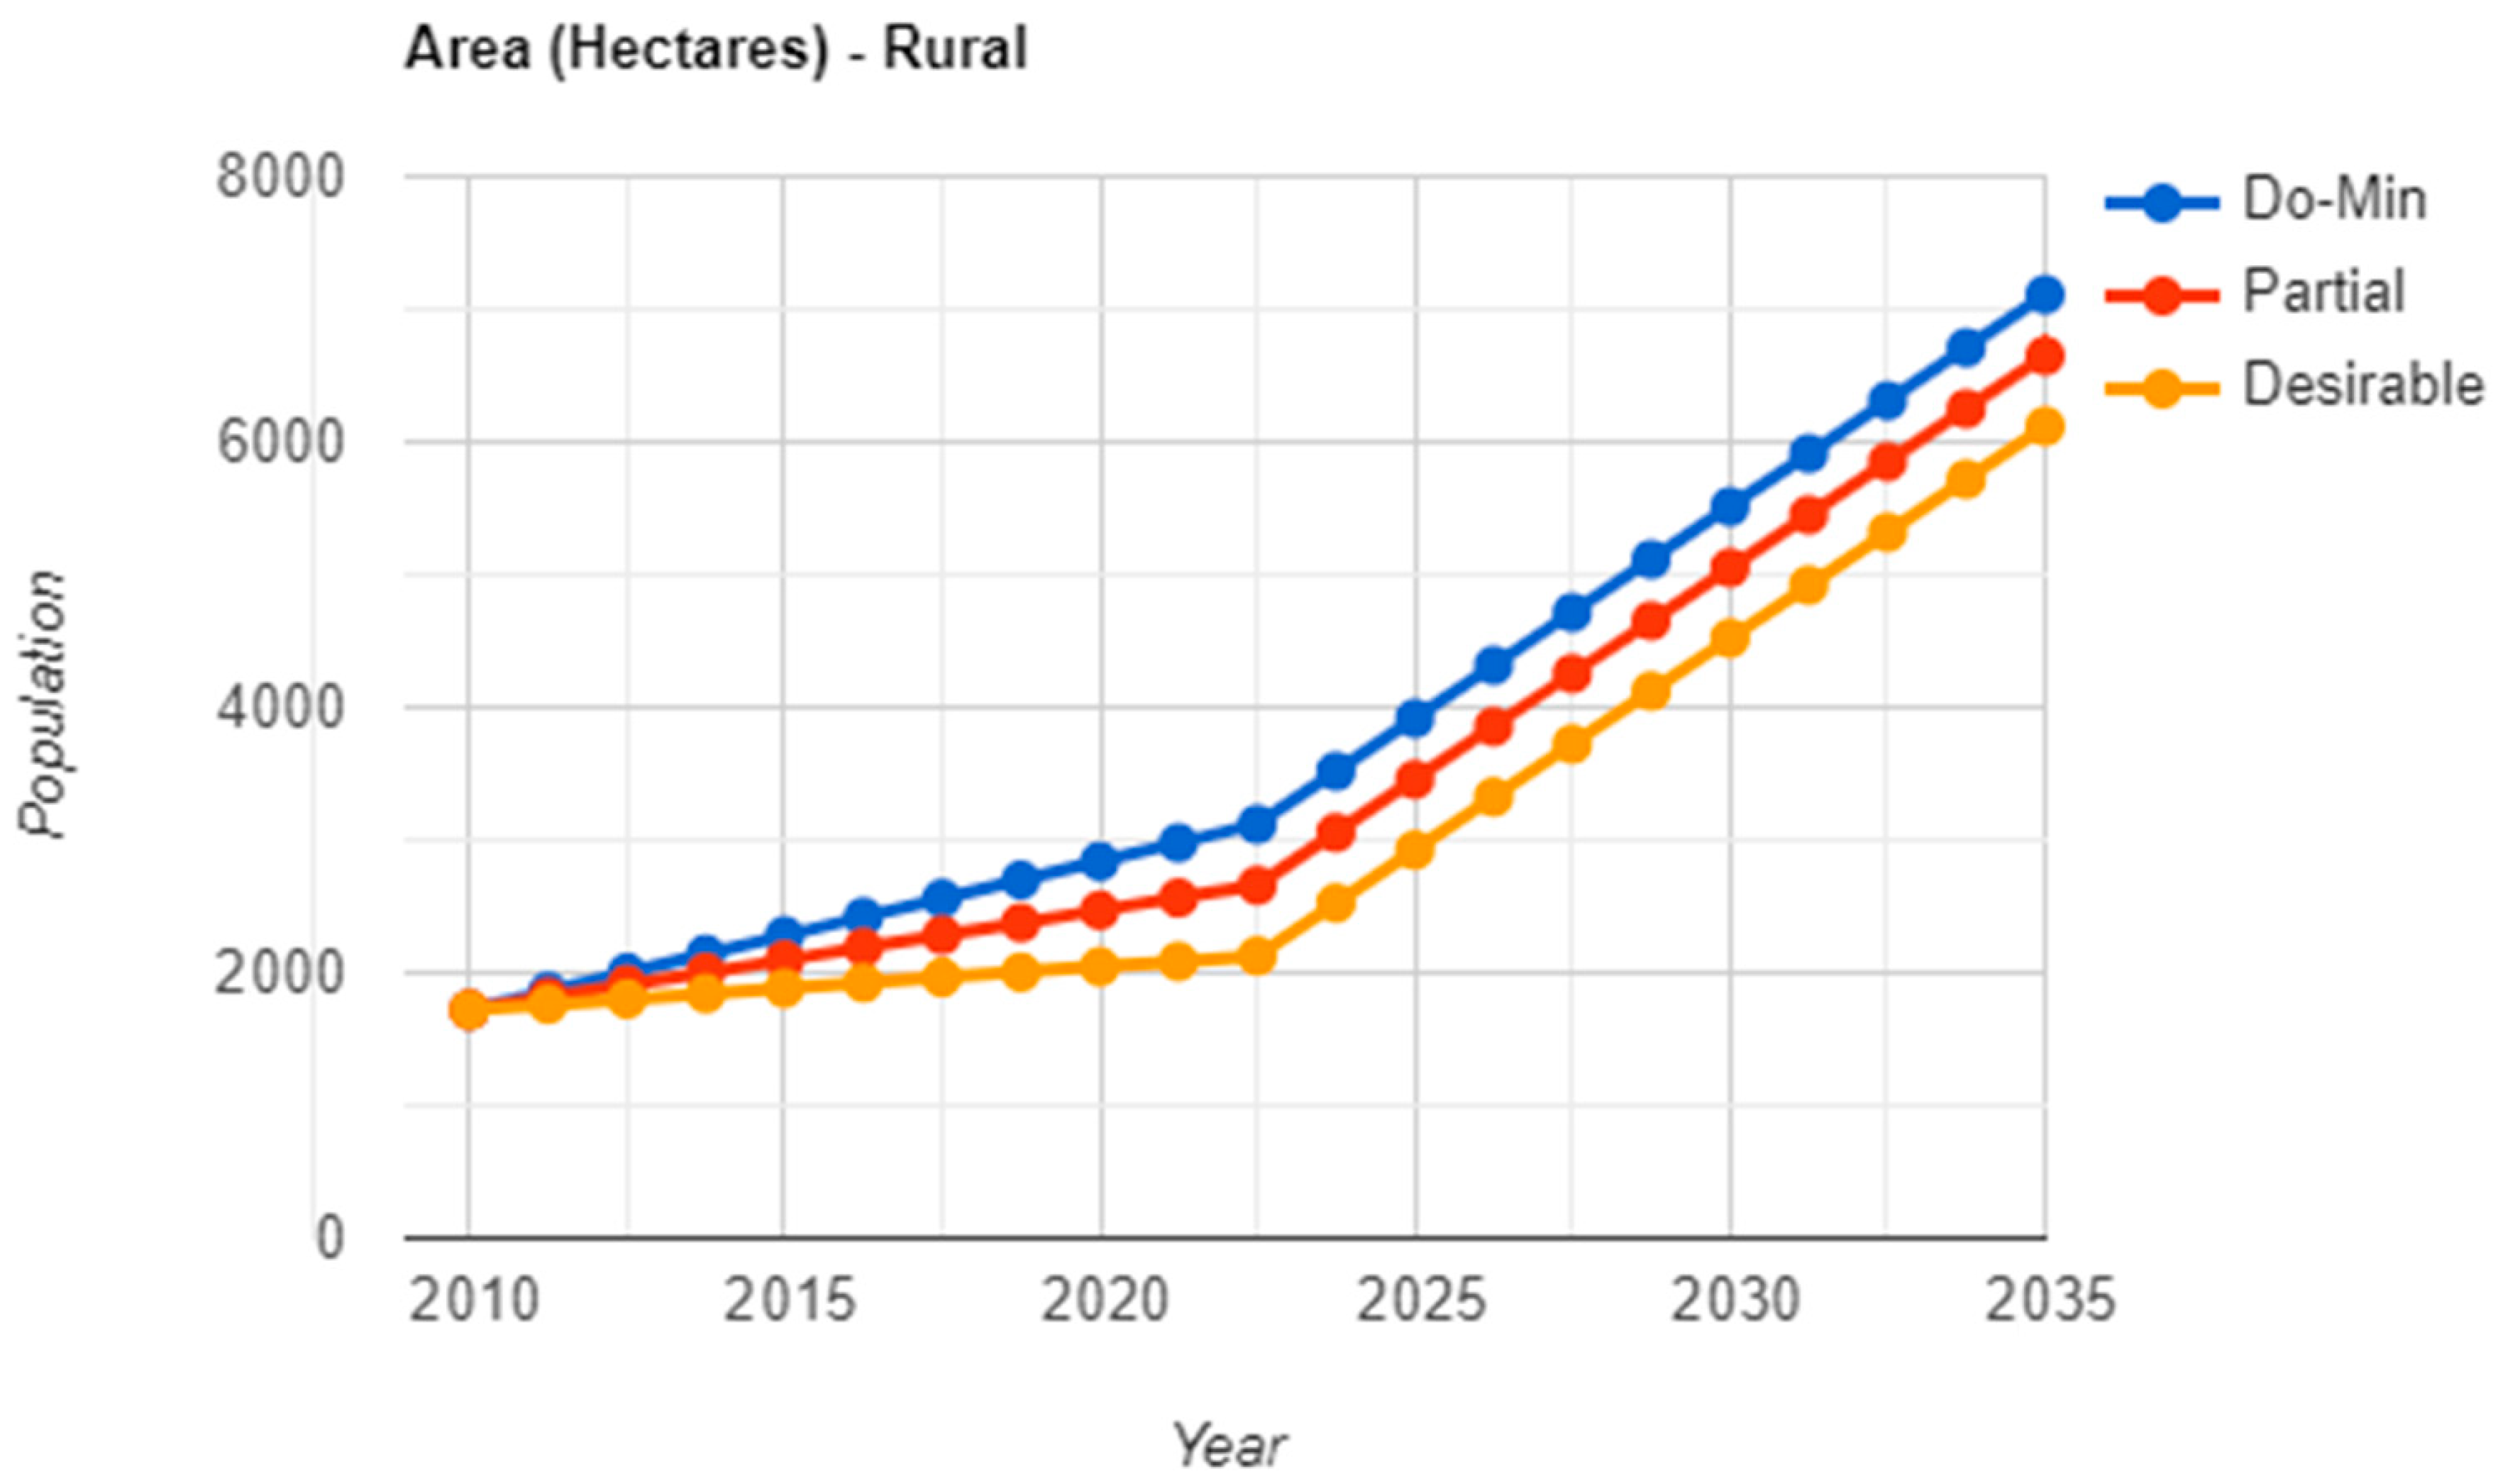
The floor space index (FSI) was fully developed and fixed at 2.5. Land growth was considered only horizontally for Do-Min, while both vertical and horizontal spread was considered for the other two scenarios, as shown in
Table 4.
In the transport sector, an elevated corridor was proposed in the study area along the OMR to increased capacity; simultaneously, public transport usage was doubled, and private Transport was reduced by 50%. In the desirable scenario, the incorporated elevated corridor increased demand for public transport through the introduction of metro and monorail, and reducing the private vehicle usage in a phase-wise manner. The desired split up for the three scenarios is shown in
Table 5. Per capita trip rate (PCTR) for the Do-Min, partial and desirable scenarios were 1.2, 2.5 and 3, respectively. The capacity of the roads, as per the Indian Road Congress (IRC), was considered and implemented, with 5400 m for the Do-Min. An additional elevated road was added in the partial scenario, increasing capacity to 2400 m. In the desirable scenario, around 1200 m of existing roads were widened, thereby increasing the total road capacity.
6. Conclusions
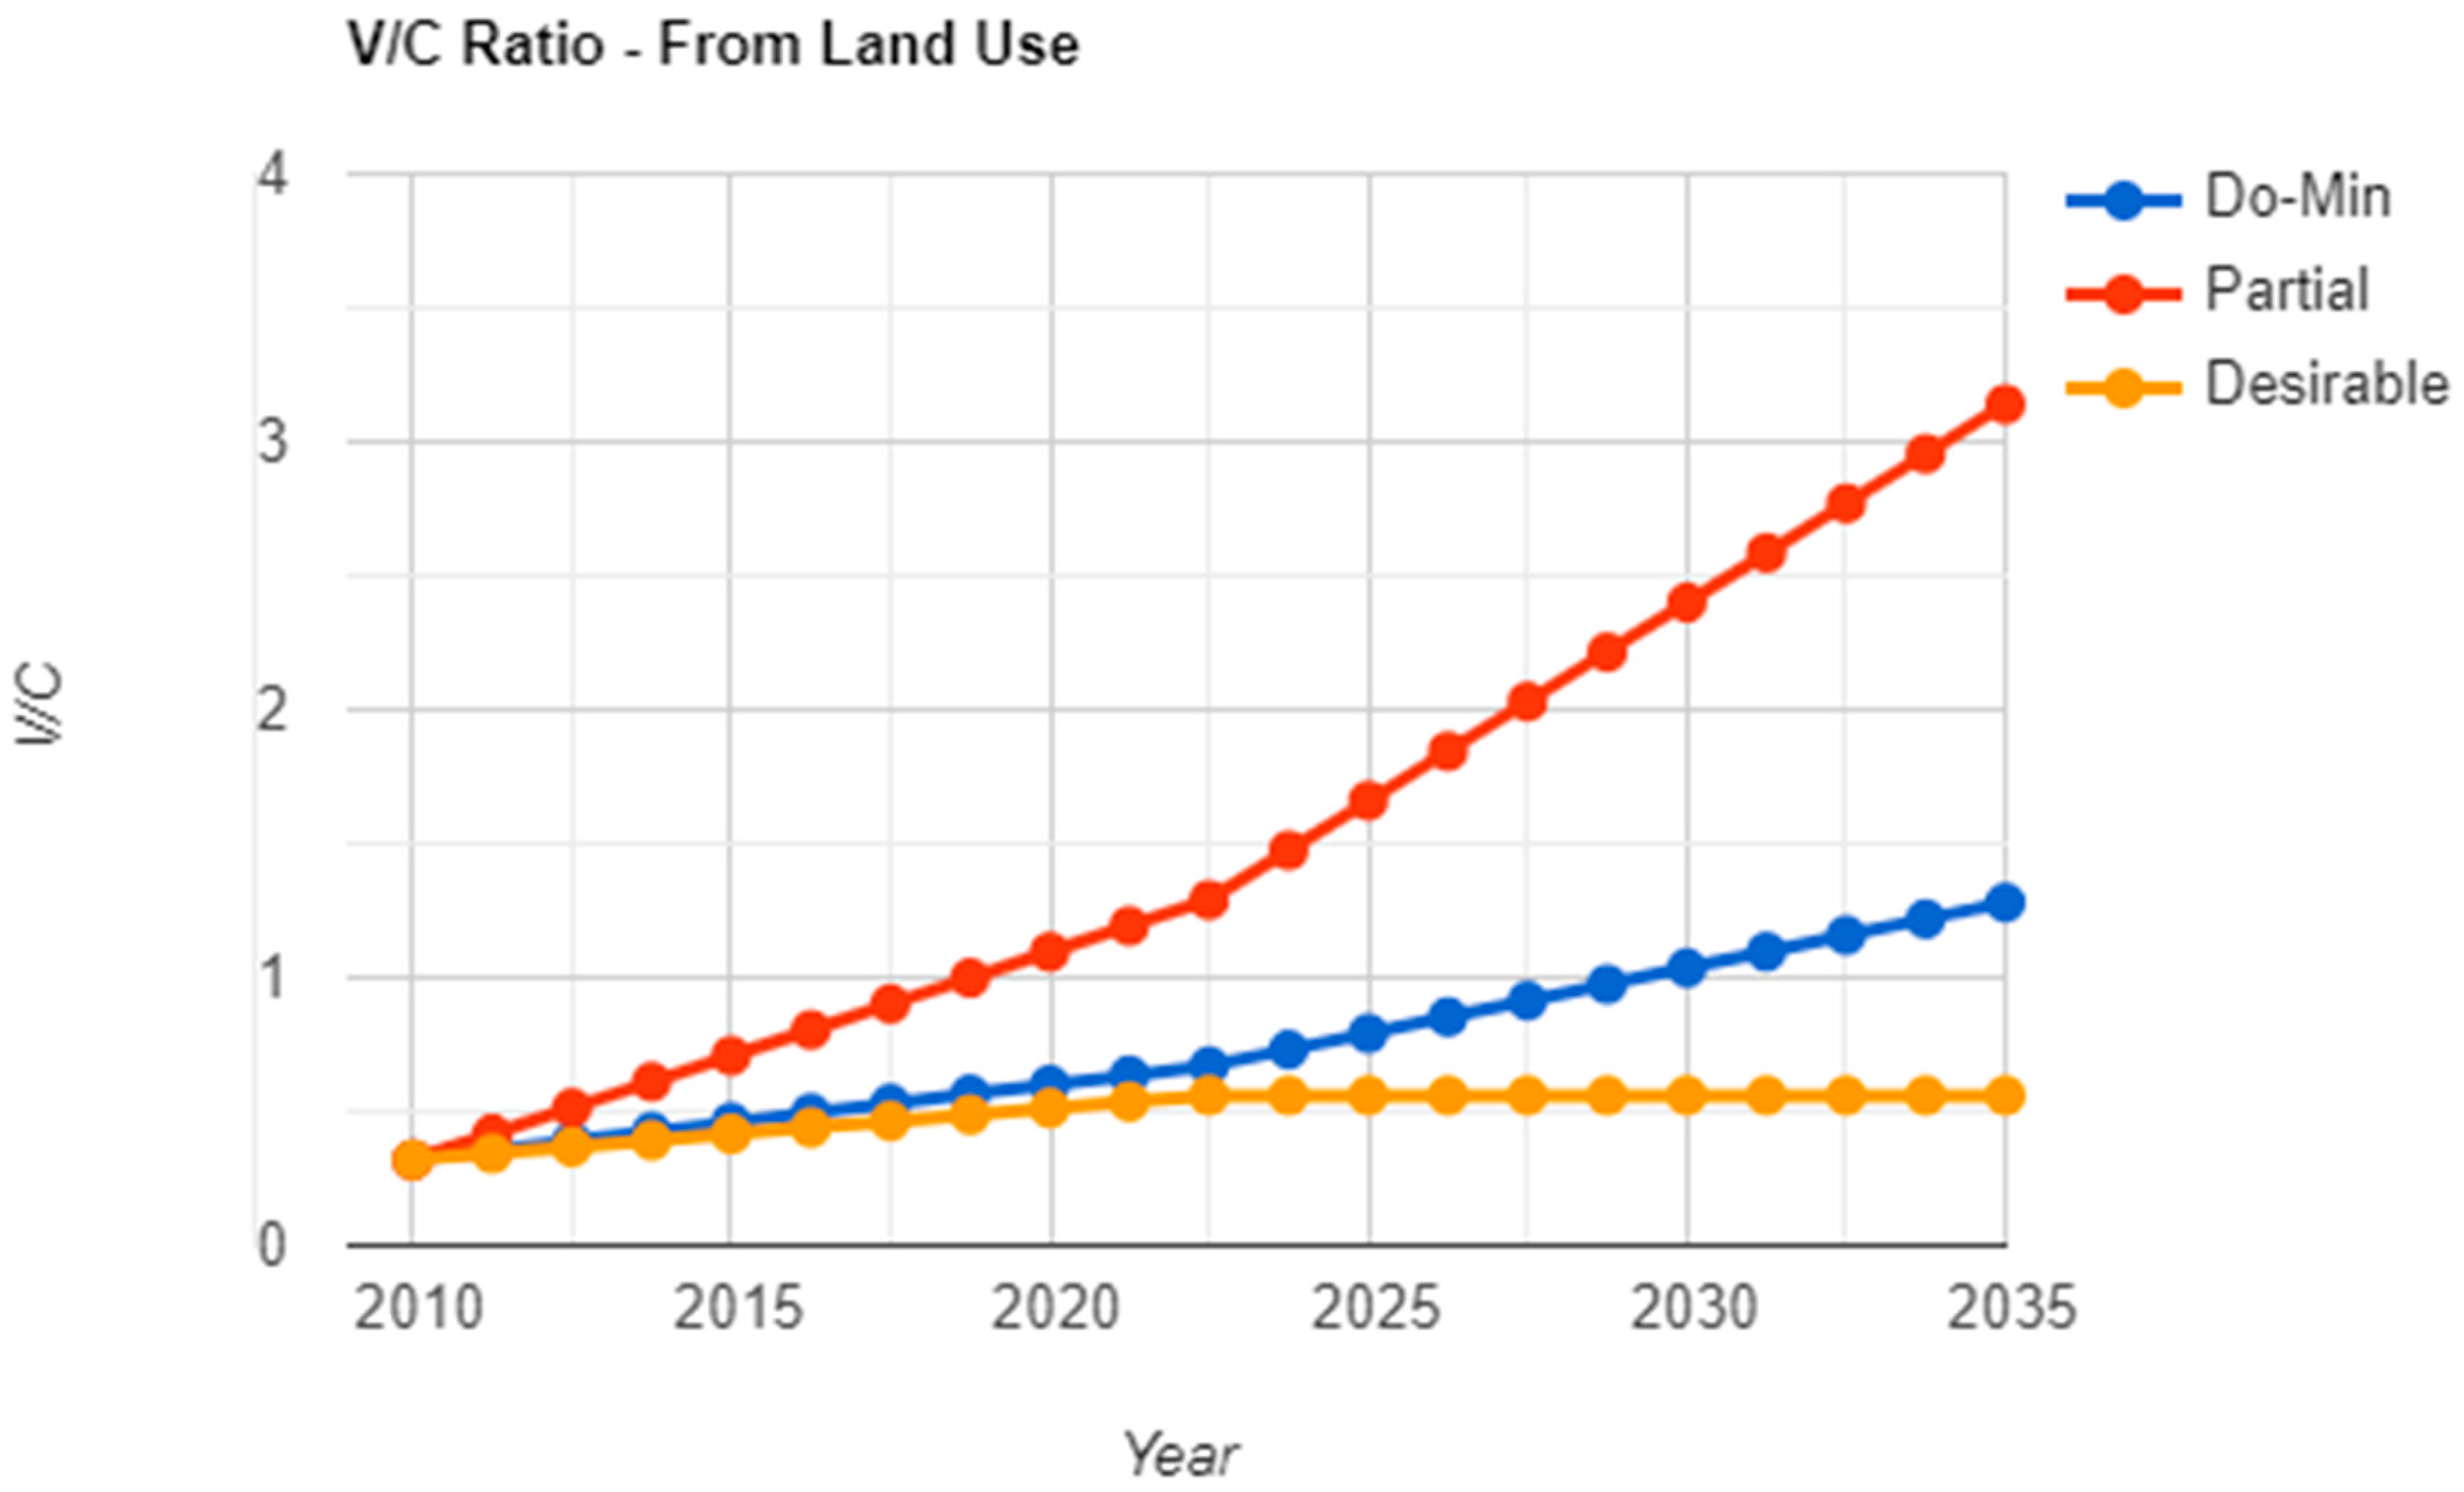
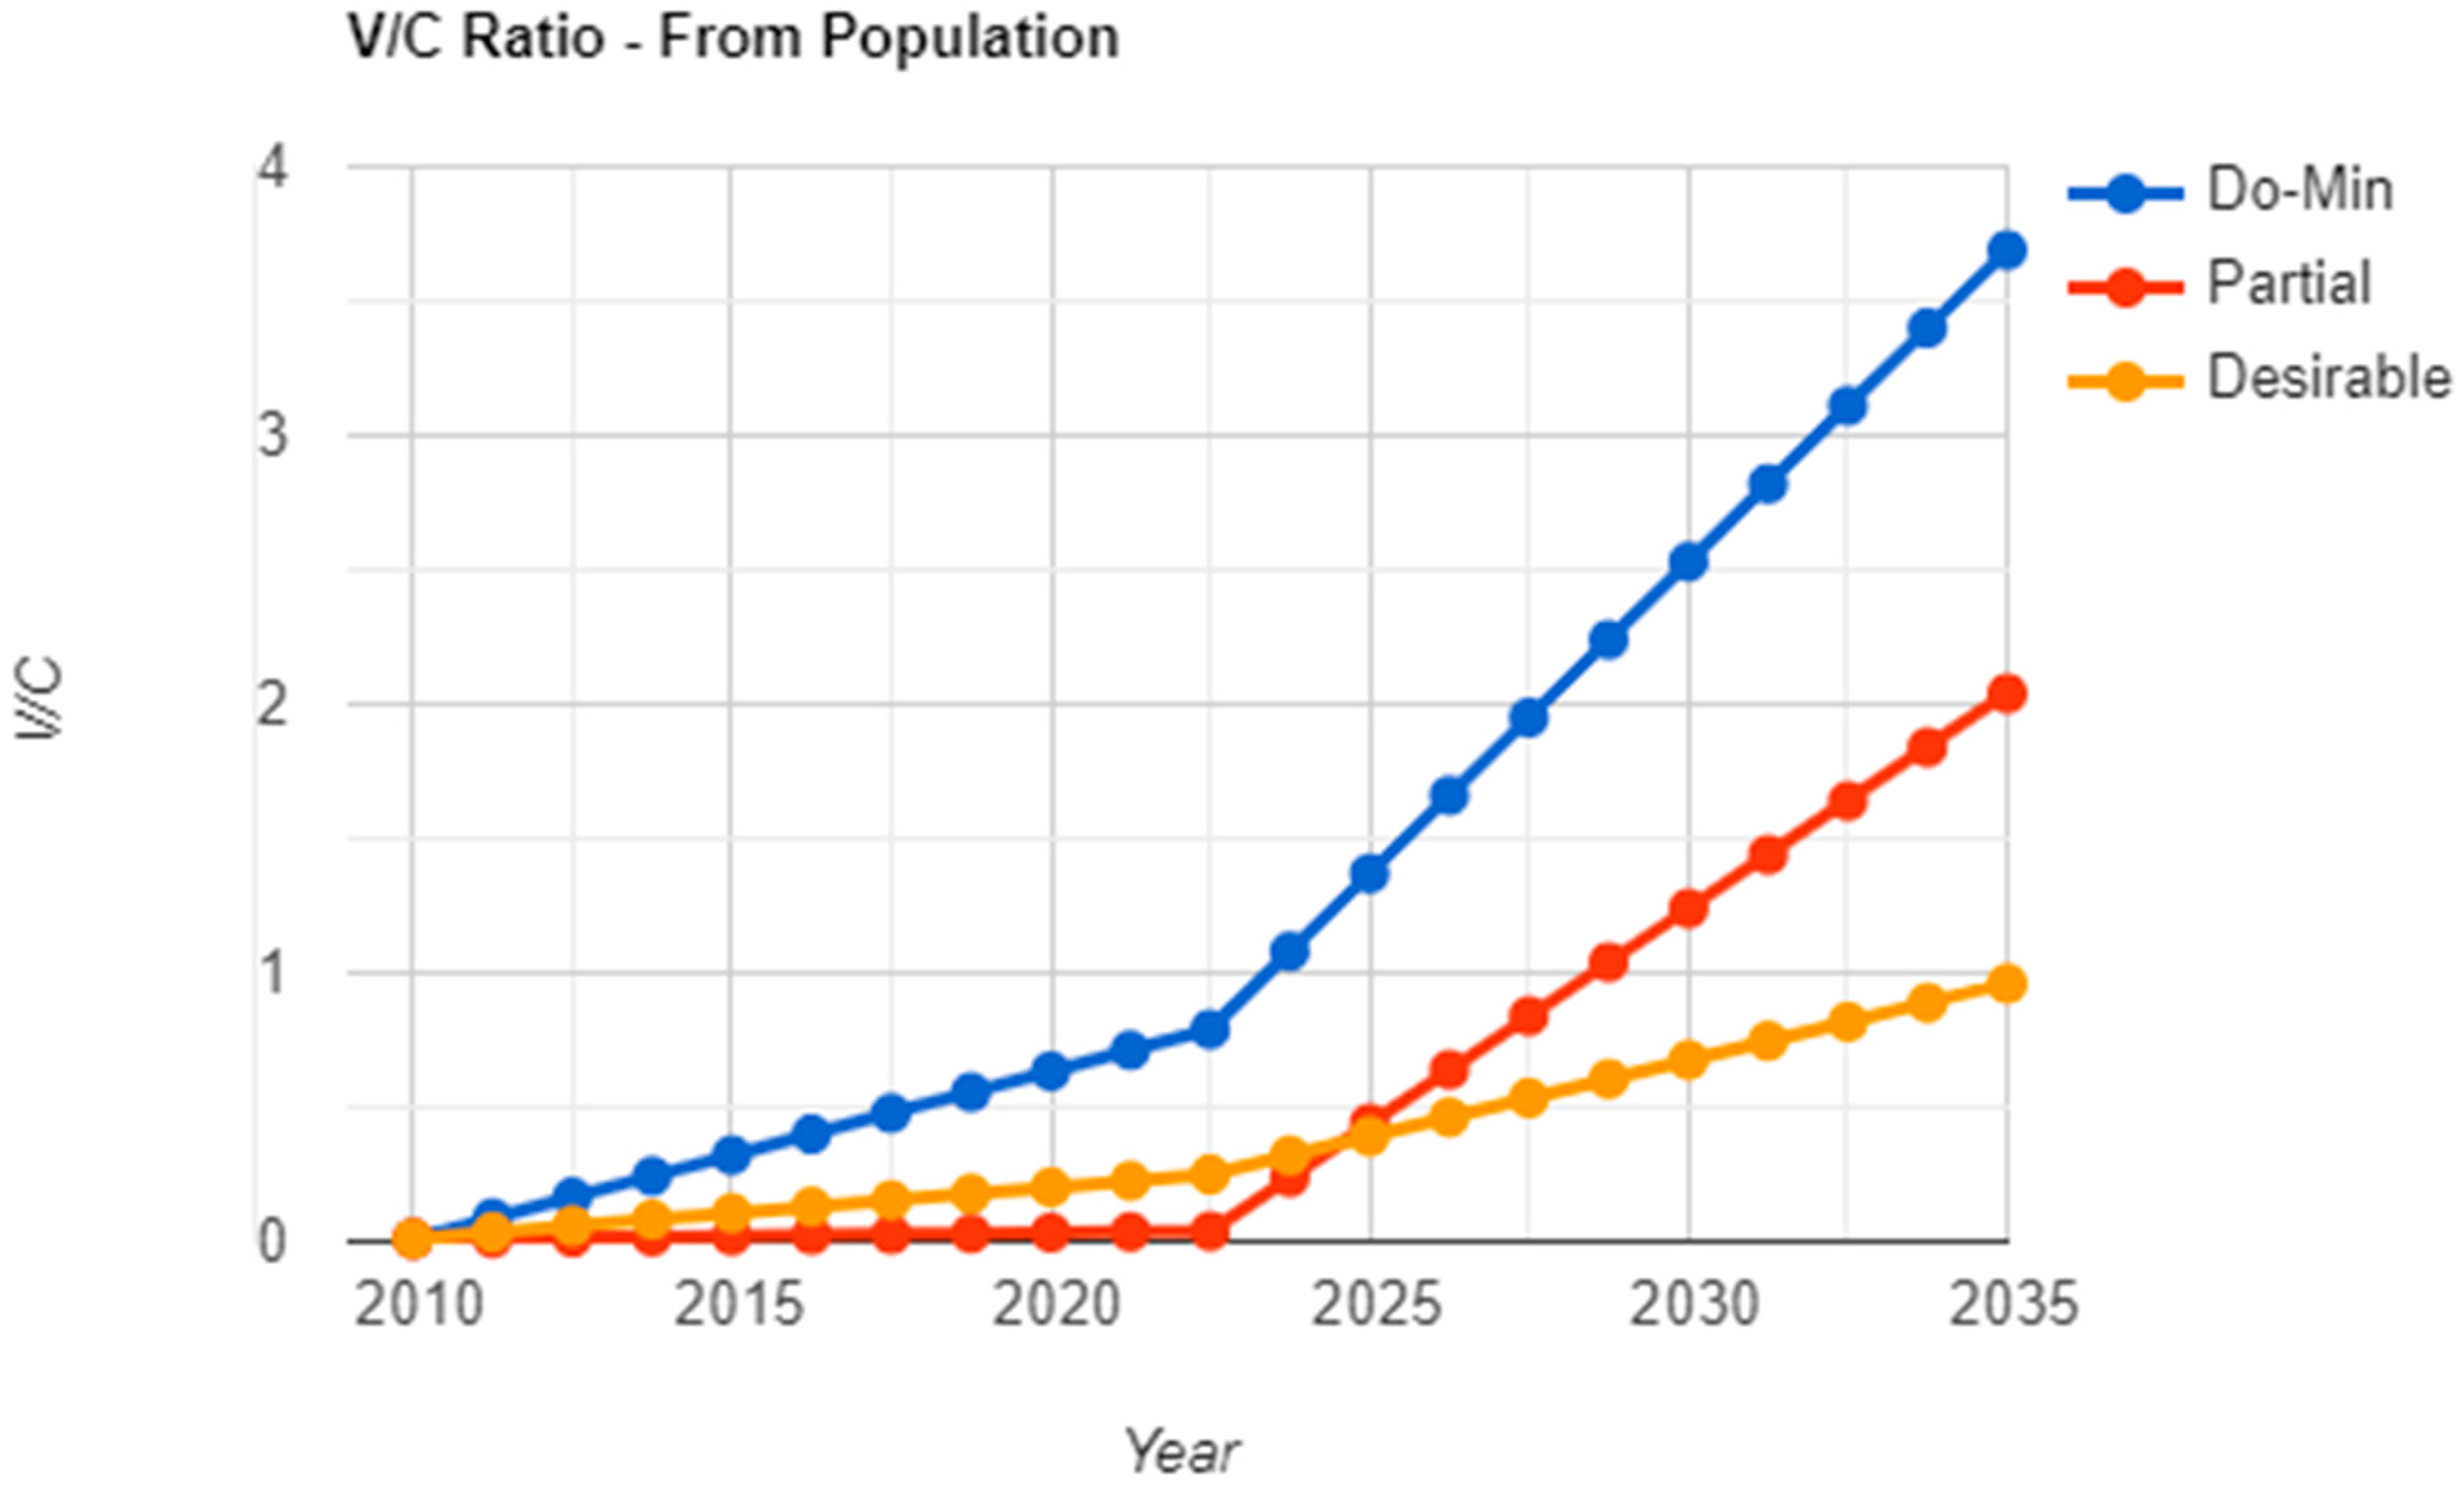
In this paper, different parameters, such as population, land use, trip rate, V/C, and demand/supply, were simulated for three different years: 2011, 2021, and 2031. Three different scenarios were simulated: Do-Min, which is based on the continuing of existing trends; Partial, in which some proposals are implemented, and; desirable, in which all the proposals are implemented. The simulation was performed using the Stella simulation tool; from the results, it is identified that the desirable model would be highly effective in controlling the population and other parameters.
In the land use sector, a desirable density is achieved by restricting the population growth trend and augmenting the intensification of land use. The V/C ratio has an average difference of between 1 and 1.5. With respect to transportation, the growth of private transport is reduced by introducing better public transportation facilities. The novelty in this work is that the trips per day measure is calculated differently, which gives more accurate results than the existing methods. This work has taken the vertical development of the residential buildings into consideration, along with the TRpH. These variables are used as parameters for the calculation; these variables predict the traffic volume in the future and enable informed planning for future traffic demand. The outcomes of implementing the desirable scenario would greatly improve transportation and land quality in the region.
Future congestion can be reduced or avoided completely by improving the quality of life (QOL) of local people. Since most the new Chennai residents migrate from the rural areas, the desirable scenario suggests that decentralized development could improve all regions equally, thereby slowing down the migration to Chennai. The other reason for the movement to Chennai is the adequacy of investment in other cities. Hence, if the other cities became a focus for investment, migrants would increasingly migrate to their nearest cities, rather than to Chennai. From the research, it is seen that the proposed desirable model would be highly effective in controlling the population and other parameters if implemented in real life. This research would also help researchers to analyze the traffic situation in the future, and make improvements to ease urbanization-related issues. If the desirable scenario is followed in real-time, it would resolve future problems that may arise from traffic congestion in Chennai.


