1. Introduction
High-quality education requires both the education system and students to meet high standards. Philosophers often offer guidelines and benchmarks for enhancing performance and evaluating student knowledge assessments to meet these standards, but the current system still has deficiencies that need to be addressed [
1]. In addition to this, the systems still need to catch up. Therefore, researchers concluded that technology might be a significant component in analyzing the defects in the current system and why it lags. Additionally, technology facilitates decision-making by producing reports and graphs for analytical purposes [
2]. In this context, ML emerges as a cutting-edge methodology with several applications that can anticipate outcomes from data [
3]. The goal of ML approaches or educational data mining (EDM) is to model [
4], find important hidden patterns, and extract information that can be applied in educational situations [
5]. Additionally, ML techniques are used in the academic sector [
6] to represent a variety of student attributes as data points in big databases. By fulfilling various objectives, such as extracting patterns, anticipating behavior, or spotting trends [
3], these strategies can be helpful in a variety of sectors and can help educators deliver the most effective teaching methodologies and track and monitor their students’ development [
7].
The primary goal of ML is to foresee future scenarios or events that are unknown to computers [
8,
9,
10,
11]. Data mining (DM) and ML enable data processing, patterns, learning models, analyzing, scheduling, problem solving, predicting, and object manipulation. One of the critical benefits of ML is that it can finish difficult and time-consuming jobs, freeing up time that can be used for other purposes. In educational institutions, ML has been applied in a variety of ways, including automating administrative and procedural chores, developing curricula and content, teaching, and student learning processes [
10,
12].
ML techniques are currently very sophisticated and are capable of conducting more than just grading examinations using the answer key. In addition to conducting more conceptual assessments like scoring essays [
13] or student engagements [
14,
15], they can provide data about students’ knowledge and performance. ML techniques are able to observe student behavior and assess how well they performed. This ability has increased due to ML, enabling decision-makers to retrieve information from data for judgments and policies. Instructors and institutions can study the educational database using powerful techniques like ML and DM.
Moreover, ML’s application in an educational database is designated as EDM [
9]. How seriously a student takes achieving educational goals is demonstrated by the assessment and appraisal of that student’s performance, which also offers details on how well a student learns, how motivated a student is to study, or how successful the teaching technique was [
16]. The evaluation’s outcomes help teachers decide what is best for the student’s growth and how to give valuable feedback. The study considered all of these variables by choosing the proper traits, because each student’s unique characteristics, such as personality, motivation, self-efficacy, intelligence quotient (IQ), and self-control, are closely related to their success [
17].
Further, anticipating and analyzing student performance [
18] are essential for helping teachers identify students’ areas of weakness, while supporting them in raising their grades. Students can do the same as when managers enhance their processes [
19]. Teachers can identify students who are doing poorly and intervene early in the learning process to implement the appropriate interventions, thanks to the timely prediction of student performance [
20].
To produce a more precise estimate of the response variable, the learning process for GBM sequentially fits new models. Powerful ML algorithms, such as GBM, have demonstrated significant success in various real-world applications [
21]. They can be learned concerning different loss functions, for example, and are highly adaptable to the application’s specific needs. The fundamental concept of the GBM technique is to build the new base learners to have a maximum correlation with the ensemble’s overall negative gradient of the loss function. The learning process will produce consecutive error fitting if the error function is the traditional squared error loss. However, the loss functions employed can be random in order to provide more excellent intuition. Generally, it is up to the researcher to decide which loss function to use. A wide range of loss functions have been derived so far, and one has the option of constructing their own task-specific loss.
The primary motivation for our investigation was the need for systematic and thorough studies evaluating the prediction of student academic performance using various ML models. Moreover, the primary goal of this research was to review and examine the critical predictive variables and ML algorithms employed to forecast students’ academic success. Therefore, this effort aims to respond to the following research questions: What are the main predictive factors considered when rating student performance? What are the most critical ML algorithms for predicting student performance? What are the results and accuracy of the ML algorithms?
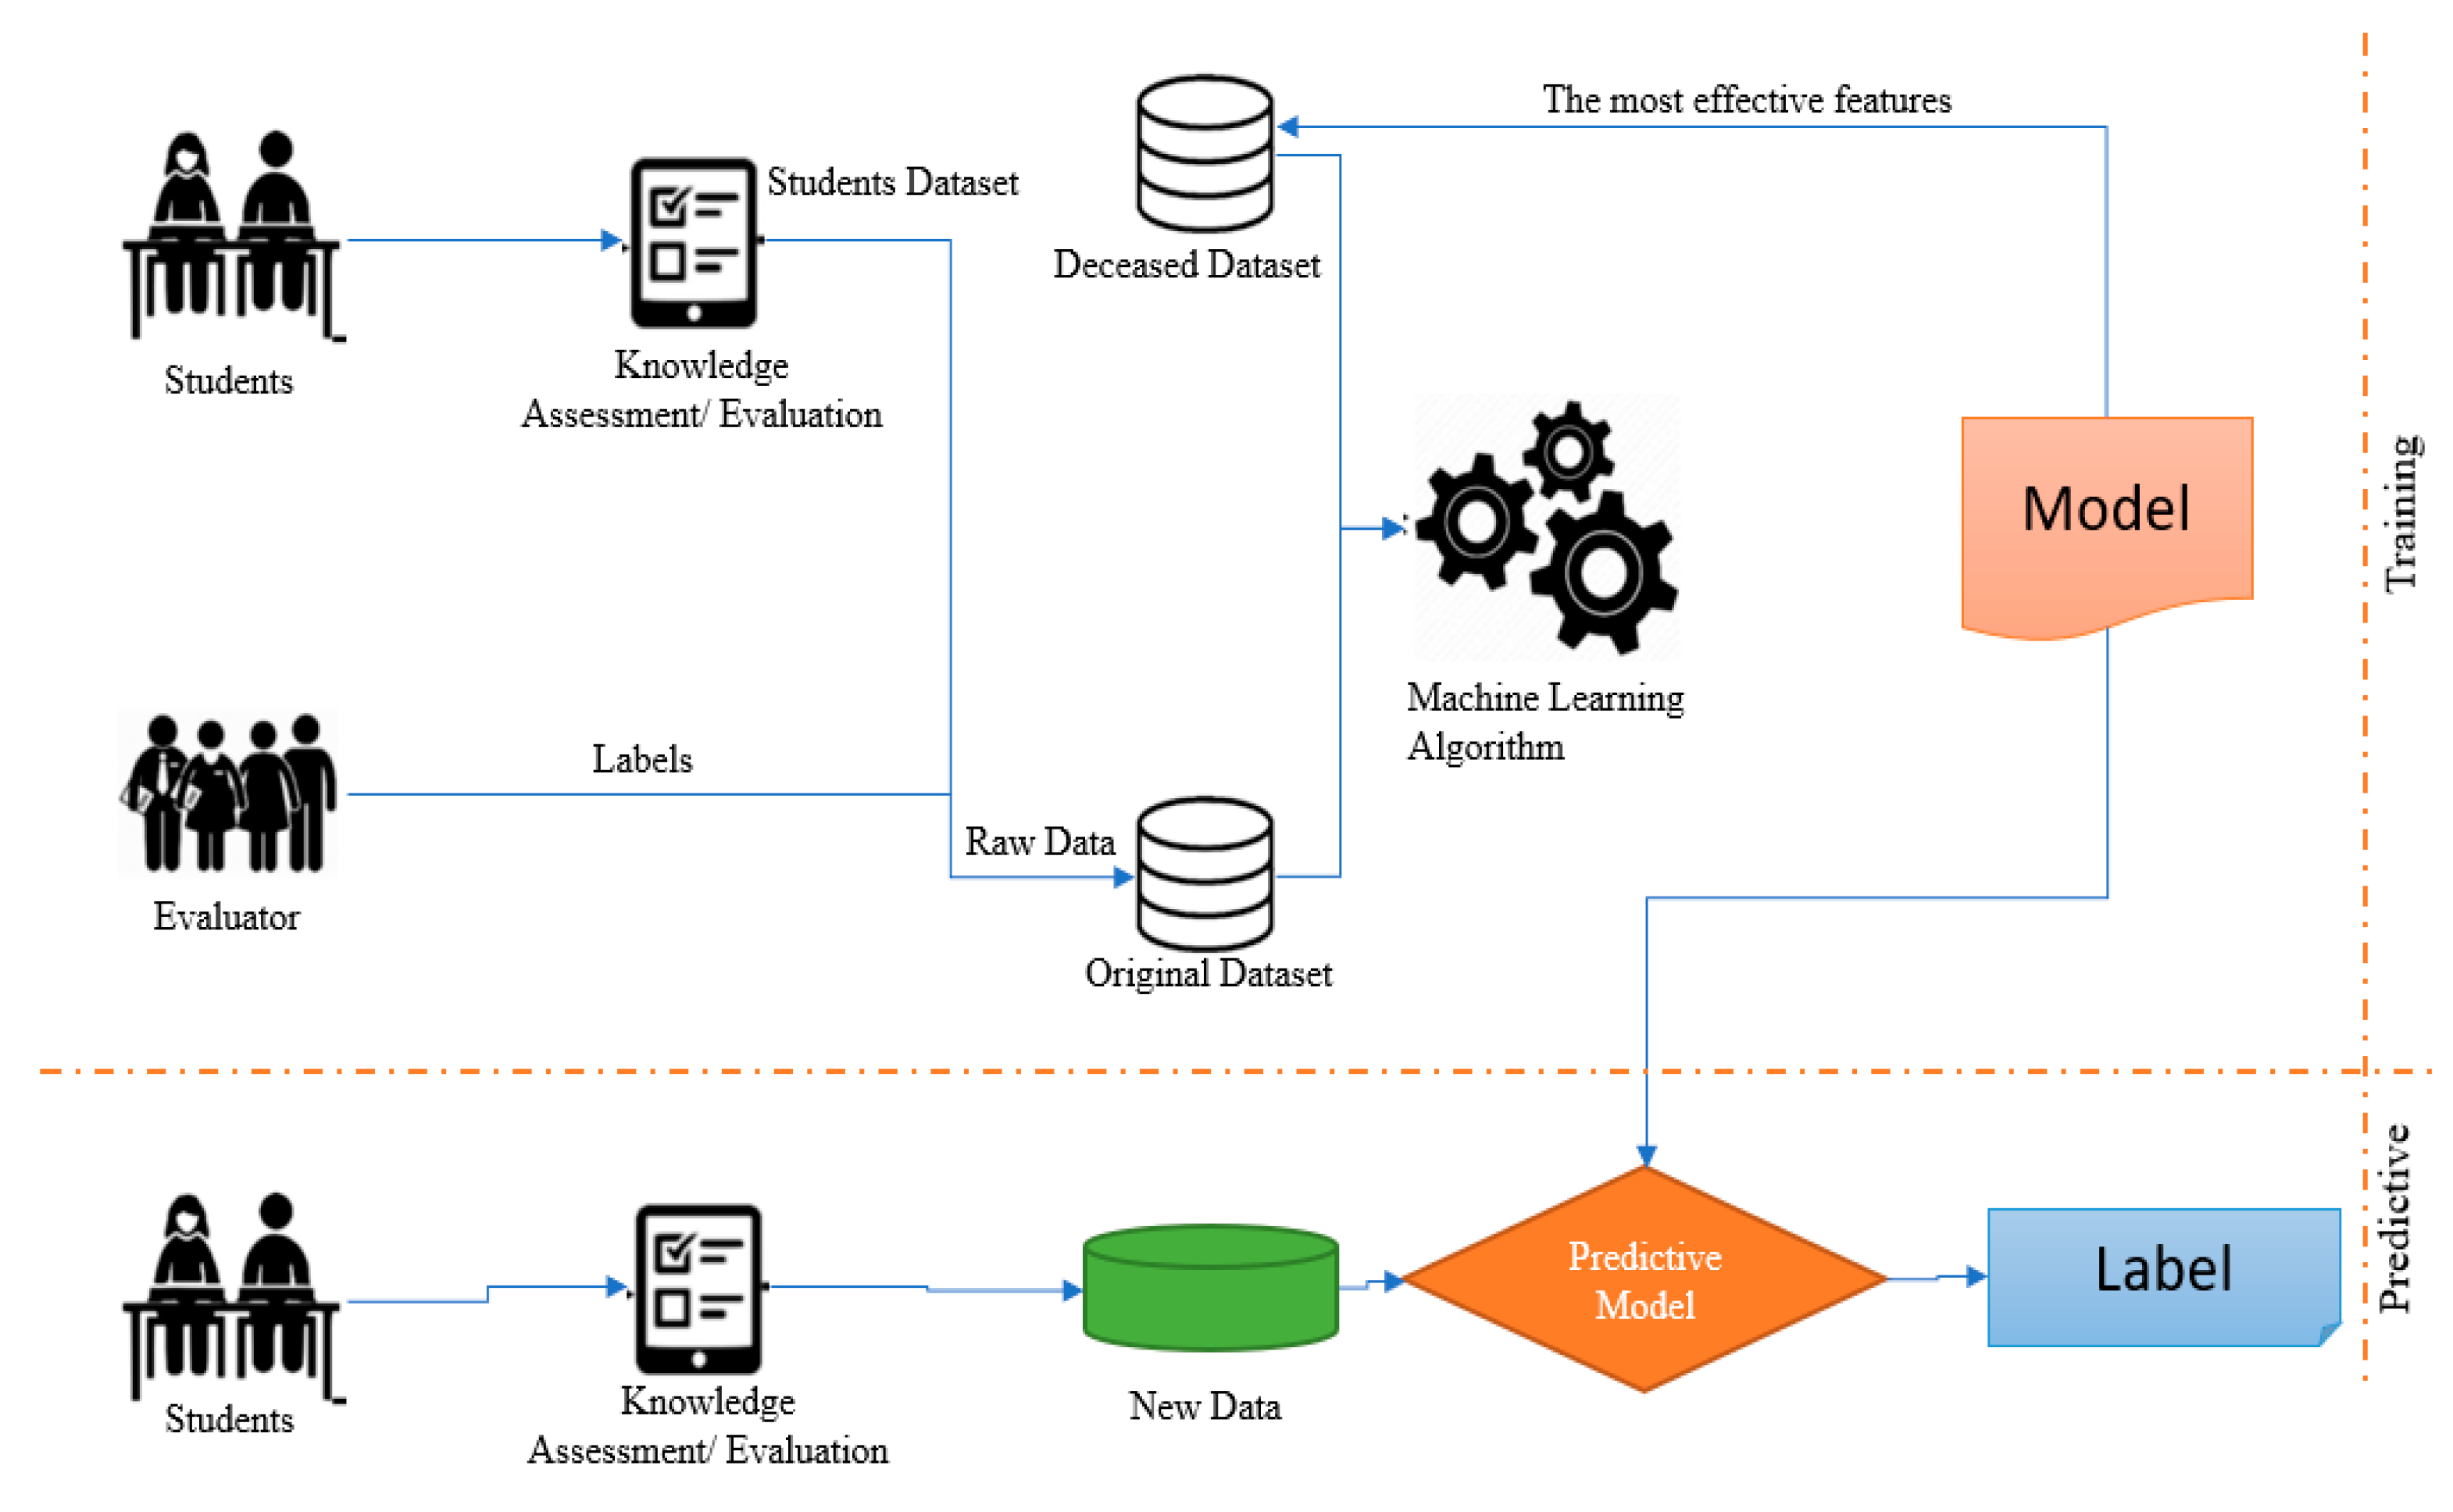
Figure 1 provides a clear and concise overview of the research approach used in the paper, highlighting the different stages and components of the approach and how they contributed to evaluating student knowledge assessment using ML techniques.
Figure 1′s knowledge assessment/evaluation survey was used to gather the necessary data from students, which was, subsequently, individually labelled and entered into the existing dataset by the evaluators. Effective models with good performance were discovered after the ML models had been fitted to the data. The essential elements were then chosen from the original information and re-added to the smaller database for use in the models and for student evaluation. The data from the smaller database was also used to retrain the ML models. ML models can now evaluate students with high accuracy, meaning that human assessors are no longer required to predict student achievement.
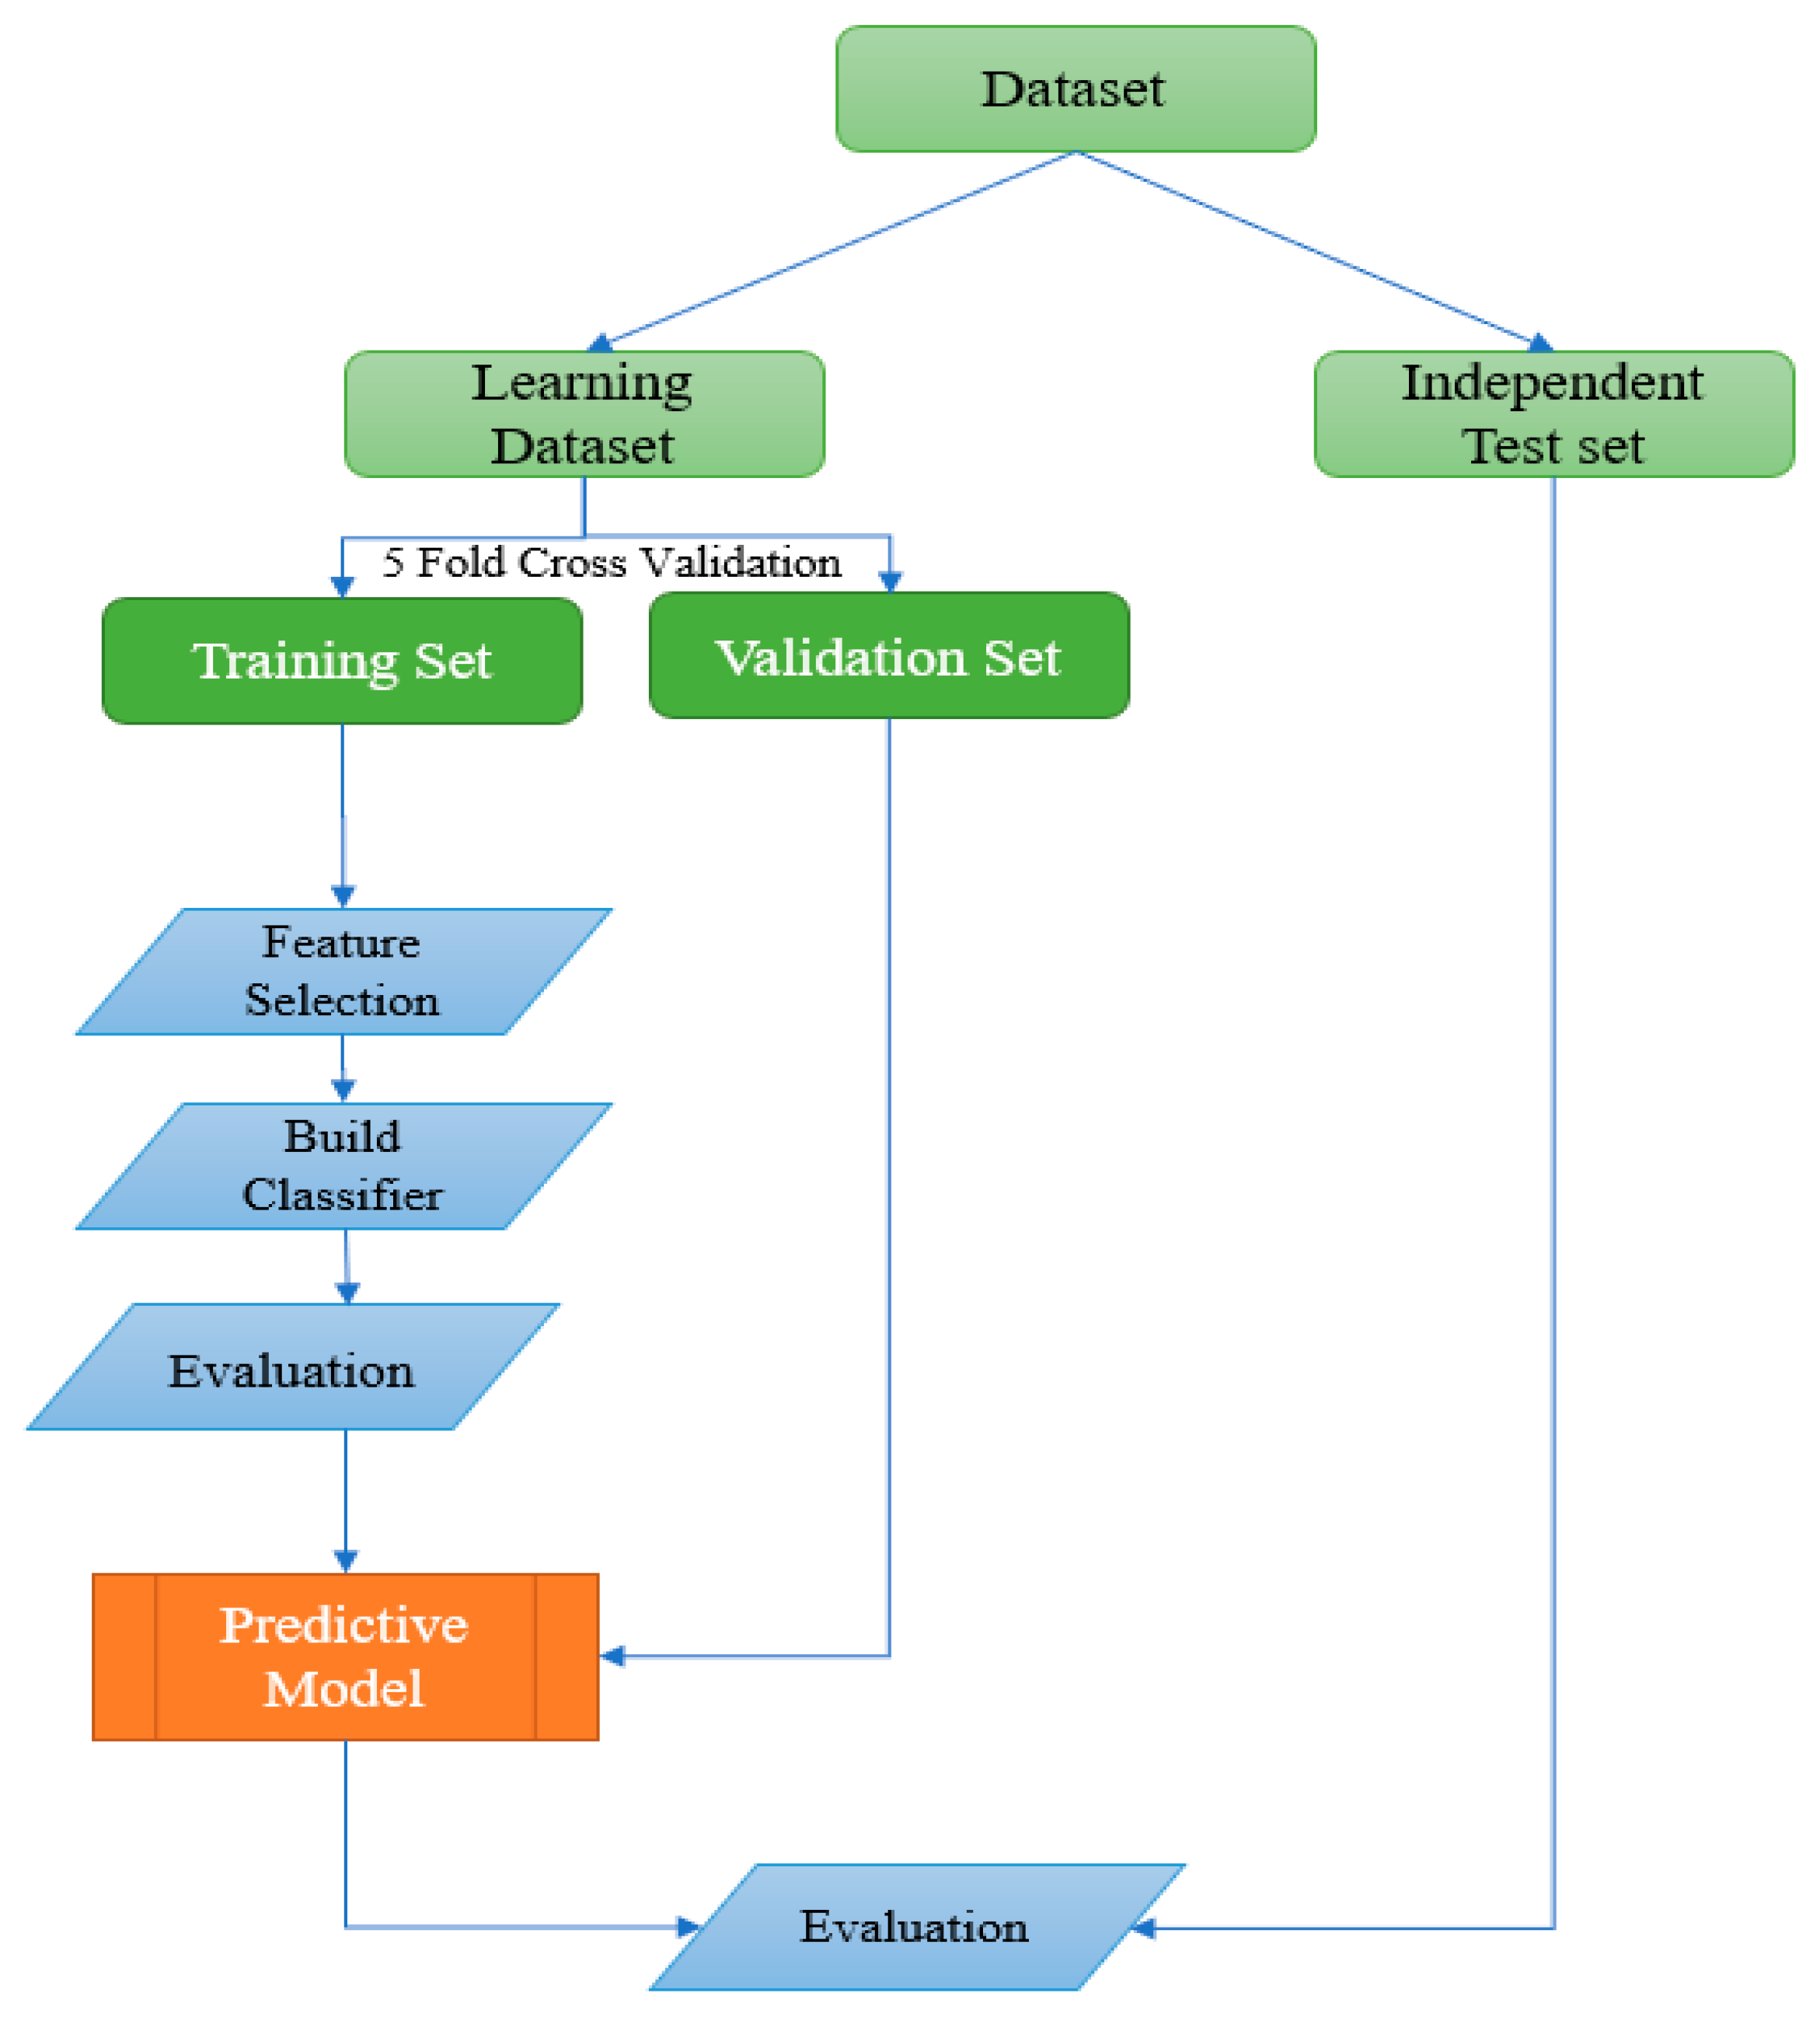
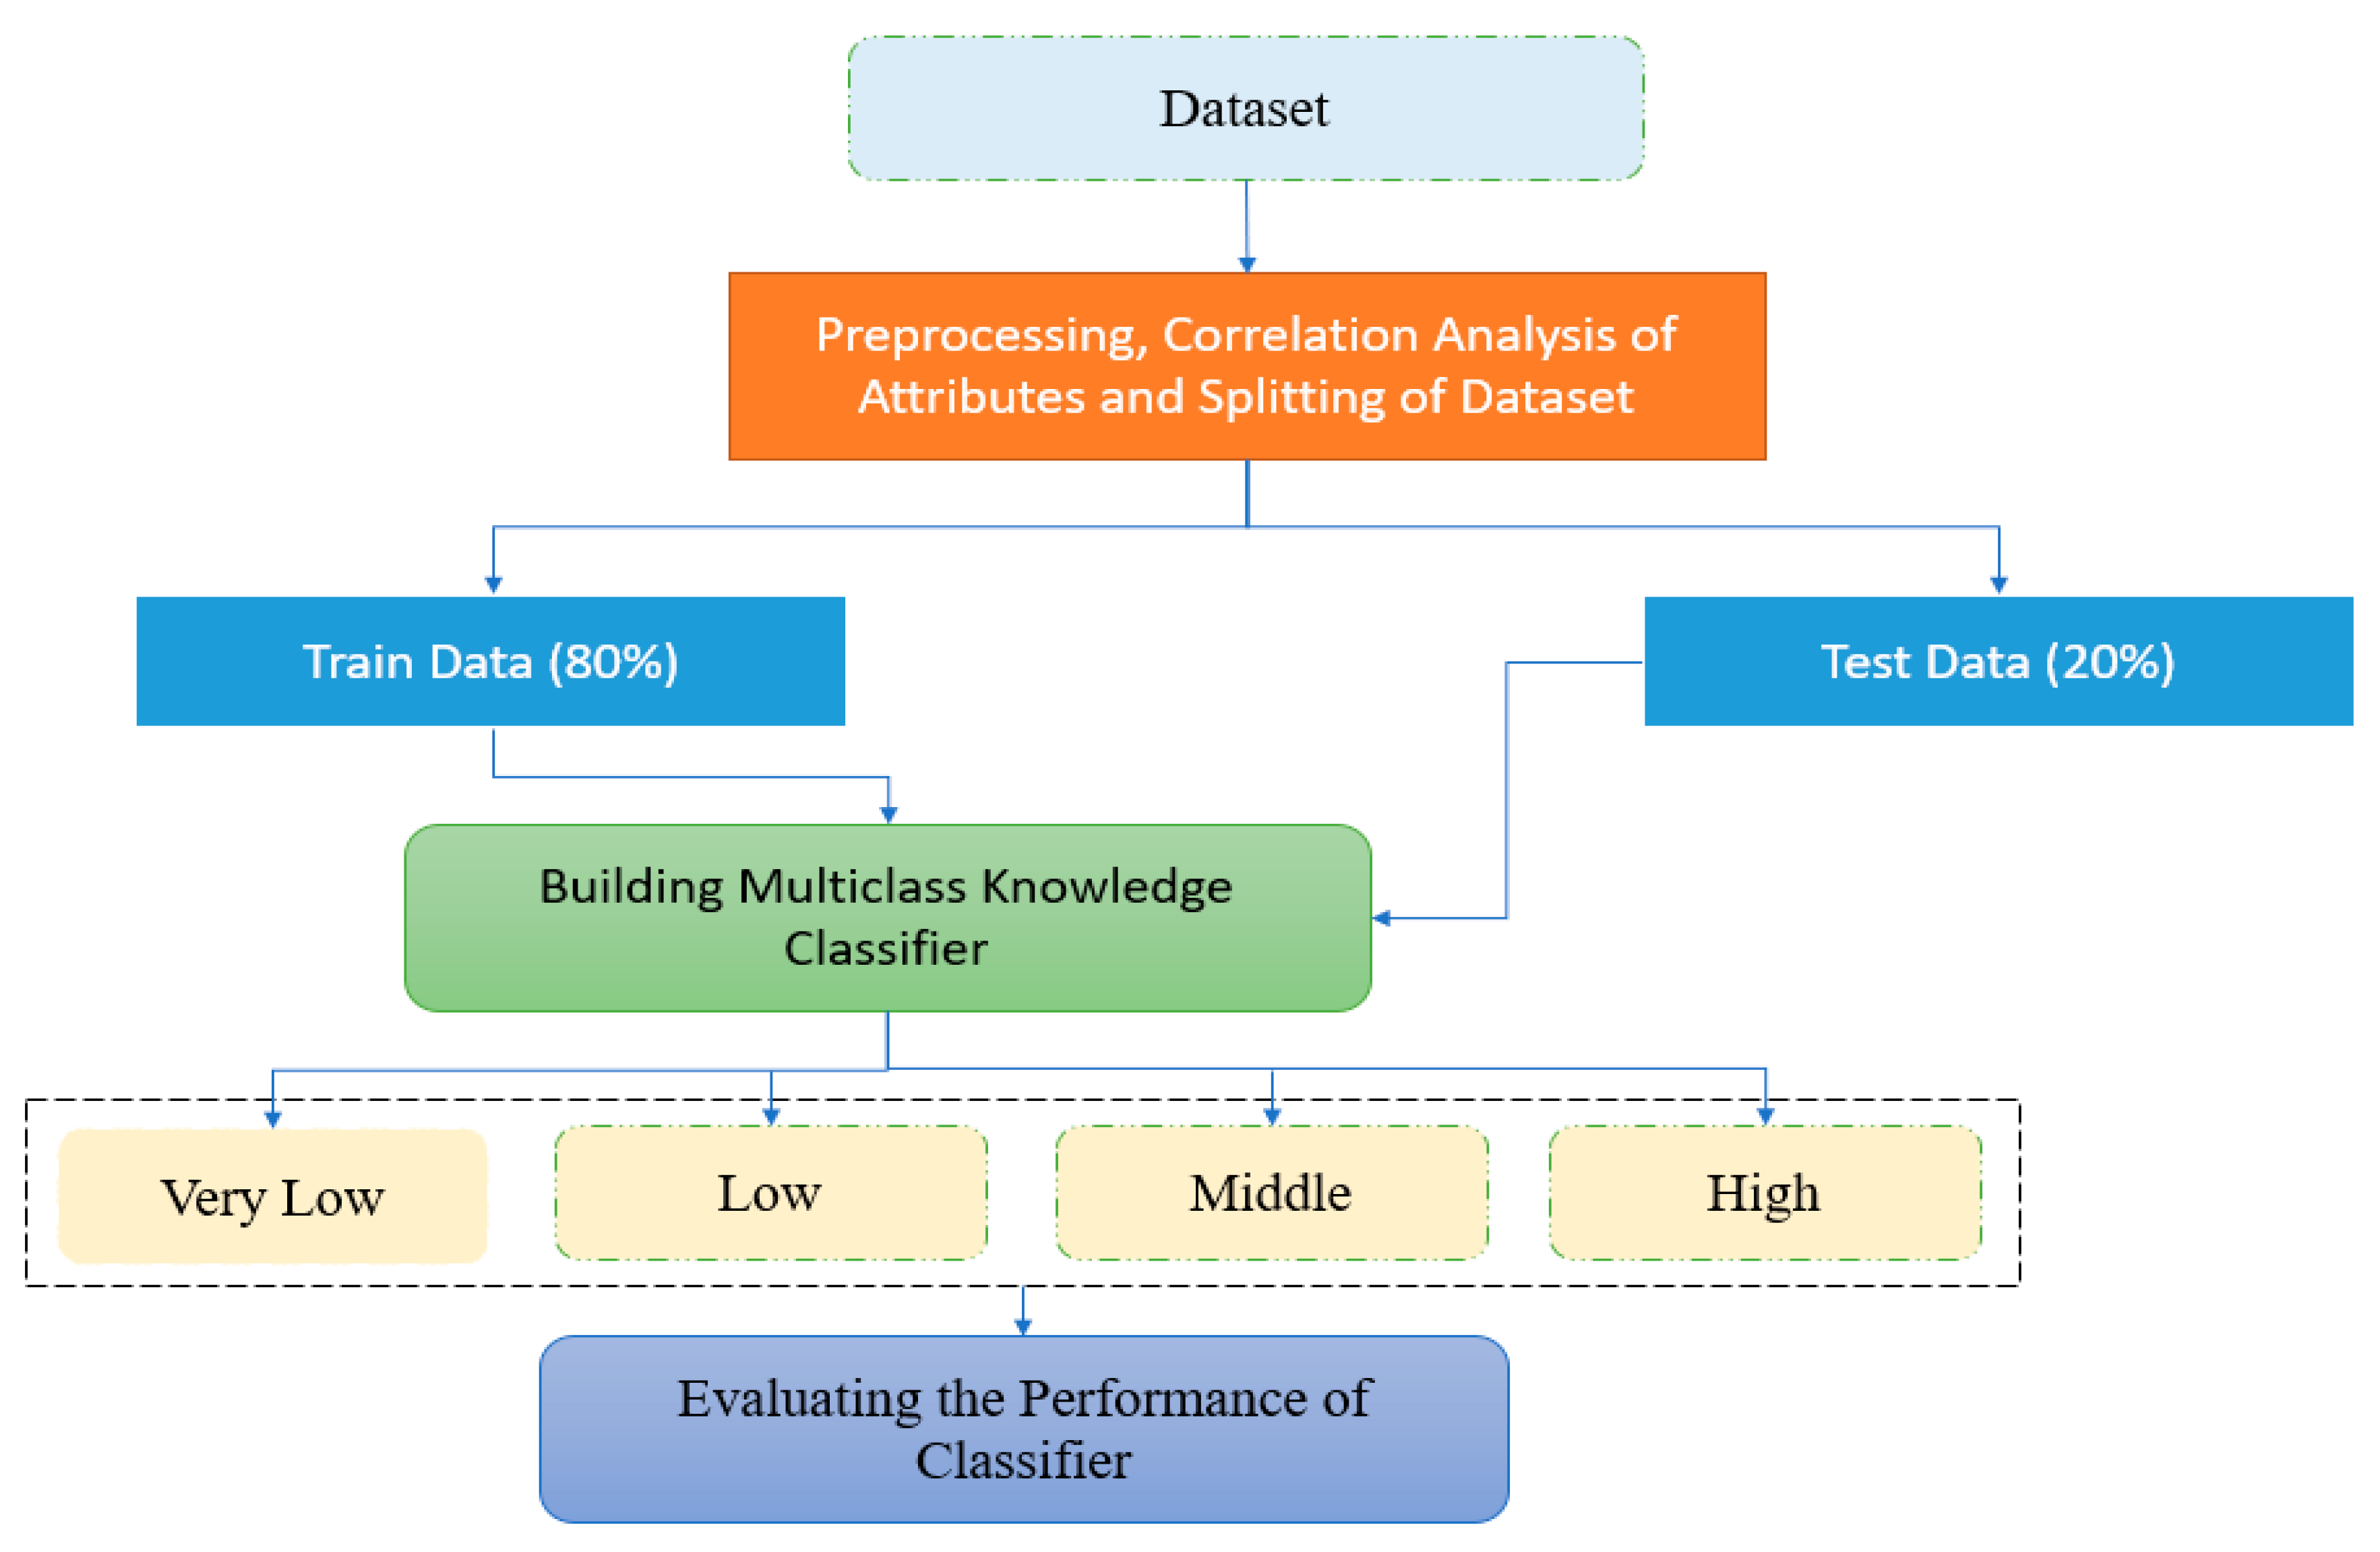
The ML technique used to evaluate student performance is shown in
Figure 2 below, a dataset where the learning dataset and the independent test set are separated. We used 5-fold cross validation with the training and validation sets from the learning dataset. The best prediction model and dataset are evaluated after the feature selection, classifier construction, and evaluation with the training set.
Our study was driven primarily by the need for more systematic and thorough studies evaluating the prediction of student academic performance and knowledge assessment using various ML models. Consequently, the primary goal of this work was to review and describe the essential predictive variables and the ML algorithms used to forecast students’ performance and gauge their knowledge. The study’s conclusions provide evidence for mapping and evaluating current knowledge, identifying research gaps, and making recommendations for future studies in this area.
The main goal of this research was to create an ML model for categorizing students into various groups according to their knowledge levels. With this goal in mind, the significant contribution of this paper is as follows:
This paper aimed to identify a group of characteristics or traits that influence students’ automatic knowledge classification and, also, to determine the role of ML in conceptualizing and evaluating student education, as well as the challenges and risks that need to be considered;
This paper used the two experiments to understand the impact of reducing the feature vector on the prediction accuracy of the classifiers and to identify the best technique for simulating students’ automatic knowledge classification;
To identify a group of characteristics or traits that influence students’ automatic knowledge classification, this study used seven different classifiers, including SVM, LR, RF, DT, GBM, GNB, and MLP;
This paper presents the analysis for identifying the minor correlated variables and removing them from the dataset to create a smaller dataset (Dataset 2) providing more focused research and understanding of the impact of a minor feature set on the performance of the classifiers.
The paper is organized as follows:
Section 1 discusses the introduction to the work, then
Section 2 is dedicated to a state-of-the-art literature review with recent references. Next,
Section 3 describes the methodology, including dataset preparation, the proposed process, evaluation, the performance indicators, and experimentation. Then in
Section 4, the results are discussed and supported by accurate figures and tables. Finally,
Section 5 is the discussion, and
Section 6 is the conclusion, followed by relevant references.
2. Literature Review
The integration of ML in various facets of education has been the subject of numerous research projects, and multiple techniques and tools have been employed to carry out such tasks. Evaluation of student performance and knowledge assessment is one of these components. There are many different ways to assess student achievement [
22,
23,
24]. Numerous studies assessed students’ performance and assessment in general [
25,
26,
27], whereas other research assessed students for a particular goal, including academic accomplishment [
5]. For each of the activities listed above, some cutting-edge research studies that assessed student performance in various ways are discussed below.
In this work [
8], the authors offered various strategies for suggesting online learning systems to improve the construction of the learning management system (LMS) using natural language processing technology. Some of these methods involve content-based filtering, collaborative filtering, utility filtering, knowledge filtering, demographic filtering, community filtering, and hybrid filtering.
In another work [
9], researchers reported a preliminary investigation into the development, application, and delivery of the LMS. The paper provides an overview of learning analytics, which integrates data with learning. The study concluded that the most prominent models in the literature are those for learning analytical models. These models involve four steps: gathering pertinent data, reporting it, making predictions, taking action, and modifying the learning environment in response to the data. Unfortunately, the report does not refer to particular ML techniques that could be used in the model.
Similarly, in [
11], the authors provided an overview of EDM by going through its core concepts. Both studies included summaries and analyses of the EDM industry and its processes, as well as inclusive learning analytics, but they did not adhere to the requirements for a systematic literature analysis [
11,
12,
13,
14,
15,
16,
17,
18,
19,
20,
21,
22,
23,
24,
25,
26,
27,
28].
Another work [
29], produced another analytical review of the literature to offer an overview of EDM [
30]. Some of the strategies used in the study were forecasting, segmentation, outlier detection, process mining, relationship mining, social network analysis, data distillation for human judgment, text mining, knowledge tracing, discovery with models, and non-negative matrix factorization. However, the authors of this study needed to adhere to the standards for a systematic literature review, which typically involves a rigorous and systematic search, appraisal, and synthesis of the literature on a topic. Additionally, the study did not focus specifically on ML methods, a specific field of study within EDM that involves using ML techniques to analyze educational data. Therefore, the analysis needed a comprehensive and in-depth examination of the ML methods for EDM.
Much data was recently acquired on student performance and assessment indicators with actions like reading files, engaging in forums, sending messages, or viewing suggested links, by some studies that were recently applied to an online learning environment. However, when evaluating the research on learning analytics, it was found that many of the previous studies concentrated on forecasting student outcomes [
18,
31], at-risk students [
19], and student performance [
25].
In [
5], the authors provided an anonymized dataset with 3,568,825 instances utilized to predict dropout likelihood concerning student assessment and performance evaluation. Free/reduced lunch eligibility and student demographics were used as features and were pulled from various school districts, educational institutions, and agencies.
In addition, the classification method for LR was used to define the relationship between a discrete response variable and one or more independent variables. Although LR is utilized for classification problems when the response variable has two or more classes, linear regression is typically employed to predict response variables with continuous values. According to [
3], LR has emerged as one of the most popular approaches to categorization issues across a range of industries.
Reflective research on artificial intelligence and machine learning (AIML) by [
12] examined the themes and their development, while pointing out the recent rise in interest in profiling and analytics. An overview of the use of deep learning and artificial intelligence in teaching and learning is given in the paper. However, the study does not emphasize using ML algorithms for online education. A survey-based study by [
11] used educational data to create models for enhancing academic performance and institutional effectiveness.
Learning analytics has been used in several types of research to forecast student assessment performance using various ML methods. The majority of experts concur that student participation affects their performance evaluation [
3,
32,
33]. However, only some studies have examined learning analytics to forecast student engagement concerning performance. They must still look at ways to improve and inspire students or assess their knowledge.
The list of the past publications cited and the techniques and findings in assessing student knowledge is provided below in
Table 1.
4. Results
4.1. First Experiment
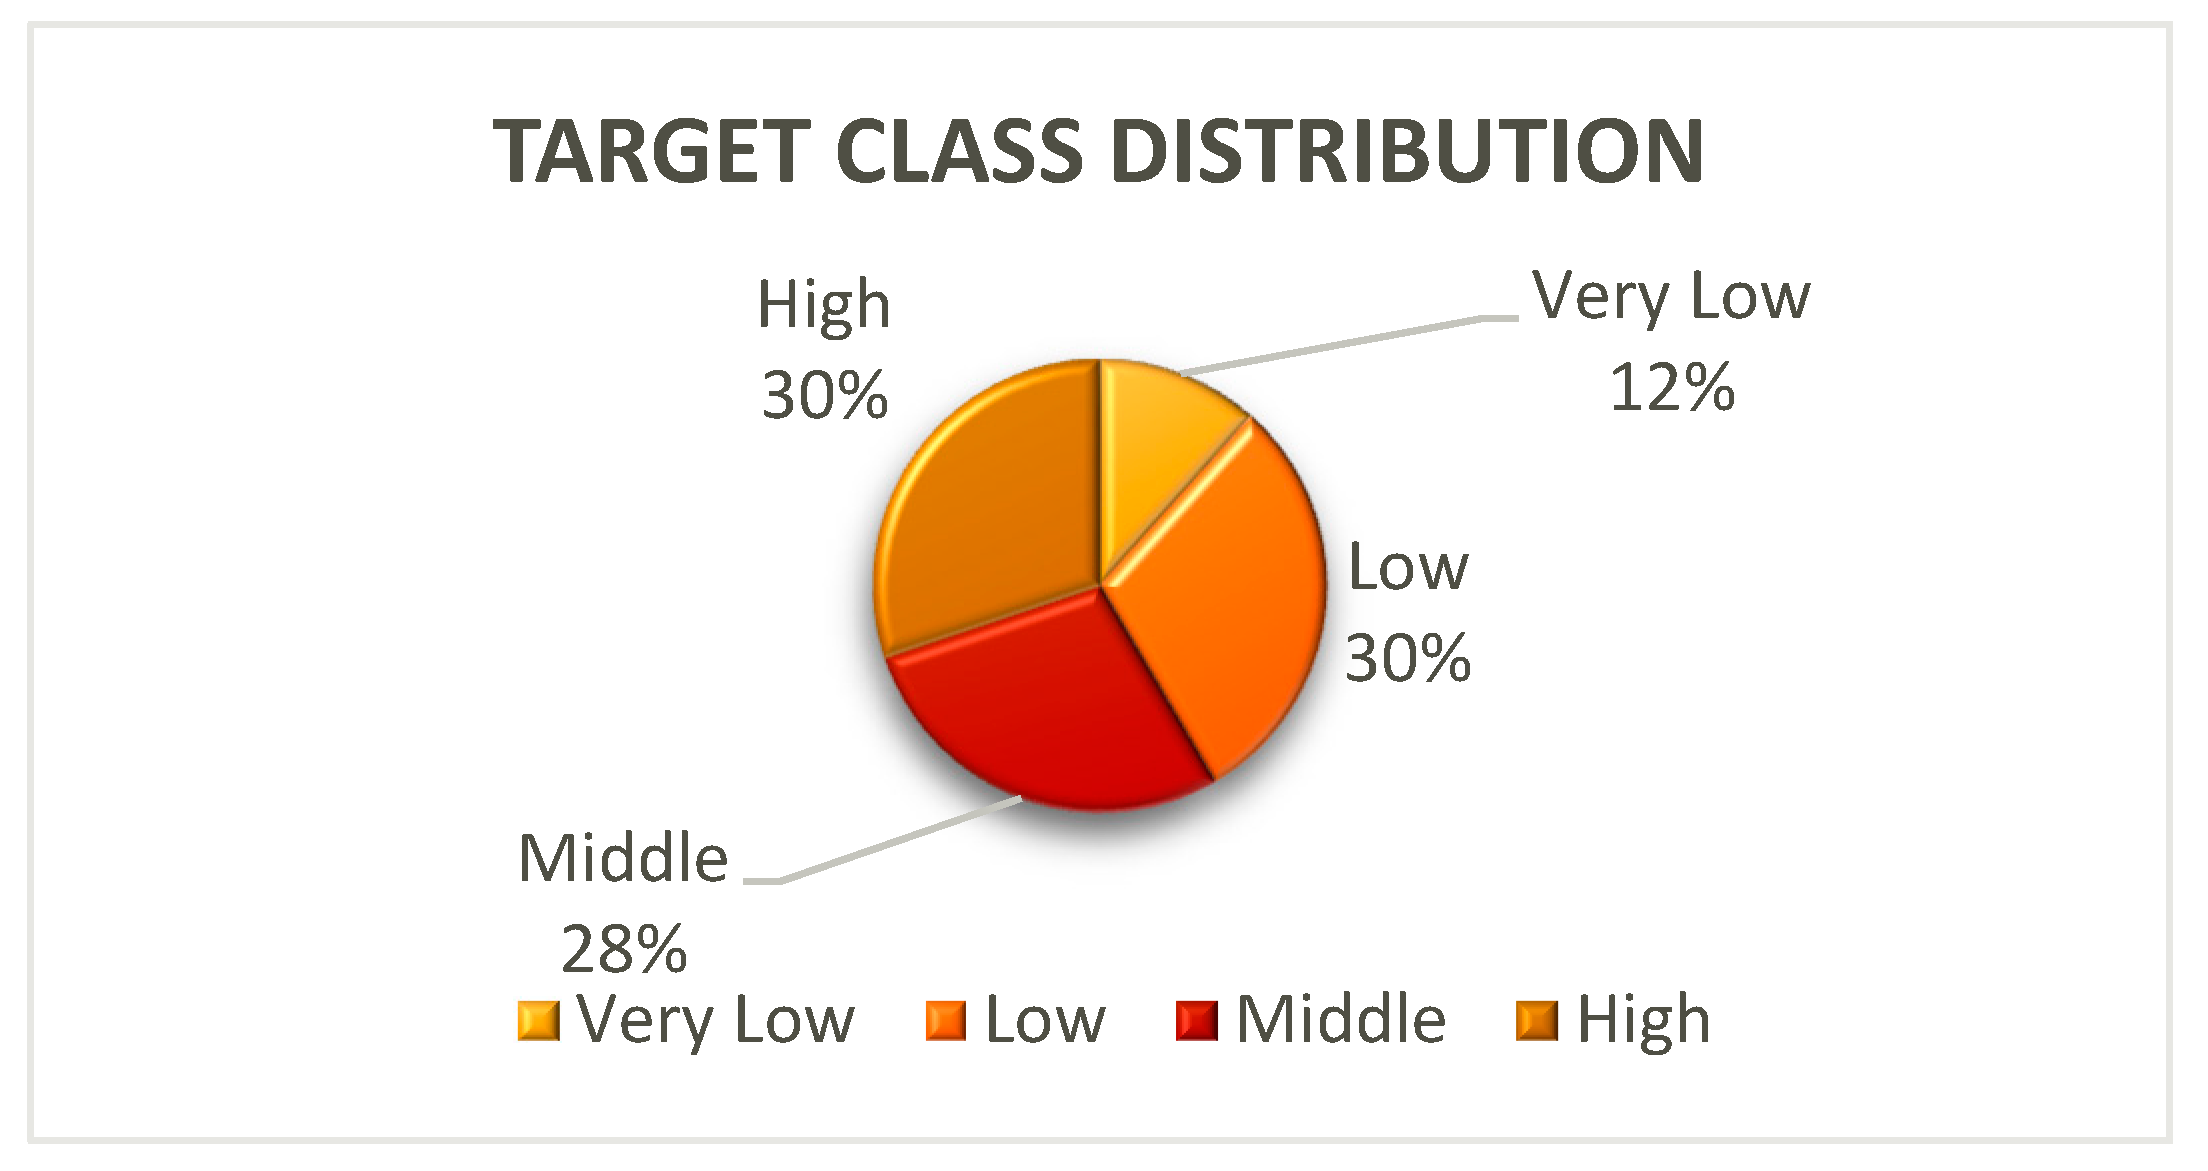
The first experiment aimed to determine the best way to model the automatic classification of student knowledge. The data in this input had five attributes: PEG, LPR, STR, SCG, and STG. It was a multiclass problem since the classifier’s output can be “very low, low, middle, high,” denoting a student’s proficiency in a particular learning object as a novice, beginner, intermediate, or expert, respectively. We employed seven distinct classifiers for modeling, as was covered in the technique section.
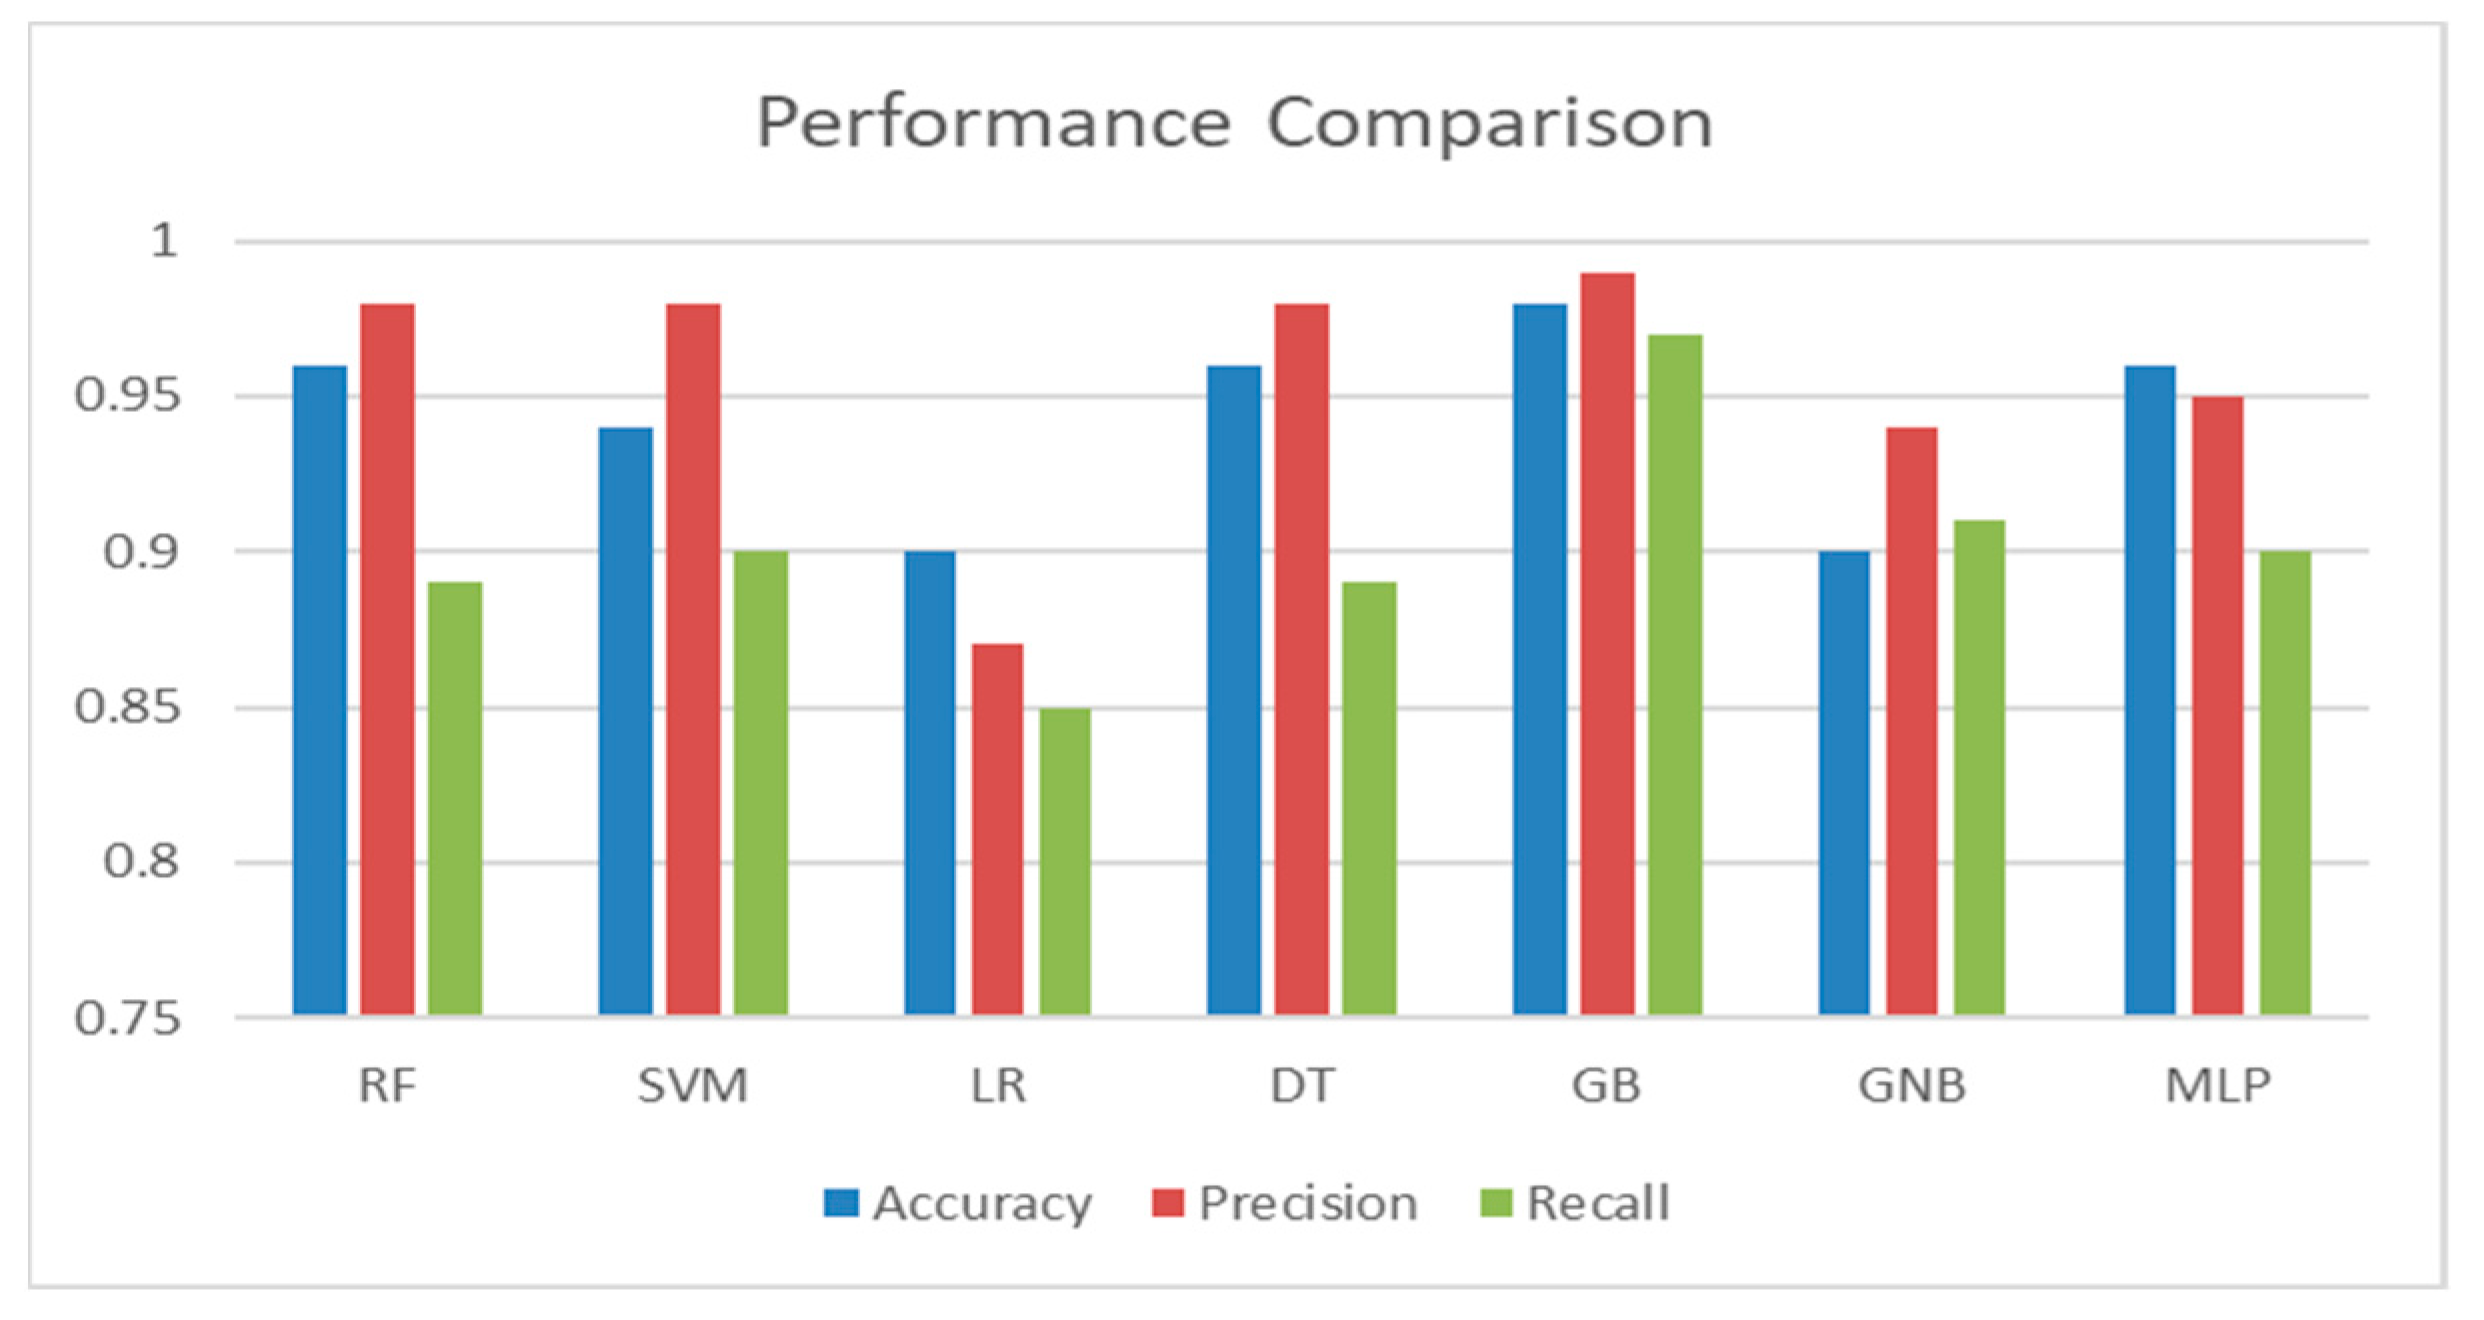
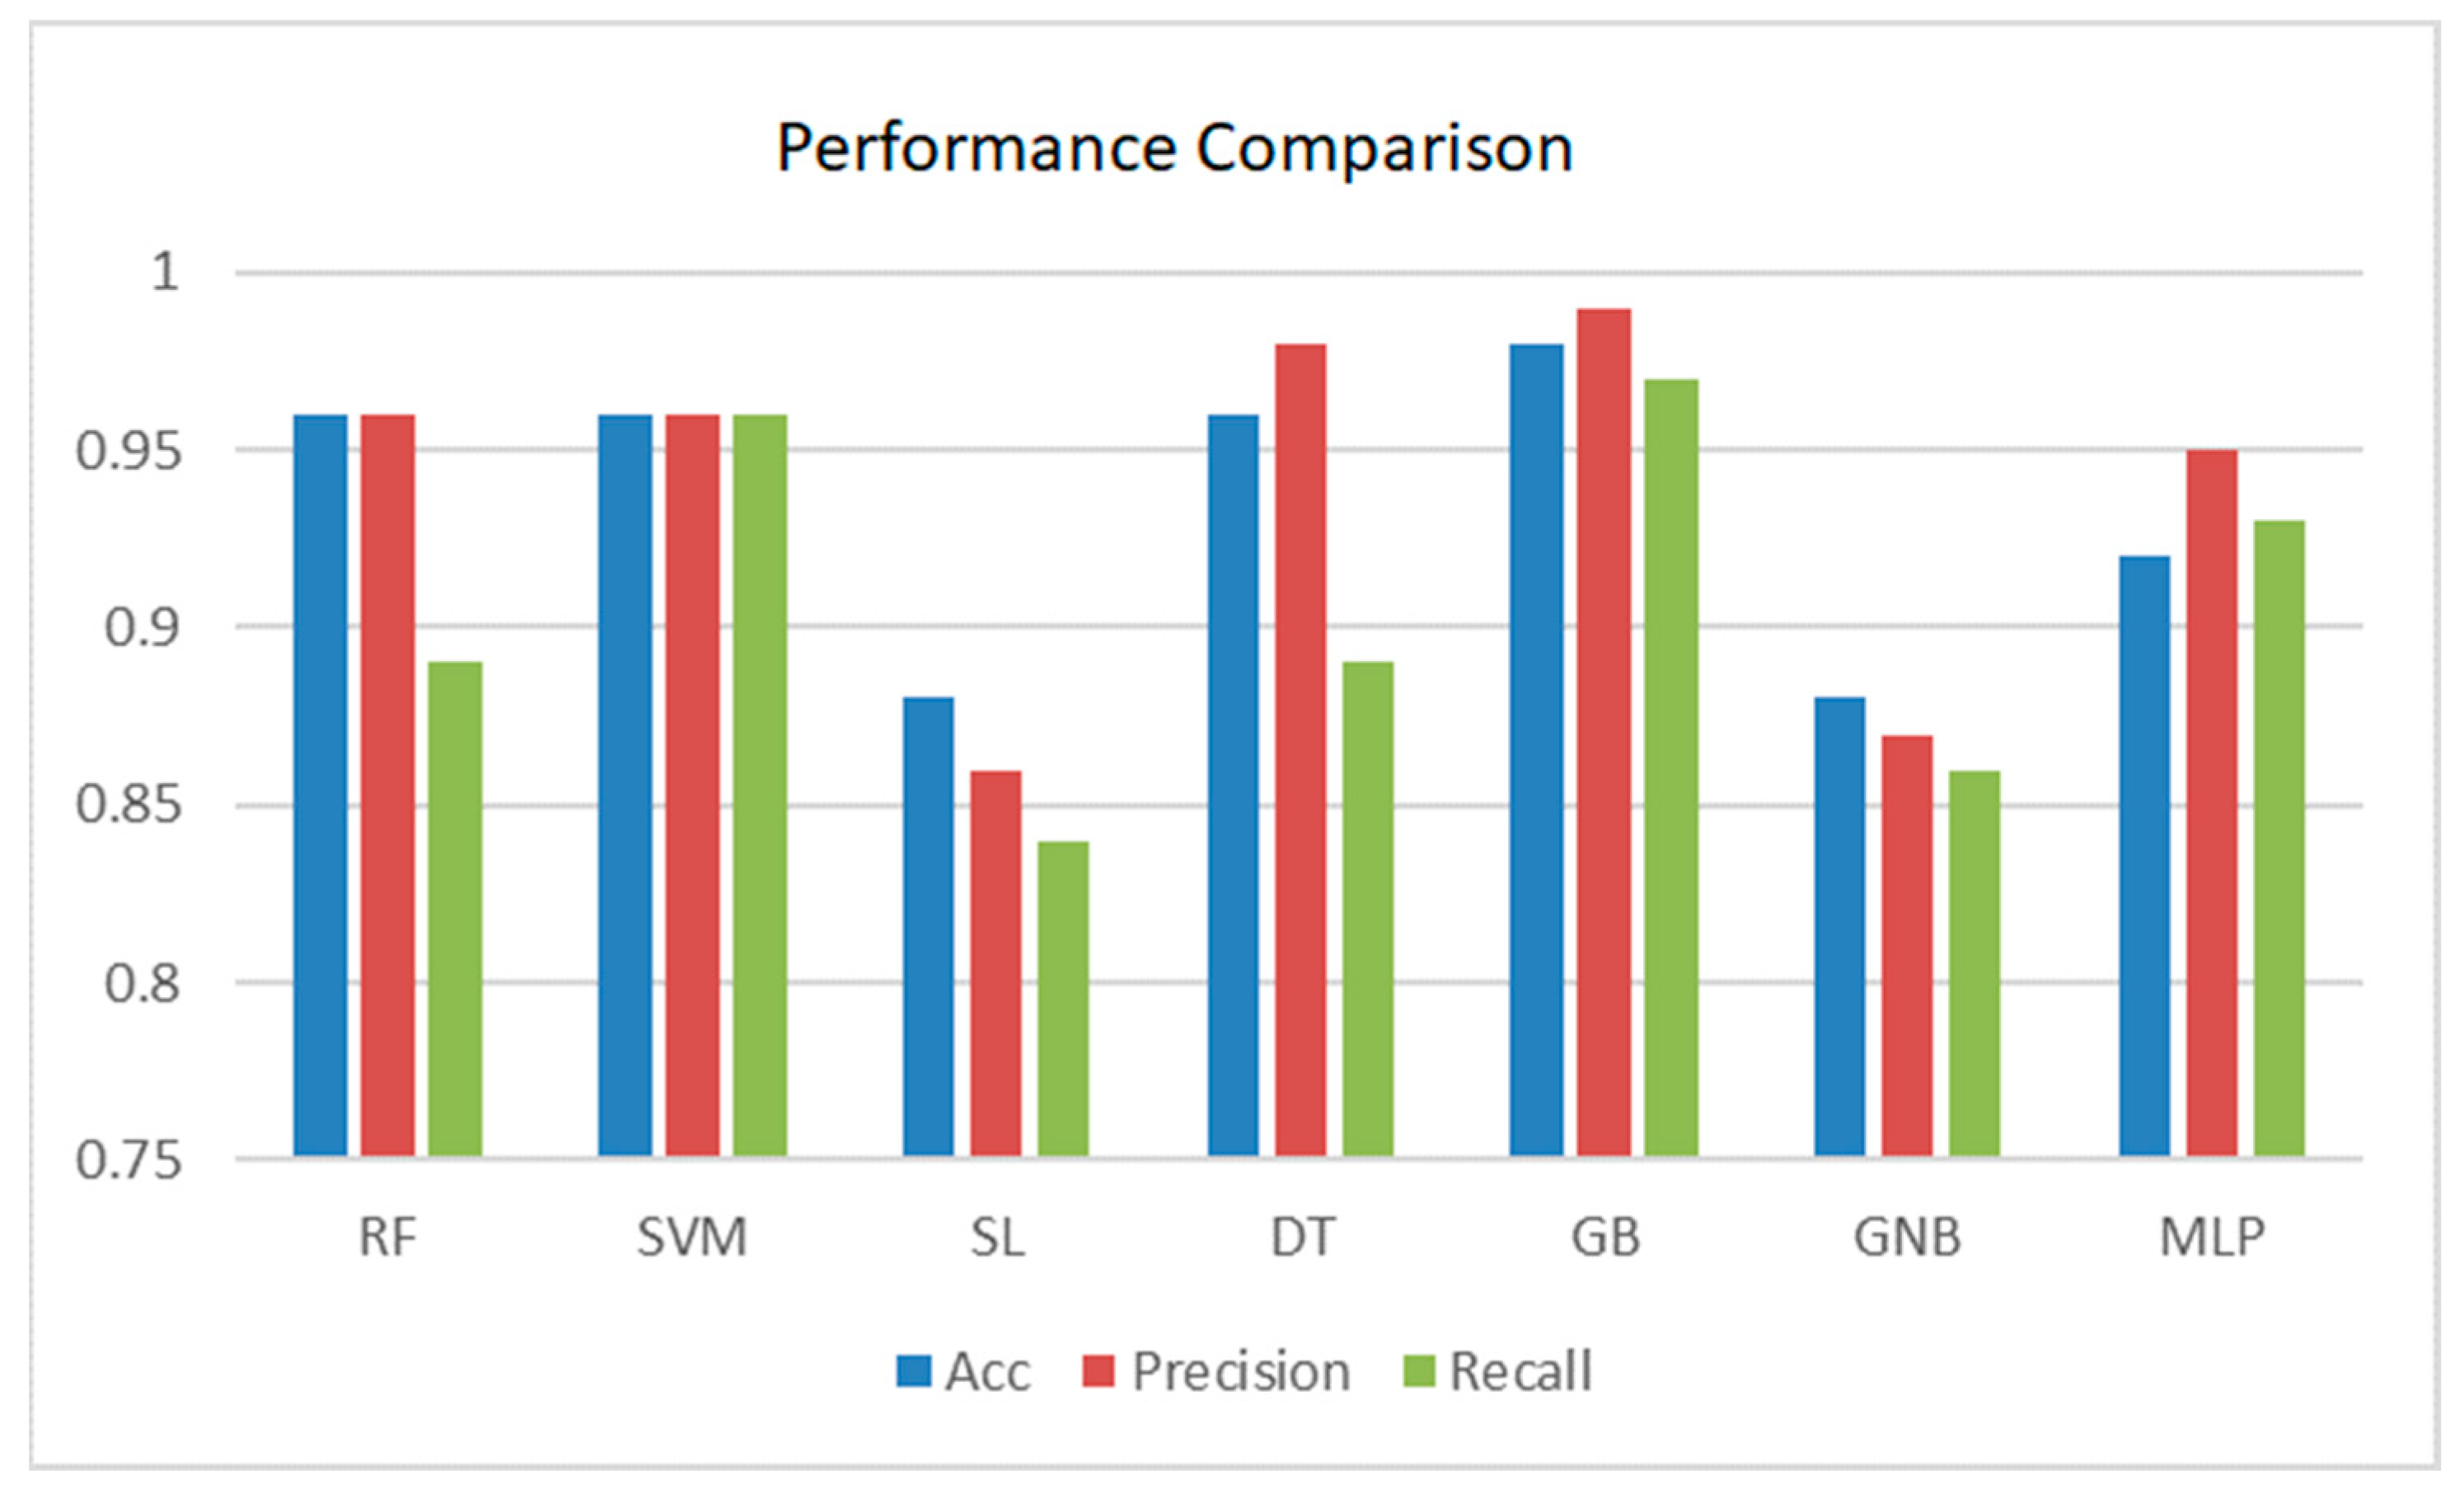
Table 5 compares the performance of the seven different ML classifiers (RF, SVM, LR, DT, GBM, GNB, and MLP) for evaluating student performance. The performance metrics used for evaluation were: accuracy, precision, recall, MAE, MSE, RMSE, RAE, and the AUC. A visual representation of the performance comparison of the various classifiers with Dataset 1 can be found in
Figure 7 and
Figure 8.
According to the data, the GBM exhibited the highest prediction accuracy, 98%. In terms of prediction error, the GBM also performed well. In terms of performance, RF, DT, and MLP were on a par with the GBM. The performance could be better when using linear classifiers like SVM or LR. At this level of testing, the tree-based classifiers performed better.
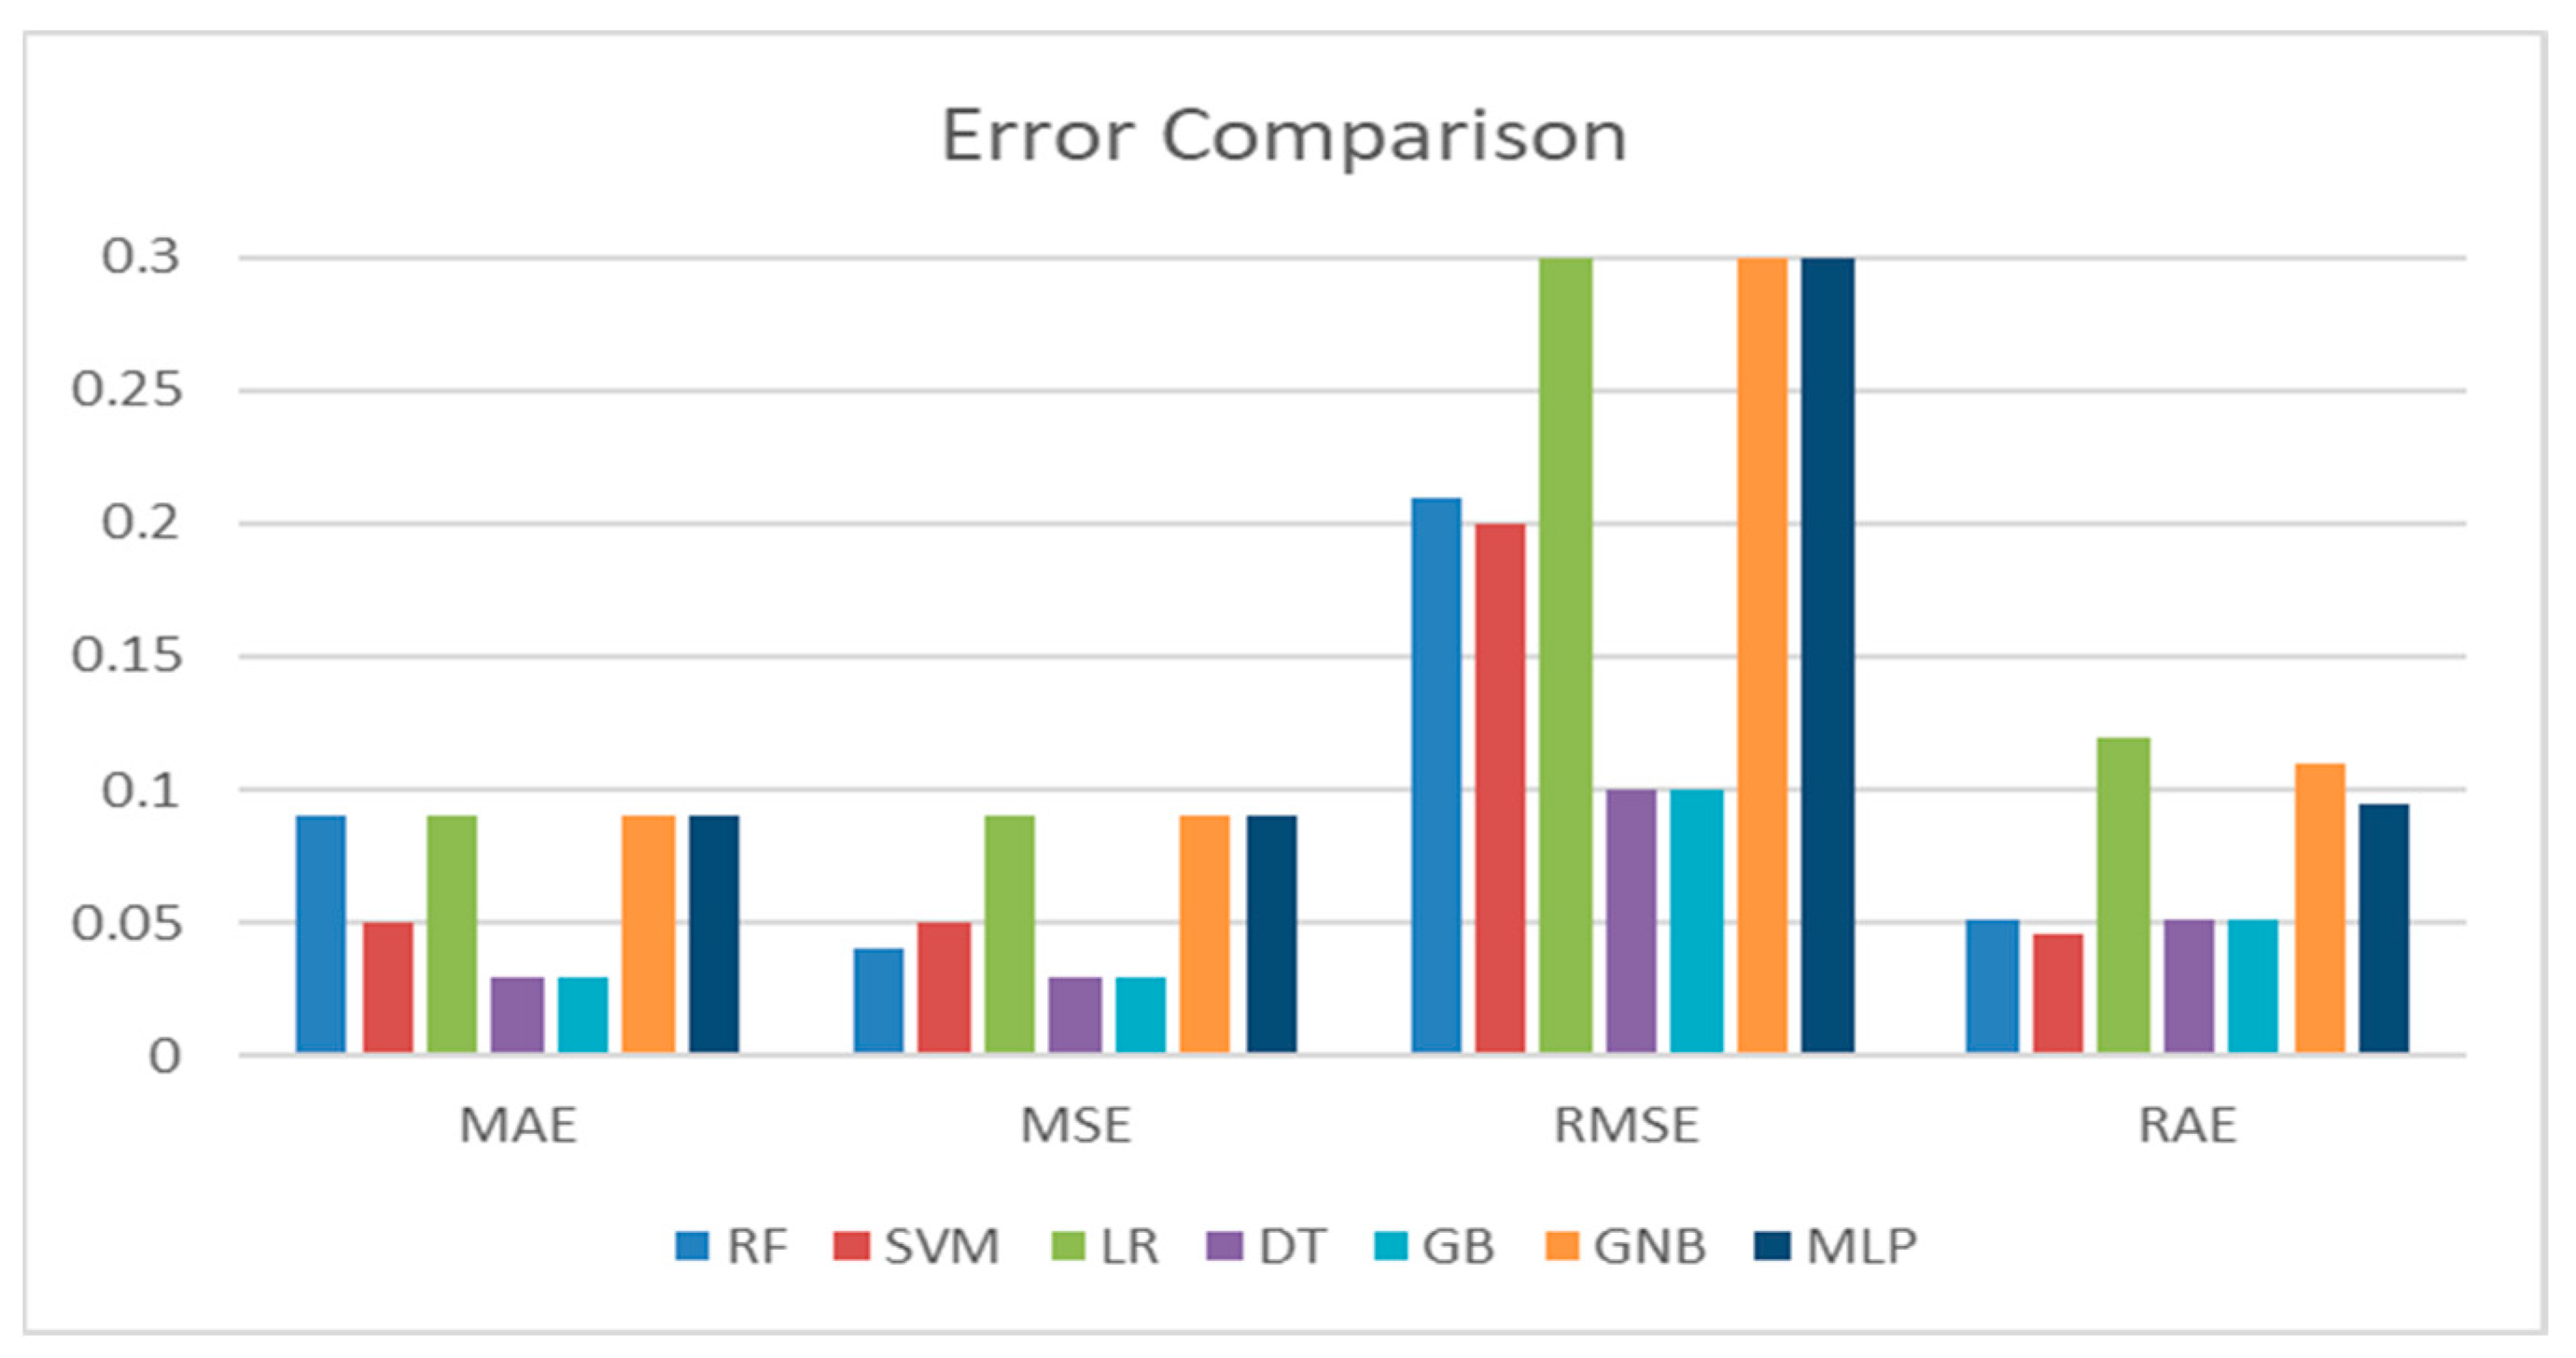
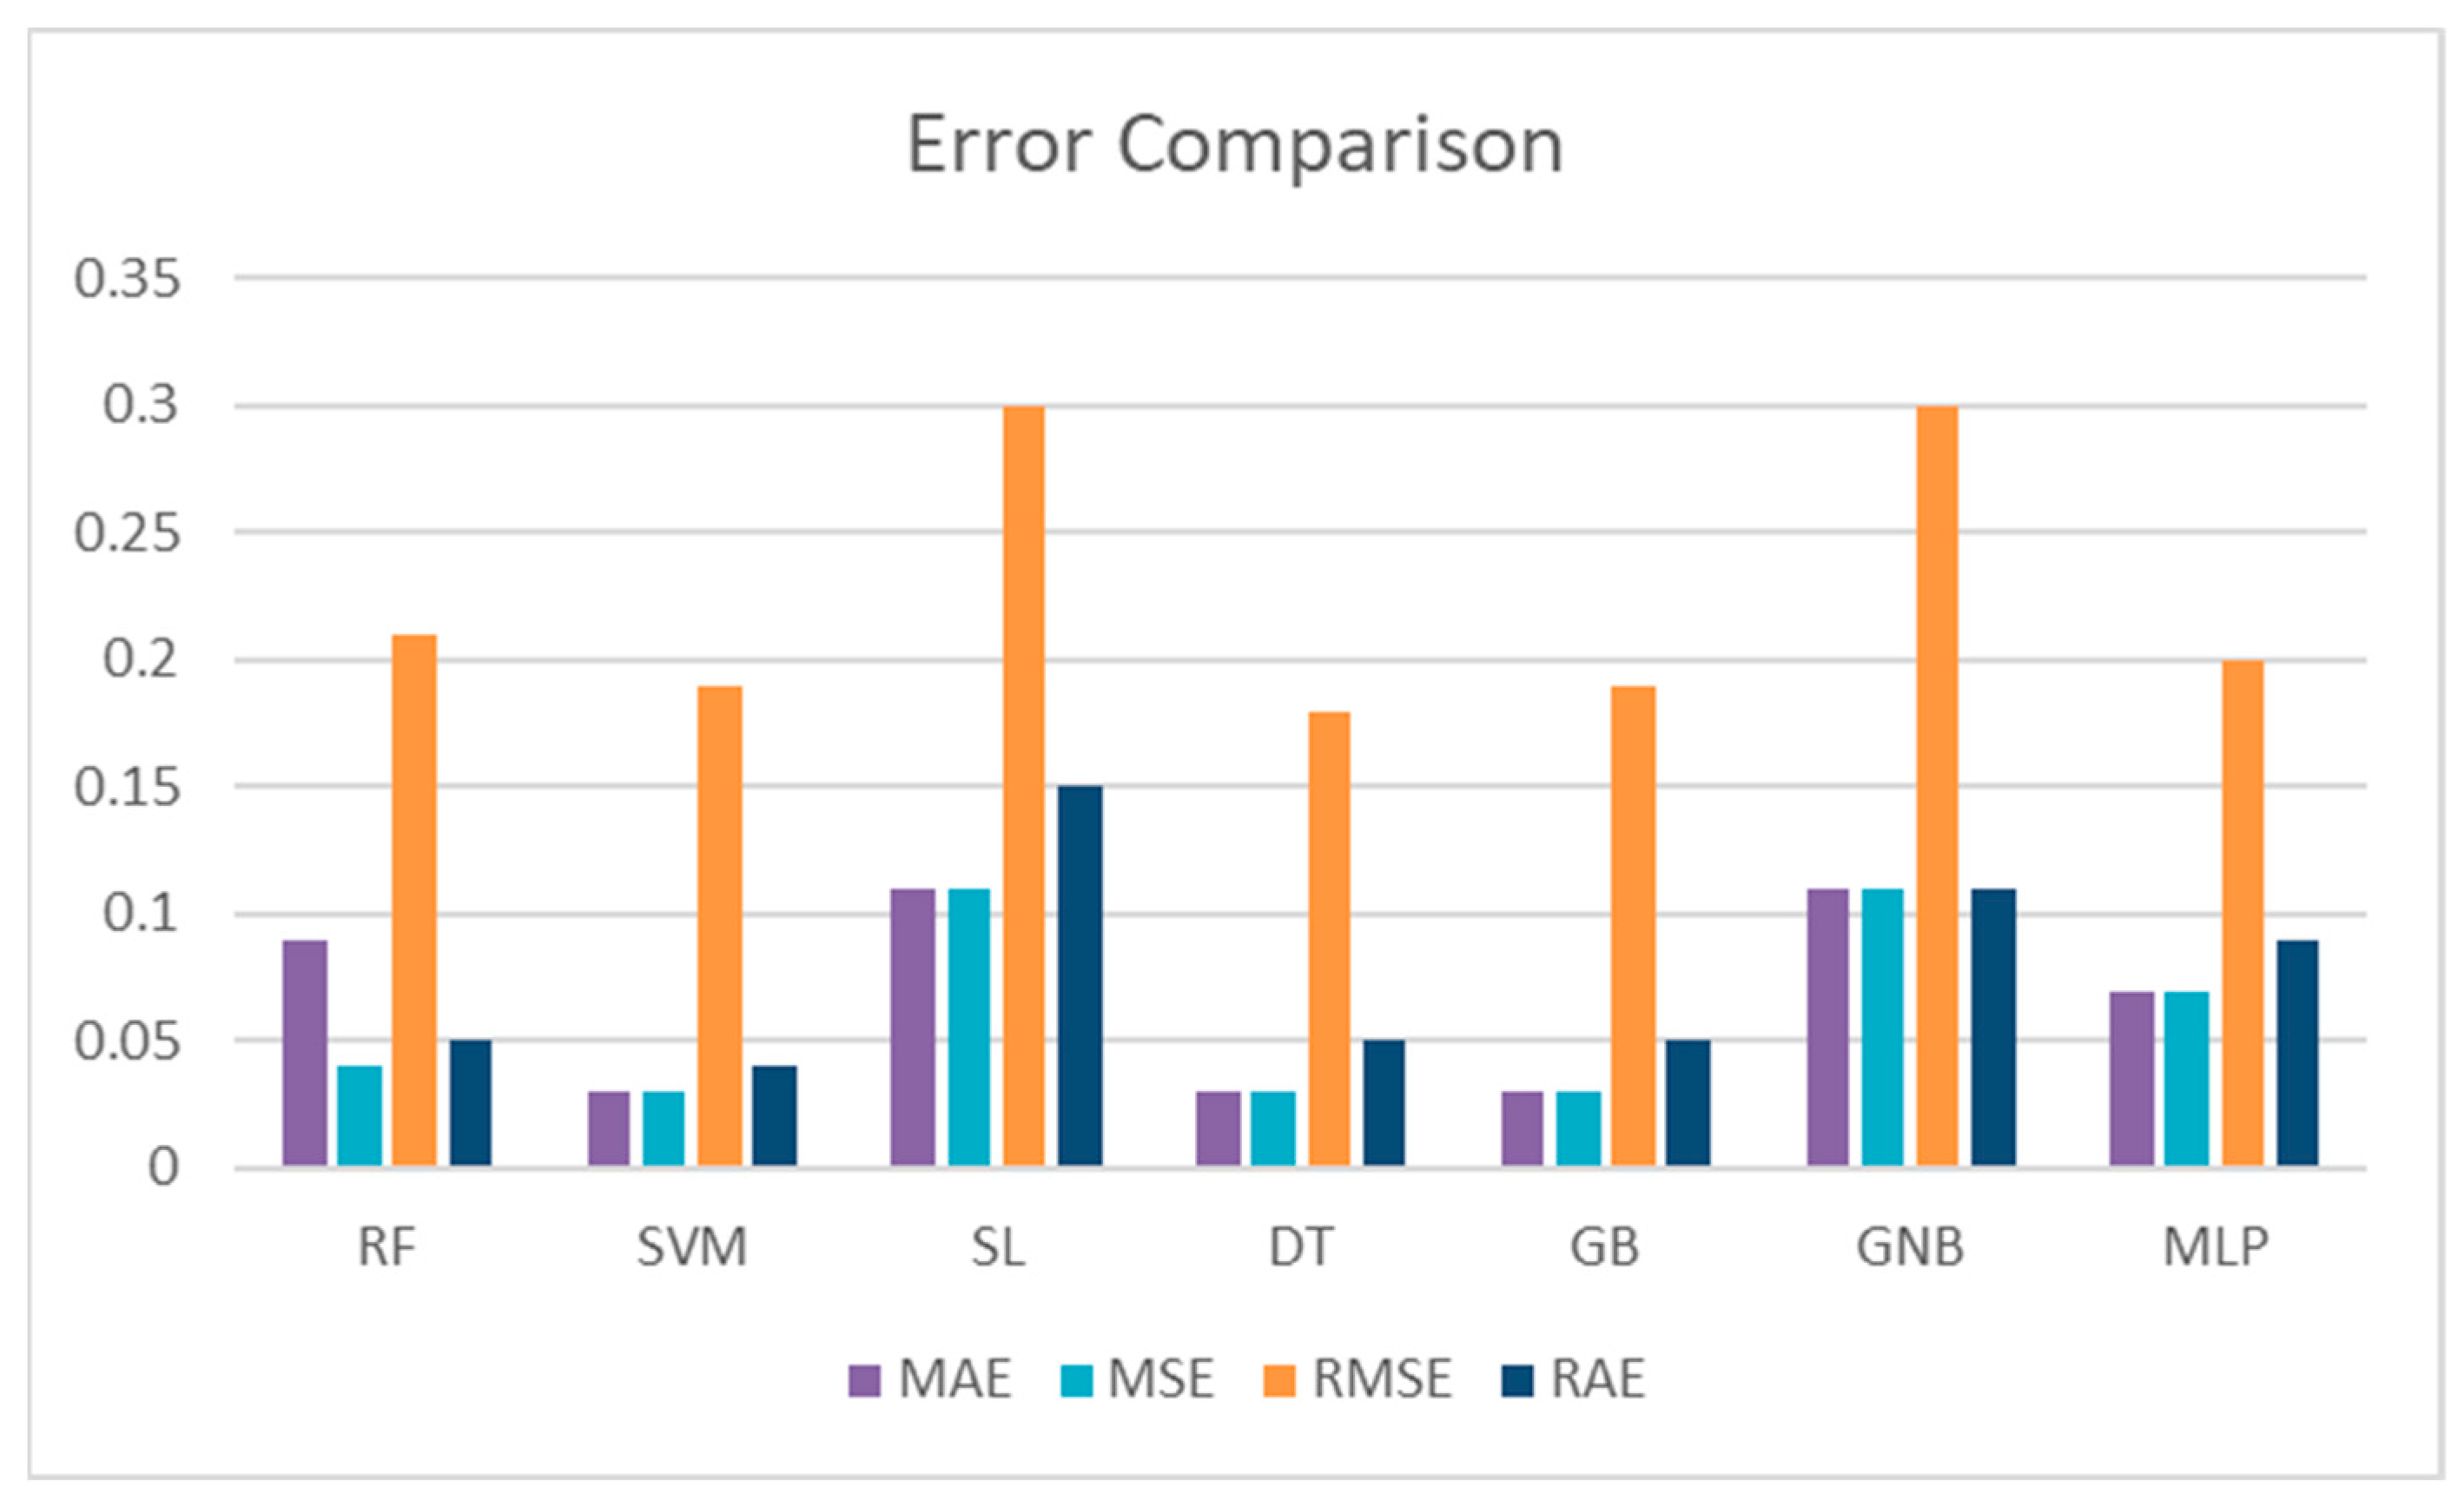
The tree-based classifiers outperformed the linear classifiers in terms of precision and recall. The GBM made predictions with 99% accuracy, and DT and RF made predictions positively with 98% accuracy. The GBM displayed a 97% recall rate of accurate predictions. With the dataset, the MLP achieved 96% accuracy, 95% precision, and 90% recall, performing well for multiclassification. The GBM outperformed the other classifiers when the prediction error was taken into account. The error measure comparison of the classifiers is shown in
Figure 8.
Regarding the error metrics, the lowest MAE, MSE, and RMSE scores for the DT and GBM classifiers were 0.03, 0.03, and 0.1, respectively, for both DT and GBM. The highest scores were seen in the LR classifier, which were 0.09, 0.09, and 0.3, respectively. The RAE scores ranged from 0.051 (DT and GBM) to 0.12 (LR). The highest AUC score was seen for the GBM classifier (0.97) and the lowest for the SVM classifier (0.92).
4.2. Second Experiment
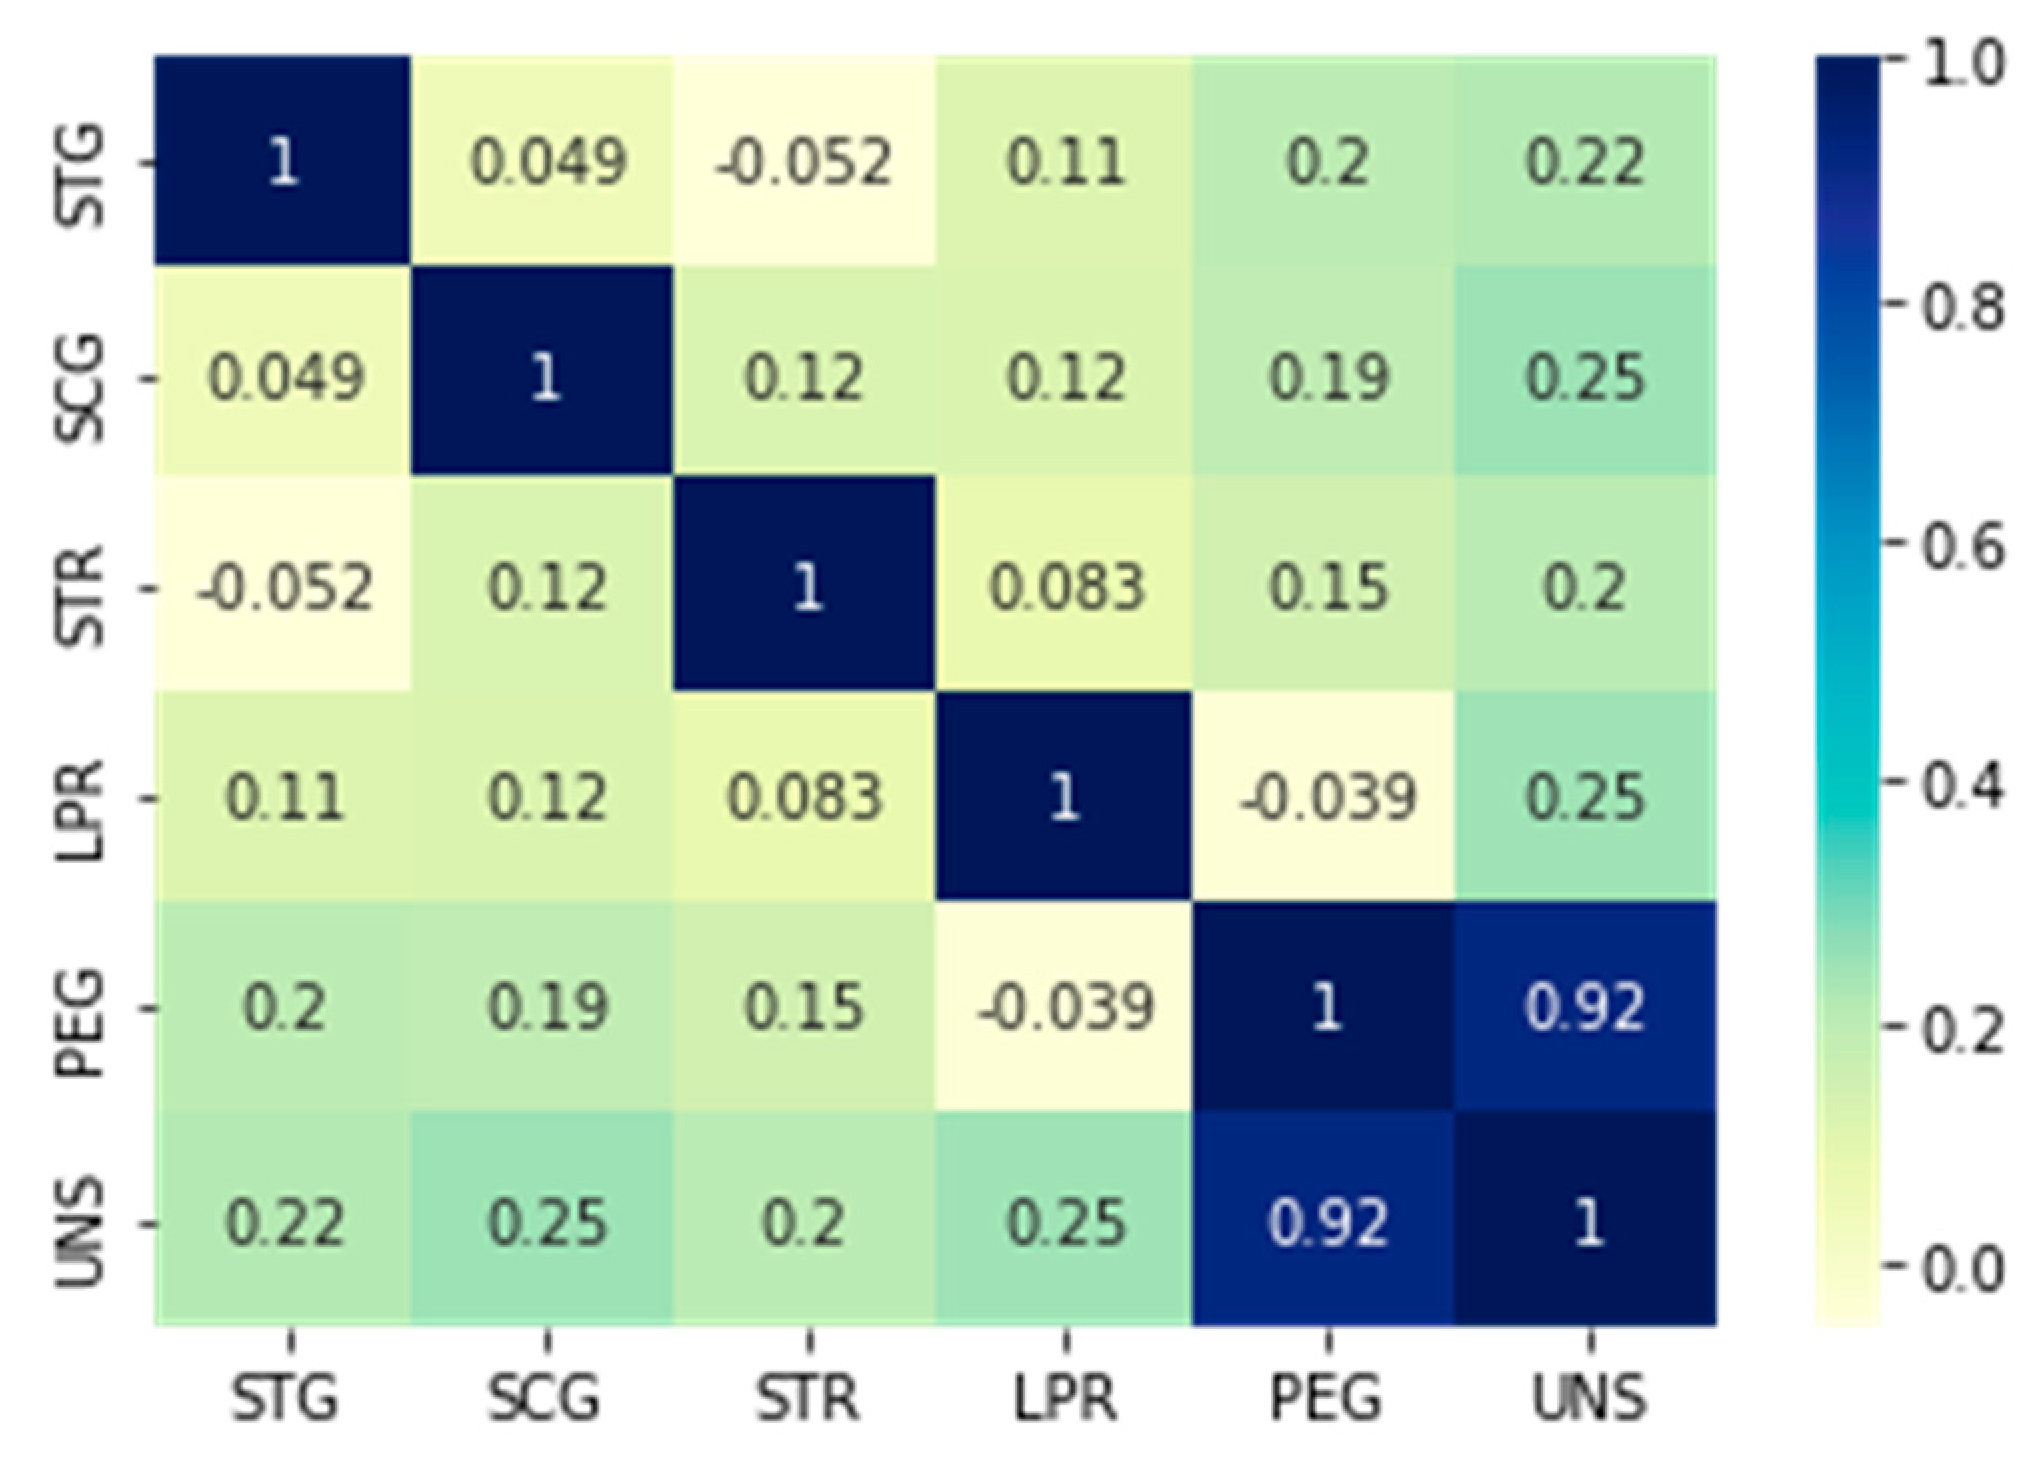
In the second experiment, correlation analysis was used to determine the impact of a more minor characteristic or feature collection. Here, we saw that the UNS, the student’s degree of knowledge, and the STR, or the amount of time the student spends on related learning materials, have just the slightest correlation. As a result, the feature vector was simplified to be composed of the following features: PEG, LPR, SCG, and STG. This condensed feature set produced a condensed dataset (Dataset 2). In this smaller dataset, the same methodology was used as in the initial experiment, and the same assessment criteria were used to calculate the results.
Table 6 contains the results from evaluating student performance using the seven different classifiers (RF, SVM, SL, DT, GBM, GNB, and MLP) on a reduced dataset (Dataset 2). With 98% accuracy, 99% precision, and 97% recall, the GBM performed better than all other classifiers, as seen in
Table 6. Compared to the other classifiers, the error rates for the GBM were also lower.
According to the table, the highest accuracy and AUC scores were achieved by the GBM and MLP classifiers, with a score of 0.98 for both. In addition, the precision and recall scores for GBM and MLP were also high, with a precision score of 0.99 and 0.95, respectively, and a recall score of 0.97 and 0.93, respectively.
The LR classifier had the lowest accuracy, precision, and recall scores, with an accuracy of 0.88, a precision of 0.86, and a recall of 0.84. The GNB classifier also had a lower accuracy score than the other classifiers, with a score of 0.88. The GBM and MLP were the strongest classifiers regarding accuracy and AUC scores, while the LR and GNB were relatively weaker. A visual representation of the performance comparison of the various classifiers with Dataset 1 can be found in
Figure 9 and
Figure 10, which demonstrate the peaks for the performance indicators.
4.3. Comparative Analysis
Analysis of the data from the first and second experiments revealed exciting findings. Almost no classifiers exhibited any discernible changes in prediction accuracy with a smaller feature set. It showed that the time required for related learning objects and the knowledge level corresponding to a goal learning object have less impact. Therefore, if we do not consider how long a student took to study other learning items, automatic knowledge assessment is still feasible, according to the results. Here, we took into account additional factors like student repetition rates, time, and score related to the goal learning objects. The results revealed a decline in prediction accuracy for the LR and GNB, demonstrating the classifier’s dependence on a minor contributing characteristic.
The error metrics, such as MAE, MSE, RMSE, RAE, and AUC, also showed similar patterns with Dataset 1 and Dataset 2, with the GBM classifier consistently performing the best among the seven classifiers. Overall, the GBM classifier performed the best among the seven classifiers in terms of accuracy, precision, recall, and other evaluation metrics.
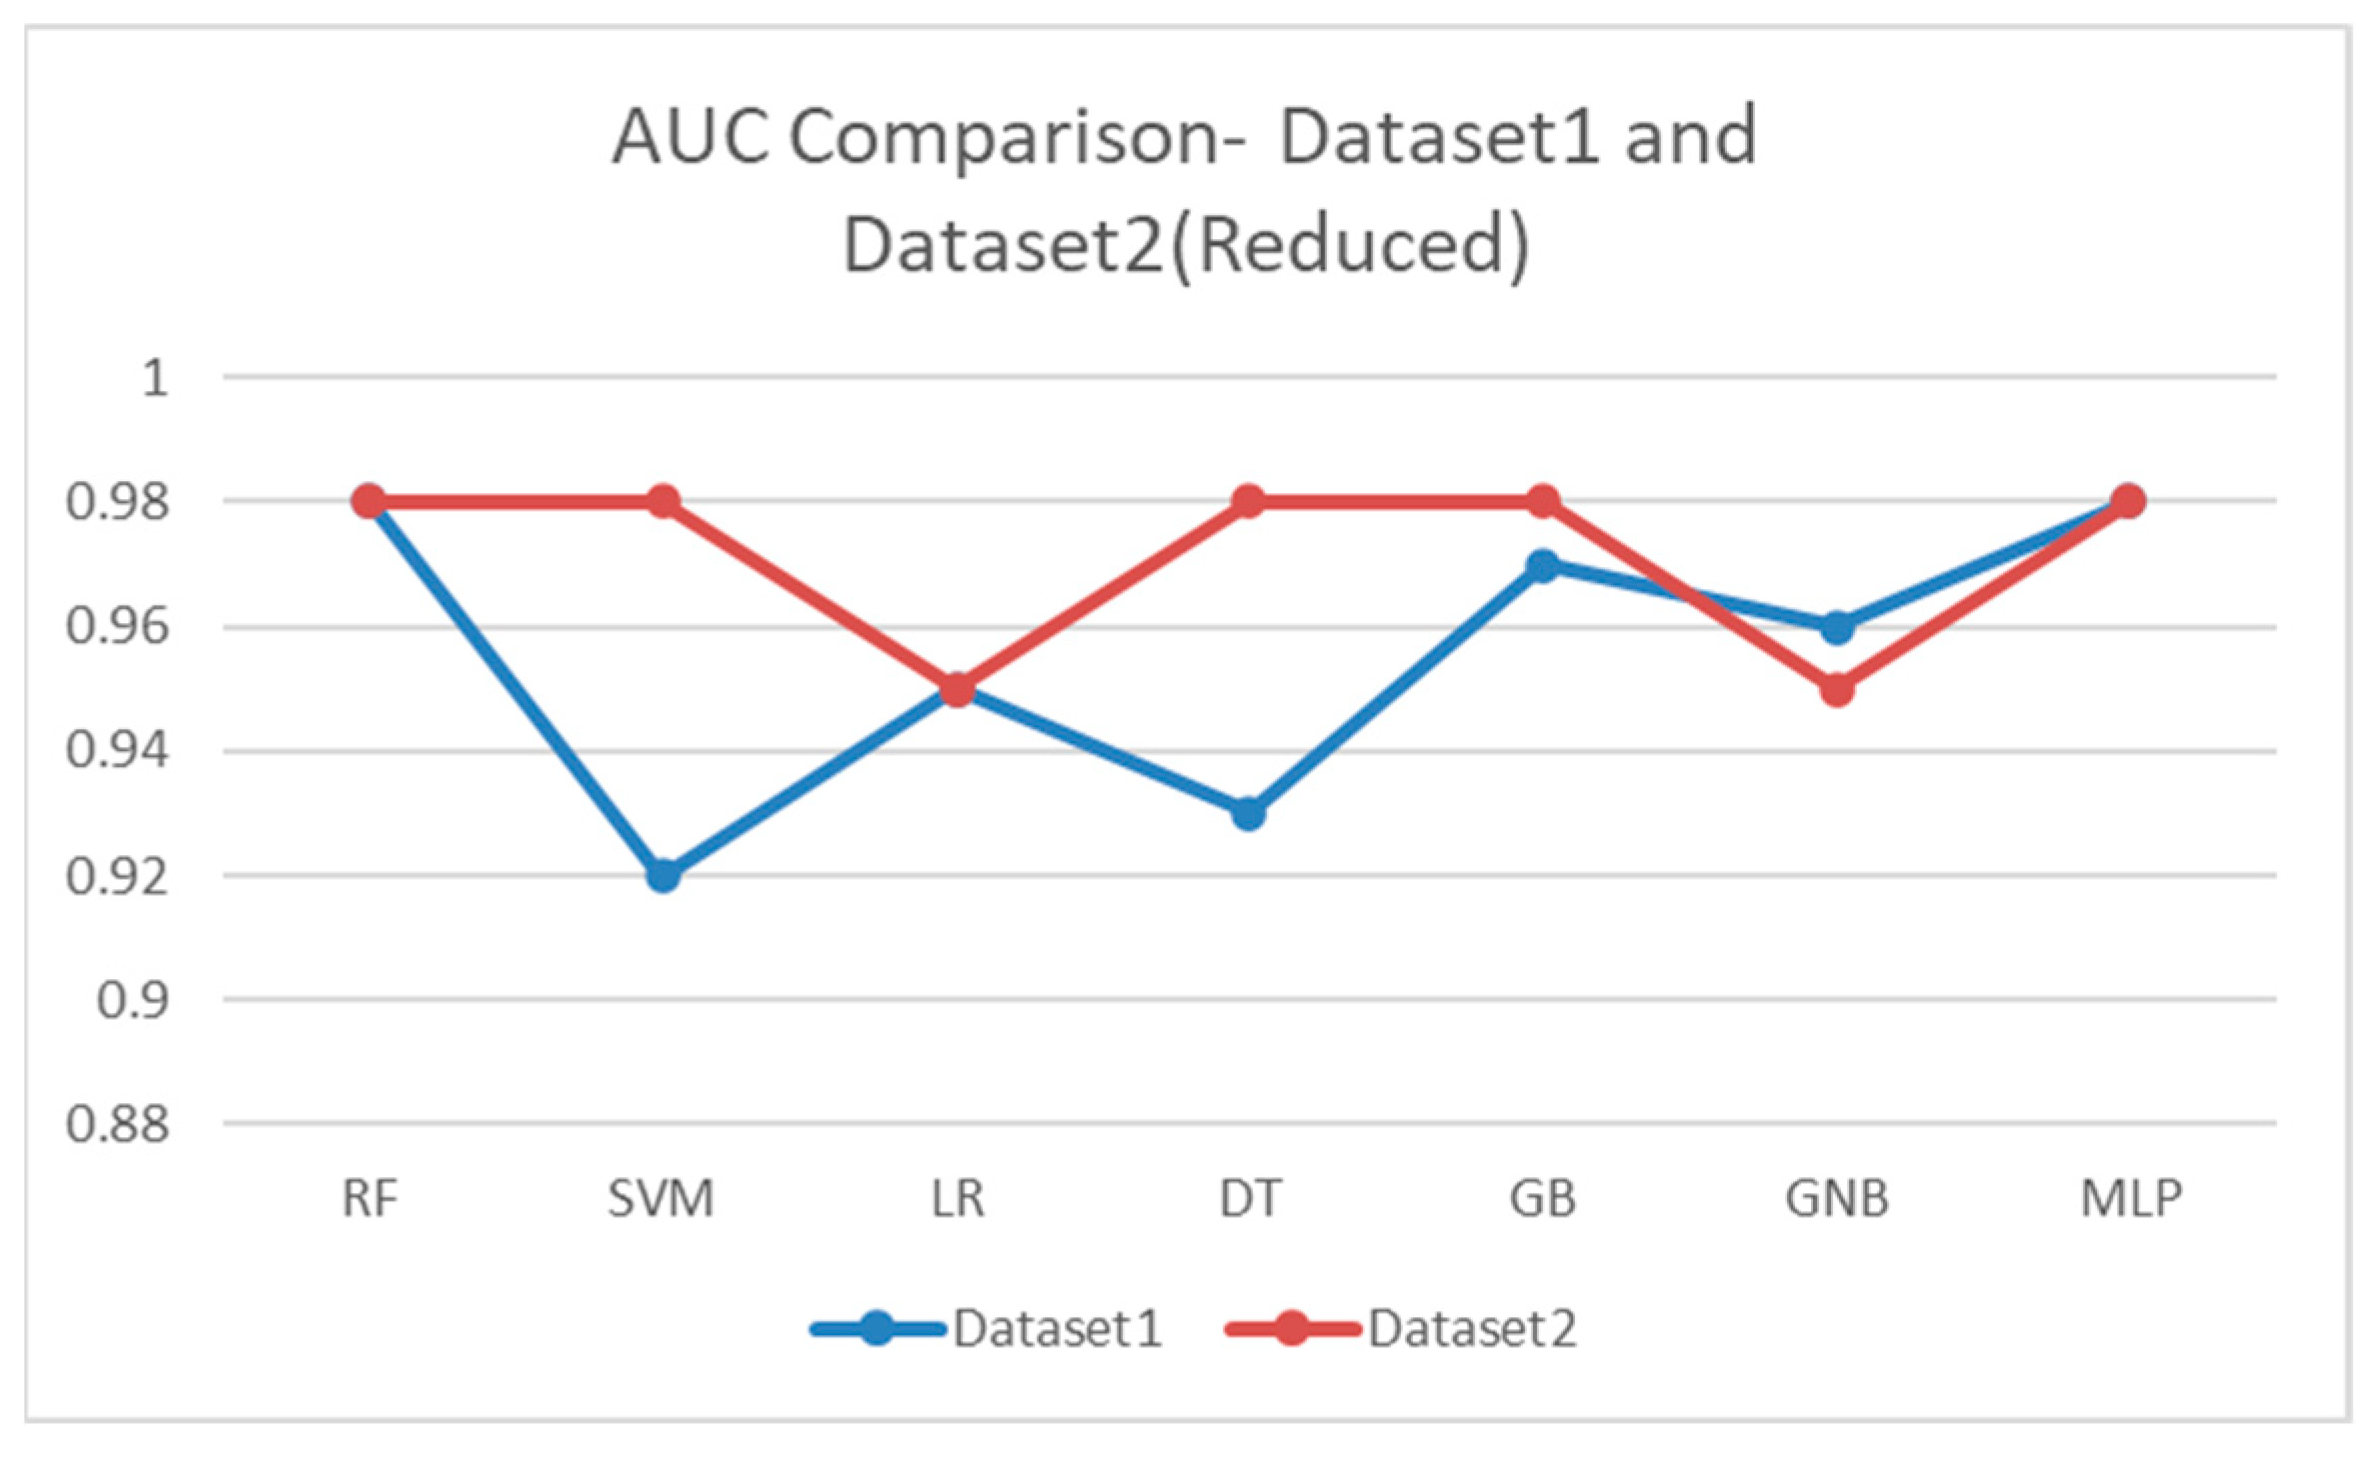
Figure 11 displays an AUC comparison of the two models using Datasets 1 and 2. In both experiments, we used the one-versus-rest AUC-ROC weighted to prevalence. The AUC results are encouraging in the trial with a smaller feature set. However, even when one attribute is avoided, the prediction systems exhibit exceptional discrimination.
The confusion matrix was used to assess the effectiveness of a classification model.
Table 7 shows the results from evaluating different ML classifiers on two datasets. Each classifier was evaluated by comparing its predicted results with the actual class labels of the instances in the datasets. The evaluation used performance metrics such as accuracy, precision, recall, and F1-score. For each classifier and each dataset, the table provides a confusion matrix. The matrix rows represent the actual class labels, and the columns represent the predicted class labels. The entries in the matrix indicate the number of instances that have been classified correctly (diagonal entries) and incorrectly (off-diagonal entries). The results show that the performance of the different classifiers varies for the two datasets. However, overall, the performance is relatively high for all the classifiers, with many instances being classified correctly.
The dataset used in this work serves as the source data for a novel model based on ML methods that forecasts student performance on the knowledge assessment. The effectiveness of the ML techniques, RF, k-NN, SVM, LR, GNB, and k-NN, was calculated and compared to predict the student’s performance.
In this case, both the GNB and the LR exhibited a decline in prediction accuracy. This shows that the time required for related learning objects and the knowledge level corresponding to a goal learning object have less impact. According to the findings, automatic knowledge assessment is also feasible if the learning time for the other items is not considered. Nearly all the classifiers did not exhibit any discernible changes in the performance of the predictions.
5. Discussion
This paper used a factual dataset from an e-learning system to build and evaluate different classification models for student knowledge assessment. The dataset was divided into two parts: 80% was used as training data, and the remaining 20% was used as test data. It is a common practice in ML to ensure that the model can generalize well to new data. All the experiments in this paper were run on Google Collaboratory, a cloud-hosted version of the Jupyter Notebook with Python 3.7.15. This platform provides a convenient and efficient way to run experiments, as it allows for easy access to powerful computational resources and a user-friendly interface.
The knowledge assessment modeling was conducted to classify students into four different classes. It was conducted to provide a more comprehensive evaluation of student performance and to identify areas where the student needed additional support or challenge. The classification was conducted using seven classifiers: SVM, LR, RF, DT, GBM, GNB, and MLP. Each classifier was trained and tested on the dataset, and the results were compared to determine which classifier performed the best.
It is important to note that the classification results are only one aspect of the overall evaluation of student performance. Other factors, such as student engagement and motivation, also play an essential role in determining student success. However, by using ML to evaluate student knowledge, this paper provides a new approach to the automatic classification of student knowledge, which can help identify areas of improvement and provide more accurate and efficient evaluations of student performance.
In this paper, the experimentation was conducted in two phases, as discussed in the section proposed methodology. The initial experiments were conducted with the dataset (Dataset 1) in its original form. In the later phase, following the correlation analysis, the least correlated variable was eliminated to form a reduced dataset. We employed seven distinct classifiers for modeling, as was covered in the technique section.
Table 5 presents the findings. Pictures of the performance comparison for various classifiers can be found in
Figure 7 and
Figure 8. The data in this input have five attributes: PEG, LPR, STR, SCG, and STG.
According to the data, the GBM exhibited the highest prediction accuracy, 98%. In terms of prediction error, the GBM also performed well. The RF, DT, and MLP were on a par with the GBM. However, the performance could be better when using linear classifiers like SVM or LR.
The tree-based classifiers outperformed the linear classifiers in terms of precision and recall. The GBM predictions had 99% accuracy, and the DT and RF predictions were positive with 98% accuracy. The MLP had 96% accuracy and 95% precision, and 90% recall, performing well for multiclassification. The GBM outperformed the other classifiers when the prediction error was considered (Dataset 1).
In the second experiment, correlation analysis was used to determine the impact of a more minor characteristic or feature collection. The outcomes are shown in
Table 6 and
Figure 9 and
Figure 10. This condensed feature set produced a condensed dataset (Dataset 2). As a result, the feature vector was simplified to be composed of the following features: PEG, LPR, SCG, and STG. The second experiment’s advantage was that it allowed for more efficient use of data by identifying the minor correlated variables and removing them from the dataset to create a smaller dataset (Dataset 2). It allowed for more focused analysis and allowed the researchers to see the impact of a minor feature set on the performance of the classifiers.
Additionally, by conducting the same experiment on a smaller dataset, the researchers can compare the results and see if there are any discernible changes in the prediction accuracy. The results of the second experiment showed that almost no classifiers exhibited any tangible changes in the prediction accuracy with a smaller feature set, which suggests that the time required for related learning objects and the knowledge level corresponding to a goal learning object have less of an impact on the automatic knowledge assessment. Therefore, automated knowledge assessment is only feasible when considering how long a student takes to study other learning items. It can be conducted by considering additional factors like student repetition rates, time, and scores related to the goal learning objects.
As shown in
Table 6, the GBM outperformed all the other classifiers with 98% accuracy, 99% precision, and 97% recall. In addition, the error rates for the GBM were also reduced compared to those of the different classifiers.
The AUC comparisons for the two models utilizing Datasets 1 and 2 are shown in
Figure 11. We applied the one-versus-rest AUC-ROC weighted to prevalence in both experiments. The AUC findings in the trial with a lower feature set are promising. Despite avoiding one attribute, the prediction systems demonstrated outstanding discrimination.
Table 7 shows the confusion matrix used to assess the effectiveness of a classification model. The findings show that automatic knowledge assessment is also feasible if learning time for other items is not considered. Next, the efficacy of the ML techniques RF, nearest neighbor, SVM, LR, GNB, and k-nearest neighbor were calculated and compared to predict the student’s performance. Here, naive Bayes, nearest neighbor, SVM, LR, and k-nearest neighbor were used to predict the student’s performance on the knowledge assessment.
The study provides a new approach to the automatic classification of student knowledge by using ML techniques. Unlike traditional methods that rely on subjective evaluations, the study uses a factual dataset from an e-learning system. In addition, it employs seven different classifiers to classify students into four other classes. The study results show that the GBM classifier exhibits the highest prediction accuracy of 98% and performs well regarding prediction error. The study also conducted two experiments to understand the impact of reducing the feature vector on the prediction accuracy of classifiers, which is rare in the existing literature.
The study also provides a more efficient use of data by identifying the minor correlated variables and removing them from the dataset to create a smaller dataset (Dataset 2). It allows for more focused analysis and allows the researchers to see the impact of a smaller feature set on the performance of the classifiers. Additionally, by conducting the same experiment on a smaller dataset, the researchers were able to compare the results and see if there were any discernible changes in prediction accuracy. Overall, the study provides a new approach to automatically classifying student knowledge, using ML to evaluate student performance and knowledge. It also provides more efficient use of data by identifying the least correlated variables and removing them from the dataset. The study results are also compared with the existing literature to understand the impact of the methodology and its effects on the existing literature.
There are a few potential limitations that can be inferred. For example, one limitation could be that the study only uses a single dataset from a specific e-learning system, which may need to be more generalizable to other educational settings or e-learning systems. Another limitation could be that the study focuses on some particular classification algorithms and does not use other potential methods. Additionally, the study may not consider other factors influencing student performance and knowledge, such as socio-economic background, prior knowledge, and motivation.
The purpose of this study was to develop a machine learning-based system that can accurately assess student performance and knowledge throughout the course of their studies. By analyzing large amounts of data on student performance and identifying the key variables that have the most significant effects on that performance, educators and institutions can gain insights into how to better support their students. One of the benefits of this study is that it allows educators to tailor their instruction and resources to meet the specific needs of each student. By identifying areas where students need additional support or challenge, educators can provide more targeted interventions that can help students succeed. This can help reduce the waste of resources and optimize their use, leading to a more sustainable educational system. In addition, by using ML techniques, this research paper demonstrates the effectiveness of educational technologies that can be used to further reduce the environmental impact of traditional teaching methods. For example, online learning platforms can reduce the need for physical classrooms and textbooks, which can lead to significant resource savings and reduced waste. Overall, this study shows how the use of ML techniques can help organizations and institutions improve their resource utilization in an optimized way to maintain sustainability. By tailoring instruction and resources to meet the specific needs of each student, and by using more sustainable educational technologies, we can create a more sustainable educational system that is better equipped to meet the needs of both current and future generations.
There are several potential areas for future research. One option is to expand the study to include a more extensive and diverse dataset from multiple e-learning systems to increase the generalizability of the findings. For example, it could consist of data from different educational institutions, countries, and student populations, which could provide a more comprehensive understanding of how the features identified in this study impact student performance and knowledge in different contexts. Another option is to explore classification algorithms or techniques beyond the ones used in this study, such as deep learning or ensemble methods, to see if they yield better results. Future research could also consider other factors that influence student performance and knowledge, such as socio-economic background, prior knowledge, and motivation, and how they interact with the features considered in this study. Finally, this research opens up the possibility of developing an ML-based system that educators can use to monitor and improve student performance and knowledge throughout the investigations.
6. Conclusions
The ability to forecast student performance might help teachers pinpoint students’ weaknesses, so they can raise test scores and improve learning. This study examined the most recent ML algorithms to forecast student academic performance. The study used various evaluation techniques to assess the categorization model. The features were chosen based on correlation analysis to determine the best set of characteristics that contribute to the automatic knowledge classification of pupils. The e-learning dataset was employed in this study to highlight several performance aspects. The SVM, RF, DT, GBM, LR, GNB, and MLP were the classifiers used to create the knowledge evaluation model. The experiments were conducted on Google Collaboratory, a cloud-hosted Jupyter Notebook with Python 3.7.15 as the platform. In this study, the various categorization models are constructed and assessed using factual data from an e-learning system.
The results showed that the GBM outperformed the other classifiers in prediction accuracy and error rate, with 98% accuracy, 99% precision, and 97% recall. The findings also suggest that the time required for related learning objects and the knowledge level corresponding to a goal learning object have less impact on the automatic knowledge assessment. The results of the AUC comparisons of the two models were promising, demonstrating outstanding discrimination. The study provides evidence that automated knowledge assessment is feasible without considering learning time for other learning items and can be conducted by taking into account additional factors like student repetition rates and time and scores related to the goal learning objects. Finally, the study highlights the importance of incorporating ML into student performance evaluation and the potential of using this approach to identify areas for improvement and provide more accurate and efficient evaluations of student performance.
To account for the proportion of students’ attention, each sub-component, as mentioned earlier, can be calculated separately for future research, or all components could be combined to create a comprehensive and precise attention requirement. It is easy to do this work thanks to the ML technique. Using algorithms like deep learning, it is possible to monitor students’ responses to classroom stimuli and test performance. This technique allows students to maintain their focus in class because the system will alert them if they are not paying attention. Additionally, the specific percentage of sustained, focused, and selective attention will be discovered. The data received from the system is accurate and free of bias or human mistakes. As a result, the evaluation criterion for attentiveness will be more accurate.


