Article

Electrical Efficiency Investigation on Photovoltaic Thermal Collector with Two Different Coolants

by
Emad Abouel Nasr
1,
Haitham A. Mahmoud
1,
Mohammed A. El-Meligy
1,
Emad Mahrous Awwad
2,
Sachin Salunkhe
3,
Vishal Naranje
4,
R. Swarnalatha
5 and
Jaber E. Abu Qudeiri
6,*
1
Industrial Engineering Department, College of Engineering, King Saud University, Riyadh 11421, Saudi Arabia
2
Electrical Engineering Department, College of Engineering, King Saud University, Riyadh 11421, Saudi Arabia
3
Vel Tech Rangarajan Dr Sagunthala R&D Institute of Science and Technology, Chennai 600062, India
4
Mechanical Engineering Department, Amity University, Dubai P.O. Box 345019, United Arab Emirates
5
Electrical & Electronics Engineering Department, Birla Institute of Technology & Science, Pilani, Dubai Campus, Dubai P.O. Box 345055, United Arab Emirates
6
Mechanical Engineering Department, College of Engineering, United Arab Emirates University, Alain P.O. Box 15551, United Arab Emirates
*
Author to whom correspondence should be addressed.
Sustainability 2023, 15(7), 6136; https://doi.org/10.3390/su15076136
Submission received: 11 February 2023 / Revised: 6 March 2023 / Accepted: 24 March 2023 / Published: 3 April 2023

Abstract

:
The design and development of a photovoltaic thermal (PVT) collector were developed in this study, and electrical and electrical thermal efficiency were assessed. To improve system performance, two types of coolants were employed, liquid and liquid-based MnO nanofluid. Flow rates ranging from 1 to 4 liters per minute (LPM) for the interval of 1.0 LPM were employed, together with a 0.1% concentration of manganese oxide (MnO) nanofluid. Various parametric investigations, including electrical power generation, glazing surface temperature, electrical efficiency, and electrical thermal efficiency, were carried out on testing days, which were clear and sunny. Outdoor studies for the aforementioned nanofluids and liquids were carried out at volume flow rates ranging from 1 to 4 LPM, which can be compared for reference to a freestanding PV system. The research of two efficiency levels, electrical and electrical thermal, revealed that MnO water nanofluid provides better photovoltaic energy conversion than water nanofluid and stand-alone PV systems. In this study, three different domains were examined: stand-alone PV, liquid-based PVT collector, and liquid-based MnO nanofluids. The stand-alone PV system achieved a lower performance, the liquid-based MnO performed better, and the liquid-based PVT achieved an intermediate level.

1. Introduction

Global accords aimed at reducing greenhouse gas (GHG) emissions have been widely praised in recent years by governments worldwide [1,2,3]. This issue is gaining traction, especially in oil-rich Middle Eastern nations such as Saudi Arabia, the United Arab Emirates, and Iran, which have put considerable expenditure into developing their solar energy potential. They suggest enhancing the use of various renewable energy resources such as solar, wind, bioenergy, and others [4,5], and among these, solar energy is popular. It has the advantage of being free of charge, feasible, durable, has a low maintenance cost, is environmentally sound, and has diverse applications. Nonetheless, it has its drawbacks. For example, increasing the temperature of the solar panel by 10 °C produces a 0.5% decrease in electrical efficiency for silicon cells, and cooling the solar panel may be required for improved efficiency.
Air or water may be used as a cooling liquid to cool the solar panel temperature [6,7,8,9,10,11]. The performance of the solar panel may be improved in two ways. First, solar panel cooling is a medium for waste heat storage. As a traditional cooling method, air and water usually cool the solar panel. Nevertheless, it has its virtues and merits. Because of the above, many researchers are using nanomaterials as a superior cooling fluid to boost thermal and electrical performance. Consequently, general performance can be improved, and successful studies worldwide have been conducted.
Choi and Estman [12] introduced nanofluids as a cooler in PVT systems, sparking interest due to their better thermos-physical characteristics compared to standard fluids. Nanofluids are solid–liquid synthesized, consisting of nanoparticles with diameters typically ranging from 1–100 nm drifting in water [13]. Many tests have shown that water nanofluids have a considerably higher heat transfer coefficient than basic fluids [14,15,16]. However, the heat transfer enrichment when utilizing nanofluids in photovoltaic thermal collectors has a few weaknesses, namely, a pressure drop of the system [17], a restricted period of stability, and the cost of nanoparticles being higher.
Sardarabadi et al. [18] experimented with using water as a base for SiO2 nanofluid, at various concentrations, in PVT systems. They concluded that total performance was attained at 3.6% for 1 wt% and 7.9% for 3 wt%, which were compared with PVT water only. Ghadiri et al. [19] used an indoor PVT system to analyze water and ferrofluid with various compositions. Compared to a hybrid system, the overall efficiency was 45%. Sardarabadi et al. [20] presented three kinds of nanoparticles (MnO, TiO2, ZnO) with deionized water with a concentration of 0.2 wt%.
Al-shamani et al. [21] researched various nanofluids, experimenting with various flow rates. The results show that SiC attained the highest electrical performance, about 13.52%, and also reached the greatest overall efficiency of 78.24%. Soltani et al. [22] conducted an investigational study in a hybrid system using water nanofluid, determining that total enactment and power generation were enriched by 3.13% and 52.4%, respectively. The authors also revealed that utilizing the SiO2 enhanced total performance and power generation, at rates of 3.29% and 43.36%, correspondingly. Al-Waeli et al. [23] presented the influence of Silicon chloride/water nanofluid on the hybrid system, which was enhanced to 23.9% and 99.23% in terms of electrical and heat power efficiency, respectively. They also found a superior overall performance of about 88.9% compared with the PV system.
Mohammad Sardarabadi et al. [18] investigated the silica nanofluid and its efficiency in PVT systems, which showed an improvement in overall efficiency and exergy of about 7.9% and 24.3%, respectively. Ag/water nanofluid was processed via an electrical wire explosion for long-term stability [24,25]. Srimanickam et al. [26] investigated the energy and exergy efficiency of various air channel configurations with two types of air mass flow rates. The results showed that electrical, thermal, and exergy efficiency were obtained at 13.9%, 25.9%, and 49.4%, respectively. Srimanickam et al. [27] experimented with five types of mild steel air channels with two kinds of mass flow rates. The results showed that electrical and thermal efficiencies were attained at 14.27% and 20.81%, respectively.
Solar cells typically operate at 60–80% electrical efficiency in field conditions, equating to 9.5–10.5%, which may increase by 10–30% if chilled [28]. Ibrahim et al. [29] tested the PVT collector, including the installed spiral flow absorber, for heat transfer activities. The experiment results revealed that both photovoltaic and thermal systems were more effective. When the amount of solar radiation was 1321 W/m2, the total and electrical efficiency of PVT were 65 and 12%, correspondingly. Alzaabi et al. [30] conducted an experimental study to demonstrate how photovoltaic modules enhanced electricity efficiency through efficiently utilizing PVT water cooling. This system was designed to monitor thermal and electrical efficiency in the environment of a Middle Eastern country.
A polycrystalline photovoltaic module was linked to a heat collector in the hybrid system. Additionally, the test included chilled and passively cooled PV module performance. The experiment’s findings revealed an increase in efficiency of 15% and 20% in electric and thermal outputs, respectively, and 60% and 70% in total and exclusive of cooling operations. Hussain et al. [31] built an experimental PVT system of honeycomb construction. The study used a coherent system comprising solar heat and photovoltaic modules. System efficiency was boosted by putting heat exchangers alongside the solar unit and using air as a receiver. Electrical and thermal efficiencies were 37.0% and 9.0%, respectively, including and excluding the honeycomb.
Wang et al. [32] created and tested a sophisticated dual PVT system based on air. The experiment results show that the efficiency of oscillatory absorbers increased to 15.0%, compared to the moderate efficiency of heat-collecting at 43.8%. These results were obtained at an ambient temperature and irradiance of roughly 70 degrees Celsius and 582 watts per square meter, with an electrical efficiency of 6% and thermal efficiency of 36.2%. Buonomano et al. [33] investigated the electrical efficiency of PVT and conventional solar modules using an economic comparison. Four unglazed flat-structure PVT systems for polycrystalline silicone were created as part of the system. PV has a 17.9% electrical efficiency and a 26.0% overall efficiency (11.6% electrical and 14.4% thermal efficiency).
The electrical and thermal efficiencies of PVT were 26.0% and 13.0%, respectively. Sahin et al. [34] used energy and exergy calculations to investigate the thermodynamic parameters of a solar panel. They observed that energy efficiency varied from 7% to 11%, and exergy ranged from 2% to 8%. Gaur et al. [35] investigated a mathematical model for electrical and thermal assessments of a liquid-based photovoltaic heating system with and without phase transition material.
In this study, the electrical energy and electrical thermal energy were carried out in the liquid and liquid-based MnO nanofluids at a flow rate of 1–4 LPM. The novelty of this investigation is using a liquid-based MnO nanofluid as a coolant. This type of nanofluid has been shown to have superior thermal properties compared to traditional coolants, including higher thermal conductivity and improved heat transfer. Using more effective coolants in PVT systems potentially increases energy production and cost savings. The concentration of liquid-based MnO used in this study was 0.1%, which enhances performance better than a liquid-based PVT system. The following parametric studies also handled electrical power generation, glazing surface temperature, electrical efficiency, and electrical thermal efficiency. These studies correlate highly with previous literature studies.

2. Experimental Details

2.1. Study Area

The results come from tests conducted at Avadi, near Chennai (the capital of Tamil Nadu, Southern India). The study site is coordinated at 13.0827° N, 80.2707° E. Under Köppen’s Climate Classification, Chennai has a tropical wet–dry summer and dry climatic conditions. The city is on the thermal equator and on the coast, which keeps seasonal temperatures from significantly varying. With an average relative humidity of 69%, the average environmental temperature varies from 24.8 °C to 33.1 °C, and average sunshine hours are 7.8.

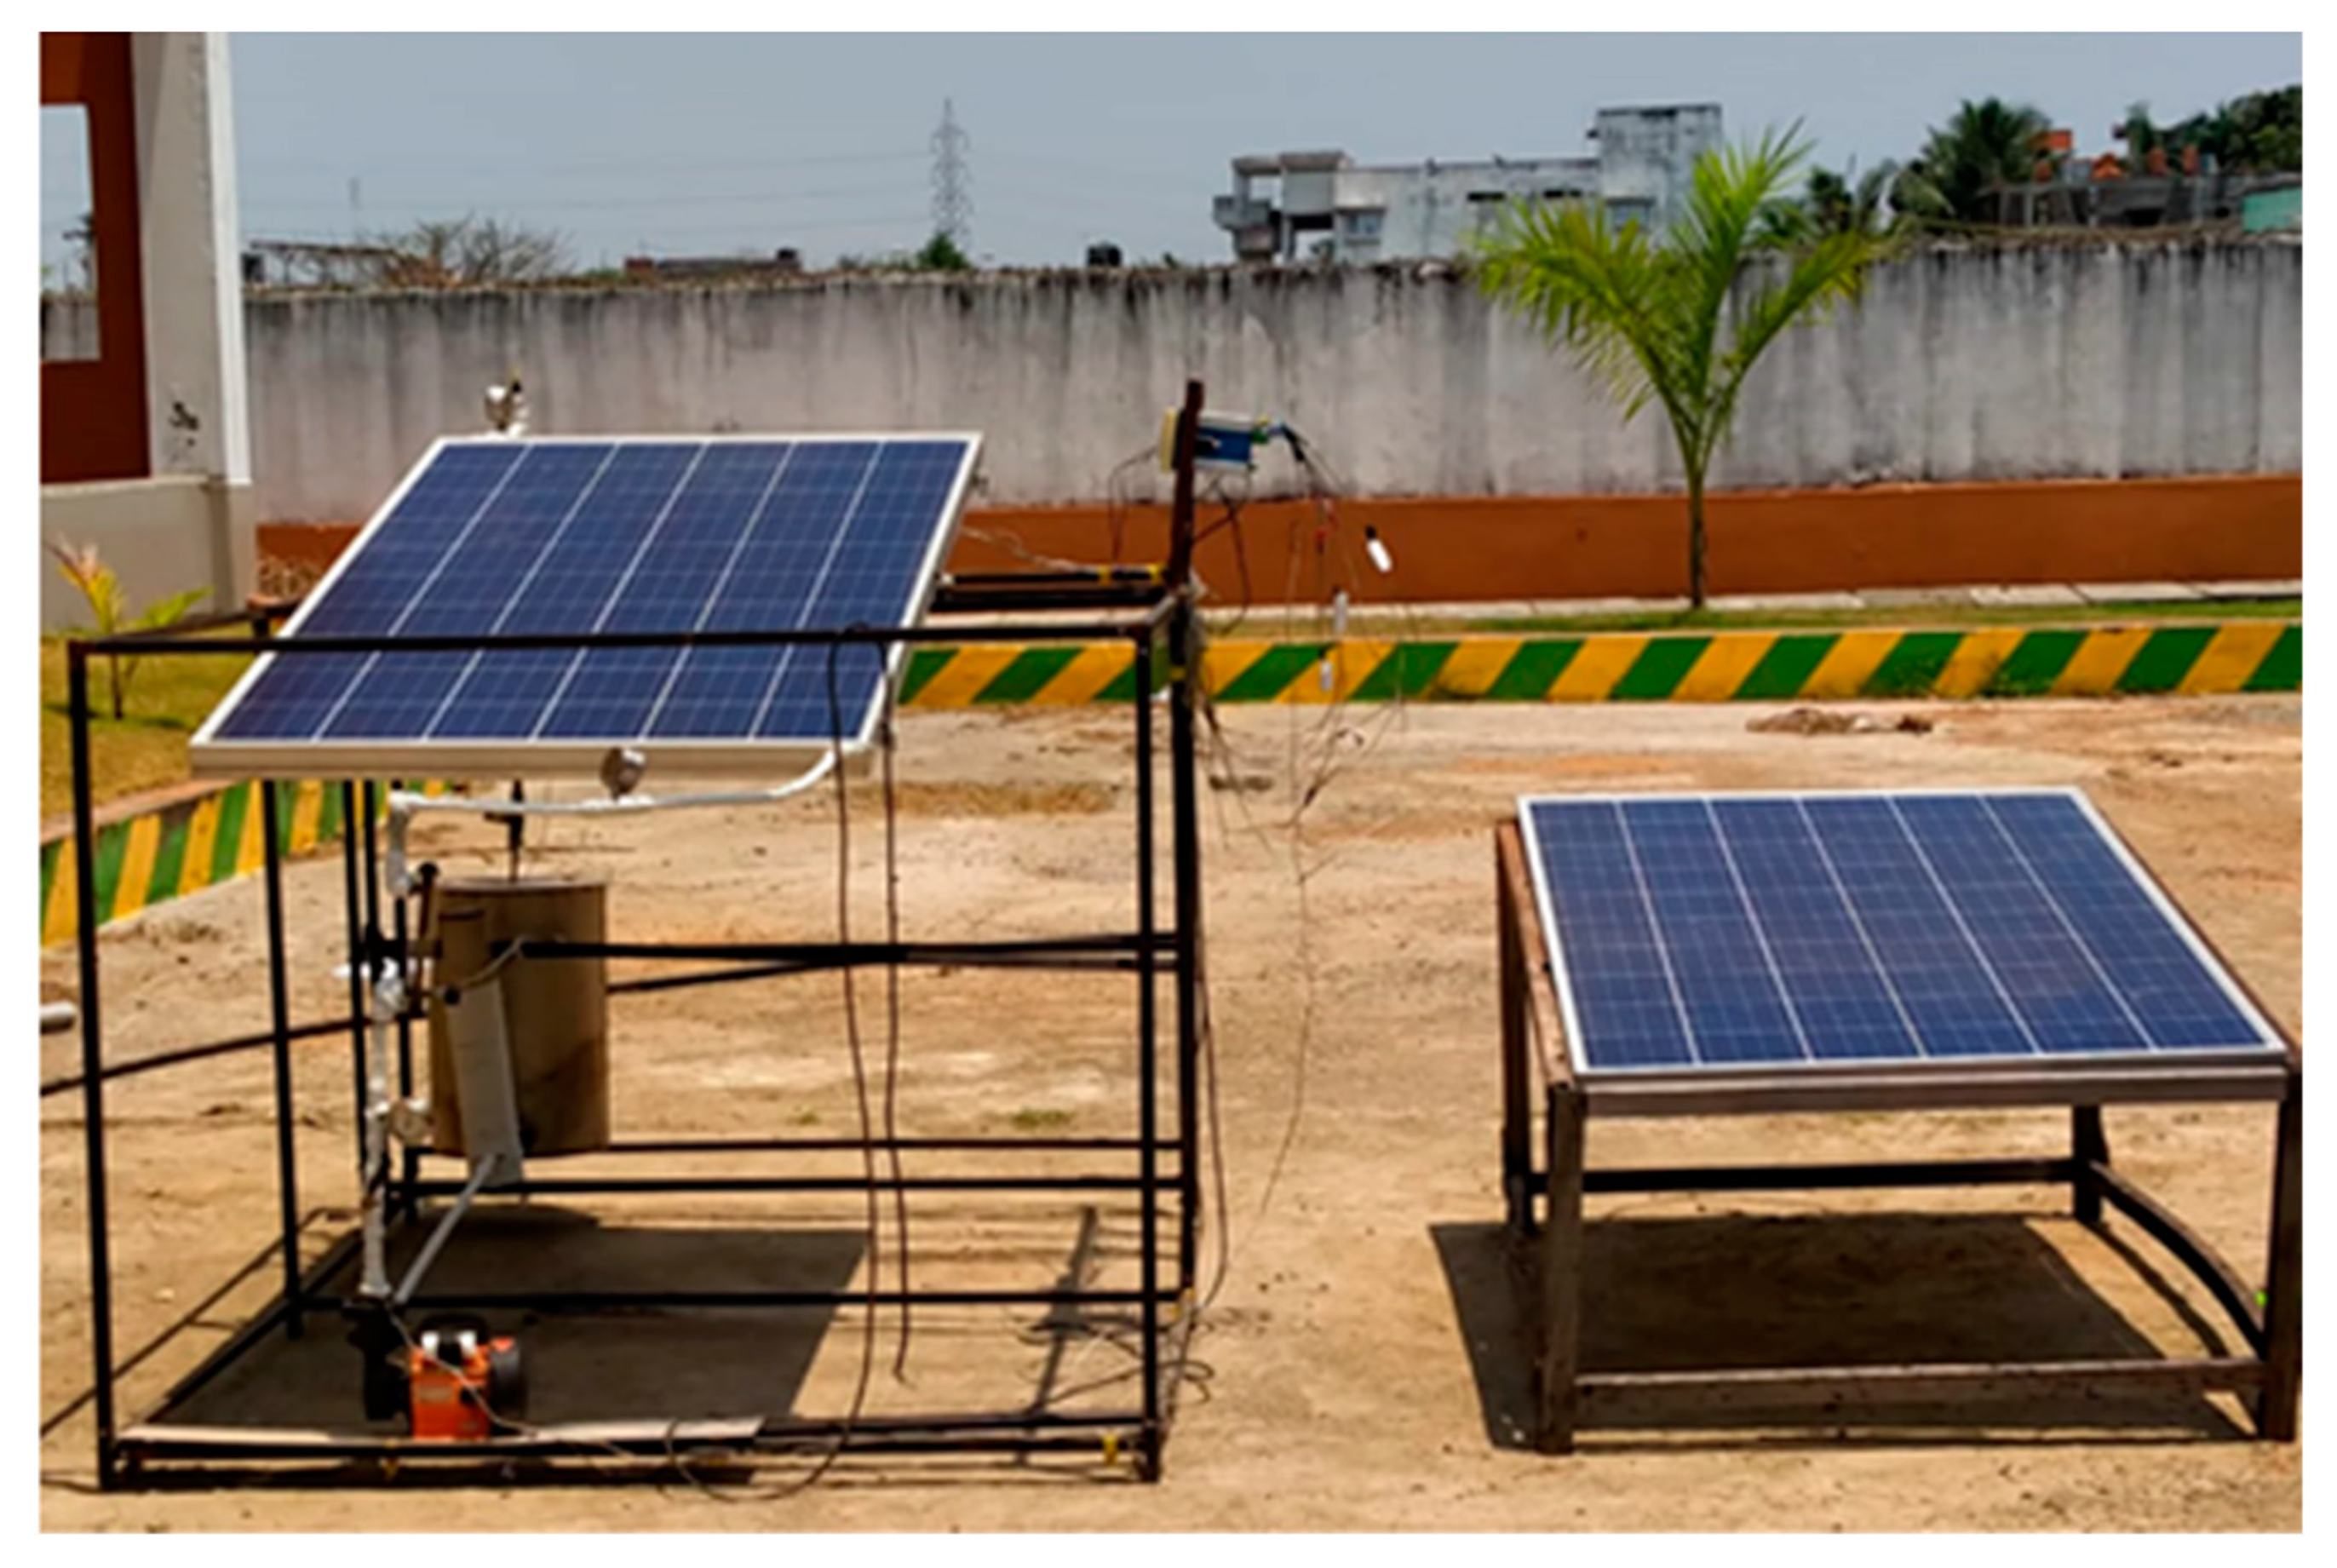
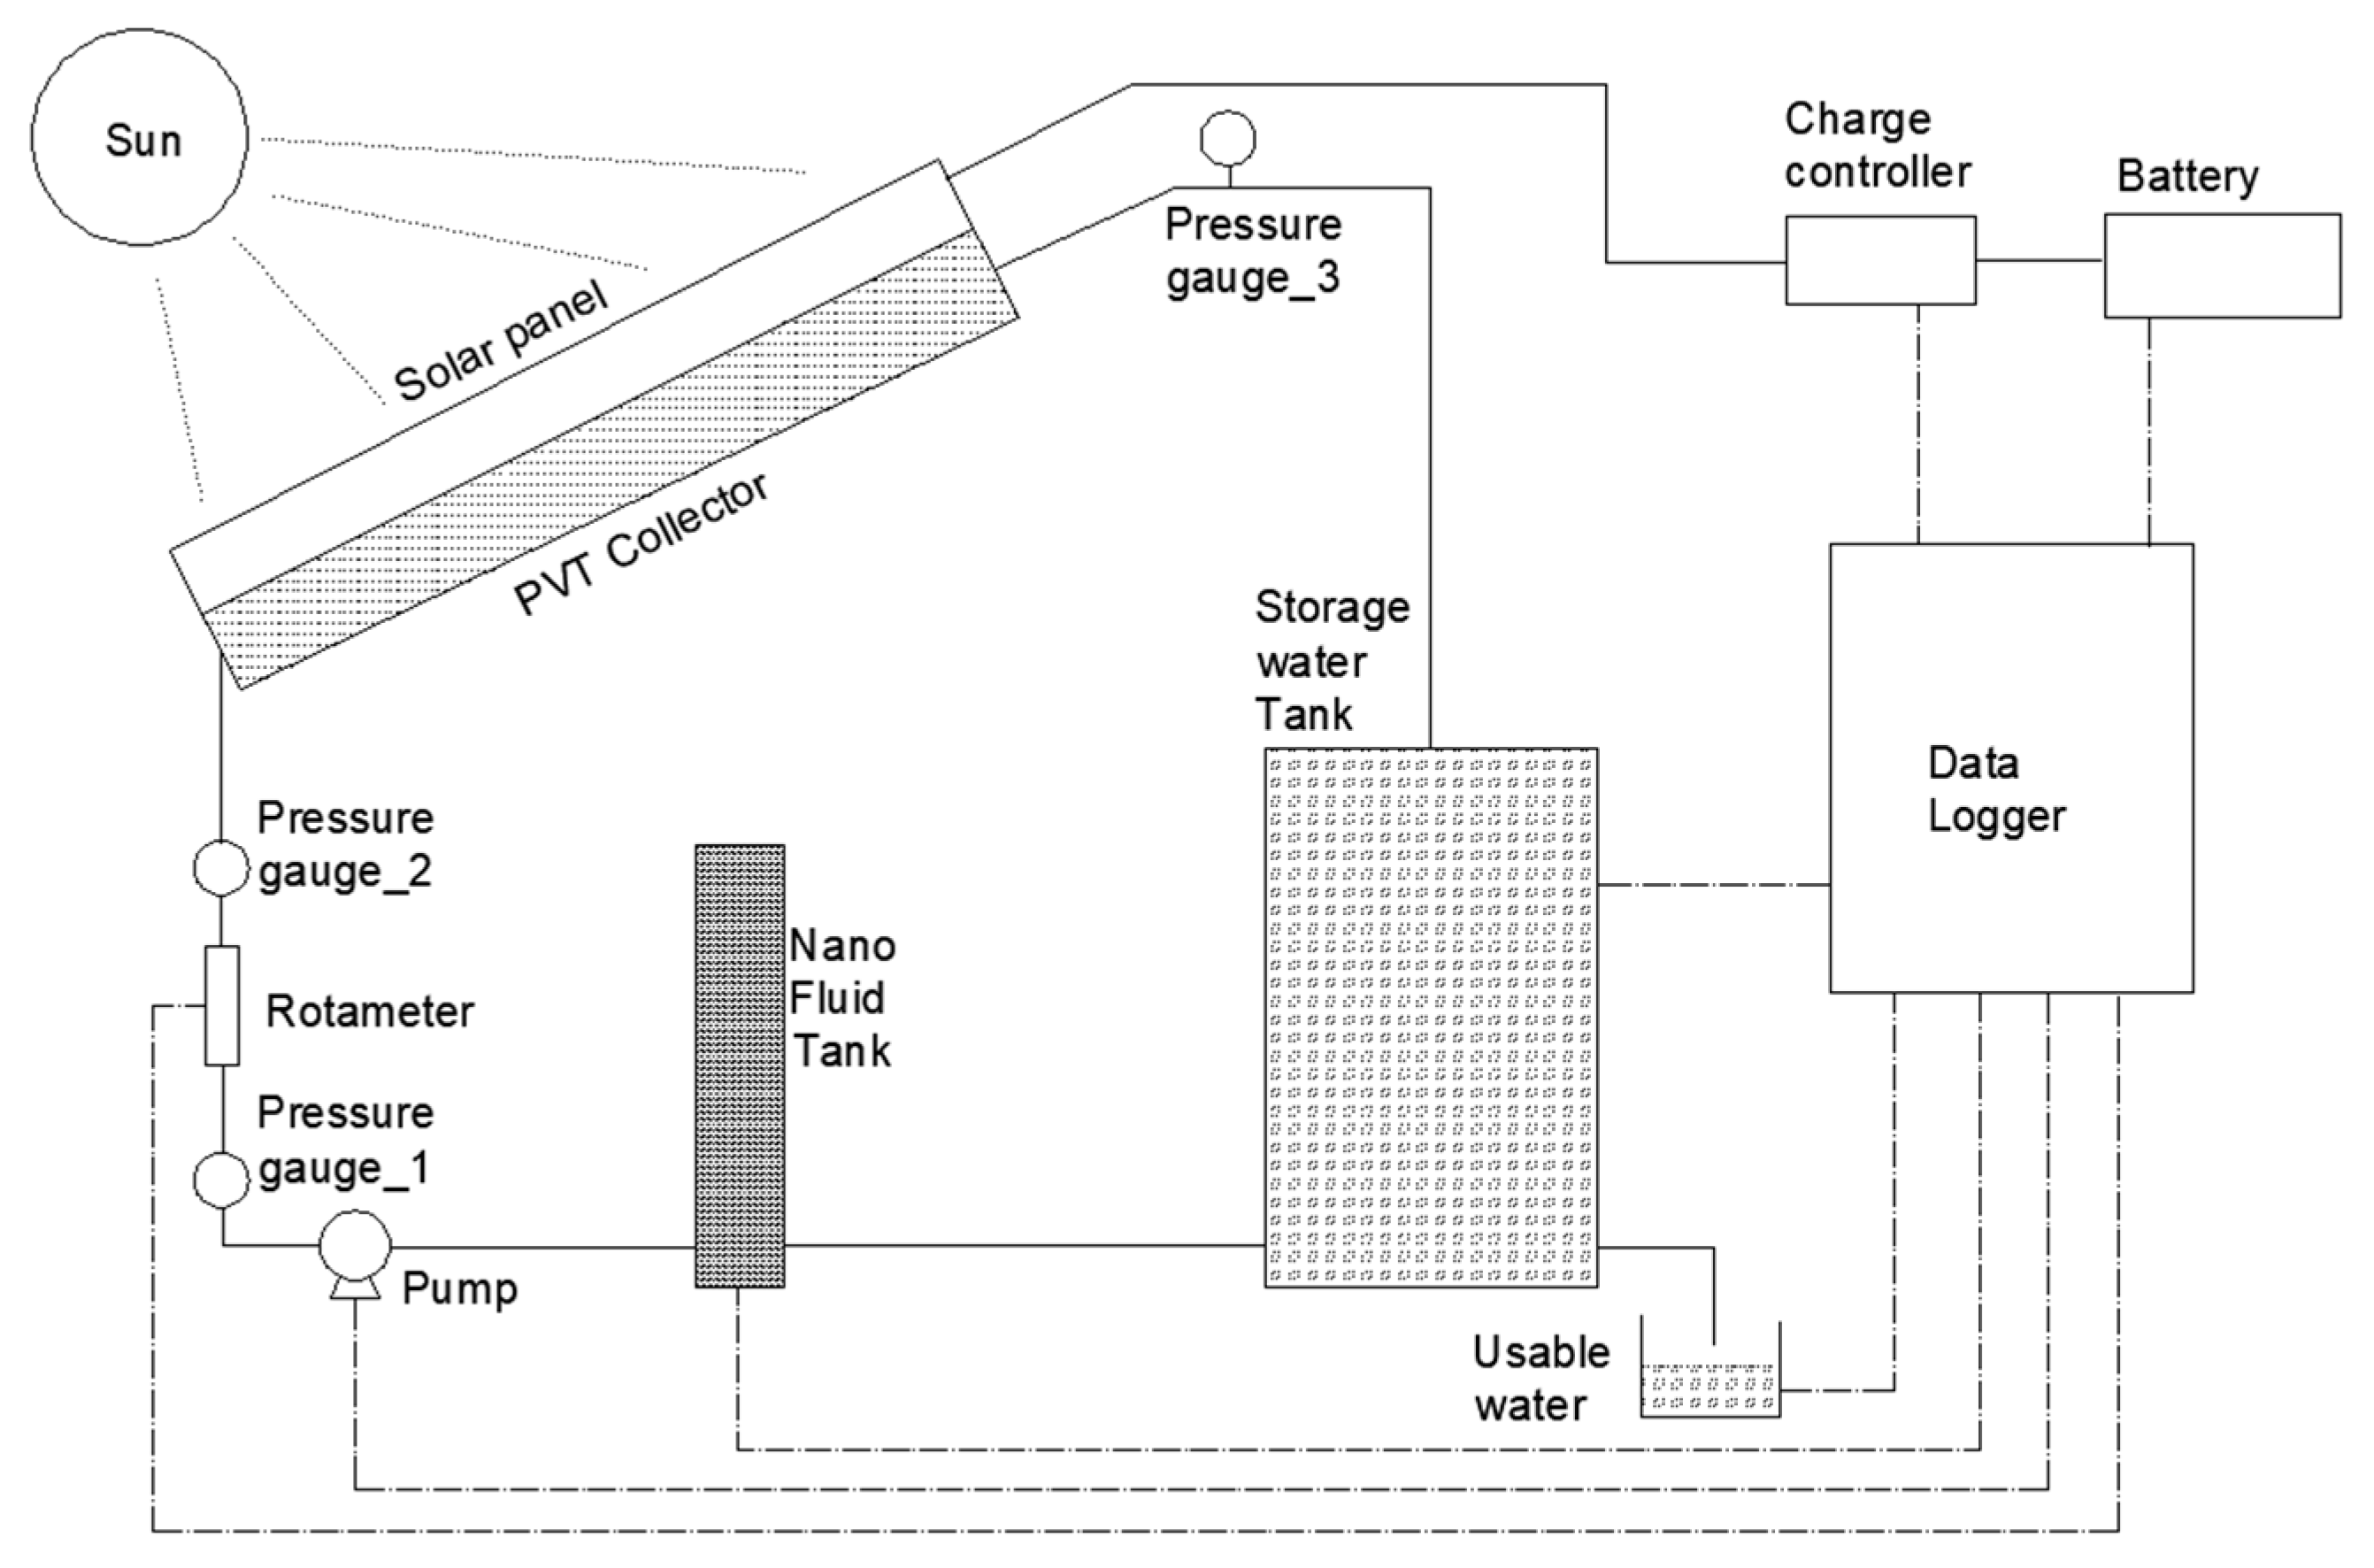
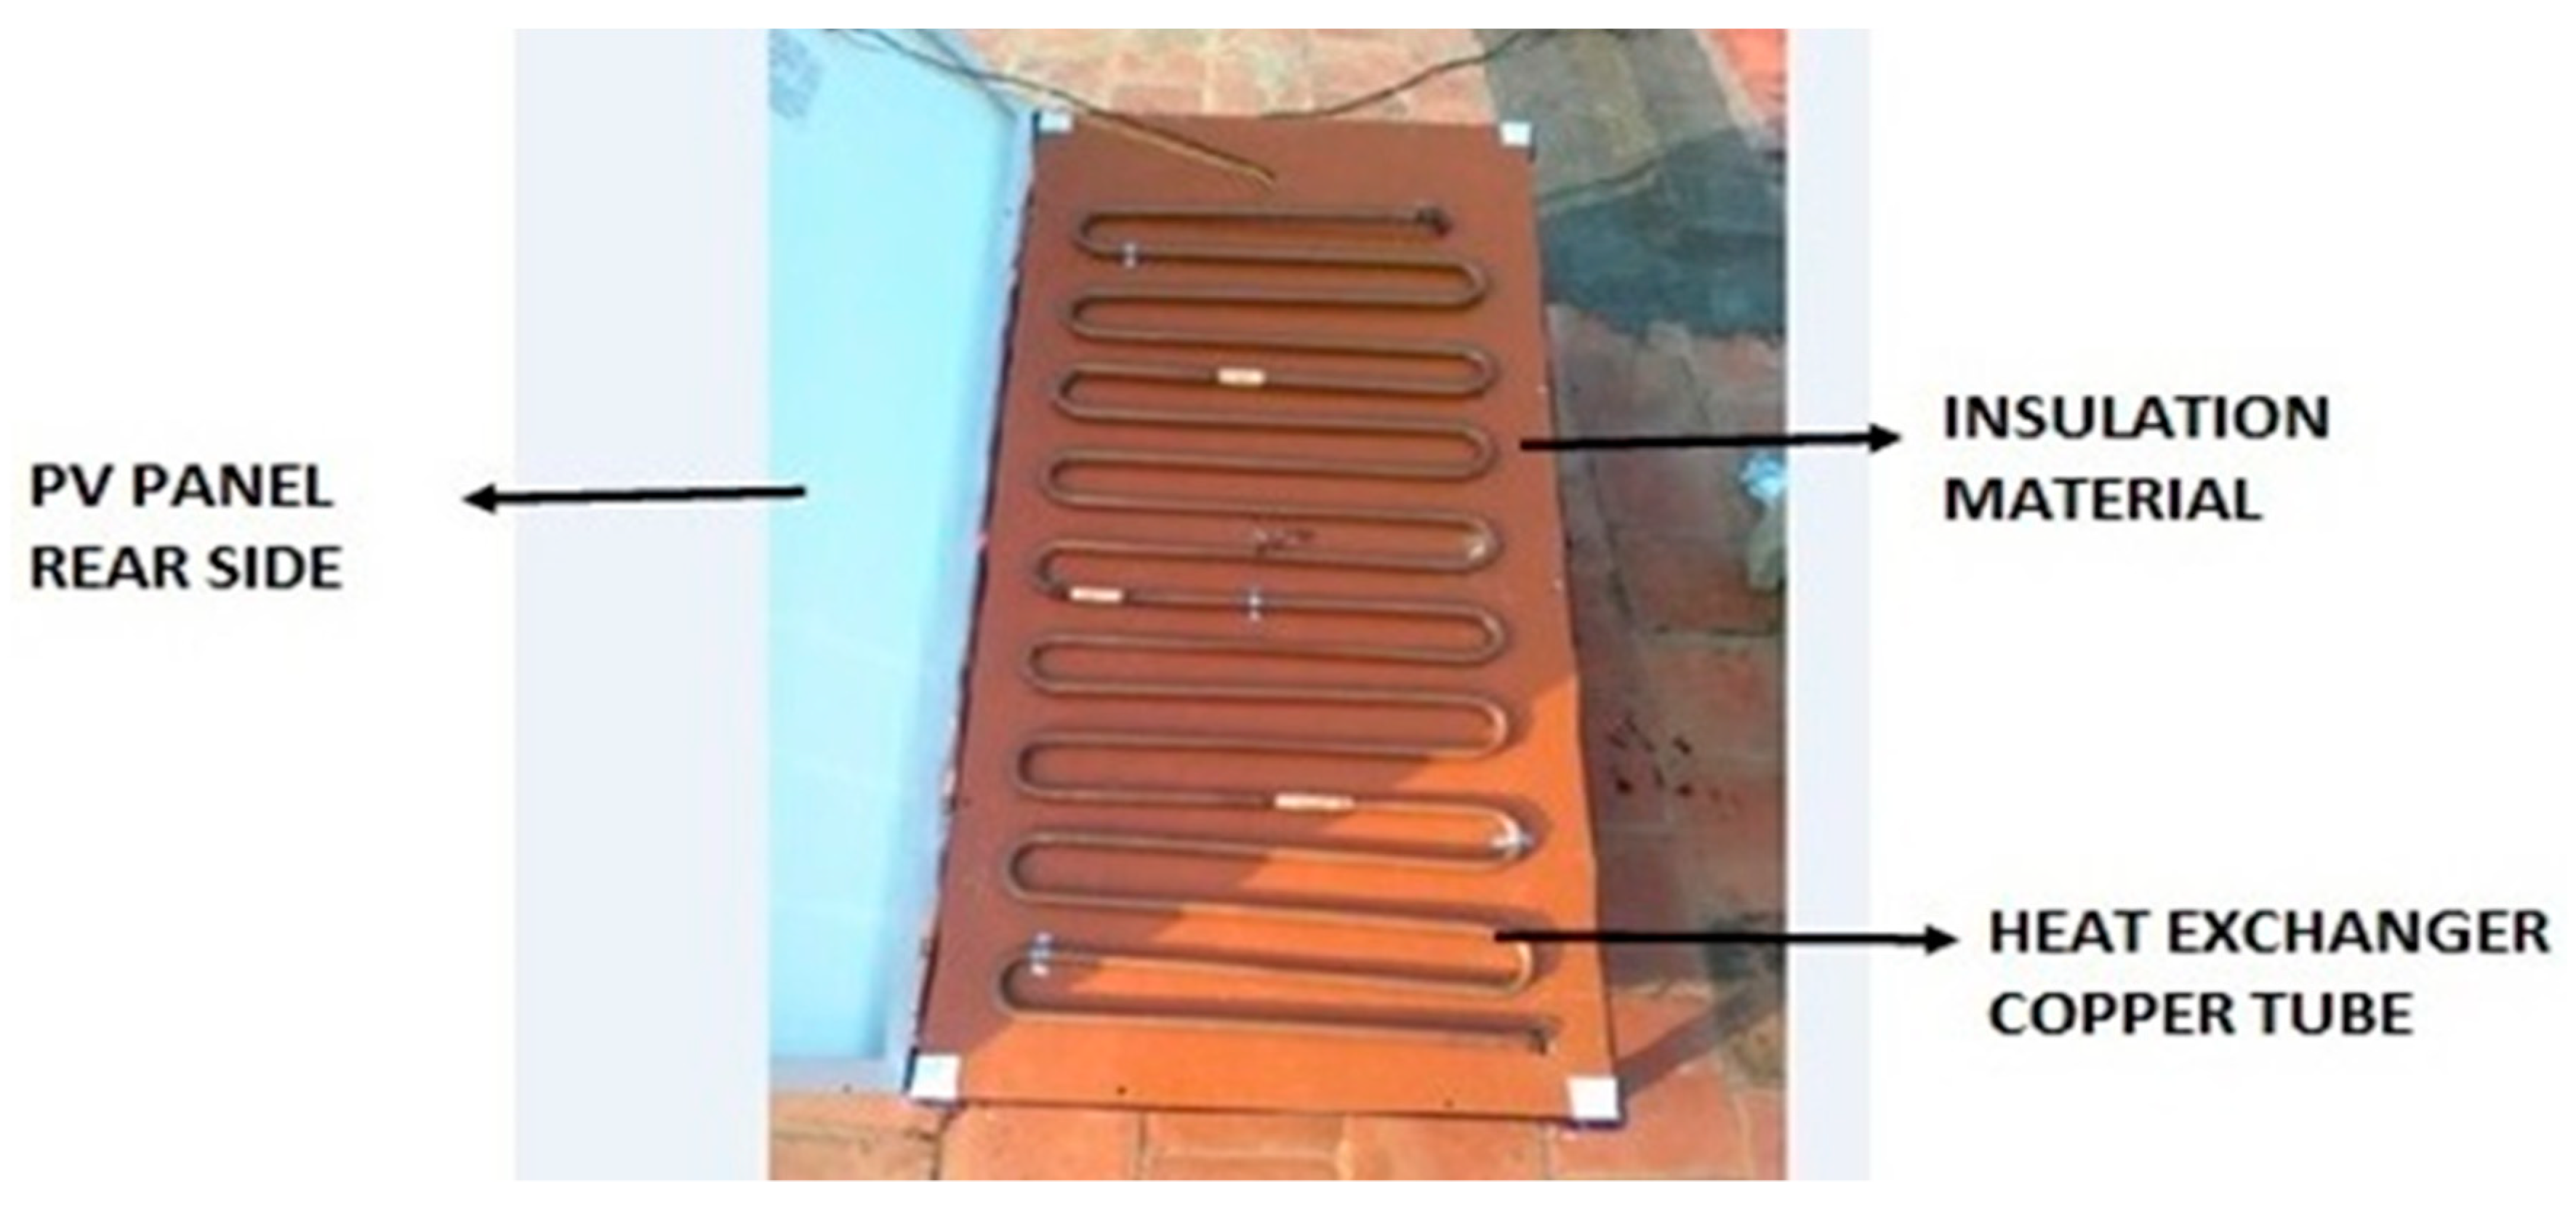
2.2. PVT System Description

The proposed methodology was fabricated to analyze the efficiency of nano-PCM and nanofluid PVT systems, which were compared to liquid PVT systems and stand-alone PV modules simultaneously. Further, water as a coolant at variable flow rates was conducted into the PVT system, and nano-PCM and nanofluid with different concentrations and flow rates were carried out via the photovoltaic thermal collector. The final system is a self-contained PV module that operates normally. Figure 1 depicts a photograph of the experimental procedure. Figure 2 depicts a schematic depiction of the experimental setup.
To build a photovoltaic thermal collector, a multi-silicon glass panel of 1640 mm × 992 mm × 35 mm was acquired. Due to the insulation effect of the platform, a 0.4 mm copper sheet was employed on the rear of the solar panel for heat absorption. Furthermore, the copper tube is utilized as a heat absorber from the rear side of the solar panel with magnitudes of 1.0 cm external and 0.8 cm internal diameters. The performance of the solar panel at the typical test settings is shown in Table 1. The photovoltaic thermal system was mounted at an angle of 13° to the South hemisphere. Readings were taken at 15-minute intervals every day between 8 a.m. and 5 p.m. for all weather conditions and output powers. Figure 3 shows a copper tube coupled with a solar panel.
To increase heat transmission and reduce material costs, nanofluid as a coolant used in the PVT system was constructed. The selection of competent drivers with reasonable costs that may be sold together is, therefore, an essential consideration. The system may be separated into three parts: the collector, the system supporter, and the stand-alone system. The water pump specifications are shown in Table 2.

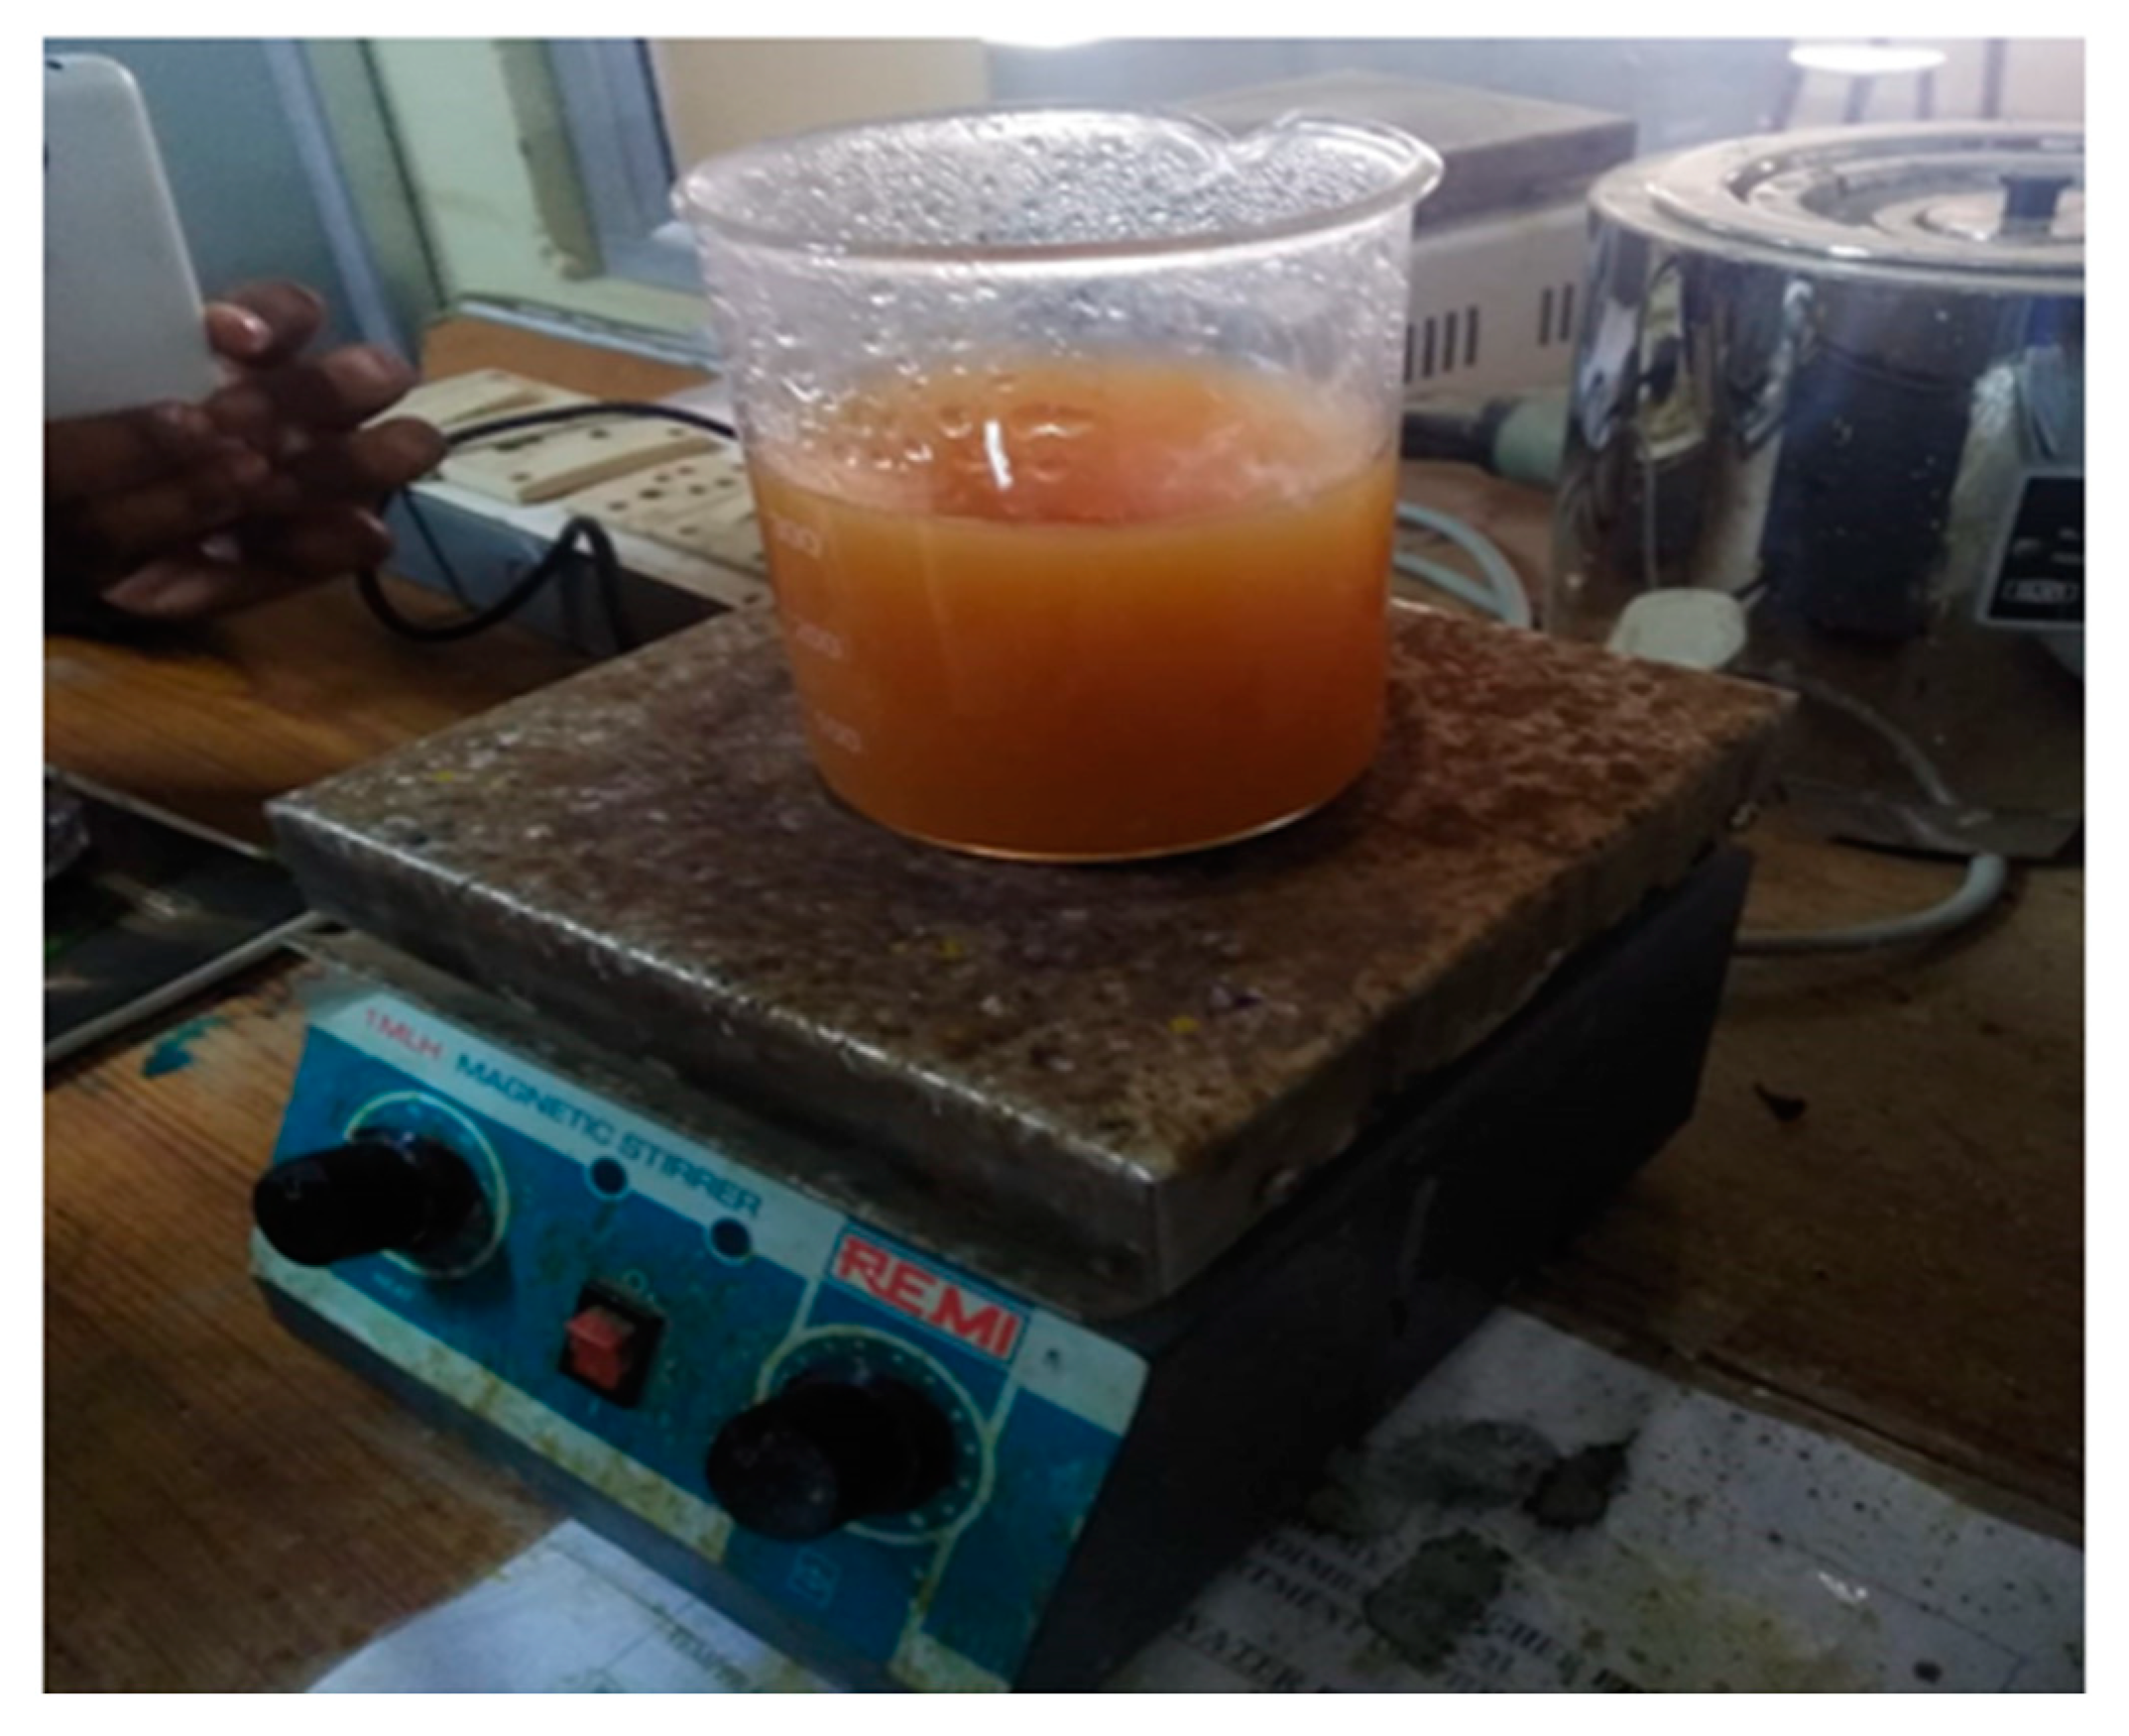
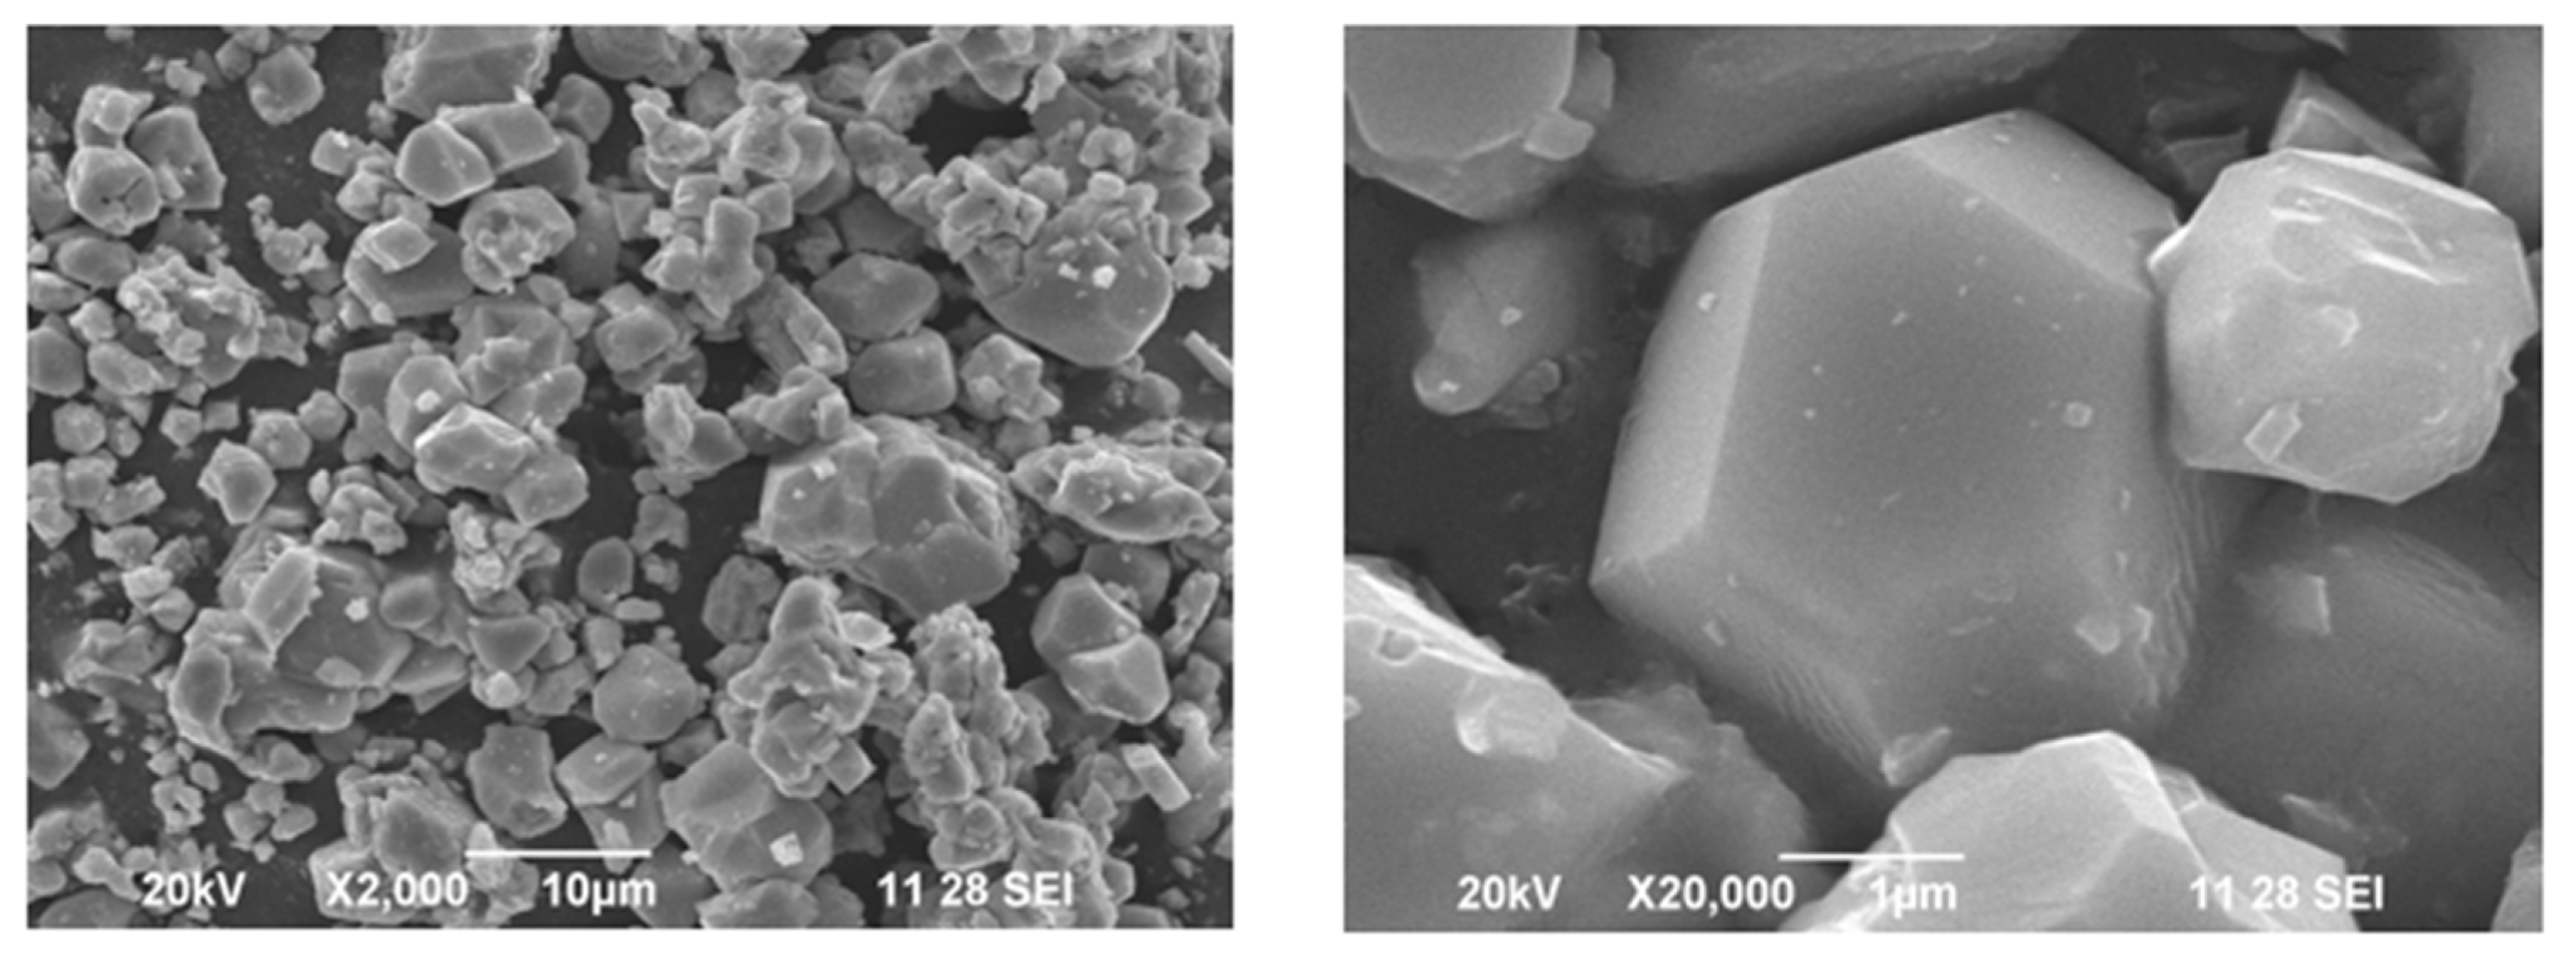
3. Nanofluid Preparation and Characterization

Throughout the studies, manganese chloride (MnCl2), glycine, ammonia, distilled water, polyethylene glycol (PEG-400), and distilled water were used. All the compounds used in the investigation were analytical-grade reagents and were not further purified. The amount of 0.5 M of manganese chloride solution was added to 50 mL of purified water and agitated for 30 min. The amount of 0.3 M of glycine was added to 50 mL of distilled water and stirred for 30 min, and finally, the two were mixed together. To this solution, NAOH was continuously added to get a PH of 10, turning the solution a brownish color. The residual solution was evaporated overnight at 80 °C in a hot air oven. Finally, the mixture was kept in a muffle furnace for 3 h at 750 °C. Manganese oxide powder is now ready. The preparation of nanoparticles and nanofluid in the laboratory is revealed in Figure 4. An SEM image of the MnO nanoparticle is shown in Figure 5.

4. Analytical Methodology

Electrical Performance

The electrical efficiency of a PV module can be defined as the ratio of the actual electrical output of the PV module to the rate of solar energy incidence on the module. It is mathematically expressed as [36,37].
The electrical power output of the device is given by:
η e l = V m p I m p S ˙ = E ˙ e l S ˙
The electrical efficiency of the device is defined as the ratio of the electrical power output to the total power input:
η e l = E ˙ e l S ˙
E ˙ e l   =   V m p   I m p
S ˙ = G N s N m A m o d
This Equation (2) can be used to evaluate the electrical efficiency of a solar module, taking into account factors such as the number of cells in series and parallel, the module area, and the incident solar irradiance.
A m o d = L 1 L 2
The equation provided relates the module area (Amod) of a rectangular solar panel to its length (L1) and width (L2).
We convert conventional electrical efficiency to the thermal efficiency equivalent of electrical efficiency using the following equation:
η e l   t h e r m a l   =   η e l e c t r i c a l C f
where Cf is the conversion factor of the thermal power plant, and its value may be taken as 0.36 for countries such as India.

5. Results & Discussions

This experimental investigation used water and water-based MnO Nanofluid at four different flow rates of 1–4 LPM. Measurements were taken every 30 s between 8:00 and 17:00 on an average experimental day. The temperature of the gradient panels grew throughout the day as sun irradiation increased, according to the findings.

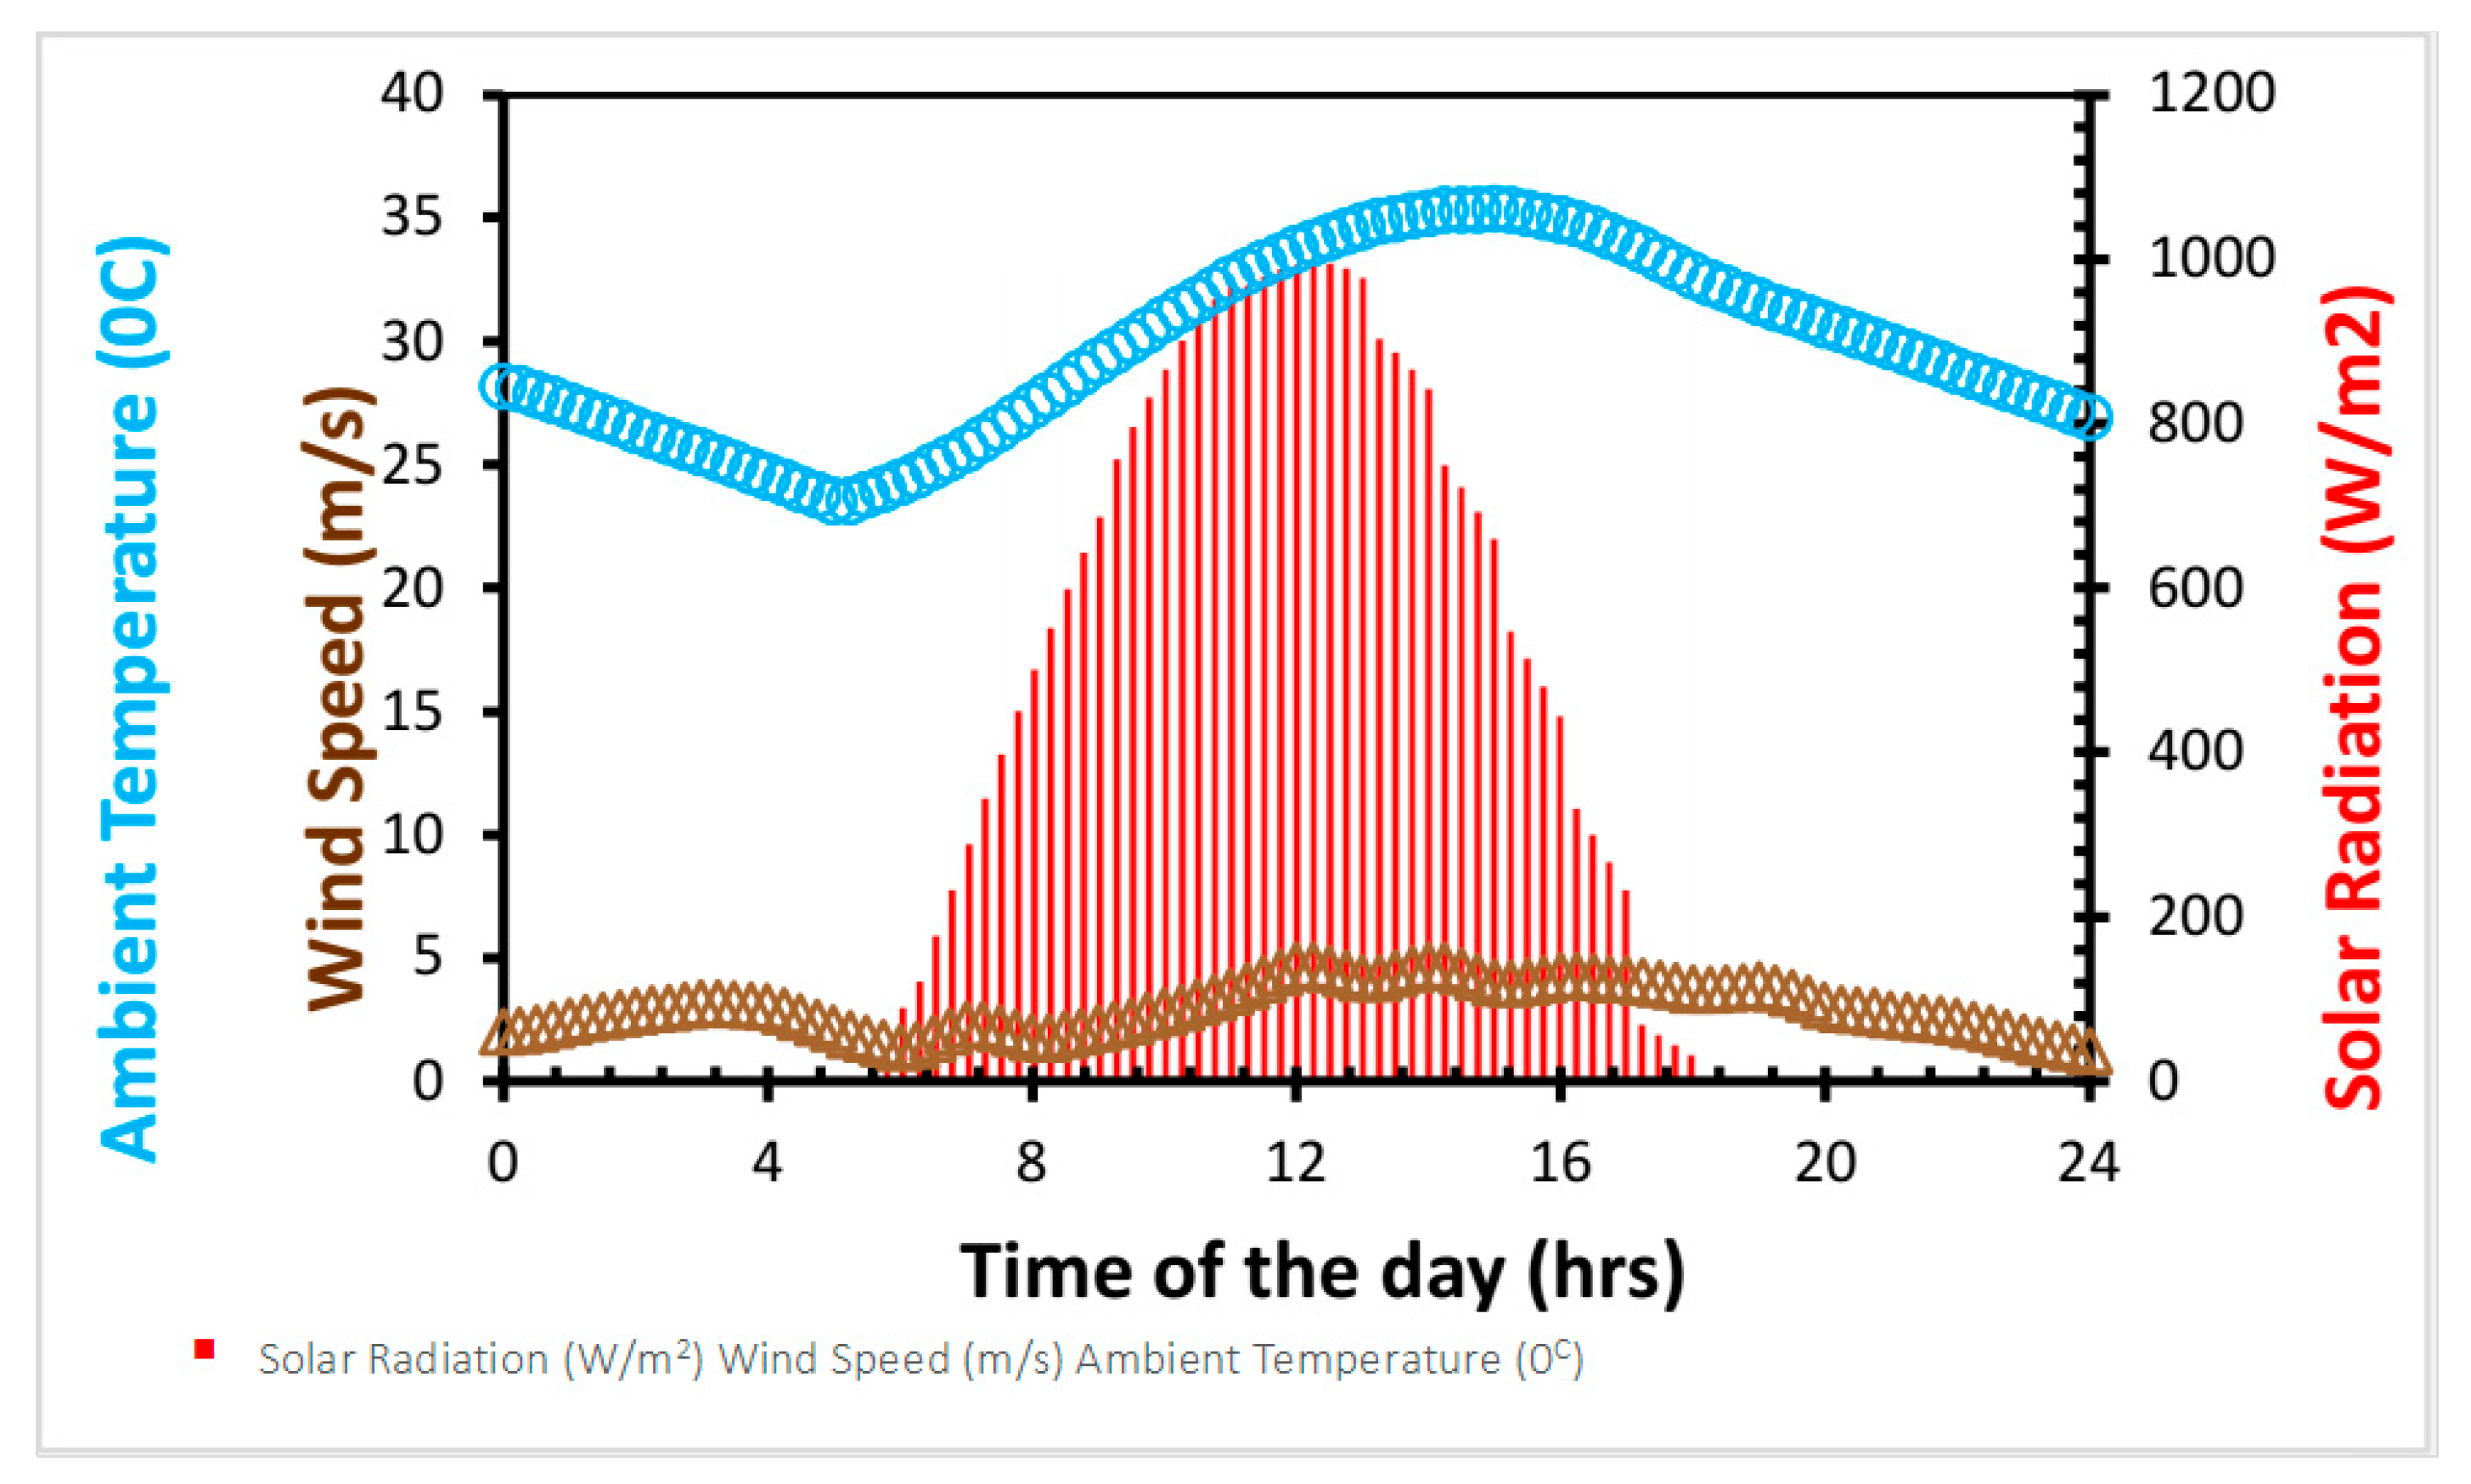
5.1. Weather Data Analysis

The weather information comprises the ambient temperature, wind speed, and solar radiation averages on the experimental days. This research was carried out during June and July 2021. Various meteorological data for the test days are displayed in Table 3.
The average meteorological data of an experimental day is depicted in Figure 6, where solar radiation, wind speed, and ambient temperature appear as a canopy structure. This gives real-world data from a specific location where the system’s projected performance, based on solar radiation, wind speed, and ambient temperature, may be determined. The diurnal average incoming solar radiation dispersion for the experiment period creates a megaphone shape, with the largest value at noon being 1017.07 W/m2 and the smallest value being 538.98 W/m2 at 8 a.m., according to this graph. The average daily air temperature climbs from 26.84 °C at 8:00 a.m. to 33.66 °C at noon, and decreases to 28.23 °C at 5:00 p.m.

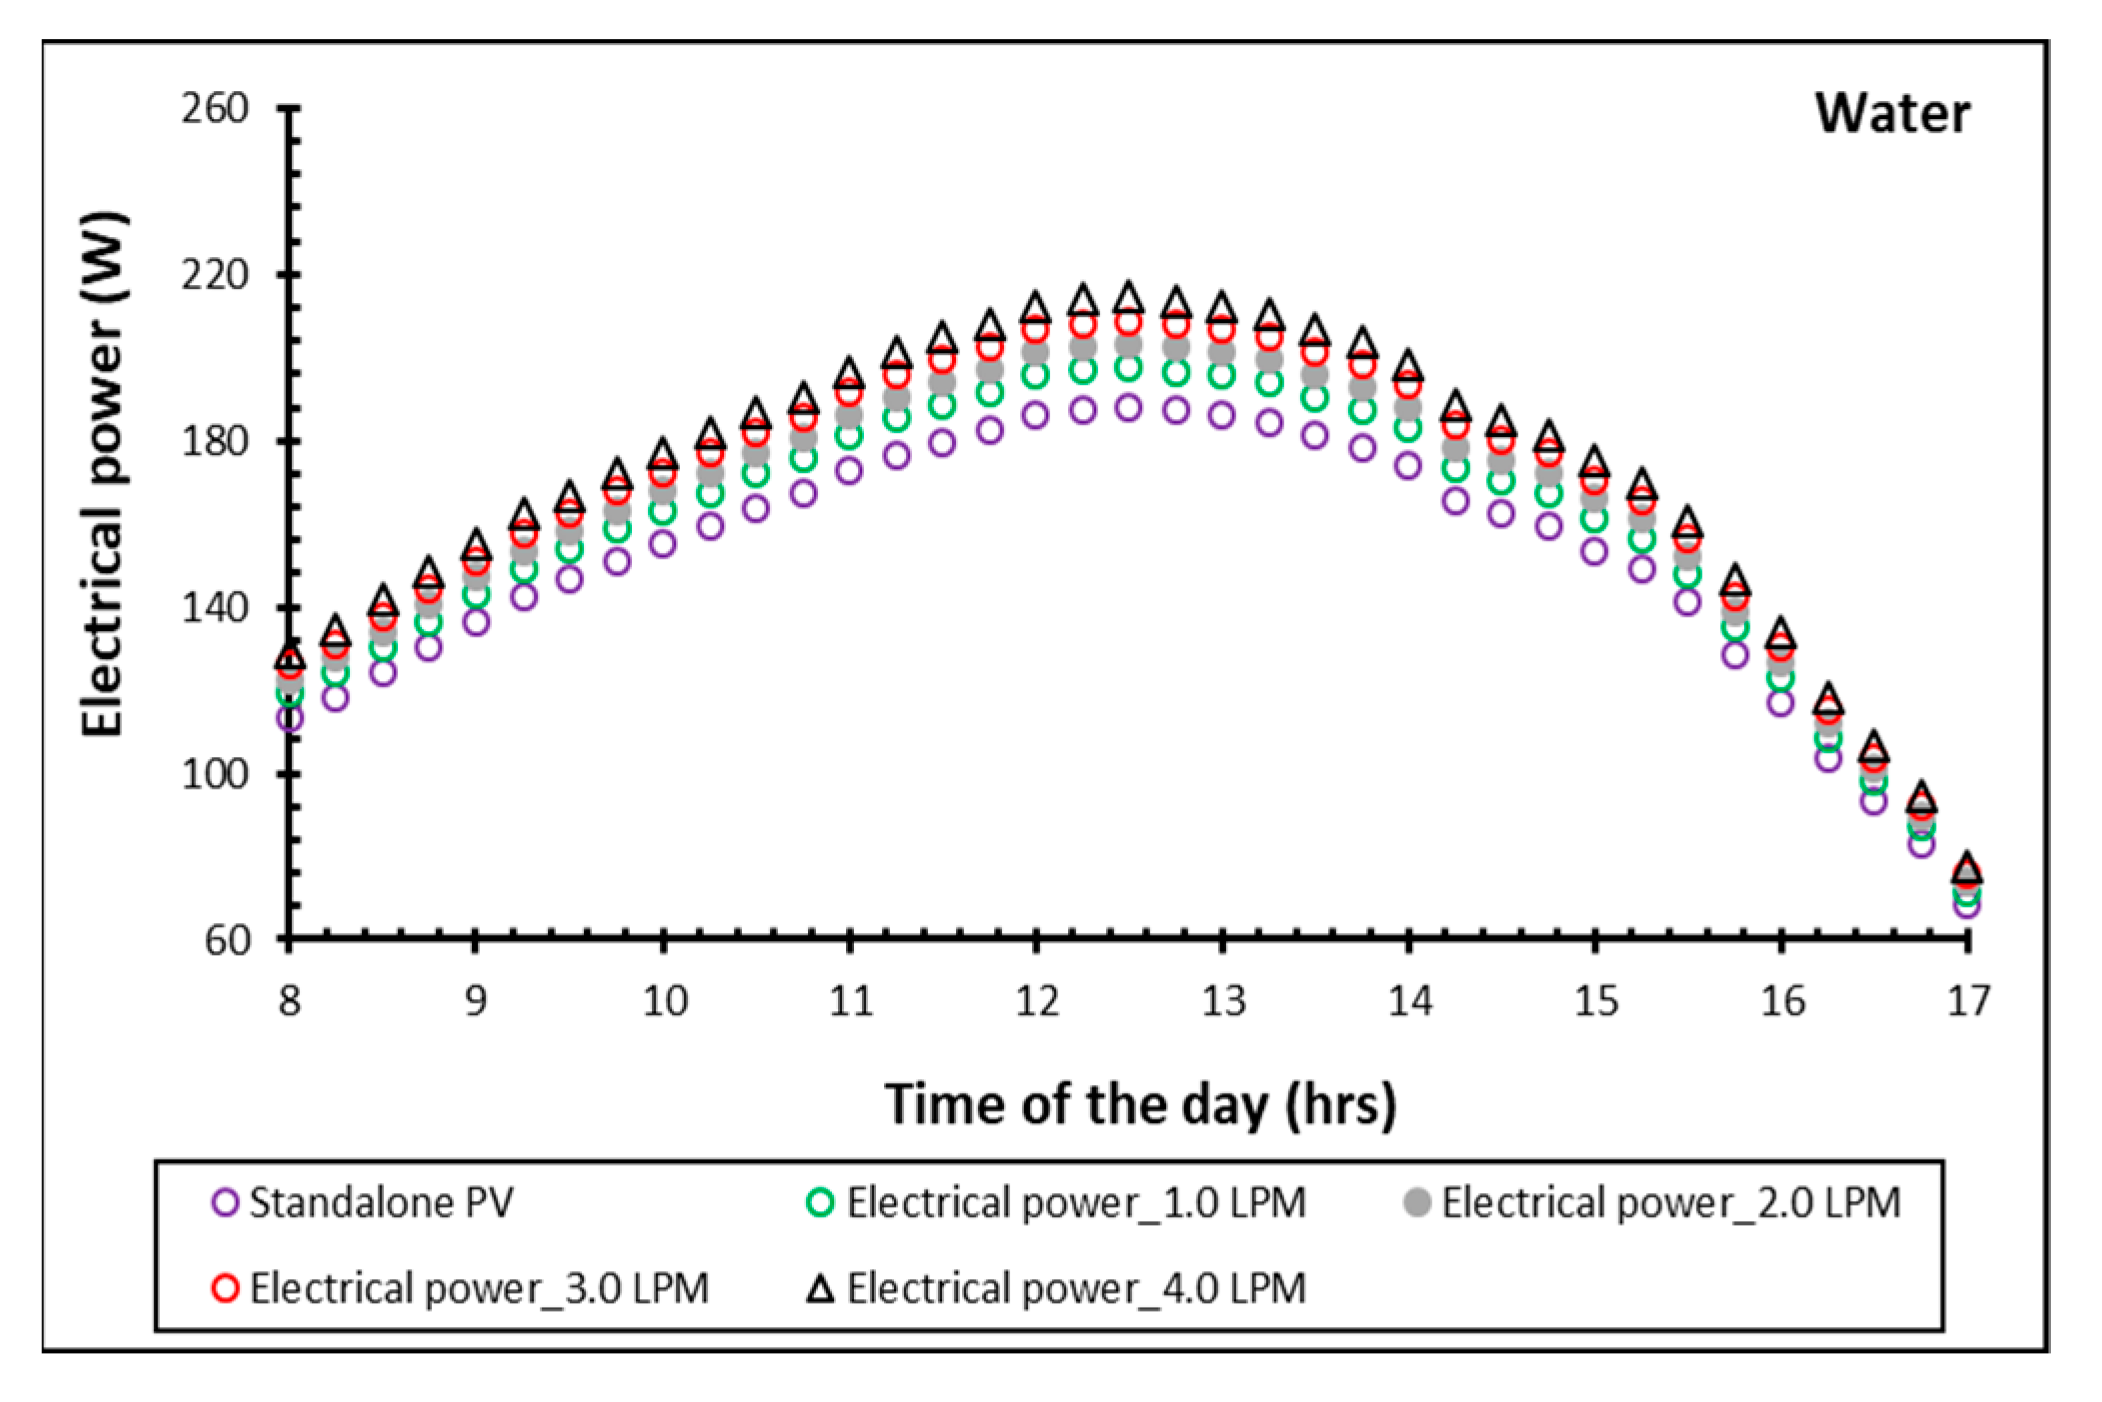
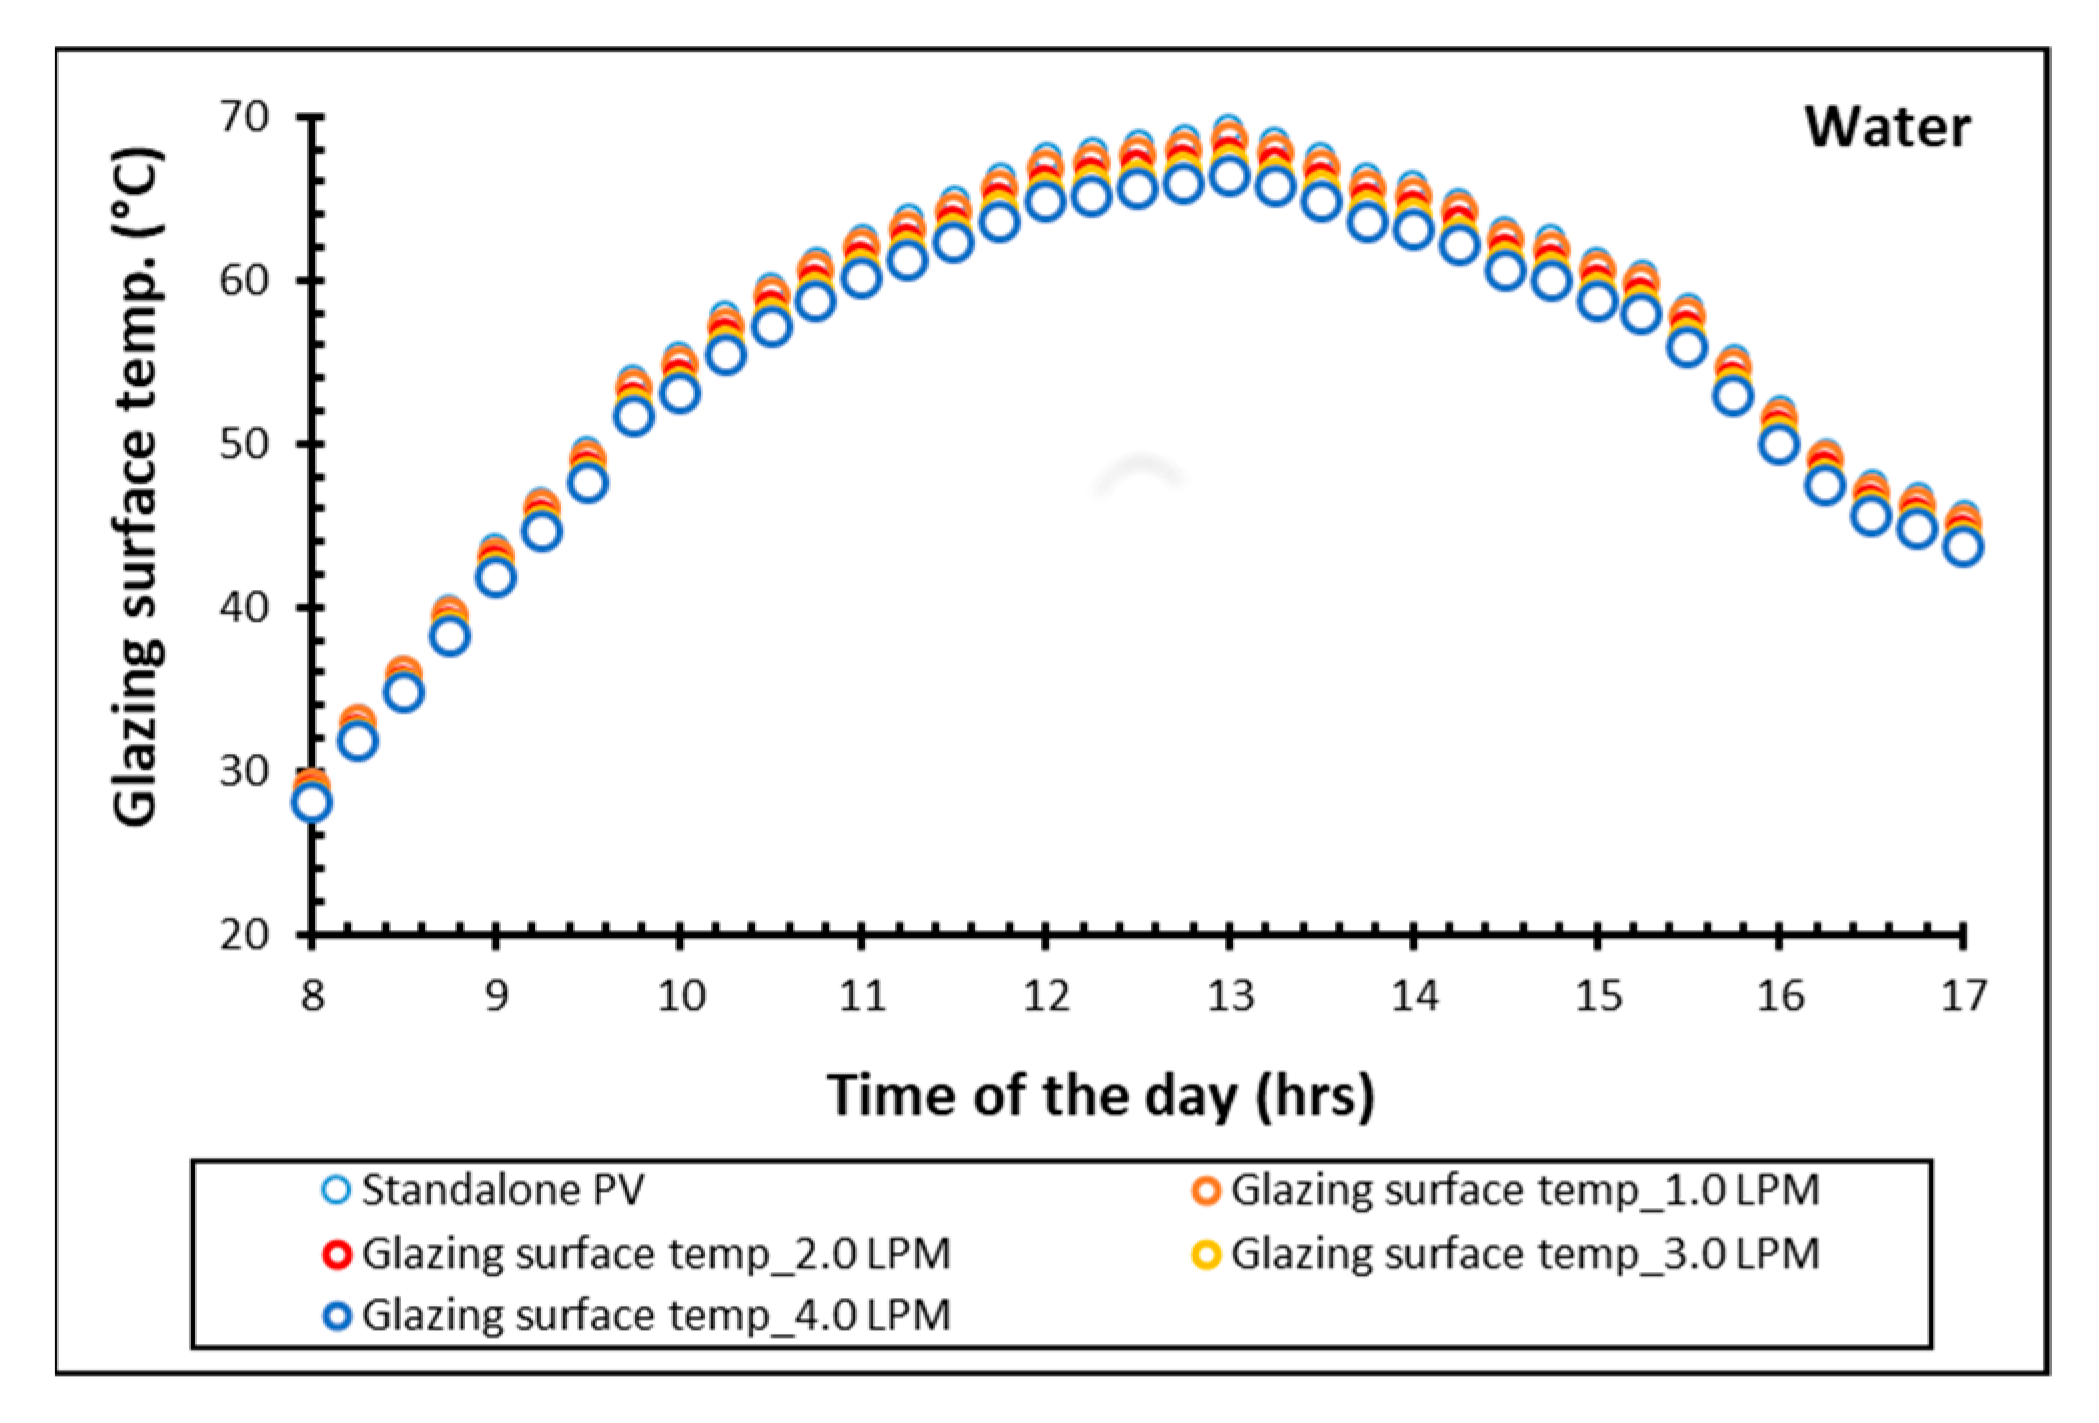
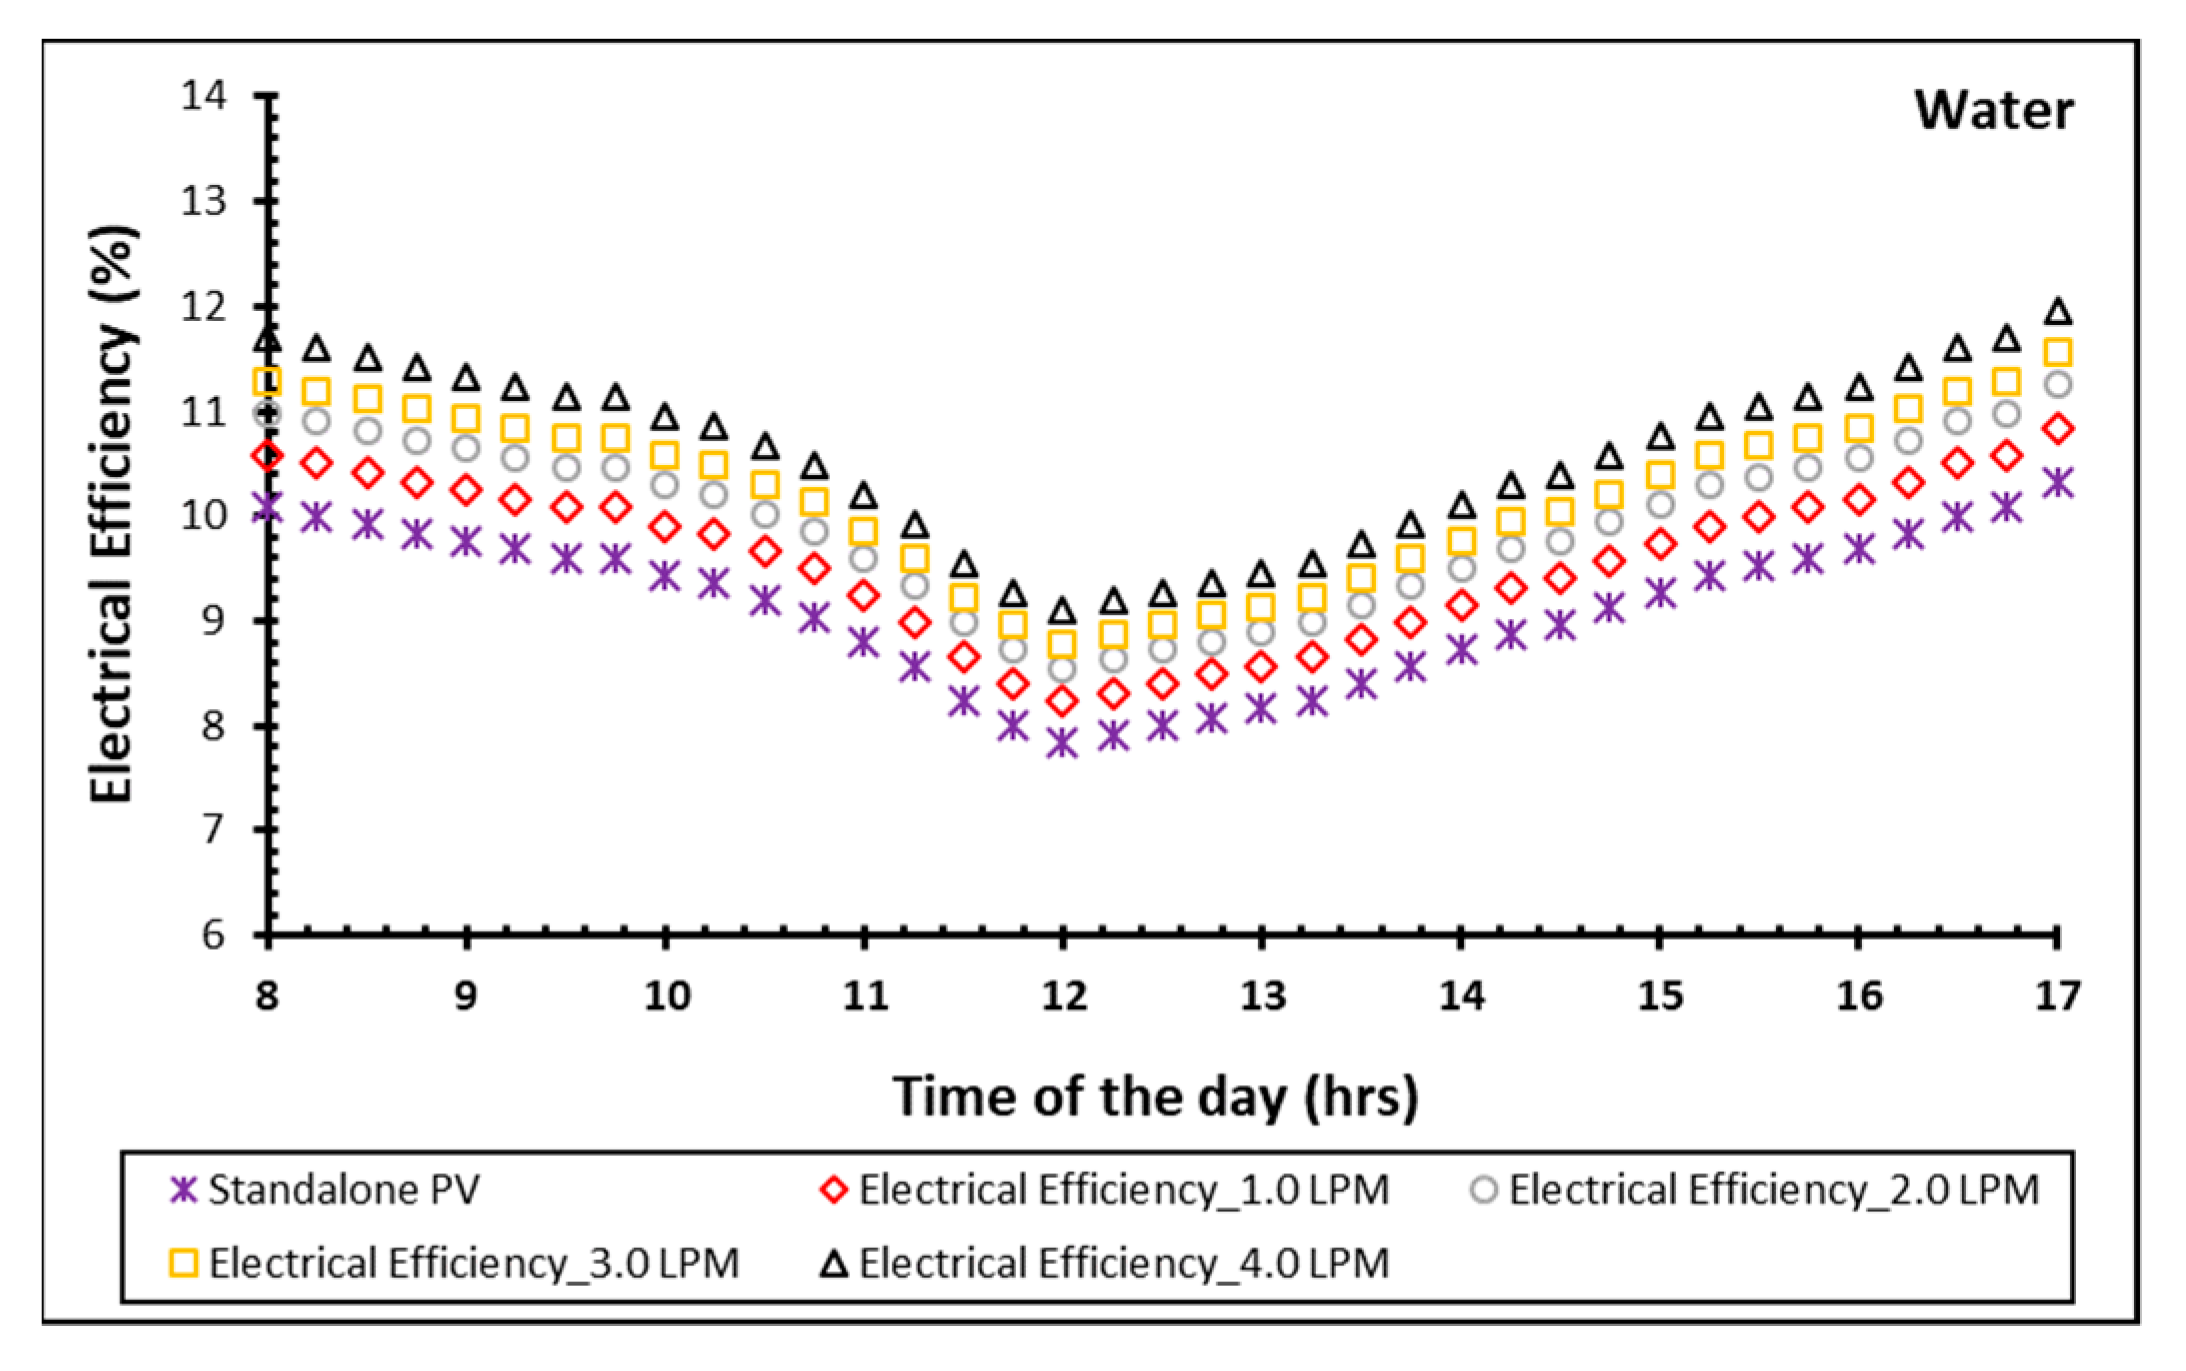
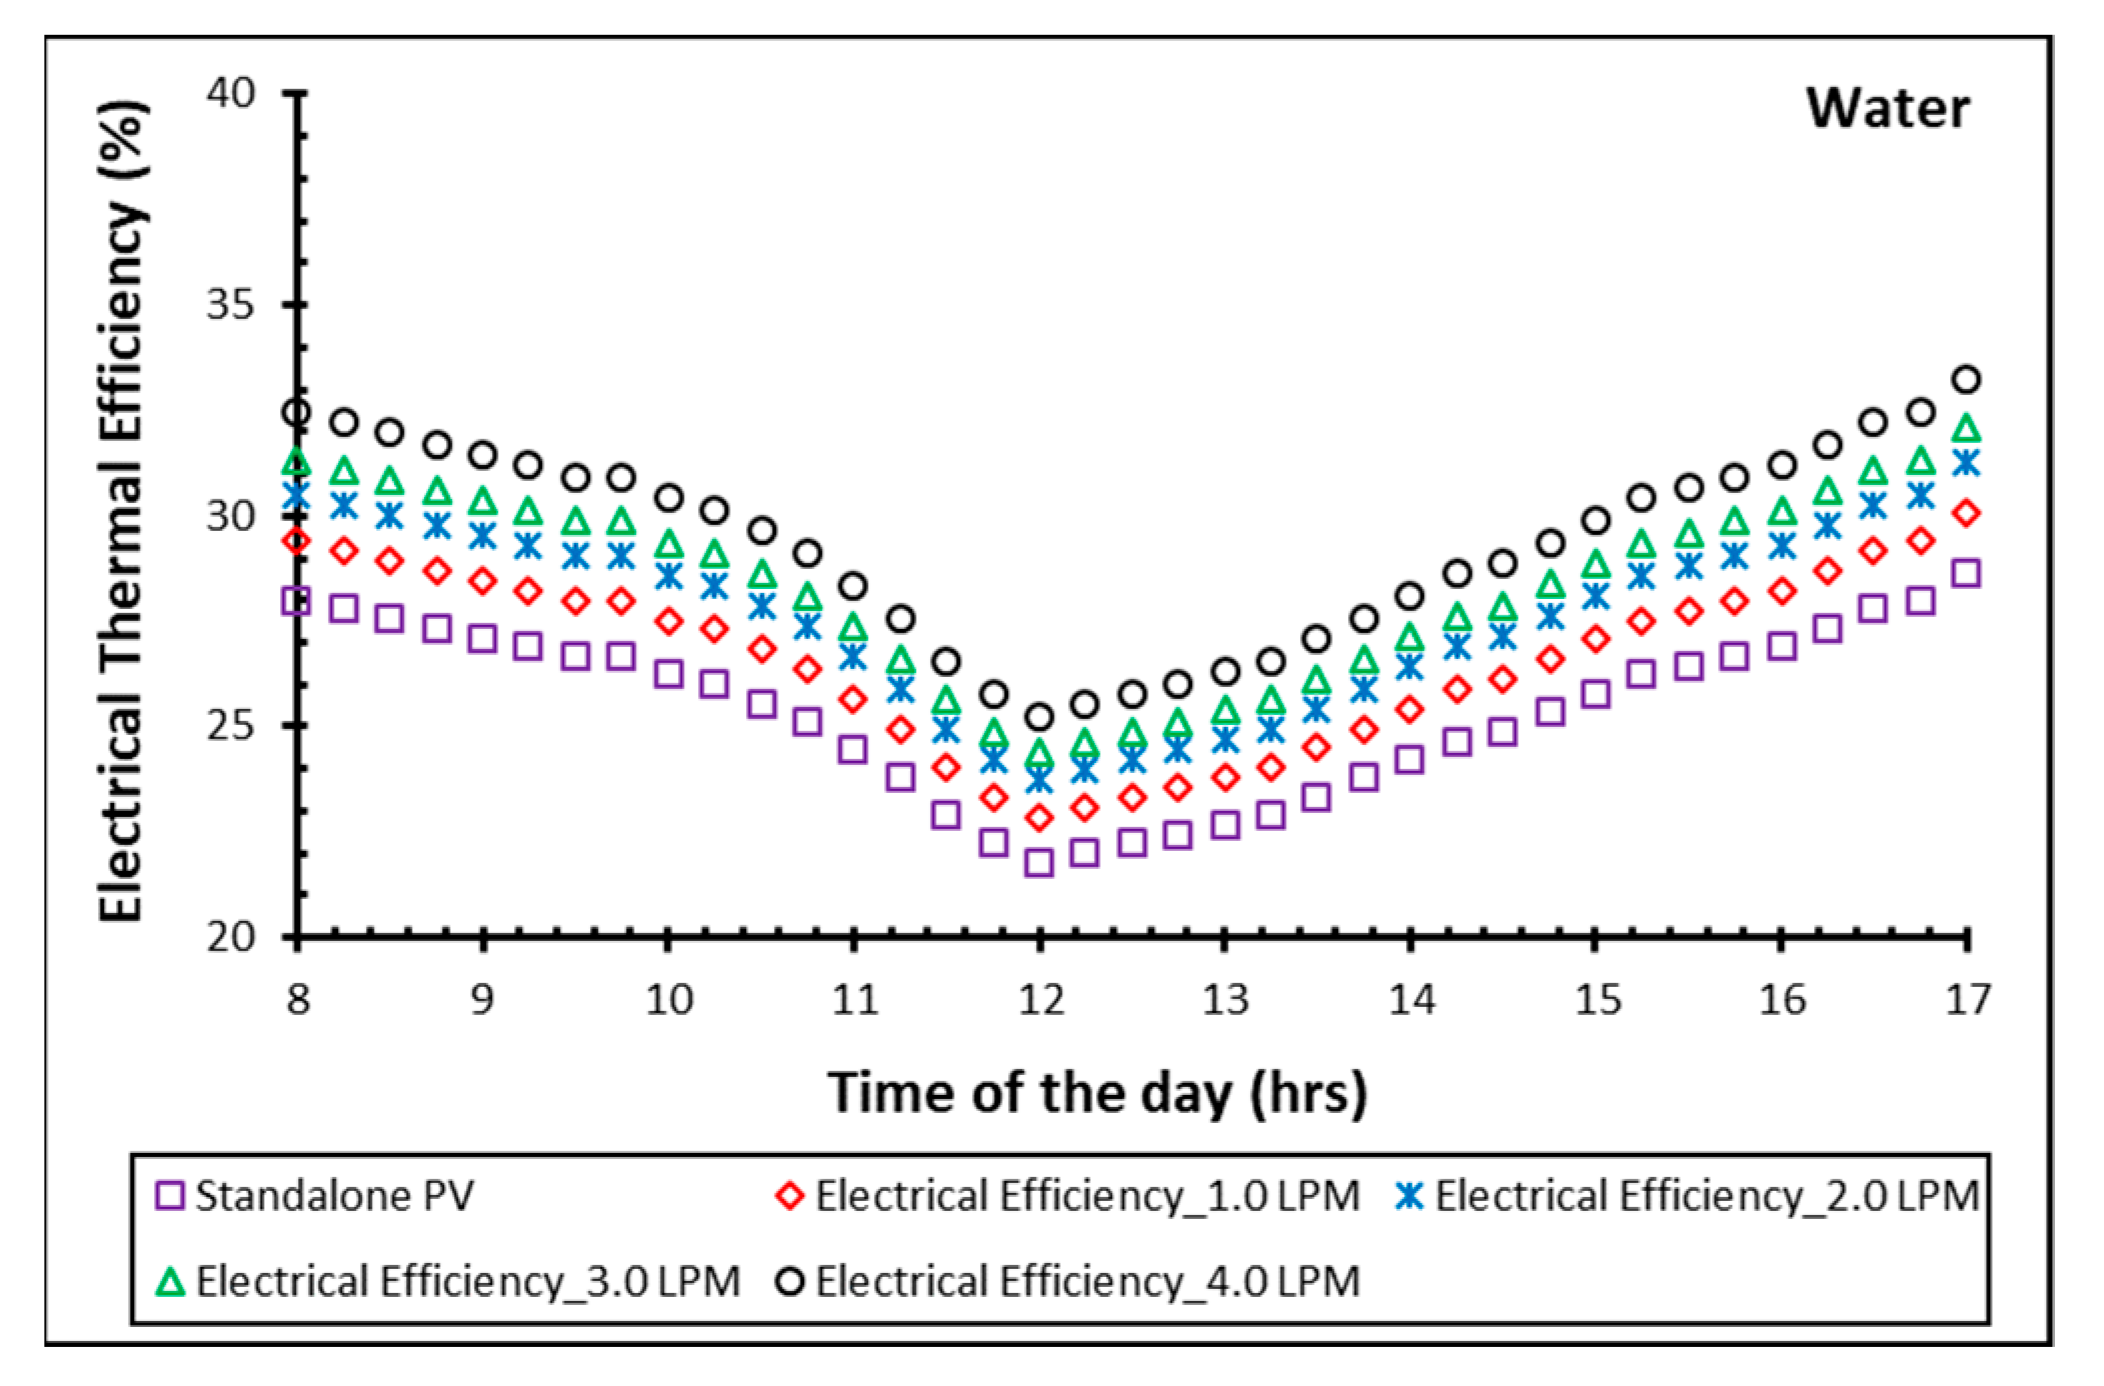
5.2. Investigation of Liquid as a Coolant in a Photovoltaic Thermal Collector

Each coolant has advantages and disadvantages. Liquid was used as a coolant in this study because of its heat-carrying capacity and natural availability. Water was explored as a coolant in a photovoltaic thermal collector in terms of energy collected, the difference in the input and output temperature of the channel and fluid flow rate, fluid heat capacities, solar irradiance, and panel area.
Figure 7 displays the variations in electrical power obtained, with time for all tested liquid flow rates ranging from 1 to 4 LPM. Equation (2) is used to calculate electrical power for all four flow rates in conjunction with a stand-alone PV system. Electrical power increased up to 12 p.m., when it began to fall due to increasing solar intensity. Because a stand-alone PV system does not have a cooling facility, a large glazing surface was acquired on the testing days. This single PV system generated less electricity than the other cooling systems. The life period of the stand-alone PV system was shorter when compared to alternative cooling PVT systems. Furthermore, this image resembles a mushroom form, symbolizing how morning progressively increases till midday and then decreases until dusk. In general, as the flow rate grew, so did the electrical output of the PV panels. The following diagrammatic depiction shows the maximum electrical power generations as 188 W, 197 W, 203 W, 208 W, and 215 W at flow rates ranging from 1 to 4 LPM.
Figure 8 displays the trends in the glazing surface obtained over time for all tested flow rates of 1–4 LPM of liquid. The surface temperature of solar panels or glazing was monitored using thermocouples, which displayed the temperature in a data logger. When sunlight strikes the solar panel, the temperature of the glazing surface rises, which is communicated to the solar panel’s rear side, known as the Tedlar side. The temperature on the Tedlar side was also monitored using thermocouples attached to a data recorder. Conduction heat transmission occurs on the glazing surface, while convective heat transfer occurs on the Tedlar surface. Because the Tedlar surface is closed, the Tedlar temperature was always greater than the glazing temperature. Furthermore, hotter ambient air travels through the Tedlar side, contributing to a rise in Tedlar temperature. However, the glazing surface is exposed to the environment and is in touch with wind, contributing to the drop in its surface temperature. For the four flow rates of 1–4 LPM with a freestanding PV system, the highest glazing surface temperatures were 69.2 °C, 68.5 °C, 67.8 °C, 67.1 °C, and 66.4 °C.
Figure 9 demonstrates the time-dependent trends in electrical efficiency for all examined liquid flow rates ranging from 1 to 4 LPM. The electrical efficiency of the photovoltaic thermal system was evaluated using Equations (1), (3), and (4). During the electrical energy analysis, characteristics, such as maximum power point voltage, maximum power point current, solar radiation, and solar panel area, were evaluated for all designs. There was a rise in glazing surface temperature and lower electrical efficiency from 9 h to 12 h, then vice versa till 16 h. It was discovered that when the glazing surface temperature was at its highest, electrical efficiency was at its lowest between 11:00 a.m. and 1:00 p.m. Electrical efficiency, like electrical power, improved as the coolant flow rate increased. The use of nanofluid resulted in an improvement in the electrical efficiency of the PV system. The maximum electrical efficiency reached in this research investigation was 12%, close to what Waeli et al. accomplished with similar types of power [38,39,40], and used liquid as a coolant to reach maximum electrical efficiencies of 10.3%, 10.8%, 11.2%, 11.6%, and 12.1 %.
Figure 10 demonstrates the time-dependent trends in electrical thermal efficiency for all tested flow rates of 1–4 LPM of liquid. Equation (5) calculates the electrical efficiency of the photovoltaic thermal system. In India, the conversion factor of the thermal power plant (0.36) was established, and electrical efficiency converts into electrical thermal efficiency via this factor. Electrical thermal efficiency has evolved as a result. From dawn to midday and into the evening, both electrical efficiency and electrical thermal efficiency followed similar trajectories. The greatest achievable efficiencies are 28.7%, 30.1%, 31.2%, 32.1%, and 33.4%.

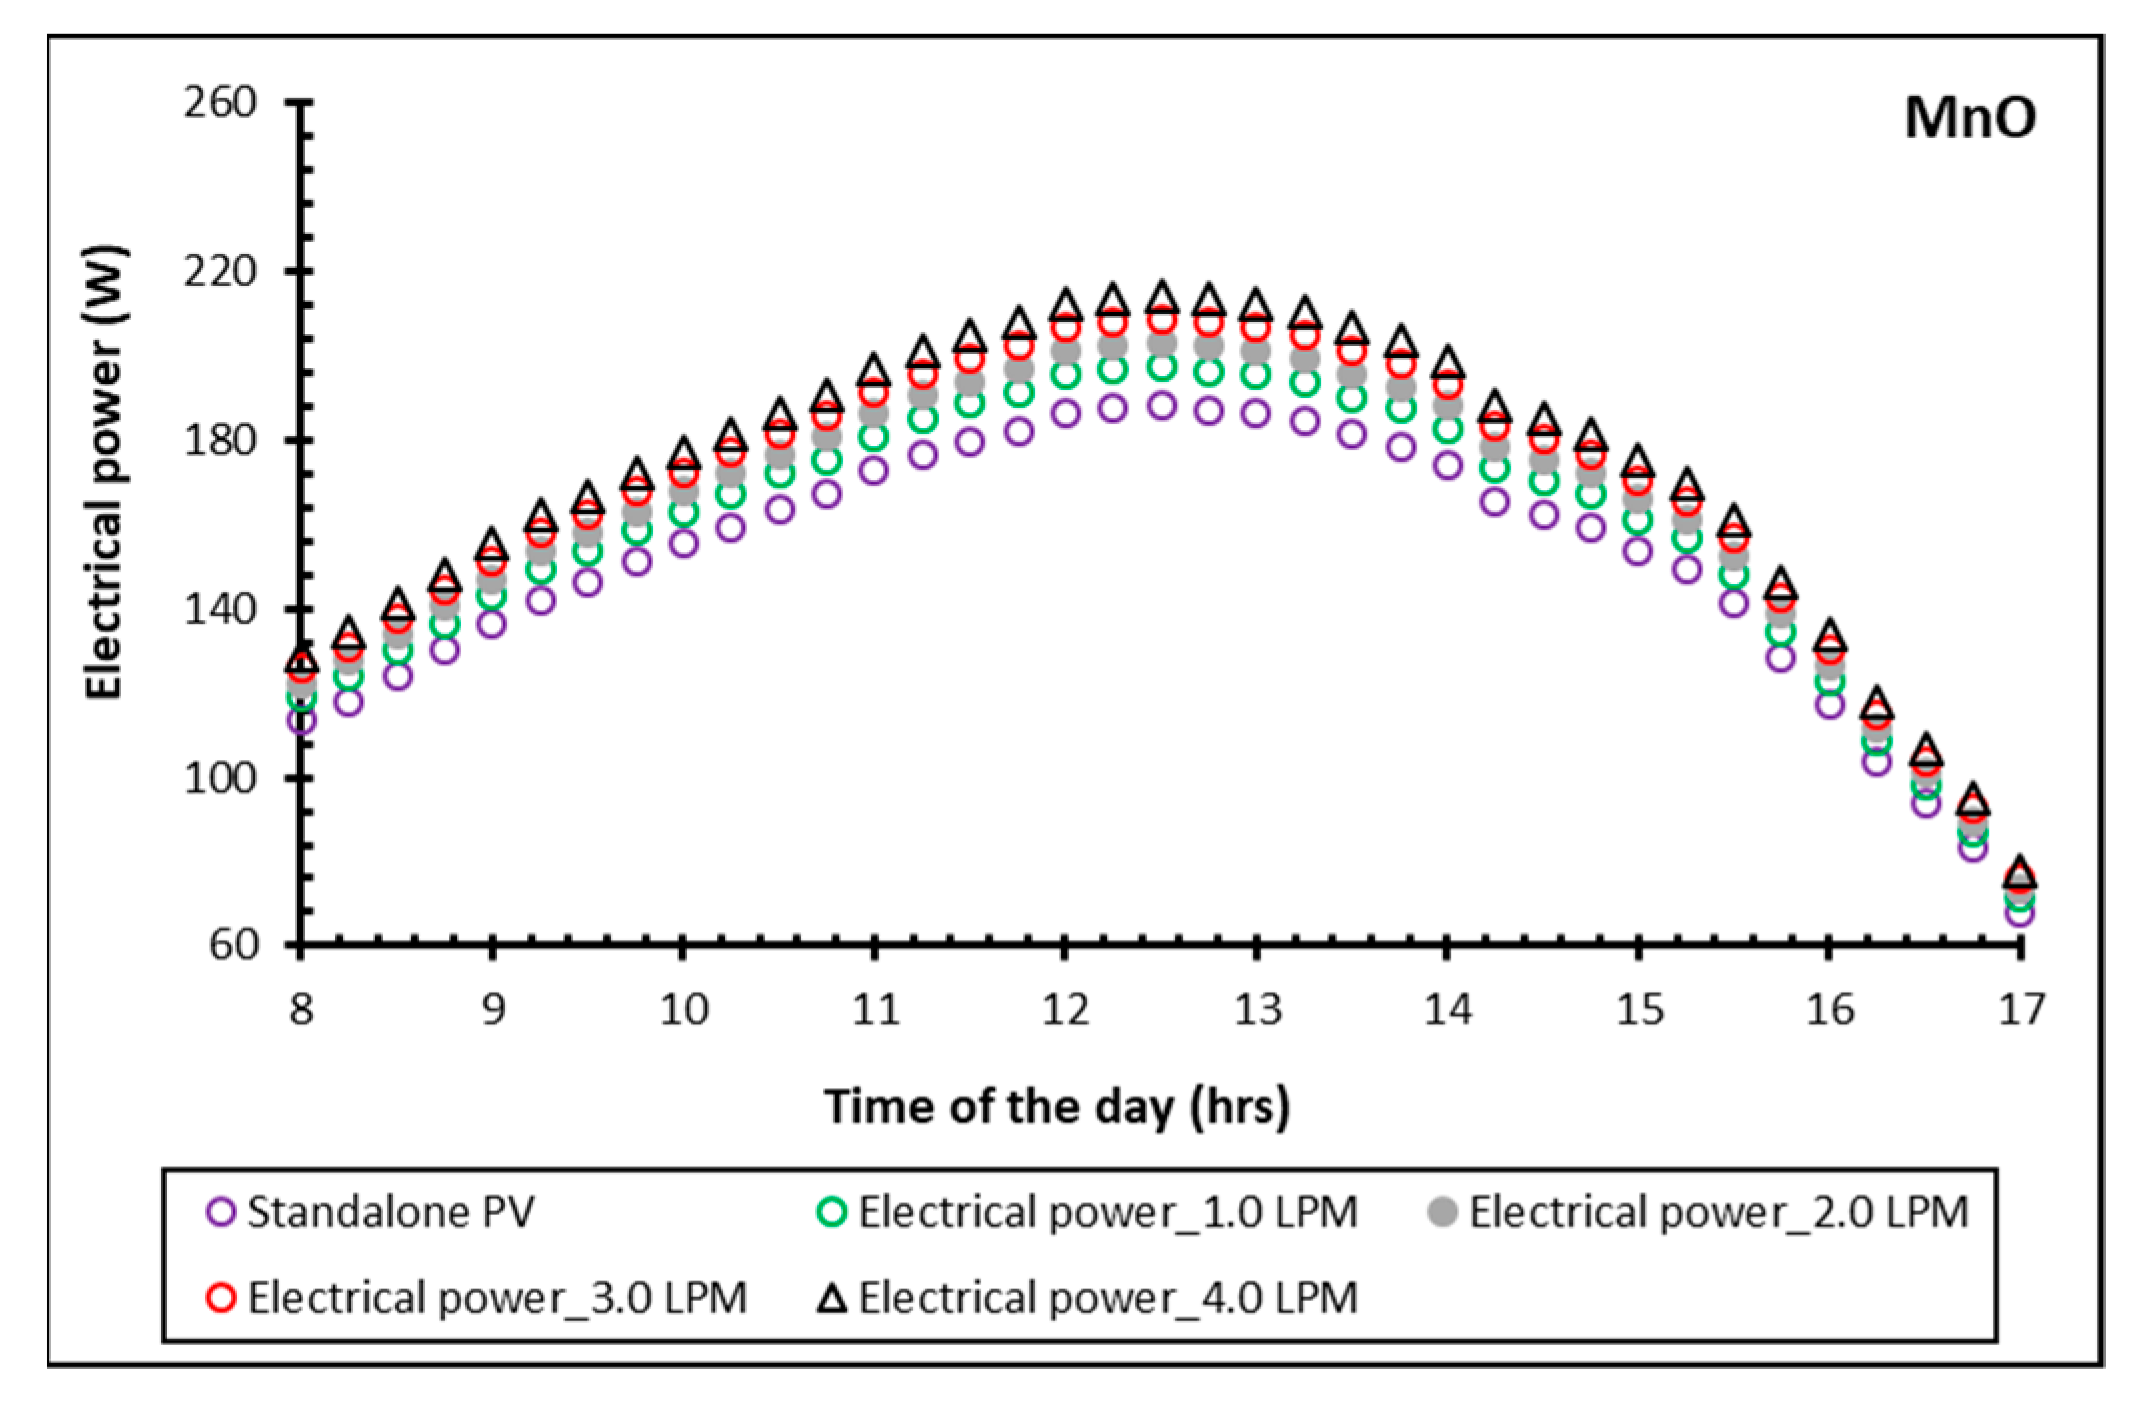
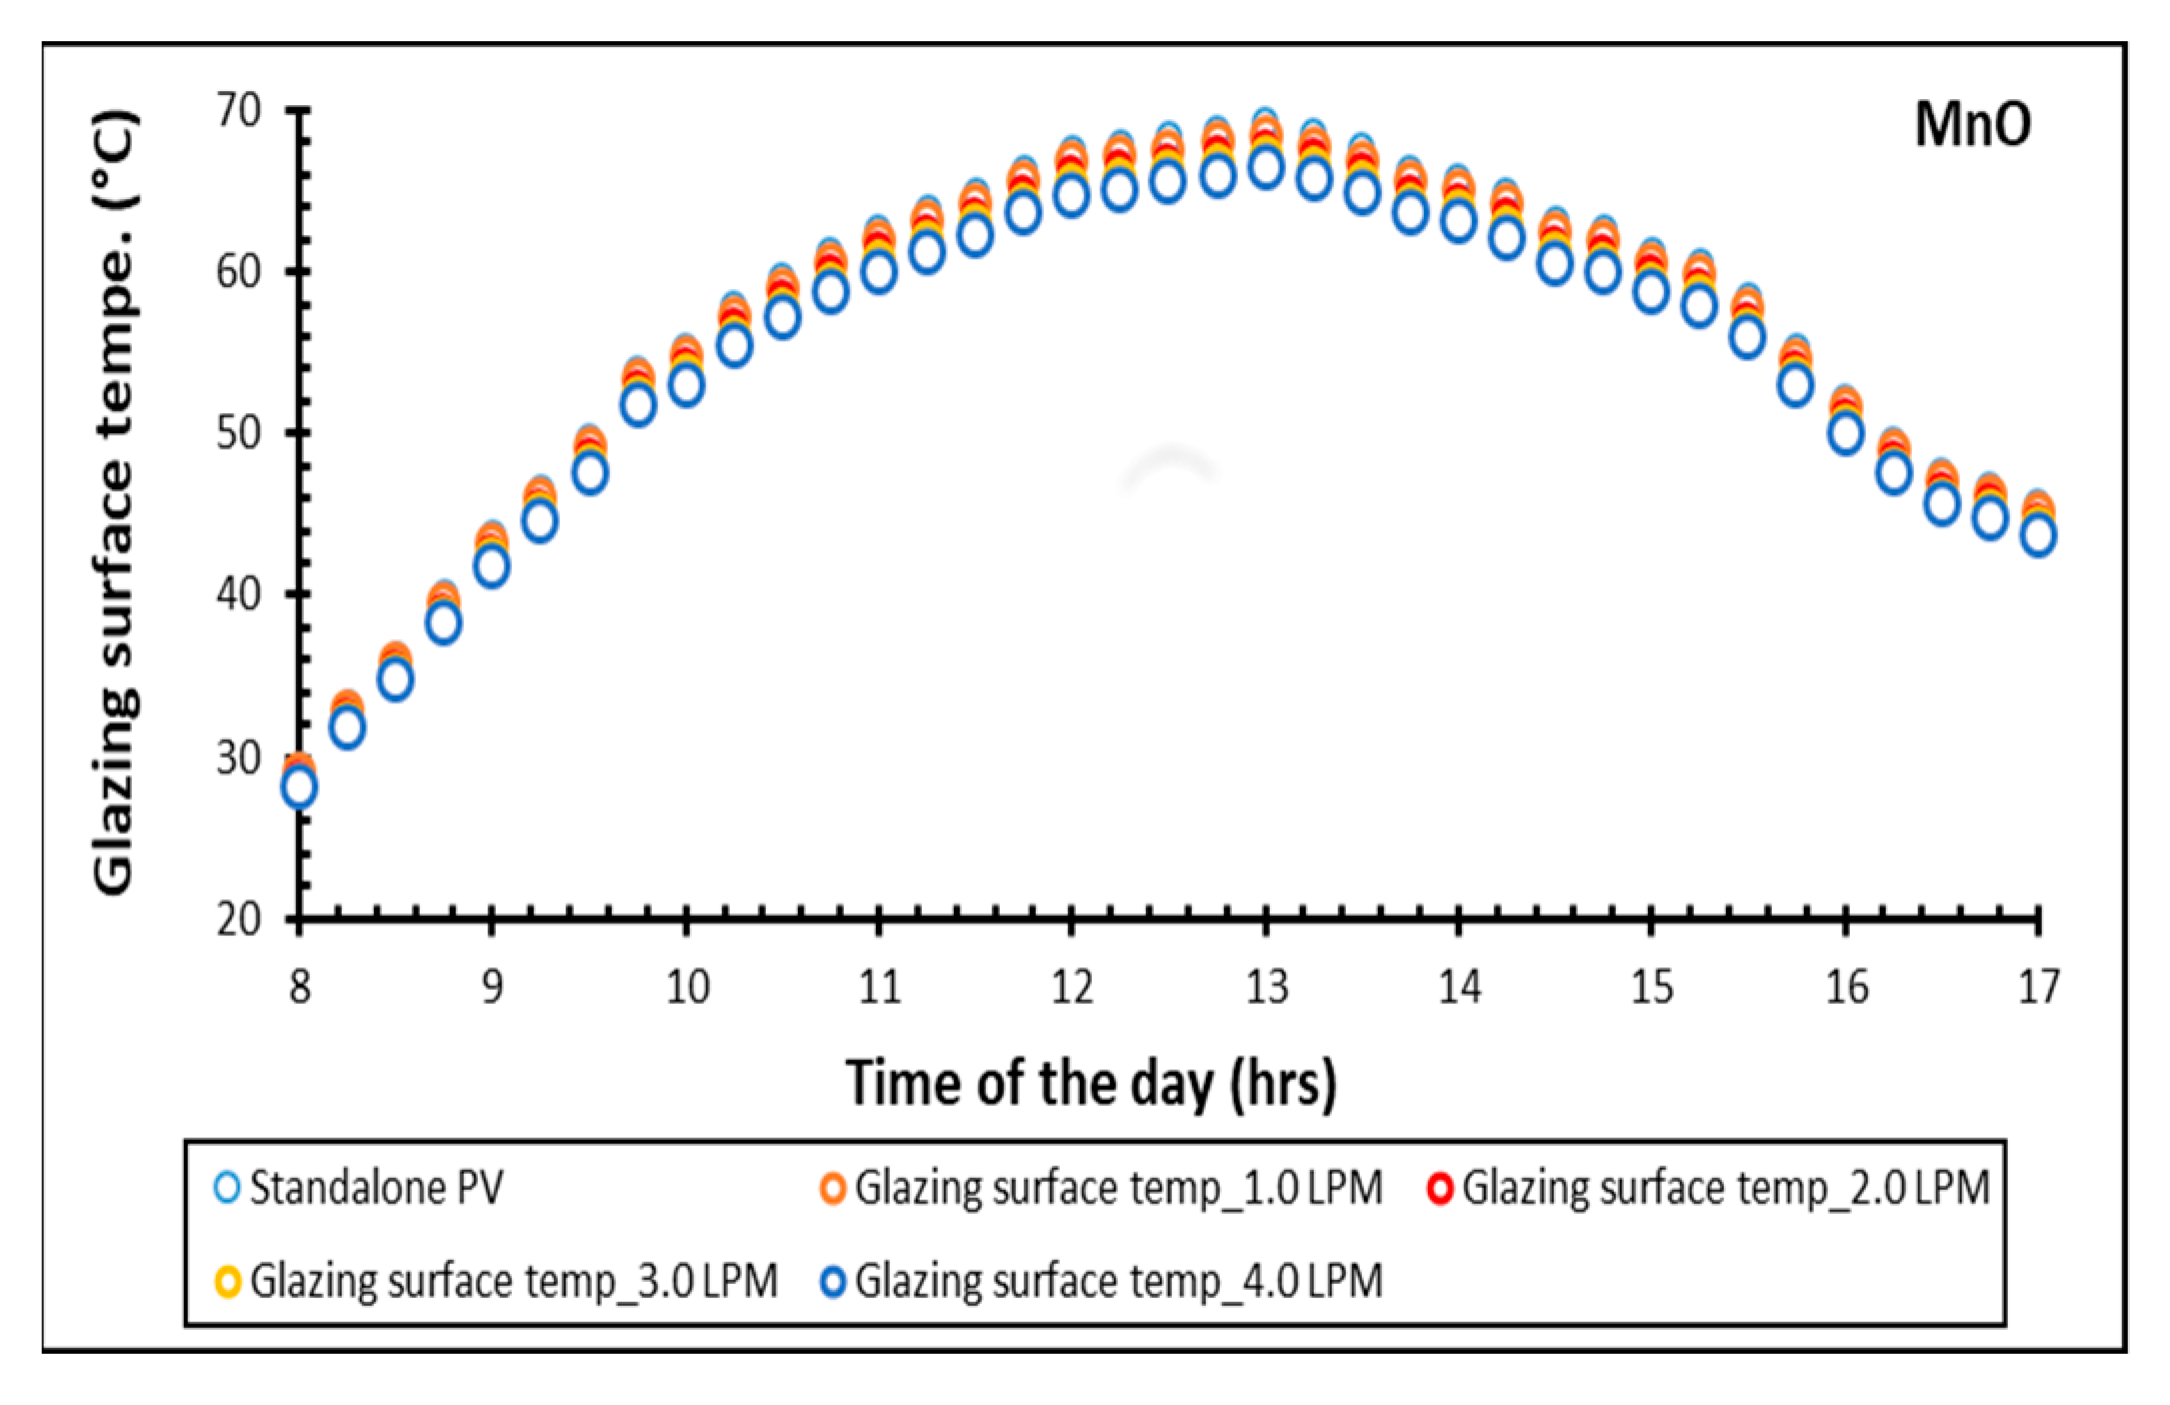
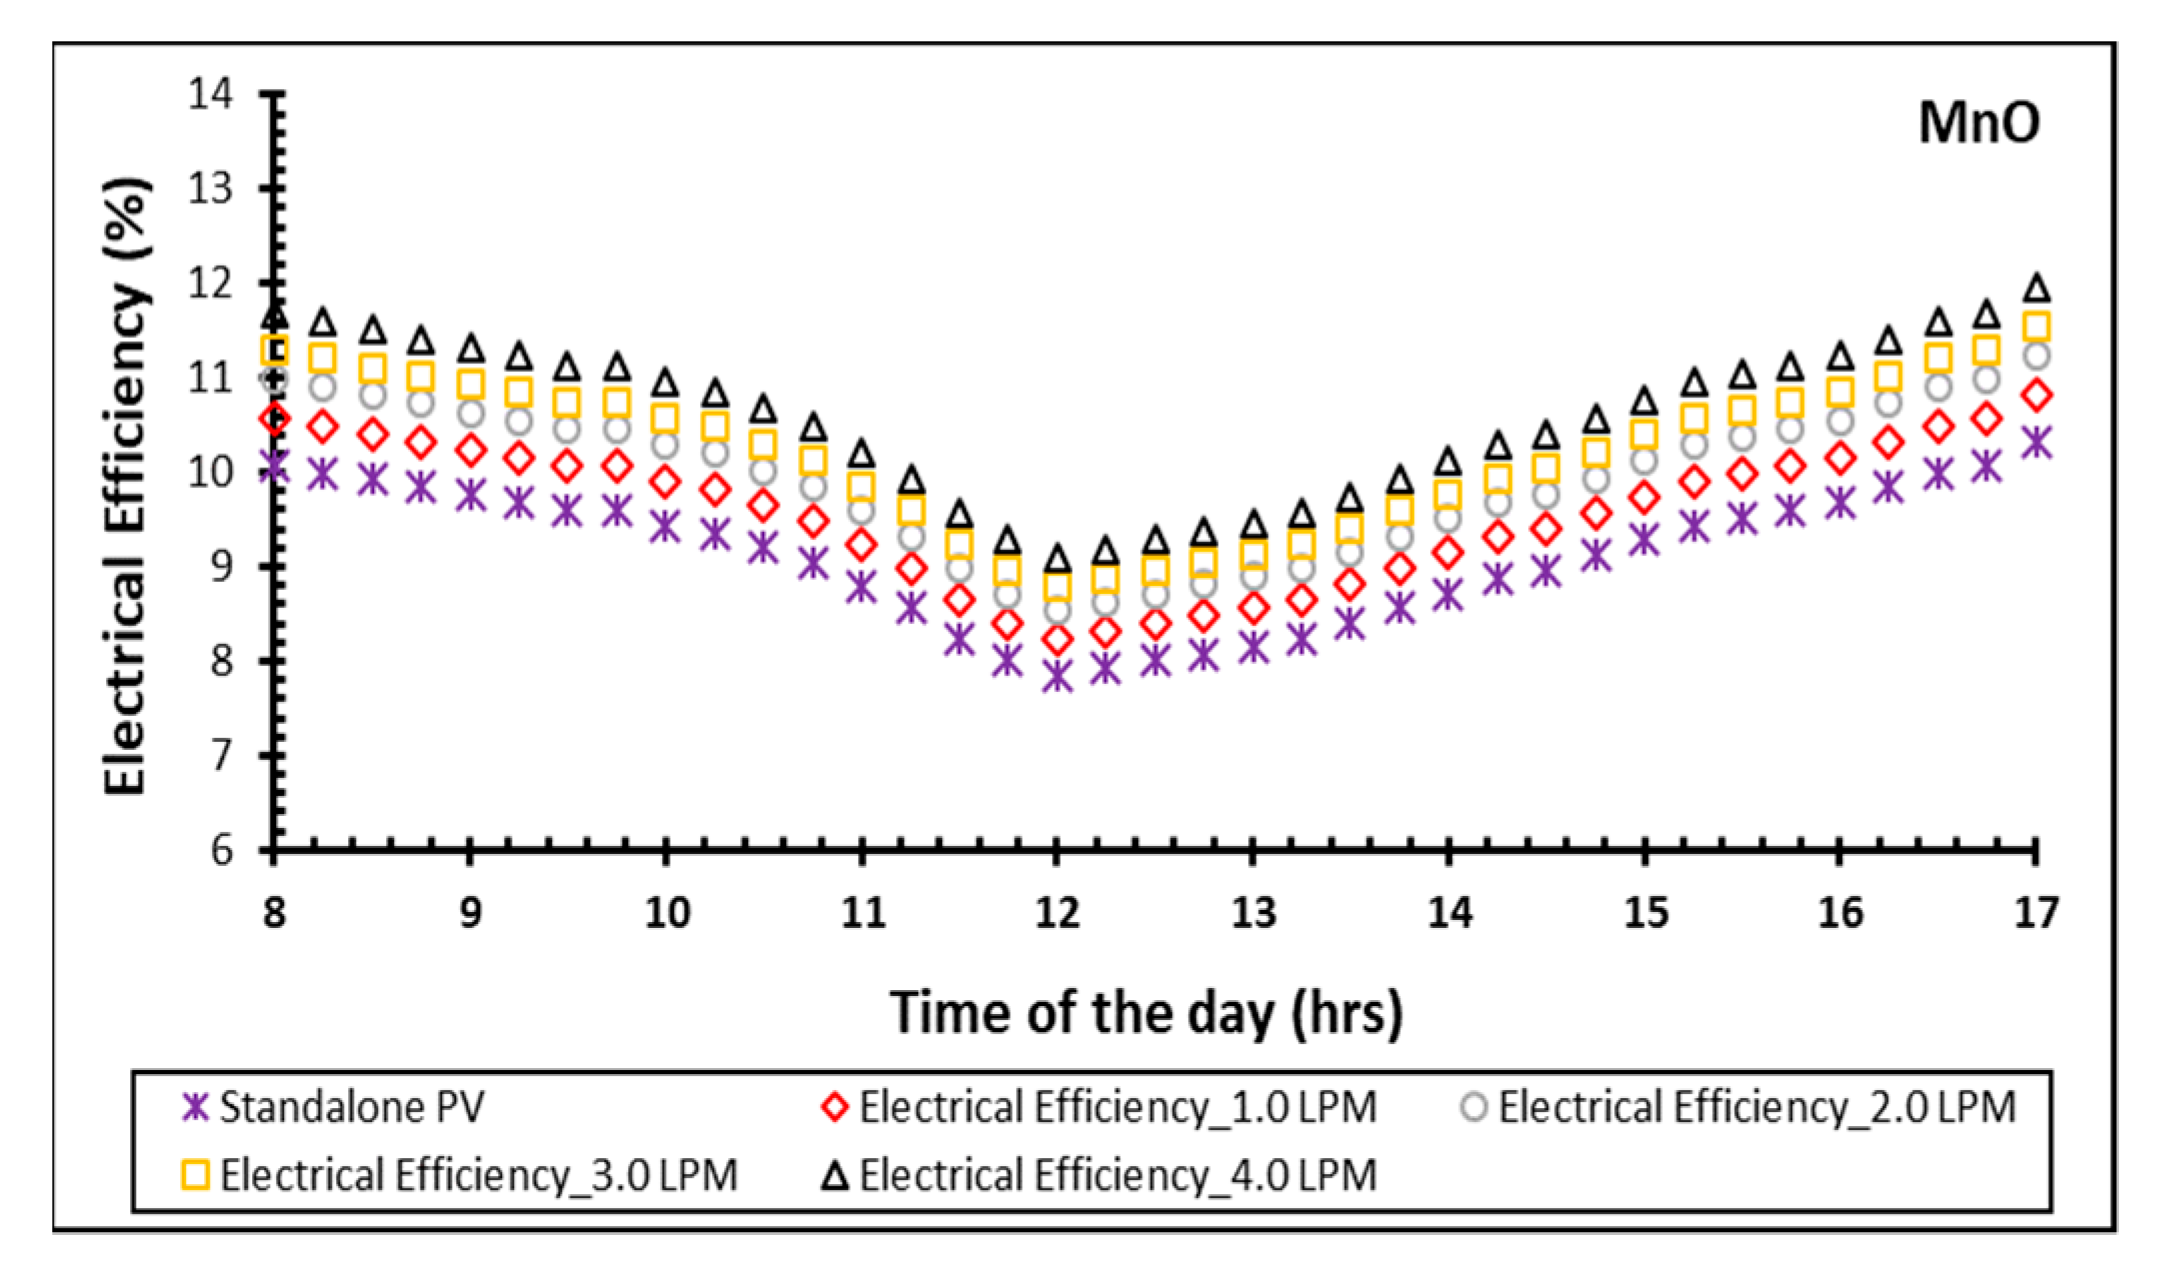
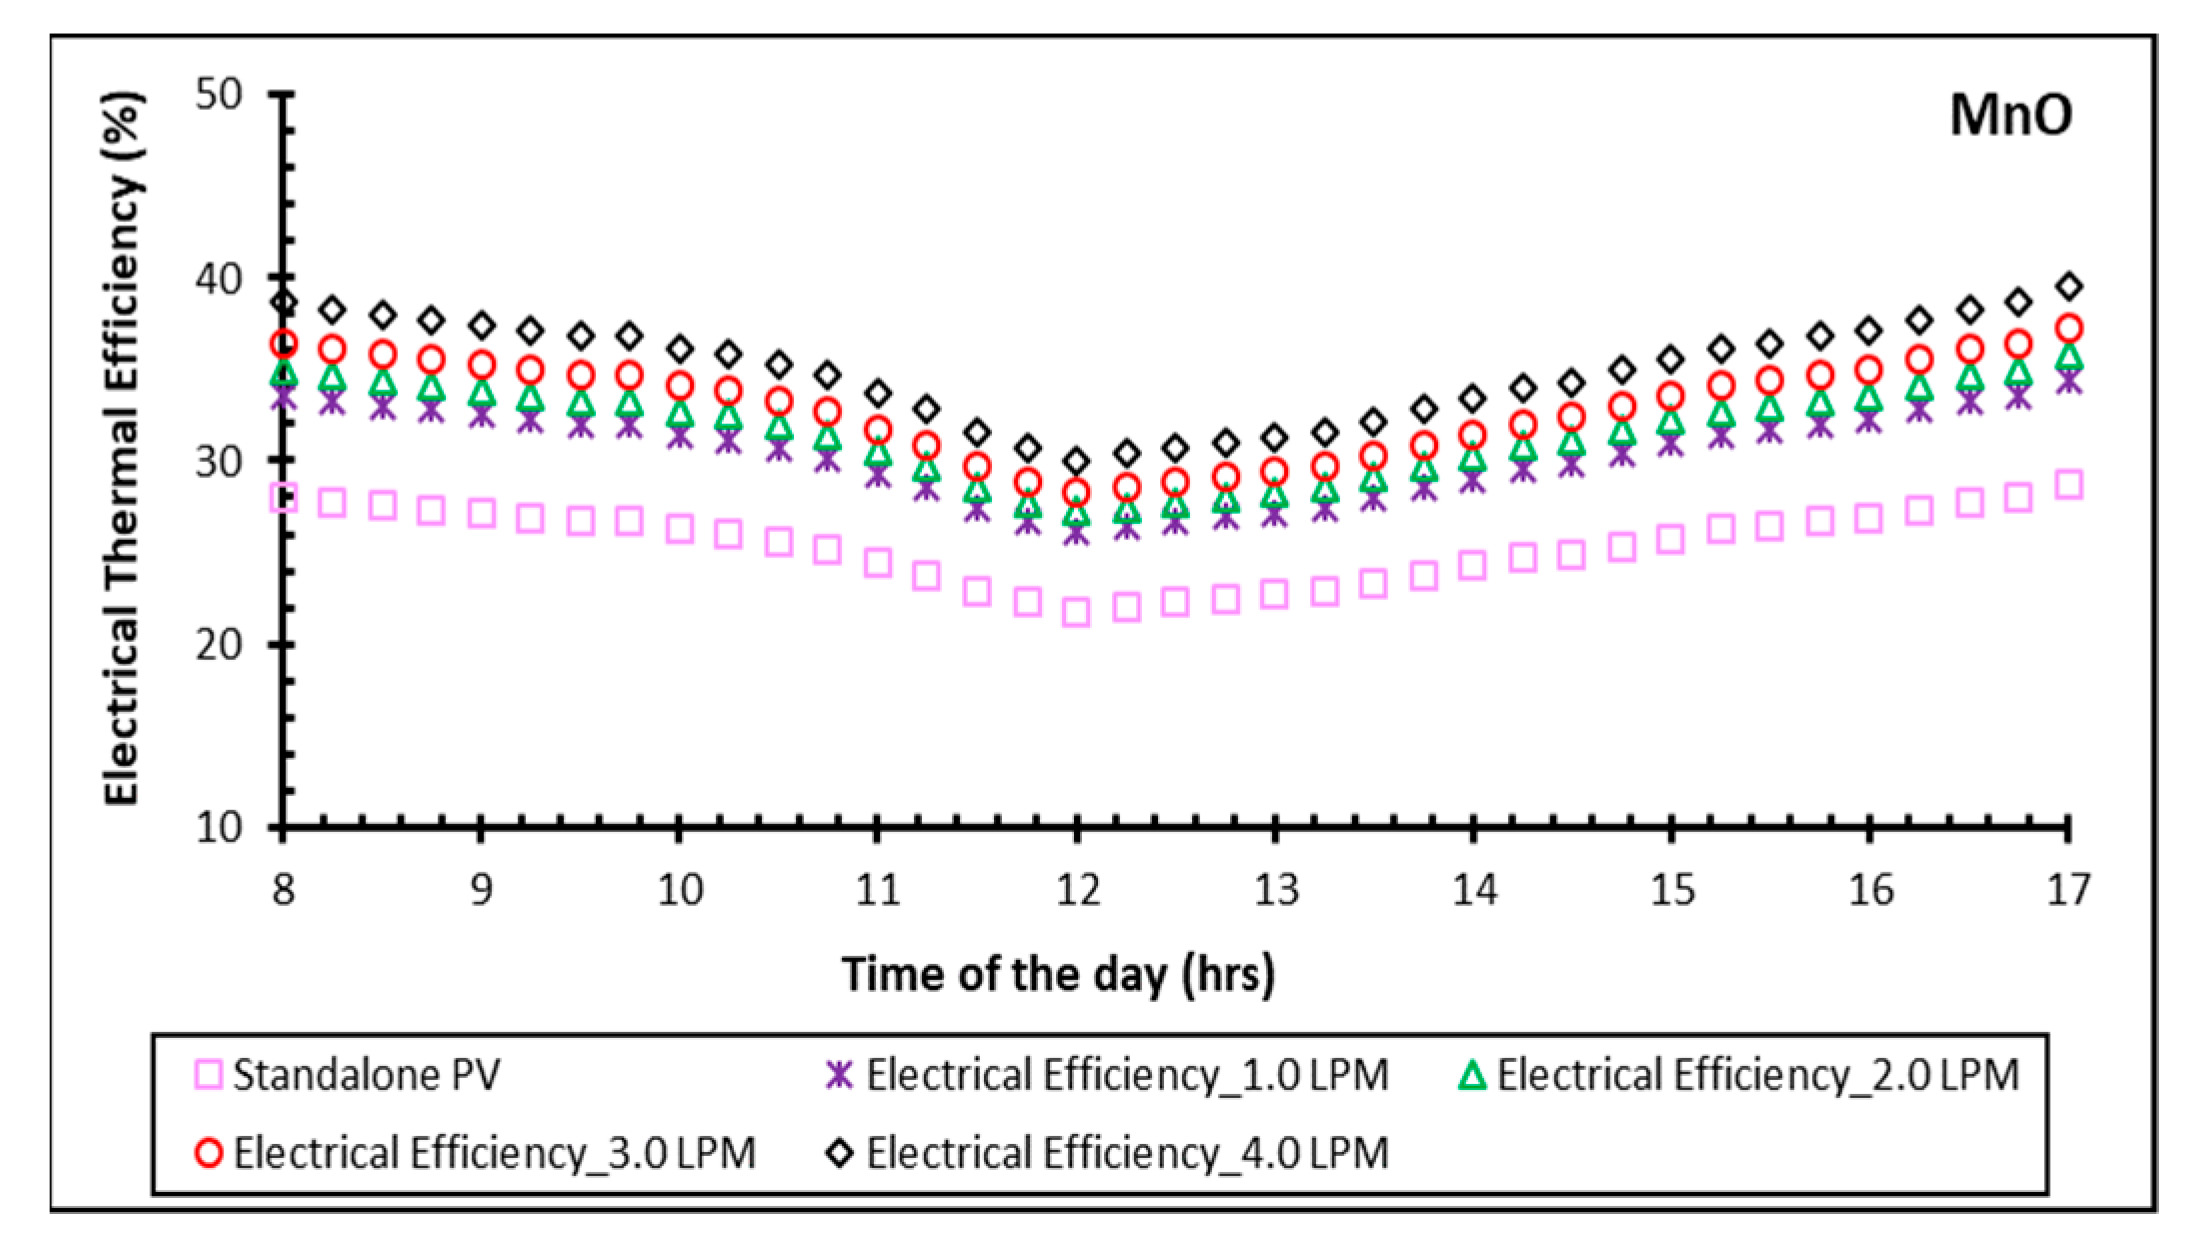
5.3. Investigation of Liquid-Based MnO as a Coolant in Photovoltaic Thermal Collector

Despite having a larger heat-carrying capacity, water has its own challenges, such as leaks, weak showing, and other connected issues. In this experimental study, water-based MnO nanofluid outperformed all other fluids in all categories. An efficiency analysis was performed utilizing MnO nanofluid as the working fluid to increase the performance of the solar thermal collector. The liquid photovoltaic thermal collector was used as a reference to confirm the efficiency enhancement of the photovoltaic thermal collector employing MnO nanofluid as the working fluid. The cooling nanofluids in PVT systems are determined by certain parameters, such as the fluid’s viscosity, density, and thermal conductivity, which are greater in nanofluids than in the base fluid [41,42].
Figure 11 depicts the time-dependent fluctuations in electrical power achieved for all investigated liquid-based MnO nanofluid flow rates ranging from 1 to 4 LPM. As previously stated, Equation (2) may be used with a stand-alone PV system to create electrical power for all four flow rates. The generation of electrical power demonstrates the lifetime of the PV or PVT system as well as the application elements of the concerned system. The average electrical power production at flow rates ranging from 1 to 4 LPM was 152.3 W, 164.5 W, 169.1 W, 175.1 W, and 182.8 W. At flow rates ranging from 1 to 4 LPM, the greatest electrical power produced was 188 W, 203 W, 209 W, 216 W, and 226 W.
The trends in the glazing surface obtained over time for all investigated flow rates of 1–4 LPM of liquid-based MnO nanofluid are shown in Figure 12. Every 1 °C increase in temperature over the recommended operating temperature on the PV panel surface results in a 0.5%drop in efficiency. Overheating solar cells generates thermal stress, reducing the lifespan of PV cells [7,8,9]. The average glazing surface or solar panel temperatures were 57.1 °C, 55.4 °C, 54.2 °C, 53.1 °C, and 52.5 °C for flow rates ranging from 1 to 4 LPM. The greatest glazing surface temperatures for the four flow rates of 1–4 LPM with a freestanding PV system were 69.2 °C, 67.1 °C, 65.7 °C, 64.4 °C, and 63.7 °C.
The graph in Figure 13 depicts the trends in electrical efficiency obtained over time for all investigated flow rates of 1–4 LPM of liquid-based MnO nanofluid. The MnO nanofluid module attained the highest electrical efficiency because the surface temperature of the PVT system was lower than that of a solo PV module. The use of MnO nanofluids improved electrical efficiency as well, improving electrical efficiency at a flow rate of 4 LPM, greater than other flow rates and a stand-alone PV system. Because MnO nanoparticles have better thermal conductivity than water, they may remove more heat from a system in less time. The average glazing surface or solar panel temperatures were 9.2%, 11.1%, 11.5%, 11.9%, and 12.6% for flow rates ranging from 1 to 4 LPM. The greatest glazing surface temperatures were 10.3%, 12.4%, 12.9%, 13.4%, and 14.2% for the four flow rates of 1–4 LPM with a freestanding PV system.
The trends in electrical efficiency achieved over time for all investigated flow rates of 1–4 LPM of liquid-based MnO nanofluid are shown in Figure 14. Electrical efficiency and electrical thermal efficiency factors were directly reliant on one another. The average electrical thermal efficiencies were 25.4%, 30.5%, 31.8%, 33.1%, and 35.1% for flow rates ranging from 1 to 4 LPM. The greatest electrical thermal efficiencies for the four flow rates of 1–4 LPM with a freestanding PV system were 28.7%, 34.4%, 35.8%, 37.3%, and 39.6%.

6. Conclusions

The goal of this research was to study the performance of a recently designed photovoltaic thermal collector. Four different flow rates of liquid and liquid-based MnO nanofluids were measured and compared to a stand-alone PV system. The following is a summary of the research findings:
  • Electrical efficiency was achieved in a spectrum of 8.2% to 12.1% for liquid-type PVT systems, and 9.4% to 14.2% for liquid-based MnO nanofluid PVT systems;
  • Electrical thermal efficiency was achieved in a range of 22.9% to 33.3% for liquid-type PVT systems, while electrical thermal efficiency was achieved at a limit of 26.1% to 39.6% for liquid-based MnO nanofluid PVT systems.

Author Contributions

Conceptualization, S.S.; Methodology, H.A.M.; Software, H.A.M. and E.M.A.; Validation, S.S., V.N. and J.E.A.Q.; Formal analysis, S.S. and R.S.; Investigation, V.N. and R.S.; Resources, M.A.E.-M.; Data curation, E.M.A. and J.E.A.Q.; Writing—original draft, S.S.; Writing—review & editing, V.N. and J.E.A.Q.; Visualization, H.A.M., M.A.E.-M. and R.S.; Supervision, E.A.N.; Project administration, E.A.N.; Funding acquisition, E.A.N. and M.A.E.-M.. All authors have read and agreed to the published version of the manuscript.

Funding

The authors extend their appreciation to the Deputyship for Research & Innovation, Ministry of Education, Saudi Arabia, for funding this research work through project number IFKSURG-2-1249.

Institutional Review Board Statement

Not applicable.

Informed Consent Statement

Not applicable.

Data Availability Statement

Not applicable.

Acknowledgments

The Authors Extend their Appreciation to the Deputyship for Research & Innovation, Ministry of Education in Saudi Arabia for Funding this Research work through the Project NO. (IFKSURG-2-1249).

Conflicts of Interest

The authors declare no conflict of interest.

References

  1. UNFCCC. Available online: https://unfccc.int/process-and-meetings/the-convention/the-convention (accessed on 6 March 2023).
  2. Paris Agreement. Available online: https://unfccc.int/process-and-meetings/the-paris-agreement/the-paris-agreement (accessed on 6 March 2023).
  3. UNFCCC. The Kyoto Protocol. Available online: https://unfccc.int/process/the-kyoto-protocol (accessed on 6 March 2023).
  4. Al-Maamary, H.M.S.; Kazem, H.A.; Chaichan, M.T. Changing the energy profile of the GCC States: A review. Int. J. Appl. Eng. Res. 2016, 11, 1980–1988. [Google Scholar]
  5. Al-Maamary, H.M.S.; Kazem Hussein, A.; Chaichan Miqdam, T. Renewable energy and GCC States energy challenges in the 21st century: A review. Int. J. Comput. Appl. Sci. 2017, 2, 11–18. [Google Scholar] [CrossRef]
  6. Bahaidarah, H.M.; Baloch, A.A.; Gandhidasan, P. Uniform cooling of photovoltaic panels: A review. Renew. Sustain. Energy Rev. 2016, 57, 1520–1544. [Google Scholar] [CrossRef]
  7. Chandel, S.S.; Agarwal, T. Review of cooling techniques using phase change materials for enhancing efficiency of photovoltaic power systems. Renew. Sustain. Energy Rev. 2017, 73, 1342–1351. [Google Scholar] [CrossRef]
  8. Chauhan, A.; Tyagi, V.V.; Anand, S. Futuristic approach for thermal management in solar PV/thermal systems with possible applications. Energy Convers. Manag. 2018, 163, 314–354. [Google Scholar] [CrossRef]
  9. Nadda, R.; Kumar, A.; Maithani, R. Efficiency improvement of solar photovoltaic/solar air collectors by using impingement jets: A review. Renew. Sustain. Energy Rev. 2018, 93, 331–353. [Google Scholar] [CrossRef]
  10. Shukla, A.; Kant, K.; Sharma, A.; Biwole, P.H. Cooling methodologies of photovoltaic module for enhancing electrical efficiency: A review. Sol. Energy Mater. Sol. Cells 2017, 160, 275–286. [Google Scholar] [CrossRef]
  11. Hasanuzzaman, M.; Malek, A.B.M.A.; Islam, M.M.; Pandey, A.K.; Rahim, N.A. Global advancement of cooling technologies for PV systems: A review. Sol. Energy 2016, 137, 25–45. [Google Scholar] [CrossRef]
  12. Chol, S.; Estman, J. Enhancing thermal conductivity of fluids with nanoparticles. In Proceedings of the 1995 International Mechanical Engineering Congress and Exhibition, San Francisco, CA, USA, 12–17 November 1995; Volume 231, pp. 99–106. [Google Scholar]
  13. Sridhara, V.; Satapathy, L.N. MnO-based nanofluids: A review. Nanoscale Res. Lett. 2011, 6, 456. [Google Scholar] [CrossRef] [Green Version]
  14. Esfe, M.H.; Karimipour, A.; Yan, W.-M.; Akbari, M.; Safaei, M.R.; Dahari, M. Experimental study on thermal conductivity of ethylene glycol based nanofluids containing MnO nanoparticles. Int. J. Heat Mass Transf. 2015, 88, 728–734. [Google Scholar] [CrossRef]
  15. Ebrahimnia-Bajestan, E.; Moghadam, M.C.; Niazmand, H.; Daungthongsuk, W.; Wongwises, S. Experimental and numerical investigation of nanofluids heat transfer characteristics for application in solar heat exchangers. Int. J. Heat Mass Transf. 2016, 92, 1041–1052. [Google Scholar] [CrossRef]
  16. Minea, A.A. Hybrid nanofluids based on MnO, TiO2 and SiO2: Numerical evaluation of different approaches. Int. J. Heat Mass Transf. 2017, 104, 852–860. [Google Scholar] [CrossRef]
  17. Wang, X.; Wu, H.; Chen, P. Pressure drop and heat transfer of MnO-H2O nanofluids through silicon microchannels. J. Micromech. Microeng. 2009, 19, 105020. [Google Scholar]
  18. Sardarabadi, M.; Passandideh-Fard, M.; Heris, S.Z. Experimental investigation of the effects of silica/water nanofluid on PV/T (photovoltaic thermal units). Energy 2014, 66, 264–272. [Google Scholar] [CrossRef]
  19. Ghadiri, M.; Sardarabadi, M.; Pasandideh-fard, M.; Moghadam, A.J. Experimental investigation of a PVT system performance using nano ferrofluids. Energy Convers. Manag. 2015, 103, 468–476. [Google Scholar] [CrossRef]
  20. Sardarabadi, M.; Passandideh-Fard, M. Experimental and numerical study of metaloxides/ water nanofluids as coolant in photovoltaic thermal systems (PVT). Sol. Energy Mater. Sol. Cells 2016, 157, 533–542. [Google Scholar] [CrossRef]
  21. Al-Shamani, A.N.; Sopian, K.; Mat, S.; Hasan, H.A.; Abed, A.M.; Ruslan, M.H. Experimental studies of rectangular tube absorber photovoltaic thermal collector with various types of nanofluids under the tropical climate conditions. Energy Convers. Manag. 2016, 124, 528–542. [Google Scholar] [CrossRef]
  22. Soltani, S.; Kasaeian, A.; Hamid, S.; Wen, D. An experimental investigation of a hybrid photovoltaic/thermoelectric system with nanofluid application. Sol. Energy 2017, 155, 1033–1043. [Google Scholar] [CrossRef]
  23. Al-Waeli, A.H.A.; Sopian, K.; Chaichan Miqdam, T.; Kazem, H.A.; Hasan, H.A.; Al-Shamani, A.N. An experimental investigation of SiC nanofluid as a base-fluid for a photovoltaic thermal PV/T system. Energy Convers. Manag. 2017, 142, 547–558. [Google Scholar] [CrossRef]
  24. Aberoumand, S.; Jafarimoghaddam, A. Mixed convection heat transfer of nanofluids inside curved tubes: An experimental study. Appl. Therm. Eng. 2016, 108, 967–979. [Google Scholar] [CrossRef]
  25. Aberoumand, S.; Jafarimoghaddam, A. Experimental study on synthesis, stability, thermal conductivity and viscosity of Cu–engine oil nanofluid. J. Taiwan Inst. Chem. Eng. 2017, 71, 315–322. [Google Scholar] [CrossRef]
  26. Srimanickam, B.; Vijayalakshmi, M.M.; Natarajan, E. Energy and exergy efficiency of flat plate PVT collector with forced convection. J. Test. Eval. 2018, 46, 783–797. [Google Scholar] [CrossRef]
  27. Srimanickam, B.; Saranya, A. Thermal performance of single glazing flat plate photovoltaic thermal hybrid system with various air channels. J. Test. Eval. 2019, 49, 2119–2150. [Google Scholar] [CrossRef]
  28. Bergene, T.; Løvvik, O.M. Model calculations on a flat-plate solar heat collector with integrated solar cells. Sol. Energy 1995, 55, 453–462. [Google Scholar] [CrossRef]
  29. Ibrahim, A.; Othman, M.Y.; Ruslan, M.H.; Mat, S.; Zaharim, A.; Sopian, K. Experimental studies on water based photovoltaic thermal collector (PVT). In Selected Topics in System Science and Simulation in Engineering; UTM Press: Johor Bahru, Malaysia, 2013. [Google Scholar]
  30. Alzaabi, A.A.; Badawiyeh, N.K.; Hantoush, H.O.; Hamid, A.K. Electrical/thermal performance of hybrid PV/T system in Sharjah, UAE. Int. J. Smart Grid Clean Energy 2014, 3, 385–389. [Google Scholar] [CrossRef] [Green Version]
  31. Hussain, F.; Othman, M.Y.H.; Yatim, B.; Ruslan, H.; Sopian, K.; Ibarahim, Z. A study of PV/T collector with honeycomb heat exchanger. AIP Conf. Proc. 2013, 1571, 10–16. [Google Scholar]
  32. Wang, G.; Quan, Z.; Zhao, Y.; Sun, C.; Tong, J. Performance Studies on a Novel Solar PV/T-air Dual Heat Source Heat Pump System. Procedia Eng. 2015, 121, 771–778. [Google Scholar] [CrossRef] [Green Version]
  33. Buonomano, A.; Calise, F.; Vicidomini, M. Design, simulation and experimental investigation of a solar system based on PV panels and PVT collectors. Energies 2016, 9, 497. [Google Scholar] [CrossRef]
  34. Sahin, A.D.; Dincer, I.; Rosen, M.A. Thermodynamic analysis of solar photovoltaic cell systems. Sol. Energy Mater. Sol. Cells 2007, 91, 153–159. [Google Scholar] [CrossRef]
  35. Gaur, A.; Ménézo, C.; Giroux, S. Numerical studies on thermal and electrical performance of a fully wetted absorber PVT collector with PCM as a storage medium. Renew. Energy 2017, 109, 168–187. [Google Scholar] [CrossRef]
  36. A Strategy for Growth of Electrical Energy in India, Document 10, Department of Atomic Energy, Government of India. Available online: https://dae.gov.in/node/123 (accessed on 15 January 2023).
  37. Srimanickam, B.; Vijayalakshmi, M.M.; Natarajan, E. Experimental Study of Exergy Analysis on Flat Plate Solar Photovoltaic Thermal (PV/T) Hybrid System. Appl. Mech. Mater. 2015, 787, 82–87. [Google Scholar] [CrossRef]
  38. Al-Waeli, A.H.; Sopian, K.; Chaichan, M.T.; Kazem, H.A.; Ibrahim, A.; Mat, S.; Ruslan, M.H. Evaluation of the nanofluid and nano-PCM based photovoltaic thermal (PVT) system: An experimental study. Energy Convers. Manag. 2017, 151, 693–708. [Google Scholar] [CrossRef]
  39. Al-Waeli, A.H.A.; Sopian, K.; Kazem, H.A.; Yousif, J.H.; Chaichan, M.T.; Ibrahim, A.; Mat, S.; Ruslan, M.H. Comparison of prediction methods of PV/T nanofluid and nano-PCM system using a measured dataset and artificial neural network. Sol. Energy 2018, 162, 378–396. [Google Scholar] [CrossRef]
  40. Al-Waeli, A.H.A.; Chaichan, M.T.; Sopian, K.; Kazem, H.A.; Mahood, H.B.; Khadom, A.A. Modeling and experimental validation of a PVT system using nanofluid coolant and nano-PCM. Sol. Energy 2019, 177, 178–191. [Google Scholar] [CrossRef]
  41. Kazem, H.A.; Yousif, J.H.; Chaichan, M.T. Modeling of daily solar energy system prediction using support vector machine for Oman. Int. J. Appl. Eng. Res. 2016, 11, 10166–10172. [Google Scholar]
  42. Yousif, J.H.; Kazem, H.A.; Boland, J. Predictive models for photovoltaic electricity production in hot weather conditions. Energies 2017, 10, 971. [Google Scholar] [CrossRef]
Figure 1. Photographic depiction of the experimental procedure.
Sustainability 15 06136 g001
Figure 2. Schematic view of the tested study.
Sustainability 15 06136 g002
Figure 3. Pictorial view of copper tube along with a solar panel.
Sustainability 15 06136 g003
Figure 4. Preparation of nanoparticles and nanofluid in the Laboratory.
Sustainability 15 06136 g004
Figure 5. SEM image of MnO nanoparticle.
Sustainability 15 06136 g005
Figure 6. Average experimental day—meteorological data.
Sustainability 15 06136 g006
Figure 7. Electrical power generation of four flow rates with a stand-alone PV system with water as a coolant.
Sustainability 15 06136 g007
Figure 8. Glazing surface temperature of four flow rates with a stand-alone PV system with water as a coolant.
Sustainability 15 06136 g008
Figure 9. Electrical efficiency of four flow rates with a stand-alone PV system with water as a coolant.
Sustainability 15 06136 g009
Figure 10. Electrical thermal efficiency of four flow rates with a stand-alone PV system with water as a coolant.
Sustainability 15 06136 g010
Figure 11. Electrical power generation of four flow rates with a stand-alone PV system with Mno as a coolant.
Sustainability 15 06136 g011
Figure 12. Glazing surface temperature of four flow rates with a stand-alone PV system with Mno as a coolant.
Sustainability 15 06136 g012
Figure 13. Electrical efficiency of four flow rates with stand-alone PV system Mno as a coolant.
Sustainability 15 06136 g013
Figure 14. Electrical thermal efficiency of four flow rates with stand-alone PV system Mno as a coolant.
Sustainability 15 06136 g014
Table 1. Performance of solar panels at the standard test conditions.
ParameterValue
Pmax260 W
Amps in Pmax8.42 A
Volts in Pmax30.9 V
Current in Maximum Load8.89 A
Voltage in Maximum Load37.7 V
Weight18.2 Kg
Table 2. Details of Water Pump.
ParameterValue
BrandLakshmi
ModelSP 50
Phase1
Hp0.25
Wattage185
Table 3. Various meteorological data of the test day.
Flow Rate
[Litres per Minute]
Solar Radiation
[W/m2]
Wind Speed
[m/s]
Ambient
Temperature [°C]
1.0–4.0 LPM538.98–1017.271.2–5.826.84–33.66
Disclaimer/Publisher’s Note: The statements, opinions and data contained in all publications are solely those of the individual author(s) and contributor(s) and not of MDPI and/or the editor(s). MDPI and/or the editor(s) disclaim responsibility for any injury to people or property resulting from any ideas, methods, instructions or products referred to in the content.

