Article

The Impact of Green M&A Listed Companies’ Size on the Rural Ecological Environment—Digitalization as Moderating Effect

1
Graduate School of Management, Management and Science University, University Drive, Off Persiaran Olahraga, Section 13, Shah Alam 40100, Malaysia
2
School of Economics and Trade, Henan University of Technology, Zhengzhou 450001, China
3
International Academic Affairs Department, Management and Science University, Shah Alam 40100, Malaysia
*
Author to whom correspondence should be addressed.
Sustainability 2023, 15(7), 6068; https://doi.org/10.3390/su15076068
Submission received: 13 February 2023 / Revised: 16 March 2023 / Accepted: 27 March 2023 / Published: 31 March 2023

Abstract

:
In promoting high-quality economic development, environmental protection has become an essential responsibility for the sustainable development of listed companies. This research constructs and measures the level of rural ecological environment in China based on panel data on the rural ecological environment in Chinese inland provinces. Further, the impact of the size of green M&A listed companies on the rural ecological environment and its moderating effect is analyzed. This study uses the entropy method to measure the Rural Ecosystem Index (REI) and STATA software to conduct OLS, 2SLS, IV-GMM regressions, and regressions on moderating variables. This research aims to analyze the impact of listed companies on the environment and explore the role of the digitalization level’s moderating effect. The results show that the size of green M&A listed companies has a negative effect on the development of the rural ecological environment, and the digitalization level positively moderates the relationship between them. The following conclusions are drawn: (1) The average value of the rural ecological index for the 22 provinces in China ranged from 17.32 to 65.17. The index value is higher in the southeastern coastal region, with the highest values in Jiangsu, Guangdong, Zhejiang, and Fujian provinces. (2) From 2010–2020, green M&A listed companies were divided into 14 sectors. The industries with the most extensive green M&A are the raw chemical, non-metallic, rubber, and plastic industries. (3) During 2010–2016, the quantity of green M&A listed companies in China showed an upward trend with prominent regional non-equilibrium characteristics, then gradually declined in 2017–2020. It shows that the number is higher in the eastern coastal areas and lower in the inland regions. (4) The size of green M&A listed companies has a negative impact on the rural ecological environment. This negative impact has prominent heterogeneous characteristics, and the higher the index of the rural ecological environment is, the more significant its negative impact is. (5) The digitalization level positively moderates the size of green M&A listed companies and the rural ecological environment. The positive influence of the size of green M&A listed companies on the development level of the rural ecological environment is more significant in the regions with a higher degree of rural digitalization. In other words, the increase in the level of rural digitalization can improve the negative effect of the size of green M&A listed companies on the ecological environment. Based on the above findings, this paper puts forward corresponding countermeasure suggestions.

1. Introduction

The extensive economic development model has resulted in significant environmental issues over the years in China. The release of pollutants from industrial expansion causes severe haze weather, which means China’s environmental pollution control faces numerous challenges. The government and enterprises will continuously take more practical steps to develop a sustainable governance system to achieve sustainable and ecological goals. The Chinese government declared in 2020 that carbon dioxide emissions would be capped by 2030, and that they would strive for carbon neutrality by 2060. The future development of the Chinese economy will adhere to the basic principles of environmental protection, encourage industry to achieve global sustainable development goals, and contribute to world ecological security. Such action demonstrates the Chinese government’s confidence in the industrial sector’s structural change when facing the challenge of international environmental protection. To attain this ambitious aim, companies consuming energy and resources must obey the critical cooperate social responsibility issues of lowering carbon emissions, conserving resources, and reducing pollution emissions [1]. The government must firmly implement stringent environmental protection laws and regulations to promote green development. China’s rapid growth has also spawned various ecological problems. Environmental problems have become one of the significant social issues that companies must face in business management, and competing under the premise of social responsibility and environmental protection has become a consensus of enterprise operation. Green mergers and acquisitions (M&A) have become a vital choice for many heavily polluting enterprises to fulfill the government’s regulatory requirements.
The 18th National Congress of China designated “green development, circular development, and low-carbon development” as a significant development concept in 2012. It marked the beginning of the green transformation of the production mode of Chinese enterprises. China’s current green development strategy combines environmental regulatory laws and green industry plans. The Chinese government has created increasingly stricter industry pollution standards and set emission reduction targets, programs, and regulations. Regarding green industry policies, the Chinese government encourages the development of a low-carbon economy and incentives for industries through preferential tax policies and technological innovation, enabling enterprises to take the initiative to achieve green transformation [2]. Under the dual environmental regulation and green industrial policies [3], businesses select green M&A as a critical approach to achieving sustainable transformation when facing external pressure and internal motivation. Green M&A has become a better choice for many companies seeking to actively fulfill their government supervision obligations and realize the long-term goal of sustainable development of enterprises. With the continuous deepening of China’s ecological civilization construction, green M&A is increasingly favored by the capital market and listed companies and has become an important choice of green investment for enterprises.
At the national conference in 2017, the administration established the strategy of “innovation, coordination, green, openness, and sharing.” Green development has become the main principle of future green and low-carbon development, which means the transformation development of heavily polluting enterprises will become the primary trend in the future. Based on the “Notice on Environmental Protection Verification of Enterprises Applying for Listing and Listed Enterprises Applying for Refinancing” Notice on issuance in the “Listed Companies’ Environmental Management Industry Classification Management Directory” released by the National Administration in China, and the “Industry Classification Index of Listed Companies” (2012) issued by the CSRC, this article selects 16 heavily polluting industries, including paper, tanning, coal, etc. Green M&A is essential for heavily polluting listed companies to seek green development [4]. The green M&A listed companies in this research belong to 16 heavily polluting industries that carry out M&A for the goal of green and sustainable growth, which the Chinese Ministry of Environmental Protection specifies. They are the thermal power, iron and steel, cement, electrolytic aluminum, coal, metallurgy, chemical, petrochemical, building materials, paper, brewing, pharmaceutical, fermentation, textile, leather, and mining industries.
Human activities have a significant impact on the quality of the ecological environment. In recent years, as China’s economic growth and urbanization have accelerated, they have caused severe pollution to the ecological environment, which has led to serious challenges to the ecological environment in China’s cities and villages [5]. China’s rural environmental management level has improved in recent years. According to the China Environmental Statistics Yearbook data, China’s rural water supply benefit and toilet penetration have increased yearly. The current rural water supply and toilet penetration rates have reached more than 95% and 81%, and the rural sewage treatment capacity in 2020 has increased three times compared to 2010. The rural greening area grew from 470,000 hectares in 2010 to 730,000 hectares in 2020, and the rural habitat has improved. However, the current environmental problems in China’s rural areas are still worrying, as they face severe challenges such as water pollution control, vegetation destruction, excessive use of chemical fertilizers and pesticides, and industrial pollution. As early as the “12th Five-Year Plan”, China proposed to strengthen the construction of rural infrastructure and public services and promote the comprehensive management of the rural environment, the planning of rural drinking water, rural sewage, and domestic waste treatment, rural environmental monitoring capacity, and rural residents’ awareness of environmental protection requirements. At the beginning of 2022, the 14th Five-Year Plan for Soil, Groundwater, and Rural Ecological Environmental Protection was jointly issued, which plans China’s rural ecological and environmental protection in four aspects: soil, groundwater, agricultural and rural pollution prevention, and control and supervision capacity enhancement. Therefore, promoting ecological and environmental protection in rural areas is of great practical significance.
This research aims to assess the current level of regional development of rural ecology in China and reveal the industry and geographical distribution of green M&A listed companies. It will explore the impact of the size of green M&A listed companies on the rural ecological environment and the moderating effect of the level of rural digitalization. Regarding the novelty of this study, compared to previous studies, it constructs a unique evaluation index system for the rural ecological environment. It also exhibits the regional and industrial distribution of green M&A listed companies between 2010 and 2020. It is the first attempt to explore the impact of the size of green M&A listed companies on the rural ecological environment. This study is the first attempt to analyze the moderating effect of rural digitalization level on the rural environment. Regarding the novelty of the research methodology, on the one hand, the choice of instrumental variables is an essential innovation of this study. To avoid endogeneity problems, 2SLS and IV-GMM were used as instrumental variable regression models. Rural road mileage and rural congestion were selected as instrumental variables for the relationship between green M&A listed companies and the rural ecology environment. On the other hand, using the digitalization level as a moderating variable to explore the moderating effect on listed companies and the ecological environment is another methodological innovation in this study.
The rest of the paper is as follows. The second part is a literature review, which describes the current status of research on the green development of listed companies and the rural ecological environment. The third part constructs an index system for evaluating the development level of the rural environment and design display charts. The fourth part is the analysis of the results. On the one hand, the industry distribution and regional development trend of green M&A listed companies are analyzed. On the other hand, the impact and heterogeneity of the scale of green M&A listed companies on the development level of the rural ecological environment are examined. The moderating role of rural digitalization and the non-linear relationship between the two are explored. The Section 5 draws conclusions and implications.

2. Literature Review

2.1. Environment Protection and Corporate Development

To evaluate the current level of green development and enterprise performance in China, scholars have combined the concept of green development and enterprise performance measurement and constructed a green performance measurement system for enterprise development consisting of four aspects: economic, social, environmental, and innovation performance [6]. With an emphasis on environmental issues and resource problems, scholars have researched the green development and performance of traditional industries. To reveal the role of green management practices in traditional industries on the green development of enterprises. Hou, Zhu [7] analyzed the relationship between green business and the carbon performance of enterprises from the perspective of eco-environmental protection. Meanwhile, scholars have studied green development in the automotive field and evaluated enterprises’ green supply chain performance and carbon emission issues from the perspective of green production and consumption [8]. The government’s environmental policy significantly impacts the green development of enterprises. Wang, Long [9] analyzed the impact of government environmental regulation on green technology and the green development of enterprises and the significant impact of urban ecological legislation on improving the total factor productivity of urban enterprises through mechanisms such as financing constraints [10]. The green regulations and environmental carbon tax implemented by the government have played a role in reducing carbon emissions, effectively improving the quality of the environment, and promoting the sustainable development of the ecological environment [11]. Studies have shown that setting climate targets and implementing a carbon trading system can significantly reduce CO2 emissions in Germany [12]. In the context of a time when environmental protection and economic development are both critical, green management and development have gradually become essential for business operations. However, the impact of enterprise development on the environment needs to be studied.

2.2. Rural Ecological Environment Assessment

Due to the unbalanced development of China’s urban and rural areas, rural areas have also been slower to act on environmental protection. More research needs to be conducted on rural ecology. Evidence suggests that rural ecological construction and sustainable development in China exhibit essential characteristics of regional imbalance and inadequacy [13]. Harmonizing the ecological environment and regional economy is vital for sustainable development [14]. The health of the rural habitat environment is related to the quality of life and life health of rural residents. Therefore, constructing beautiful countryside is inseparable from improving the rural environment and developing rural industries, especially rural green sectors. Regarding the building of smart villages in the EU, research shows that the intelligent transformation of the countryside facilitates better infrastructure services and improves the inhabitants’ quality of life [15]. Listed companies that choose green upgrades are more aware of sustainable development and environmental protection. Pollution control actions by green companies can effectively contribute to the requirements of sustainable economic and environmental development [16]. However, more scholars have explored the impact of corporate performance on the ecological environment. For example, Mesagan, Adewuyi [17] explored the effect of corporate finance and industrial undertakings on the environment, the impact of manufacturing developments on environmental quality, and the relationship between air pollution and business productivity [18].
However, only some scholars have analyzed the impact of green M&A on the rural ecological environment and the moderating effect of digitalization. Therefore, this paper first calculates the China Rural Ecological Environment Index and examines the industry distribution and development trend of green M&A. This study further analyses the impact of the size of green M&A listed companies on the rural ecological environment and explores the moderating effect of the level of rural digitalization.
H1. 
The size of green M&A listed companies harms rural ecological protection.

2.3. The Moderating Role of Digitalization Level

Explore the relationship between company development and digitalization level. The fourth generation of the industrial revolution has brought about the rise and development of digital technologies such as big data and artificial intelligence. The development of technologies brought about by the fourth industrial revolution is conducive to building an intelligent countryside and solving much-needed environmental problems [19]. Both government management and business operations have had to consider the layout of their digital strategies in the era of digital economic development. The development of corporate digital responsibility plays a vital role in corporate social responsibility and strategic performance [20]. Ronaghi [21] evaluated the relationship between digital business models and company performance and showed that applying the company’s blockchain digital technology significantly impacted company performance. Zhu and Zhang [22] conducted a study using data on Chinese traditional energy-listed companies to investigate the digital economy’s role in corporate environmental responsibility. The results showed that the development of the corporate digital economy could contribute to a significant improvement in corporate environmental responsibility performance. Using data on Chinese A-share listed companies from 2012–2019, the researcher investigated the relationship between corporate digitalization and corporate performance. The results showed that corporate digitalization could improve corporate financial performance by increasing corporate total factor productivity [23]. On the other hand, the study also showed that the development of digitalization has enhanced the development of digital finance. Moreover, its development has positively affected green technology innovation in small and medium-sized enterprises, which can respond to environmental pollution by improving green technology [24].
Level of digitalization and ecological protection of the environment. The development of the Internet and information technology has affected many aspects of economic and social functioning, and the digital economy has a vital role in promoting sustainable development [25]. Digitalization is about improving operational efficiency through information automation, and enhancing business capabilities through information and communication technologies [26]. Digital transformation affects ecological development to a certain extent. Research shows that business development in China can be achieved through digital solutions to increase resource use efficiency and reduce energy consumption and carbon emissions [27]. Digital technology positively impacts economic and social sustainable development goals, and ecology is an essential element of the UN Sustainable Development Goals. Imran, Liu [28] examined the impact of digital technology on sustainable development using the Digital Technology Evaluation Index and the Sustainable Goals Index. The results show that developing the digital economy in Germany positively affected sustainable development. Research on Italian firms has shown that environmental innovation can lead to technological adaptations and green economic systems, which can improve the performance of firms [29]. Most scholars believe that the spread and development of digital internet technology positively affect sustainable economic and social development [30]. For middle-income countries particularly, developing information and communication infrastructure also positively impacts economic development [31]. However, studies have argued that whether digital technology can enhance sustainable development depends on the level of development in different countries, the research shows that it is more significant in high-income countries and unclear in low and middle-income countries [32]. How does the level of digitalization work for the listed companies and rural environment? This study uses the level of digitalization as a moderating variable to examine its moderating effect on the size of green M&A companies and rural ecosystems.
H2. 
Digitalization positively moderates the relationship between green M&A listed companies and environmental protection.

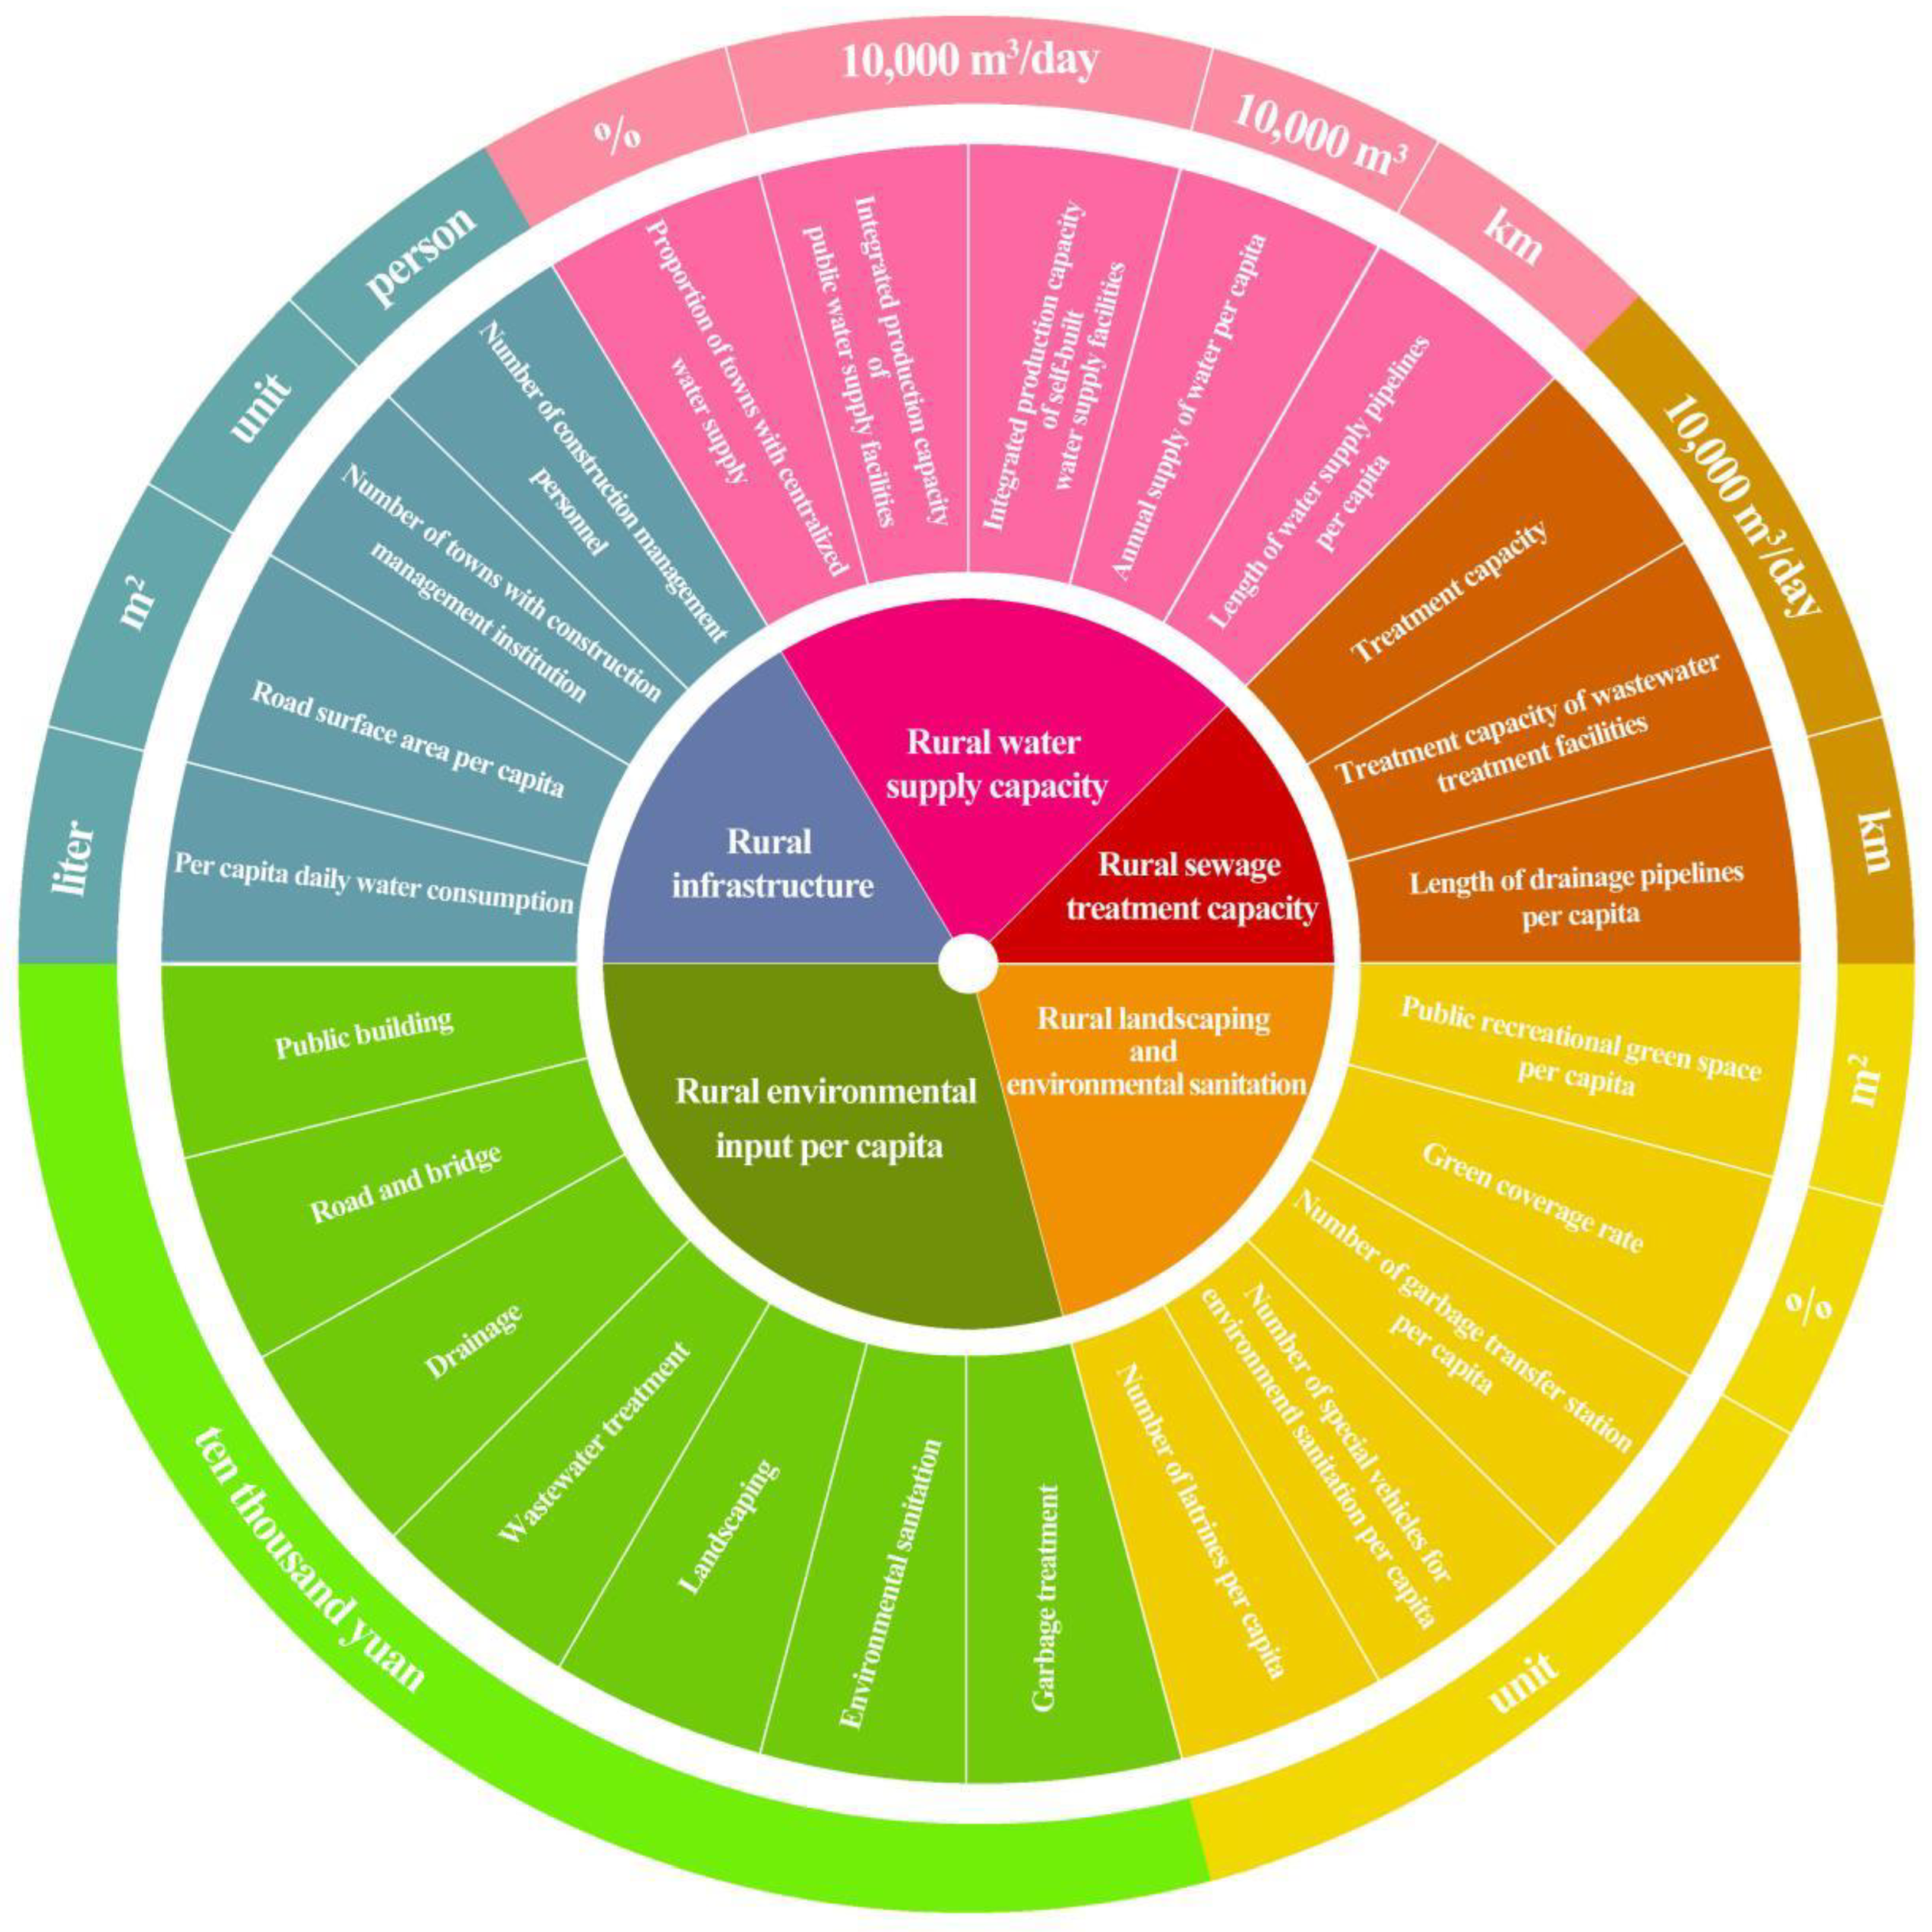
2.4. Rural Ecological Environment Evaluation Index System

Based on the content of government documents and research literature on rural environmental construction indicator systems, this study evaluates the rural ecological environment across five dimensions: rural infrastructure, rural water supply capacity, rural sewage treatment capacity, rural landscaping and sanitation, and rural per capita environmental expenditure. Figure 1 shows the indicator of the evaluation system. This study uses Excel to calculate the rural ecological environment index.
Rural infrastructure development includes rural roads, water resources, and management. Harmonizing ecological and socio-economic development is the key to achieving sustainable rural development [33]. Jie, Xiaoping [34] examine the coordination relationship between new urbanization and agro-ecology and its drivers, where the indicator system includes per capita investment in pollution control and the level of rural economic development, and the government’s ability to govern significantly affects the degree of coordination between the two. Zhao and Zhou [35] studied the relationship between the ecological environment and urbanization in the Yangtze River Delta from 1980 to 2013. The indicators include per capita water consumption, vegetation cover, per capita green area, domestic sewage treatment rate, and household waste harmless treatment rate. The rural infrastructure in this study includes four indicators: per capita daily water consumption, road surface area per capita, number of towns with construction management institutions, and number of construction management personnel.
Rural water supply capacity. High-quality drinking water and good ecological quality are inseparable [36]. The sustainable use of water resources is a strategic issue for China’s economic and social development, the core of which is to improve water efficiency. The water supply issue for urban and rural residents is directly related to residents’ lives and environmental protection [37]. Using the Delphi method, scholars have selected rural economic, population, and environmental indicators to evaluate rural development in Portugal. The ecological indicators include the proportion of treated wastewater and bodies of water with good ambient water quality [38]. Water supply capacity can guarantee water security for human habitation and ecological balance in extreme climates. For this reason, this paper includes five indicators of rural water supply capacity, which are the proportion of towns with centralized water supply, the integrated production capacity of public water supply facilities, the integrated production capacity of self-built water supply facilities, the annual supply of water per capita, length of water supply pipelines per capita.
Rural sewage treatment capacity. Rural sewage mainly consists of domestic and agricultural wastewater. Rural sewage treatment is significant for protecting the environment and promoting sustainable economic and social development in rural areas. Yusheng and Ntarmah [39] used the Delphi method and hierarchical analysis to construct a rural ecological evaluation index system, which includes drinking water quality, sewage treatment, toilet penetration rate, green space area, and greening penetration rate. Studies have shown that those problems have caused problems in developing the rural ecological environment, including the indiscriminate discharge of domestic sewage, the indiscriminate disposal of household waste, and the need for more investment in environmental management [40]. This study uses treatment capacity, treatment capacity of wastewater treatment facilities, and length of drainage pipelines per capita as three indicators to evaluate rural sewage treatment.
Rural landscaping and sanitation. The construction of environmental facilities is an essential aspect of rural ecological management. The critical role of forestry in increasing biodiversity and combating climate change is raised in the EU Rural Development Regulation [41]. The rate of greenery, waste transfer stations, and the number of toilets are the basis of rural environmental construction. Scholars consider vegetation cover an essential factor in measuring ecological vulnerability [42]. Scholars have used indicators such as green area per capita, sewage treatment rate, and household waste disposal rate to construct an ecological environment evaluation system. They studied the harmony between socio-economic development and the ecological environment in Sichuan Province [43]. The researcher used indicators such as toilet penetration, sewage treatment, waste treatment, greening coverage, and road area per capita to build an evaluation system for ecological livability and sustainable development in rural China [13]. Xiao, Tian [44] measured Wenchuan’s ecological protection and socio-economic development using indicators such as greening area per capita, greening coverage of built-up areas, and centralized sewage treatment rate for evaluation. This study evaluates landscaping and environmental health in five areas, including public recreational green space per capita, green coverage rate, garbage transfer stations per capita, special vehicles for environmental sanitation per capita, and latrines per capita.
Rural environmental expenditure per capita. Environmental protection expenditure refers to local governments’ financial expenditure on environmental protection, including expenditure on ecological protection management affairs, environmental monitoring and supervision, and pollution control. Environmental protection expenditure is an important way for local governments to improve environmental quality, and research shows that local government expenditure on ecological protection helps to reduce environmental pollution [45]. In this study, we chose the rural per capita environmental expenditure dimension to evaluate the rural ecological environment, including seven measurements: public buildings, roads and bridges, drainage, wastewater treatment, landscaping, environmental sanitation, and garbage treatment.

3. Methodology

3.1. Research Design

This paper constructs a benchmark model of the impact of the size of heavily polluting listed companies implementing green M&A on rural ecosystems:
ln E i n d e x i t = c 0 + α ln s i z e i t + β X i t + μ i t + ε i t + v i t
In Formula (1), sizeit represents the size variable of heavily polluting listed companies in region i and time period t. E_indexit is the rural ecological environment index, Xit represents control variables, μit and εit are time effect and individual effect, respectively. νit is the random error term, c0 is the constant term, α and β are the core and control variables’ coefficients. Furthermore, this paper will use the Sivqr (Smoothed IV quantile regression) model based on Equation (1) to study the heterogeneity effect of the size level of heavily polluting listed companies implementing green M&A on the rural ecological index.
Further, to solve the endogeneity problem caused by selection bias and reverse causality. We use the instrumental variables with two-stage least squares (IV-2SLS), and the instrumental variables generalized method of moments (IV-GMM). A two-stage regression equation for the instrumental variables is established, and Equation (2) below is the one-stage regression equation for the instrumental variables, where the three instrumental variables are the level of the rural environment with one period lag (L.ln_environmentit), the number of rural road miles (ln_roadit) and rural traffic congestion (ln_congestionit), respectively. The three instrumental variables are the main explanatory variables in Equation (2), and the other coefficients in Equation (2) participate in the one-stage regression as exogenous variables, consistent with those in Equation (1). The instrumental variables were estimated as follows:
ln s i z e i t = c 0 + α L . ln e n v i r o n m e n t i t + α 1 ln r o a d i t + α 2 ln c o n g e s t i o n i t + β X i t + μ i t + ε i t + v i t
Further, the estimated ln s i z e ^ i t from the model (2) is brought into the model (3) and a two-stage regression is performed with the following equation.
ln E i n d e x i t = c 0 + α ln s i z e ^ i t + β X i t + μ i t + ε i t + v i t
In addition, we further analyze the influence mechanism. The role of the moderating variable is that the relationship between the independent variable X and the dependent variable Y is influenced by the moderating variable Z [46]. The moderating variables are generally not affected by X and Y. However, they can affect the relationship between X and Y. Studies show that governments and enterprises can influence the local ecological environment, and public participation also significantly impacts the ecological environment [47]. The public can improve the local ecological environment through environmental monitoring and action [48]. This study will explore the moderating effects of rural per capita education level and rural digitalization on the level of the rural ecosystem and develop a baseline model of the moderating effects, as follows:
ln E i n d e x i t = c 0 + α 1 ln s i z e i t + γ X i t + η ln s i z e i t × ln d i g i t a l i t + μ i t + ε i t + v i t
In the above Equation (4), Xit denotes the control variable, μ is the time effect, ε is the individual effect, ν is the random term, and γ is the coefficient. The interaction term ln_sizeit × ln_digitalit is added to Equation (4) to analyze the moderating effect of the level of rural digitalization, using ln_digital as the moderating variable, and η denotes the corresponding coefficient.

3.2. Variables Setting

Dependent variable. The rural ecological environment index (E_index) is calculated from the above comprehensive rural ecological environment index [49].
Core variables. Firm size is the total assets of green M&A listed companies at the beginning of the year, and this study uses size as a core variable to examine the factors that affect a company’s financial performance and ability to grow.
Instrumental variables. Instrumental variables are set to overcome the endogeneity problem in the model [50]. The weak instrumental variable test and the identified test will be used to determine the rationality of the relevant instrumental variables.
  • In real life, many variables are not only influenced by contemporary-related factors but also related to their previous values. Considering that the rural ecological environment will be affected by its early environmental construction, the lag period of the rural ecological environment index is included in the model as an instrumental variable (L.environment).
  • Road construction is a necessary form of infrastructure for regional and business development. Provincial road construction in China plays a vital role in the spatial penetration and growth of towns and cities. It is a critical link to articulate and coordinate the development of rural roads. This study considers the correlation between provincial road construction mileage and the development of green-listed companies and sets it as an instrumental variable.
  • At the same time, the congestion level of road traffic reflects the development of the regional economy from the side. The congestion level of road traffic demonstrates the capacity of road traffic and the carrying capacity of regional economic activities. In this study, road congestion level is used as another instrumental variable.
Moderating variables. With the development of internet technology, network construction may impact the rural environment and the development of enterprises [51]. This study uses a data sample of broadband subscribers in rural areas of China to represent the degree of digitalization in villages.
Control variables. This study selected data related to the company’s operations as control variables. The total assets net profit ratio (TANPR) represents the enterprise’s total net profit to the enterprise’s average total assets and capital profit margin. This indicator is an important indicator reflecting the comprehensive utilization of enterprise assets and measuring the profit made by the enterprise with the total creditors and owners’ equity. Cumulative abnormal return (CAR) is the simple summation of monthly excess returns for each stock over the formation period. In this study, we use CAR 10 as a control variable to investigate the impact of the change in the value of cumulative abnormal returns in the 10 days following the implementation of mergers and acquisitions. The total assets turnover ratio (TATR) equals the closing balance of operating income/total assets, and is an indicator used to evaluate the quality of business operation and asset utilization efficiency, and a reflection of the level of business management of the enterprise [52]. The cash ratio is equal to the ending balance of cash and cash equivalents/current liabilities, which is the ratio of cash assets to current liabilities, reflecting the immediate liquidity of the enterprise [53]. M&A size is the money heavily polluting listed companies paid to implement green M&A practices. In the M&A announcement, the heavily polluting listed company will announce its M&A purpose, M&A timing, M&A scale, and other important information. Tobin’s Q ratio is a public company’s market value to the replacement cost of its assets. It is calculated as the financial market value/replacement cost of the firm’s assets, where the monetary market value of a public company includes the market value of the company’s stock and debt capital. Replacement cost is the purchase cost of all the company’s assets.

3.3. Data Sources

Regarding the sample selection of heavily polluting listed companies that implemented green M&A, M&A listed companies’ data were first selected from the CASMAR financial database, and their stock codes were obtained. Secondly, using the basic definition of green M&A in this study, green M&A belonging to heavily polluting listed companies was screened. At last, utilizing those stock codes, the screened ones belonging to green M&A listed companies with heavy pollution from the China Economic and Financial Research Database were obtained. The financial data of these companies from 2010–2020 were obtained from the income statement, operating capacity, profitability, company size, and solvency, respectively, to obtain annual financial data on the development of listed companies with heavy pollution. Among them, CAR values were obtained by calculating CAR values within 10 days of the implementation of the green M&A by the heavily polluting listed companies one by one, according to the date of the green M&A. In the data selection process, because the data on China’s rural ecology and heavily polluting companies from 2010–2020 did not cover 31 provinces nationwide, 22 provinces that matched both were finally selected to synthesize the panel data model.
The data of 24 indicators on the rural ecological environment in this study were obtained from the China Statistical Yearbook of Urban and Rural Construction. Due to the availability of indicators, we selected rural ecological environment data in 22 provinces of China to evaluate the comprehensive index of the rural ecological environment. The provinces are Beijing, Tianjin, Hebei, Inner Mongol, Liaoning, Heilongjiang, Shanghai, Jiangsu, Zhejiang, Anhui, Fujian, Jiangxi, Henan, Hubei, Hunan, Guangdong, Guangxi, Chongqing, Sichuan, Guizhou, Shanxi, and Xinjiang. The sample time range is from 2010 to 2020, and some missing values are calculated using 5-year moving smoothing calculations.
Data on the level of rural digitalization were obtained from the data on rural broadband access users in the Internet development in the China Statistical Yearbook.
Data on provincial road mileage and traffic congestion levels were obtained from the China Transport Statistical Yearbook. The time range of the sample data for this study is 2010–2020. Statistical descriptions of variables are shown in Table 1.

4. Results

4.1. Rural Ecological Environment Index Values

This study used the entropy value method to calculate the ecological environment index of 22 provinces in rural China by constructing an index system for evaluating China’s rural ecological environment.
Figure 2 shows the average value of the ecological environment index for the 22 rural provinces in China from 2010 to 2020. The rural ecological environment index of the 22 provinces in China shows regional imbalances. On the one hand, the provinces with higher levels of rural ecology are located along the eastern coast of China, with Jiangsu, Guangdong, Zhejiang, and Fujian provinces ranking higher in the index. This condition is related to the high economic development along the southeast coast of China and the high level of urbanization in rural areas. As a result of China’s reform and opening-up policy, the provinces on the southeast coast of China have implemented a more liberal market economy than other inland provinces, which has led to an increase in the level of urbanization and ecological environment in rural areas. For example, Guangdong Province, the first province in China to implement reform and open up, had an urbanization rate of 71% in 2020. This level of urbanization has led to an increase in management and financial investment in environmental protection, which has supported improving the ecological environment of rural areas.
However, on the other hand, most of the provinces at the bottom of the rural eco-environment index are inland, where economic development has been slow and high levels of environmental pollution have often accompanied business development. For example, Hebei Province, which ranked relatively low before the reform and opening up, placed more emphasis on developing its productive sector, and the development of modern service industries needed to be faster. As Hebei Province took the lead in implementing rural reforms, the growth of agricultural production accelerated, and its share of heavy industry increased rapidly, which inevitably hindered the improvement of the local ecological level. The period 2010–2020 was essential for China to transform its economic development and achieve high-quality economic growth. It is crucial to evaluate the state of the rural ecological environment during this period.

4.2. Industry Distribution of Green M&A Listed Companies

Figure 3 shows the changing industry distribution of green M&A listed companies from 2010–2020. Overall, the number of listed green M&A companies grew faster between 2010 and 2016, with most industries showing an upward trend in the number of green M&A between these years. Among them, the raw chemical, non-metallic, rubber, and plastic industries have a high number of M&A, with 24, 9, and 9 in 2013, and 58, 24, and 24 in 2016. Such a sharp rise in the quantity increases in 2016 relative to 2013 mainly because of the green development plan implemented by China in 2012. The government’s strict environmental protection policies promote increased green mergers and acquisitions. The governments of different regions implemented low-carbon economic strategies to establish and form a government-led carbon emissions trading market and explore the establishment of market mechanisms to promote energy conservation and emission reduction and control greenhouse gas emissions as an effective strategy to achieve low-carbon economic development. The governments established pollutant emission standards for nine highly polluting industries, including raw chemicals, non-metallic, non-ferrous metals, textile, and building materials.
Regarding M&A year and volume, most sectors saw a higher increase in green M&A in 2016. This condition is related to the strict environmental protection policies implemented by the Chinese government after 2012. For example, in Guangdong Province during 2011–2014, any enterprises whose annual emissions exceeded 20,000 tons of carbon dioxide or more were included in the government’s environmental emissions control. Industrial enterprises emitting 10,000 tons of carbon dioxide or above annually are subject to a carbon emission reporting system. Such a strict designation of carbon emission standards and regulatory mechanisms will push listed companies to develop green technology and seek low-carbon development strategies.

4.3. Quantity of Green M&A Listed Companies

Figure 4 shows the number and regional distribution of the heavily polluting listed companies implementing green M&A in 31 provinces and autonomous regions in mainland China from 2010 to 2020. Overall, the number of listed green M&A companies in China from 2010–2019 shows a basic year-on-year increase, indicating the year-on-year improvement of green development in China from 2010–2019. However, the number of green M&A listed companies shows a decreasing trend in 2019–2020, which does not indicate a decline in green economic development in most Chinese provinces. On the contrary, it indicates the success of transforming China’s green development path and the country’s move towards a low-carbon economic development path.
Figure 4a shows the regional distribution of green M&A in 2010, and we can see the trend in the graph. Compared to the provinces in western China, the number of M&A is higher in the provinces in eastern China, especially in the eastern coastal region. Examples include Guangzhou, Shanghai, Fujian, and Jiangsu provinces, which are located in the southern part of the coastal region. Guangdong Province, in particular, ranks first in the number of green M&A with 23. Guangdong Province was the first province in China to implement reform and opening up. The market economy in this province started to develop earlier and has a higher degree of marketization. Compared to other provinces, companies in Guangzhou Province have higher capital strength and the comprehensive ability to carry out green transformation and upgrade the comprehensive governance of enterprises. Compared to Guangdong Province, China’s central and western regions have fewer or no green M&A companies. For example, Henan Province is located in the central region of China, and the number of green M&A listed companies in this province was 3 in 2010, much lower than Guangzhou Province and other eastern provinces. The central region’s economic development level was slower than the eastern region. Environmental protection awareness among managers of heavily polluting companies is low. The government does not have strict environmental protection policies to restrain listed companies, so the number of green M&A companies is low.
Figure 4b shows the regional distribution of green M&A in 2013, and we can see the trend in the graph. China’s western region has the lowest number, while the central region has more, and the eastern region has the most. Among them, the number of green M&A in Guangdong Province is 100, more than triple that of 2010. In Sichuan province, which is located in central China, the number increased from three in 2010 to 22 in 2012. Other provinces also saw some growth in numbers. In 2013, the Chinese government promoted green development and implemented strict environmental protection strategies across the country. The Chinese government held the 18th Party Congress in 2012 and put forward the concept of green development. The concept of green development requires China to develop more environmentally friendly industries in the future. This concept requires companies to reduce energy consumption that pollutes the atmosphere and environment, improve green and low-carbon technology, and adhere to the concept of industrial transformation development so that the social economy and natural environment develop in a coordinated manner.
Figure 4c shows the regional distribution chart of green M&A listed companies in 2016, and we can see the trend in the chart. It shows a decreasing trend from east to west, where the eastern part of China has the highest number, while the central region has more and the western region has the least. Relative to 2013, the number of green M&A listed companies in most provinces in China has increased. For example, Guangdong and Fujian provinces, located in the eastern region, had 100 and 17 green M&A listed companies in 2013, and grew to 157 and 45 in 2016. Henan and Hunan provinces, located in central China, had 10 and 12 green M&A listed companies in 2013, which increased to 29 and 30 in 2016. Gansu and Xinjiang Uygur Autonomous Region, located in China’s western region, had 3 green M&A companies in 2013, which grew to 13 and 12 in 2016. During the green development process in 2015–2016, most Chinese provincial governments prioritized green development and industrial transformation for economic development, so the number of green M&A companies increased in each province. In line with the new development concept proposed by the Chinese government at that time, the green economic development approach led the Chinese economy.
Figure 4d shows the regional distribution map of green M&A listed companies in 2020, and we can see a clear regional trend. The number of green M&A listed companies still shows a decreasing trend from east to west. Different regions display different growth, with most provinces in the central region of China showing an increase in the number of green M&A listed companies in 2020 relative to 2016. However, the number of green M&A listed companies in China’s eastern and western regions decreased relative to 2016. For example, the green M&A graph for 2020 shows a downward trend in the number of green M&A in the eastern provinces of China relative to 2016, with 157, 45, and 57 green M&A firms in Guangdong, Fujian, and Shandong provinces in eastern China in 2016, respectively, while in 2020 M&A declined to 138, 38 and 44. This decline does not mean a disadvantageous situation. It was a reasonable phenomenon that the number of green M&A listed companies declined in 2020 due to the higher level of green development in eastern China, where most heavy polluters successfully transformed themselves into low-carbon and circular-development companies from 2010. Meanwhile, the number of green M&A listed companies in China’s central and western regions also shows a decreasing trend. The number of green M&A listed companies in central China decreased relative to 2016, mainly because central China has been effective in green governance and environmental protection. In this case, the most heavily polluting enterprises have completed green transformation and upgrading.

4.4. Analysis of Heavily Polluting Listed Companies and Rural Ecology

Table 2 shows the calculated results of the baseline model. In result (1), the regression result of the size of green M&A listed companies is negative at a 1% confidence level, representing that the size of green M&A listed companies hurts the status of the rural ecological environment. After adding the regression of control variables, the regression results of OLS, 2SLS, and IV-GMM are significantly positive at a 1% confidence level, the same as the results before adding the control variables. Still, the coefficients are less than −0.0863, representing that the endogeneity problem enhances the effect of the size of green M&A listed companies on the level of the rural ecological environment. This result is further evidence that the increase in the size of green M&A listed companies harms rural environmental protection. Increasing the size of green M&A listed companies will increase the burden on local ecological and environmental management. This result means that the size of green M&A listed companies negatively impacts the rural ecological environment without taking social responsibility for environmental management.

4.5. Heterogeneity Analysis of Rural Ecology and Heavily Pollution Listed Companies

The results of Table 2 prove that the expansion of green M&A listed companies has a negative effect on the rural ecological environment. Still, it does not analyze the negative impact of the size of green M&A listed companies on different levels of the rural environment. For this reason, this paper selects five representative nodes of 10%, 25%, 50%, 75%, and 90% to classify the rural ecological environment index level. Based on the model (1), the Sivqr method is applied to analyze the effects of the expansion of green M&A listed companies on the rural ecological environment, which also represents the marginal effects of the size of green M&A listed companies on different levels of the rural environmental index. Table 3 shows that the regression coefficients of the size of green M&A listed companies show a decreasing trend from the low-level rural ecological environment index to the high-level, and the significance level gradually increases. Specifically, the negative effect of the size of green M&A listed companies on the rural ecological environment is: low rural ecological environment provinces (10%, 25%) > medium rural ecological environment provinces (50%, 75%) > high rural ecological environment provinces (90%). This result indicates that in regions with low rural ecological environment levels, the size of green M&A listed companies has a less negative effect on the rural ecological environment. In contrast, in areas with high rural ecological environment levels, the size of green M&A listed companies negatively affects the rural ecological environment.

4.6. Impact of Digitalization on Heavily Pollution Listed Companies and Rural Ecology

Table 4 shows the regression results for adding the level of rural digitalization as a moderating variable. After adding rural digitalization as a moderating effect, the results of the interaction term show a positive impact, with (14) and (16) showing that the regression results are significant at the 5% and 10% confidence levels. This result indicates that the effect of the size of green M&A listed companies on the level of rural ecology is significantly positive after adding the status of rural digitalization as a moderating variable. It indicates a significant positive moderating effect of the increase in rural ecology on alleviating the negative impact of the rise in the size of green M&A listed companies on rural ecology. In OLS, 2SLS, and IV-GMM, our results indicate that the interaction term between the level of rural digitalization and the size of green M&A listed companies has a positive effect on improving rural ecology. In other words, the effect of the size of green M&A listed companies on rural ecology can be significantly improved from negative to positive in areas with a high level of rural ecology. In other words, the higher the level of digitalization in rural areas, the less negative impact on the environment is brought about by implementing green M&A listed companies’ scale development and growth. This result means that increasing the level of digitalization in rural areas significantly impacts the ultimate improvement of the regional ecological environment.

5. Conclusions and Policy Implications

5.1. Conclusions

This study calculates the eco-environmental index for 22 provinces in rural China, showing the mean eco-environmental values for different regions. The industry and regional distribution of green M&A listed companies from 2010 to 2020 are exhibited. The impact of the size of green M&A listed companies on the rural ecological environment and the regional heterogeneity of this impact are analyzed. The moderating role of the level of rural digitalization on the relationship between the two is explored.
  • The average value of the Ecoregion Index for the 22 rural provinces in China ranged from 17.32 to 65.17. The index is higher in the southeastern coastal region, with the highest values in Jiangsu, Guangdong, Zhejiang, and Fujian provinces.
  • From 2010–2020, green M&A listed companies were divided into 14 sectors. The industries with the highest number of green M&A are the raw chemical, non-metallic, rubber, and plastic industries.
  • The number of listed green M&A companies shows a decreasing trend from the southeast coastal provinces to the inland provinces. The number of listed companies in green M&A rose significantly between 2010 and 2016 but declined between 2017 and 2020. This result is very similar to that of Li, Yang [13], which indicated that the ecological livability index in China is unbalanced and has spatial heterogeneity.
  • The size of green M&A listed companies has a negative effect on the rural ecological environment and shows regional heterogeneity. In regions with low rural ecological environment levels, the size of green M&A listed companies has a less negative impact on the rural ecological environment. In contrast, in areas with high rural ecological environment levels, the size of green M&A listed companies has more negatively affected the rural ecological environment. Heavily polluting industries harm the ecological environment, and this result has also been confirmed in the study by Qi, Wei [54].
  • Increased rural digitalization has a positive moderating effect on the relationship between the size of green M&A listed companies and the rural ecological environment. Increasing the level of digitalization will help reduce the negative impact of the size of green M&A listed companies on the rural ecological environment. Similarly, Xiong, Ning [55] confirm a significant correlation between a region’s ecological carrying capacity and the digital transformation of heavy metal companies.
This research attempted to analyze the impact of green M&A listed companies on the rural ecological environment and explore the moderating variables that can improve the rural ecological environment. The analysis of the effect of green M&A listed companies on rural ecology is this study’s most significant novelty. However, there are two limitations. On the one hand, whether there is a specific threshold effect on the negative impact of green M&A listed companies on the rural ecological environment was not explored. On the other hand, this study does not explore whether other moderating variables could have a positive moderating effect on the rural ecological environment, such as the level of education.

5.2. Policy Implications

Promote the level of rural ecological environment in different regions. The sustainable development of the environment should be considered in regulating government enterprises. Regarding government environmental management, it is necessary to formulate and implement regulatory policies for heavily polluting enterprises and guide them to transform and relocate according to the law [56]. In particular, reducing the emission of pollutants should be emphasized in the comprehensive treatment of urban and rural areas. Enterprises must accept the government’s pollutant discharge supervision mechanism [57], focus on environmental protection and governance, and restrict pollutant discharge based on the environment’s carrying capacity. Government should strictly control carbon dioxide, sulfur dioxide, and other greenhouse gas emissions in heavily polluting industries such as chemical, paper, electric power, and transportation. The government should implement a preferential system for environmentally friendly enterprises. In contrast, an exit plan should be implemented for heavily polluting enterprises. We will improve the energy consumption mix, strictly control and regulate polluting industries’ growth, and inspect critical sectors.
Improve the green development capacity of listed companies between regions, enhance the coordinated, sustainable improvement of heavily polluting enterprises, promote the green growth and transformation of listed companies in each area, and reduce the negative impact of the expansion of listed companies on the ecological environment. Provinces should actively cultivate new economic growth points featuring low carbon emissions. Local governments should support the transformation and upgrading of traditional industries [58], for example by using policies to guide the transformation of highly polluting industries. The government should actively support new energy and energy conservation and environmental protection enterprises, promote the use of new technologies to transform and upgrade traditional local industrial enterprises, and optimize and upgrade the low-carbon environment in which various industries operate, produce, sell, and distribute. Localities should focus on implementing ecological and environmental protection policies and establishing enterprise management mechanisms conducive to local green product development. Green investment policies to promote green production in traditional industries should be implemented [59]. Enterprises should formulate development policies for environmental protection throughout the production process, promote green product price reform, and establish corresponding mechanisms for statistical tracking and evaluation of green data.
Enhance the level of digital development in all societies and enterprises. As early as 1980, scholars predicted that the changes brought about by technology could impact rural development [19]. The results of this study also show that the increased digitalization brought about by the technological revolution is beneficial to solving rural environmental problems. We should accelerate the establishment of a green technology innovation system, as green technology supports the promotion of green growth. The environmental protection department should give financial and policy support to develop green technology, promote the development of green production technology in regions and industries, and further accelerate the industrialization of environmental technology in all aspects of life for listed companies. We should strengthen the exchange and learning of green technologies between regions [60]. The government should introduce advanced green technologies, and enterprises should actively seek to upgrade their technologies and enhance their green industrial development capabilities. Enterprises should rely on each province’s technological base to improve the regional technology level. For example, Hubei Province has a solid economic development capacity in the central region and contains the capital city of Wuhan, which has many higher education universities. Its high-tech industries are among the leading ones in the central regions of China.

Author Contributions

Conceptualization, L.Z., W.L. and B.S.-X.T.; Methodology, L.Z.; Formal analysis, L.Z.; Resources, B.S.-X.T.; Data curation, L.Z.; Visualization, L.Z.; Supervision, W.L., B.S.-X.T. and S.K.M.Y.; Project administration, W.L. All authors have read and agreed to the published version of the manuscript.

Funding

This research was funded by [The performance evaluation and promotion path of high-quality development of new urbanization in China] grant number [2020GGJS092].

Institutional Review Board Statement

Not applicable.

Informed Consent Statement

Not applicable.

Data Availability Statement

Not applicable.

Conflicts of Interest

The authors declare no conflict of interest.

References

  1. Qin, M.; Sun, M.; Li, J. Impact of environmental regulation policy on ecological efficiency in four major urban agglomerations in eastern China. Ecol. Indic. 2021, 130, 108002. [Google Scholar] [CrossRef]
  2. Zhang, S.; Yu, Y.; Zhu, Q.; Qiu, C.M.; Tian, A. Green Innovation Mode under Carbon Tax and Innovation Subsidy: An Evolutionary Game Analysis for Portfolio Policies. Sustainability 2020, 12, 1385. [Google Scholar] [CrossRef] [Green Version]
  3. Li, M.; Du, W.; Tang, S. Assessing the impact of environmental regulation and environmental co-governance on pollution transfer: Micro-evidence from China. Environ. Impact Assess. Rev. 2021, 86, 106467. [Google Scholar] [CrossRef]
  4. Liang, X.; Li, S.; Luo, P.; Li, Z. Green mergers and acquisitions and green innovation: An empirical study on heavily polluting enterprises. Environ. Sci. Pollut. Res. 2022, 29, 48937–48952. [Google Scholar] [CrossRef]
  5. Han, L.; Zhou, W.; Li, W.; Qian, Y. Urbanization strategy and environmental changes: An insight with relationship between population change and fine particulate pollution. Sci. Total. Environ. 2018, 642, 789–799. [Google Scholar] [CrossRef]
  6. He, L.; Sun, Y.; Xia, Y.; Zhong, Z. Construction of a green development performance index of industrial enterprises: Based on the empirical study of 458 listed industrial enterprises in China. Ecol. Indic. 2021, 132, 108239. [Google Scholar] [CrossRef]
  7. Hou, N.; Zhu, Q.; Zhao, W.; Luo, Y.; Liu, W. Study on the impact of green management of paper enterprises on carbon performance in the background of carbon peaking and carbon neutrality. Energy Rep. 2022, 8, 10991–11002. [Google Scholar] [CrossRef]
  8. Jin, B. Research on performance evaluation of green supply chain of automobile enterprises under the background of carbon peak and carbon neutralization. Energy Rep. 2021, 7, 594–604. [Google Scholar] [CrossRef]
  9. Wang, L.; Long, Y.; Li, C. Research on the impact mechanism of heterogeneous environmental regulation on enterprise green technology innovation. J. Environ. Manag. 2022, 322, 116127. [Google Scholar] [CrossRef]
  10. Zhang, B.; Yu, L.; Sun, C. How does urban environmental legislation guide the green transition of enterprises? Based on the perspective of enterprises’ green total factor productivity. Energy Econ. 2022, 110, 106032. [Google Scholar] [CrossRef]
  11. Wan, Q.; Miao, X.; Afshan, S. Dynamic effects of natural resource abundance, green financing, and government environmental concerns toward the sustainable environment in China. Resour. Policy 2022, 79, 102954. [Google Scholar] [CrossRef]
  12. Engler, D.; Gutsche, G.; Simixhiu, A.; Ziegler, A. On the relationship between corporate CO2 offsetting and pro-environmental activities in small- and medium-sized firms in Germany. Energy Econ. 2023, 118, 106487. [Google Scholar] [CrossRef]
  13. Li, X.; Yang, H.; Jia, J.; Shen, Y.; Liu, J. Index system of sustainable rural development based on the concept of ecological livability. Environ. Impact Assess. Rev. 2020, 86, 106478. [Google Scholar] [CrossRef]
  14. Liu, Y.; Yang, R.; Sun, M.; Zhang, L.; Li, X.; Meng, L.; Wang, Y.; Liu, Q. Regional sustainable development strategy based on the coordination between ecology and economy: A case study of Sichuan Province, China. Ecol. Indic. 2021, 134, 108445. [Google Scholar] [CrossRef]
  15. Dokl, D.; Rogelj, V.; Bogataj, D. Smart Age-Friendly Villages: Literature Review and Research Agenda. IFAC-PapersOnLine 2022, 55, 928–933. [Google Scholar] [CrossRef]
  16. Zhu, L.; Liu, H. From economic assumption to ecological assumption: Game analysis of enterprises’ pollution treatment behaviors. Environ. Technol. Innov. 2021, 24, 101772. [Google Scholar] [CrossRef]
  17. Mesagan, E.P.; Adewuyi, T.C.; Olaoye, O. Corporate finance, industrial performance and environment in Africa: Lessons for policy. Sci. Afr. 2022, 16, e01207. [Google Scholar] [CrossRef]
  18. Al-Ayouty, I.; Hassaballa, H.; Rizk, R. Clean manufacturing industries and environmental quality: The case of Egypt. Environ. Dev. 2017, 21, 19–25. [Google Scholar] [CrossRef]
  19. Cowie, P.; Townsend, L.; Salemink, K. Smart rural futures: Will rural areas be left behind in the 4th industrial revolution? J. Rural. Stud. 2020, 79, 169–176. [Google Scholar] [CrossRef]
  20. Khattak, A.; Yousaf, Z. Digital Social Responsibility towards Corporate Social Responsibility and Strategic Performance of Hi-Tech SMEs: Customer Engagement as a Mediator. Sustainability 2021, 14, 131. [Google Scholar] [CrossRef]
  21. Ronaghi, M.H. Contextualizing the impact of blockchain technology on the performance of new firms: The role of corporate governance as an intermediate outcome. J. High Technol. Manag. Res. 2022, 33, 100438. [Google Scholar] [CrossRef]
  22. Zhu, N.; Zhang, Y. The impact of management’s characteristics on corporate environmental responsibility performance of energy systems in the digital age—Evidence from China’s traditional energy listed companies industry. Energy Rep. 2022, 8, 8821–8829. [Google Scholar] [CrossRef]
  23. Zeng, H.; Ran, H.; Zhou, Q.; Jin, Y.; Cheng, X. The financial effect of firm digitalization: Evidence from China. Technol. Forecast. Soc. Chang. 2022, 183, 121951. [Google Scholar] [CrossRef]
  24. Feng, S.; Zhang, R.; Li, G. Environmental decentralization, digital finance and green technology innovation. Struct. Chang. Econ. Dyn. 2022, 61, 70–83. [Google Scholar] [CrossRef]
  25. Sevgi, H. Analysis of the digital economy and society index (desi) through a cluster analysis. Trak. Üniv. Sos. Bilim. Derg. 2021, 23, 37–51. [Google Scholar] [CrossRef]
  26. Li, L.; Su, F.; Zhang, W.; Mao, J.-Y. Digital transformation by SME entrepreneurs: A capability perspective. Inf. Syst. J. 2017, 28, 1129–1157. [Google Scholar] [CrossRef]
  27. Beier, G.; Niehoff, S.; Ziems, T.; Xue, B. Sustainability aspects of a digitalized industry—A comparative study from China and Germany. Int. J. Precis. Eng. Manuf.-Green Technol. 2017, 4, 227–234. [Google Scholar] [CrossRef]
  28. Imran, M.; Liu, X.; Wang, R.; Saud, S.; Zhao, Y.; Khan, M.J. The Influence of Digital Economy and Society Index on Sustainable Development Indicators: The Case of European Union. Sustainability 2022, 14, 11130. [Google Scholar] [CrossRef]
  29. Vasileiou, E.; Georgantzis, N.; Attanasi, G.; Llerena, P. Green innovation and financial performance: A study on Italian firms. Res. Policy 2022, 51, 104530. [Google Scholar] [CrossRef]
  30. Kurniawati, M.A. ICT infrastructure, innovation development and economic growth: A comparative evidence between two decades in OECD countries. Int. J. Soc. Econ. 2020, 48, 141–158. [Google Scholar] [CrossRef]
  31. Pradhan, R.P.; Arvin, M.B.; Nair, M.; Bennett, S.E.; Bahmani, S. Some Determinants and Mechanics of Economic Growth in Middle-Income Countries: The Role of ICT Infrastructure Development, Taxation and Other Macroeconomic Variables. Singap. Econ. Rev. 2020. [Google Scholar] [CrossRef]
  32. Cheng, C.-Y.; Chien, M.-S.; Lee, C.-C. ICT diffusion, financial development, and economic growth: An international cross-country analysis. Econ. Model. 2020, 94, 662–671. [Google Scholar] [CrossRef]
  33. Yang, Y.; Wang, L.; Yang, F.; Hu, N.; Liang, L. Evaluation of the coordination between eco-environment and socioeconomy under the “Ecological County Strategy” in western China: A case study of Meixian. Ecol. Indic. 2021, 125, 107585. [Google Scholar] [CrossRef]
  34. Cai, J.; Li, X.; Liu, L.; Chen, Y.; Wang, X.; Lu, S. Coupling and coordinated development of new urbanization and agro-ecological environment in China. Sci. Total. Environ. 2021, 776, 145837. [Google Scholar] [CrossRef]
  35. Zhao, Y.; Wang, S.; Zhou, C. Understanding the relation between urbanization and the eco-environment in China’s Yangtze River Delta using an improved EKC model and coupling analysis. Sci. Total. Environ. 2016, 571, 862–875. [Google Scholar] [CrossRef]
  36. Marks, S.J.; Kumpel, E.; Guo, J.; Bartram, J.; Davis, J. Pathways to sustainability: A fuzzy-set qualitative comparative analysis of rural water supply programs. J. Clean. Prod. 2018, 205, 789–798. [Google Scholar] [CrossRef]
  37. Jianlong, L.; Xiaofei, L.; Jingjing, Z.; Linyun, M.; Lin, Z.; Zengrang, X.; Weihong, Z. The Current Status, Problems and Prospects of Researches on the Carrying Capacities of Ecological Environment in China. J. Resour. Ecol. 2019, 10, 605. [Google Scholar] [CrossRef]
  38. Abreu, I.; Mesías, F.; Ramajo, J. Design and validation of an index to measure development in rural areas through stakeholder participation. J. Rural. Stud. 2022, 95, 232–240. [Google Scholar] [CrossRef]
  39. Yusheng, K.; Ntarmah, A.H. Developing a rural ecological assessment index for Jiangsu Province, China. J. Nat. Conserv. 2021, 64, 126093. [Google Scholar] [CrossRef]
  40. Jun, L.; Jundong, H.; Yang, L. Analysis of Rural Ecological Environment Governance in the Two-oriented Society Construction: A Case Study of Xiantao City in Hubei Province. Procedia Environ. Sci. 2011, 11, 1278–1284. [Google Scholar] [CrossRef] [Green Version]
  41. Torre, A.; Wallet, F.; Huang, J. A collaborative and multidisciplinary approach to knowledge-based rural development: 25 years of the PSDR program in France. J. Rural. Stud. 2023, 97, 428–437. [Google Scholar] [CrossRef]
  42. Chen, Q.; Lu, S.; Xiong, K.; Zhao, R. Coupling analysis on ecological environment fragility and poverty in South China Karst. Environ. Res. 2021, 201, 111650. [Google Scholar] [CrossRef] [PubMed]
  43. Xiao, Y.; Li, Y.; Huang, H. Conflict or coordination? Assessment of coordinated development between socioeconomic and ecological environment in resource-based cities: Evidence from Sichuan province of China. Environ. Sci. Pollut. Res. 2021, 28, 66327–66339. [Google Scholar] [CrossRef] [PubMed]
  44. Xiao, Y.; Tian, K.; Yuan, M.; Ouyang, Y.; Huang, H. Examining the complex relationships between socioeconomic development and the improvement of ecological environment in post-disaster reconstruction: The case of Wenchuan earthquake disaster area in Western China. J. Clean. Prod. 2022, 337, 130581. [Google Scholar] [CrossRef]
  45. Fan, W.; Yan, L.; Chen, B.; Ding, W.; Wang, P. Environmental governance effects of local environmental protection expenditure in China. Resour. Policy 2022, 77, 102760. [Google Scholar] [CrossRef]
  46. Baron, R.M.; Kenny, D.A. The moderator-mediator variable distinction in social psychological research: Conceptual, strategic, and statistical considerations. J. Pers. Soc. Psychol. 1986, 51, 1173–1182. [Google Scholar] [CrossRef]
  47. Wang, Y.; Zhang, R.; Worden, S.; Cao, H.; Li, C. Public Participation in Environmental Governance Initiatives of Chemical Industrial Parks. J. Clean. Prod. 2021, 305, 127092. [Google Scholar] [CrossRef]
  48. Chu, Z.; Bian, C.; Yang, J. How can public participation improve environmental governance in China? A policy simulation approach with multi-player evolutionary game. Environ. Impact Assess. Rev. 2022, 95, 106782. [Google Scholar] [CrossRef]
  49. Qian, M.; Cheng, Z.; Wang, Z.; Qi, D. What Affects Rural Ecological Environment Governance Efficiency? Evidence from China. Int. J. Environ. Res. Public Health. 2022, 19, 5925. [Google Scholar] [CrossRef]
  50. Liu, W.; Shao, X.; De Sisto, M.; Li, W.H. A new approach for addressing endogeneity issues in the relationship between corporate social responsibility and corporate financial performance. Finance Res. Lett. 2020, 39, 101623. [Google Scholar] [CrossRef]
  51. Yu, F.; Jiang, D.; Zhang, Y.; Du, H. Enterprise digitalisation and financial performance: The moderating role of dynamic capability. Technol. Anal. Strat. Manag. 2021, 1–17. [Google Scholar] [CrossRef]
  52. Podhorska, I.; Siekelova, A. Enterprises Financial Performance in a Globalized World. SHS Web Conf. 2020, 74, 05018. [Google Scholar] [CrossRef]
  53. Malichová, E.; Ďurišová, M. Evaluation of Financial Performance of Enterprises in IT Sector. Procedia Econ. Financ. 2015, 34, 238–243. [Google Scholar] [CrossRef]
  54. Qi, Y.; Wei, X.; Zhao, M.; Pan, W.; Jiang, C.; Wu, J.; Li, W. Heavy metal pollution characteristics and potential ecological risk assessment of soils around three typical antimony mining areas and watersheds in China. Front. Environ. Sci. 2022, 10, 913293. [Google Scholar] [CrossRef]
  55. Xiong, L.; Ning, J.; Wang, J.; Dong, Y. Coupling degree evaluation of heavy metal ecological capacity and enterprise digital transformation in river basins. Ecol. Indic. 2021, 133, 108358. [Google Scholar] [CrossRef]
  56. Lin, B.; Xu, C. Does environmental decentralization aggravate pollution emissions? Microscopic evidence from Chinese industrial enterprises. Sci. Total. Environ. 2022, 829, 154640. [Google Scholar] [CrossRef] [PubMed]
  57. Shen, L.; Wang, Y. Supervision mechanism for pollution behavior of Chinese enterprises based on haze governance. J. Clean. Prod. 2018, 197, 571–582. [Google Scholar] [CrossRef]
  58. Zhang, F.; Li, Y.; Li, Y.; Xu, Y.; Chen, J. Nexus among air pollution, enterprise development and regional industrial structure upgrading: A China’s country panel analysis based on satellite retrieved data. J. Clean. Prod. 2022, 335, 130328. [Google Scholar] [CrossRef]
  59. Yang, L.; Qin, H.; Xia, W.; Gan, Q.; Li, L.; Su, J.; Yu, X. Resource Slack, Environmental Management Maturity and Enterprise Environmental Protection Investment: An Enterprise Life Cycle Adjustment Perspective. J. Clean. Prod. 2021, 309, 127339. [Google Scholar] [CrossRef]
  60. Chang, Y.; Chen, L.; Zhou, Y.; Meng, Q. Elements, characteristics, and performances of inter-enterprise knowledge recombination: Empirical research on green innovation adoption in China’s heavily polluting industry. J. Environ. Manag. 2022, 310, 114736. [Google Scholar] [CrossRef]
Figure 1. The rural ecological environment assessment index system.
Sustainability 15 06068 g001
Figure 2. Mean value of provincial ecological environment index from 2010 to 2020.
Sustainability 15 06068 g002
Figure 3. Industry distribution of green M&A listed companies 2010, 2013, 2016, 2020.
Sustainability 15 06068 g003
Figure 4. Spatial-temporal evolution of the quantity of green M&A listed companies 2010, 2013, 2016, 2020.
Sustainability 15 06068 g004
Table 1. Descriptive Statistical Analysis of Samples in 2010–2020.
VariableVariable TypesMeanStd.Dev.MinMax
ln_E_indexDependent variable1.20650.12660.69751.4600
ln_sizeCore variables22.16340.985219.575626.0589
ln_roadInstrumental variable2.19970.09091.93362.3565
ln_congestion−0.67830.4152−1.60940.1988
ln_L.environment3.37040.40662.00894.3062
ln_digitalModerating variables1.59400.4195−2.03171.9818
TANPRControl variables0.00320.00591.81060.0490
CAR100.01750.0910−0.31010.4147
TATR0.63500.28400.10962.0696
Cash ratio0.14710.06940.01230.4690
Size of M&A2.86540.06402.64483.0377
Tobin’s Q2.35932.90060.890340.2803
Table 2. Benchmarking Model Results of Green M&A and Environment.
VARIABLES(1)(2)(3)(4)
OLSOLS2slsIv-gmm
ln_size−0.0863 ***−0.0913 ***−1.769 ***−1.723 ***
(0.0292)(0.0324)(0.525)(0.518)
TANPR −11.51 **−38.84 *−35.30
(5.232)(22.78)(22.82)
CAR10 −0.518 *−1.870−1.936
(0.314)(1.309)(1.266)
TATR 0.312 ***−0.412−0.459
(0.101)(0.359)(0.344)
Cash ratio −0.352−9.701 ***−9.836 ***
(0.443)(2.824)(2.759)
Size of M&A −0.5843.9483.000
(0.442)(3.048)(2.880)
Tobin’s Q −0.00391−0.438 **−0.448 **
(0.0109)(0.198)(0.196)
Constant5.296 ***6.991 ***34.19 ***36.00 ***
(0.648)(1.416)(10.09)(9.773)
Observations214214188188
R-squared0.0390.122--
Standard errors in parentheses *** p < 0.01, ** p < 0.05, * p < 0.1.
Table 3. Heterogeneity Analysis of Green M&A and Environment.
VARIABLES(5)(6)(7)(8)(9)
(0.1)(0.25)(0.5)(0.75)(0.9)
ln_size0.0125−0.0333−0.0903 ***−0.129 ***−0.175 ***
(0.0676)(0.0468)(0.0339)(0.0421)(0.0614)
TANPR−5.112−7.617−10.74 **−12.87 **−15.40 *
(9.010)(6.144)(4.429)(5.517)(8.208)
CAR10−0.651−0.587−0.507−0.452−0.388
(0.638)(0.434)(0.312)(0.389)(0.581)
TATR0.364 *0.361 **0.357 ***0.355***0.352 *
(0.219)(0.149)(0.107)(0.133)(0.199)
Cash ratio0.3780.0469−0.366−0.647−0.982
(0.933)(0.638)(0.460)(0.573)(0.850)
Size of M&A−0.381−0.564−0.791 *−0.946 *−1.131
(0.921)(0.627)(0.452)(0.563)(0.839)
Tobin’s Q−0.00645−0.00773−0.00931−0.0104−0.0117
(0.0147)(0.0100)(0.00721)(0.00898)(0.0134)
Observations214214214214214
Standard errors in parentheses *** p < 0.01, ** p < 0.05, * p < 0.1.
Table 4. Moderating Effect of Digitalization on Green M&A and Environment.
VARIABLES(10)(11)(12)(13)(14)(15)(16)
OLSOLSOLS2sls2slsIv-gmmIv-gmm
ln_size −0.105 ***−0.0757−1.933 ***−4.277 **−1.922 ***−5.522 **
(0.0316)(0.0796)(0.573)(1.953)(0.569)(2.357)
ln_digital 0.0351 ***0.1640.0856 ***−14.49 *0.0856 ***−19.09 **
(0.00941)(0.319)(0.0276)(7.643)(0.0276)(9.196)
ln_size × ln_digital −0.00595 0.674 * 0.888 **
(0.0148) (0.351) (0.421)
TANPR−10.18 *−10.98 **−10.83 **−39.93−56.61 **−39.00−67.28 **
(5.298)(5.077)(5.102)(24.39)(25.89)(24.13)(31.93)
CAR10−0.474−0.577 *−0.593 *−2.1031.031−2.1871.652
(0.319)(0.305)(0.308)(1.407)(1.640)(1.350)(2.056)
TATR0.357 ***0.263 ***0.261 ***−0.5760.0953−0.5830.146
(0.101)(0.0987)(0.0990)(0.395)(0.296)(0.391)(0.356)
Cash ratio0.135−0.258−0.245−10.04***−7.059 **−10.02 ***−8.909 ***
(0.414)(0.430)(0.432)(2.977)(2.843)(2.962)(3.453)
Size of M&A−0.703−0.670−0.6854.2524.4614.0974.942
(0.447)(0.429)(0.432)(3.337)(2.847)(3.256)(3.201)
Tobin’s Q0.00282−0.00311−0.00333−0.480 **−0.0788−0.481 **−0.0913
(0.0108)(0.0105)(0.0106)(0.212)(0.0712)(0.211)(0.0850)
Constant5.187 ***7.390 ***6.800 ***36.80 ***84.36 **37.01 ***110.1 **
(1.284)(1.378)(2.014)(10.67)(41.02)(10.58)(48.82)
Observations214214214188188188188
R-squared0.0880.1780.179----
Standard errors in parentheses *** p < 0.01, ** p < 0.05, * p < 0.1.
Disclaimer/Publisher’s Note: The statements, opinions and data contained in all publications are solely those of the individual author(s) and contributor(s) and not of MDPI and/or the editor(s). MDPI and/or the editor(s) disclaim responsibility for any injury to people or property resulting from any ideas, methods, instructions or products referred to in the content.

