Article

Machine Learning-Based Classification of Asbestos-Containing Roofs Using Airborne RGB and Thermal Imagery

1
Institute of Earth and Space Sciences, Eskisehir Technical University, Eskisehir 26555, Turkey
2
Chair of Photogrammetry and Remote Sensing, Faculty of Geodesy, University of Zagreb, 10000 Zagreb, Croatia
3
College of Engineering and Technology, American University of the Middle East, Egaila 54200, Kuwait
4
Faculty of Natural and Technical Sciences, Goce Delchev University, 2000 Stip, North Macedonia
5
Faculty of Geo-Information Science and Earth Observation (ITC), University of Twente, 7514 Enschede, The Netherlands
6
Institute of Graduate School, Eskisehir Technical University, Eskisehir 26555, Turkey
*
Author to whom correspondence should be addressed.
Sustainability 2023, 15(7), 6067; https://doi.org/10.3390/su15076067
Submission received: 19 December 2022 / Revised: 17 March 2023 / Accepted: 29 March 2023 / Published: 31 March 2023

Abstract

:
Detecting asbestos-containing roofs has been of great interest in the past few years as the substance negatively affects human health and the environment. Different remote sensing data have been successfully used for this purpose. However, RGB and thermal data have yet to be investigated. This study aims to investigate the classification of asbestos-containing roofs using RGB and airborne thermal data and state-of-the-art machine learning (ML) classification techniques. With the rapid development of ML reflected in this study, we evaluate three classifiers: Random Forest (RF), Support Vector Machine (SVM), and eXtreme Gradient Boosting (XGBoost). We have used several image enhancement techniques to produce additional bands to improve the classification results. For feature selection, we used the Boruta technique; based on the results, we have constructed four different variations of the dataset. The results showed that the most important features for asbestos-containing roof detection were the investigated spectral indices in this study. From a ML point of view, SVM outperformed RF and XGBoost in the dataset using only the spectral indices, with a balanced accuracy of 0.93. Our results showed that RGB bands could produce as accurate results as the multispectral and hyperspectral data with the addition of spectral indices.

1. Introduction

Asbestos is a family of minerals that includes chrysotile, amosite, crocidolite, tremolite, anthophyllite, and actinolite [1]. Along with the range of applications in the past for thermal and electrical insulation, cement pipe and sheets, flooring, gaskets, friction materials (e.g., brake pads and shoes), coating and compounds, plastics, textiles, paper, mastics, thread, fibre jointing, and millboard [2], asbestos was commonly used as an addition in building materials (roofs, insulation) during the second half of the 20th century [3,4]. It was later discovered that asbestos is composed of tiny mineral fibers that are harmful to human health and can lead to mesothelioma, lung cancer, and asbestosis when inhaled [5,6,7,8]. The difficulty of preventing asbestos-related illnesses, such as asbestosis, mesothelioma, and lung cancer [9], results from accidental exposure to unknown asbestos contaminations in buildings, making the environment unavoidable [10]. Airborne exposure to asbestos fibers occurs during mining, transportation, construction, and, most recently, the removal and repair of existing asbestos-cement structures [11]. As a result, several European countries have banned all asbestos-related products. The World Health Organization and the International Labor Organization recommend eliminating all asbestos use (ILO and WHO 2007). Despite the negative effects, many buildings still use asbestos-containing roofs. Asbestos was widely used in residential and industrial roof coverings between the 1970s and 1990s because of its physical and chemical qualities [12]. However, it was banned in many countries in the early 2000s [13].
There was widespread use of asbestos-containing roof coverings, such as corrugated and flat sheets. Estimating the amount of asbestos–cement products in use is essential for preserving both the environment and human health. It has been evaluated that in some countries, for example, Poland, about 90% of them are used in roof coverings [14]. The European Union (EU) supported all Member States in developing strategies for their domestic asbestos removal initiatives (Directive 2003/18/EC of the European Parliament and of the Council of 27 March 2003). The local authorities are taking steps to determine the present situation. However, there is still a lack of information on the number of asbestos-containing products in use, making it challenging to plan the landfill capacity required for their disposal.
Despite the legal background and directives, most people are unaware of the danger of asbestos. Thus, they might not appropriately treat the waste during roof renovations. Accordingly, a complete and accurate list of the roofs that pose a risk of asbestos pollution is required. Besides the environmental and health problems, old buildings usually have asbestos roofs, most of which are expected to be seismically unsafe. For example, a study has revealed that buildings constructed between the 1960s and 1990s in almost every European country, including Bulgaria, North Macedonia and Serbia, included polluting building materials such as asbestos; these buildings were often constructed using inadequate designs, poor building materials, and bad construction methods, classifying them as seismically unsafe [15]. A large portion of the buildings in Butel, Skopje, were constructed after the earthquake in 1963 as a fast solution for sheltering, with asbestos being used for both roof and wall materials. The area is affected by strong earthquakes; thus, damaged buildings or building rubbles containing asbestos need to be treated separately from the other buildings. Moreover, areas affected by other types of natural disasters, such as floods and erosion, require special soil treatment if materials from asbestos-containing buildings and other structures have been detected as traces of contamination in the ground after many years [16]. Thus, the identification and detection of asbestos-containing buildings is of great importance for both human and environmental health.

Literature Review

The use of data provided by remote sensing tools and techniques has proven to be an effective method for identifying different urban surfaces, including roofing made of asbestos fiber cement materials [17,18,19,20,21]. There have been numerous attempts to use remote sensing technology to identify rooftops. Researchers have looked into the possibility of employing different remote sensing data, mainly hyperspectral data types including field spectroscopy data and hyperspectral images, for roofing material detection because most roofing materials have distinctive spectral fingerprints, which hyperspectral bands can record [22,23]. Using hyperspectral data can be challenging due to their high-cost as well as the complexity of the data compared with RGB imagery. Even though collecting orthophoto data can also result in high costs, most countries collect high-resolution imagery every few years and hold it in cadastral archives. In addition, with the development of remote sensing technologies, more high-resolution RGB satellite images are becoming available.
For example, Cilia et al. [12] used airborne Multi-spectral Infrared Visible Imaging Spectrometer (MIVIS) hyperspectral images with 102 channels classified by the Spectral Angle Mapper (SAM) algorithm to detect asbestos cement roofs and their weathering status; their study which indicated reliable results for using this methodology for roof mapping studies. Szabo, et al. [24], used airborne hyperspectral imagery (AISA Eagle II) classified by the SAM, Support Vector Machine (SVM), and Maximum Likelihood (MaxL) algorithms to identify different roof types and determine those with asbestos components. The results from this study show that SVM performed most effectively for both datasets with an overall accuracy (OA) of around 80%. Krówczyńska, Raczko, Staniszewska and Wilk [25] used aerial images in natural color (RGB) and color infrared (CIR); each image type had a spatial resolution of 25 cm and convolutional neural networks (CNN) for the identification of asbestos-cement roofing. The work investigated a deep learning algorithm; the asbestos-cement roofing products classification results revealed a producer accuracy (PA) of 89% and an overall accuracy (OA) of more than 87% for both datasets. Tommasini, et al. [26] presented a tool in QGIS software for automatically identifying buildings with asbestos roofing in an area in Prato, Italy. The WorldView-3 sensor acquired the input images. The QGIS plugin showed reasonably good performance in identifying asbestos roofing, with only some false positives and negatives when applying a per-pixel classification. Abriha et al. [17] used WorldView-2 imagery with Discriminant Function Analysis (DFA), Random Forest (RF), and pan-sharpening for the identification of roofing materials. They divided the roof materials into three and six roof classes; the results revealed that OA was above 85%, while asbestos was classified with more than 95% accuracy and identified successfully with all classifiers. Osińska-Skotak and Ostrowski [27] used an 8-channel WorldView-2 satellite image to classify roofing materials and aerial laser scanning data provided by the ISOK project for the topographic correction. For asbestos–cement roofing materials, the accuracy of the supervised classification ranged from 76 to 92% (depending on the classification variant).
Besides the commonly used characteristics of spectral bands, many image analysis techniques (e.g, pan-sharpening, spectral indices, GLCM textures) can be used to improve classification accuracy. Authors suggest using pan-sharpening if various spatial resolution bands are used [28,29,30]. To create additional raster inputs for classification and improve classification accuracy, raster algebra can be used to create various spectral indices [31,32]. To improve accuracy, especially when high-resolution satellite imagery is used, authors recommend using additional textural features from a gray-level co-occurrence matrix (GLCM) [33]. GLCM features, also known as Haralick texture features, were developed and introduced by Haralick [34]. Salah et al. developed an algorithm for building detection and mapping from LiDAR data and multispectral aerial images [35]. Furthermore, Akhmadiya et al. developed a GLCM textural-based method for building damage assessment using Sentinel-1 imagery [36]. Furthermore, many other authors emphasize the contribution of GLCM to increasing the accuracy of image classification and landscape pattern monitoring [37,38,39]. Taking into consideration the success of the Haralik texture feature, this paper investigates GLCM features along with various spectral indices for Asbestos-containing roof classification using remote sensing data.
In their state-of-art review, Abbasi et al. [40] collected all relevant investigations for mapping roofing with asbestos-containing materials using remote sensing imagery and ML classification methods. From their analysis and our conducted literature review, it can be noted that most of the studies on this topic were conducted with hyperspectral remote sensing data. The use of RGB airborne remote sensing imagery is limited [25], while thermal data are yet to be investigated for the asbestos-containing roof classification. Although Abbasi et al. have reported an improvement in image classification using spectral indices [25], their review did not report any paper using spectral indices for asbestos-containing roof classification.
This study aims to classify asbestos-containing roofs. For this, remote sensing data and techniques were used—namely, RGB orthophoto and high-spatial-resolution thermal imagery. We also investigated several RGB-derived spectral indices and their influence on the classification results, using state-of-the-art machine learning classification techniques.

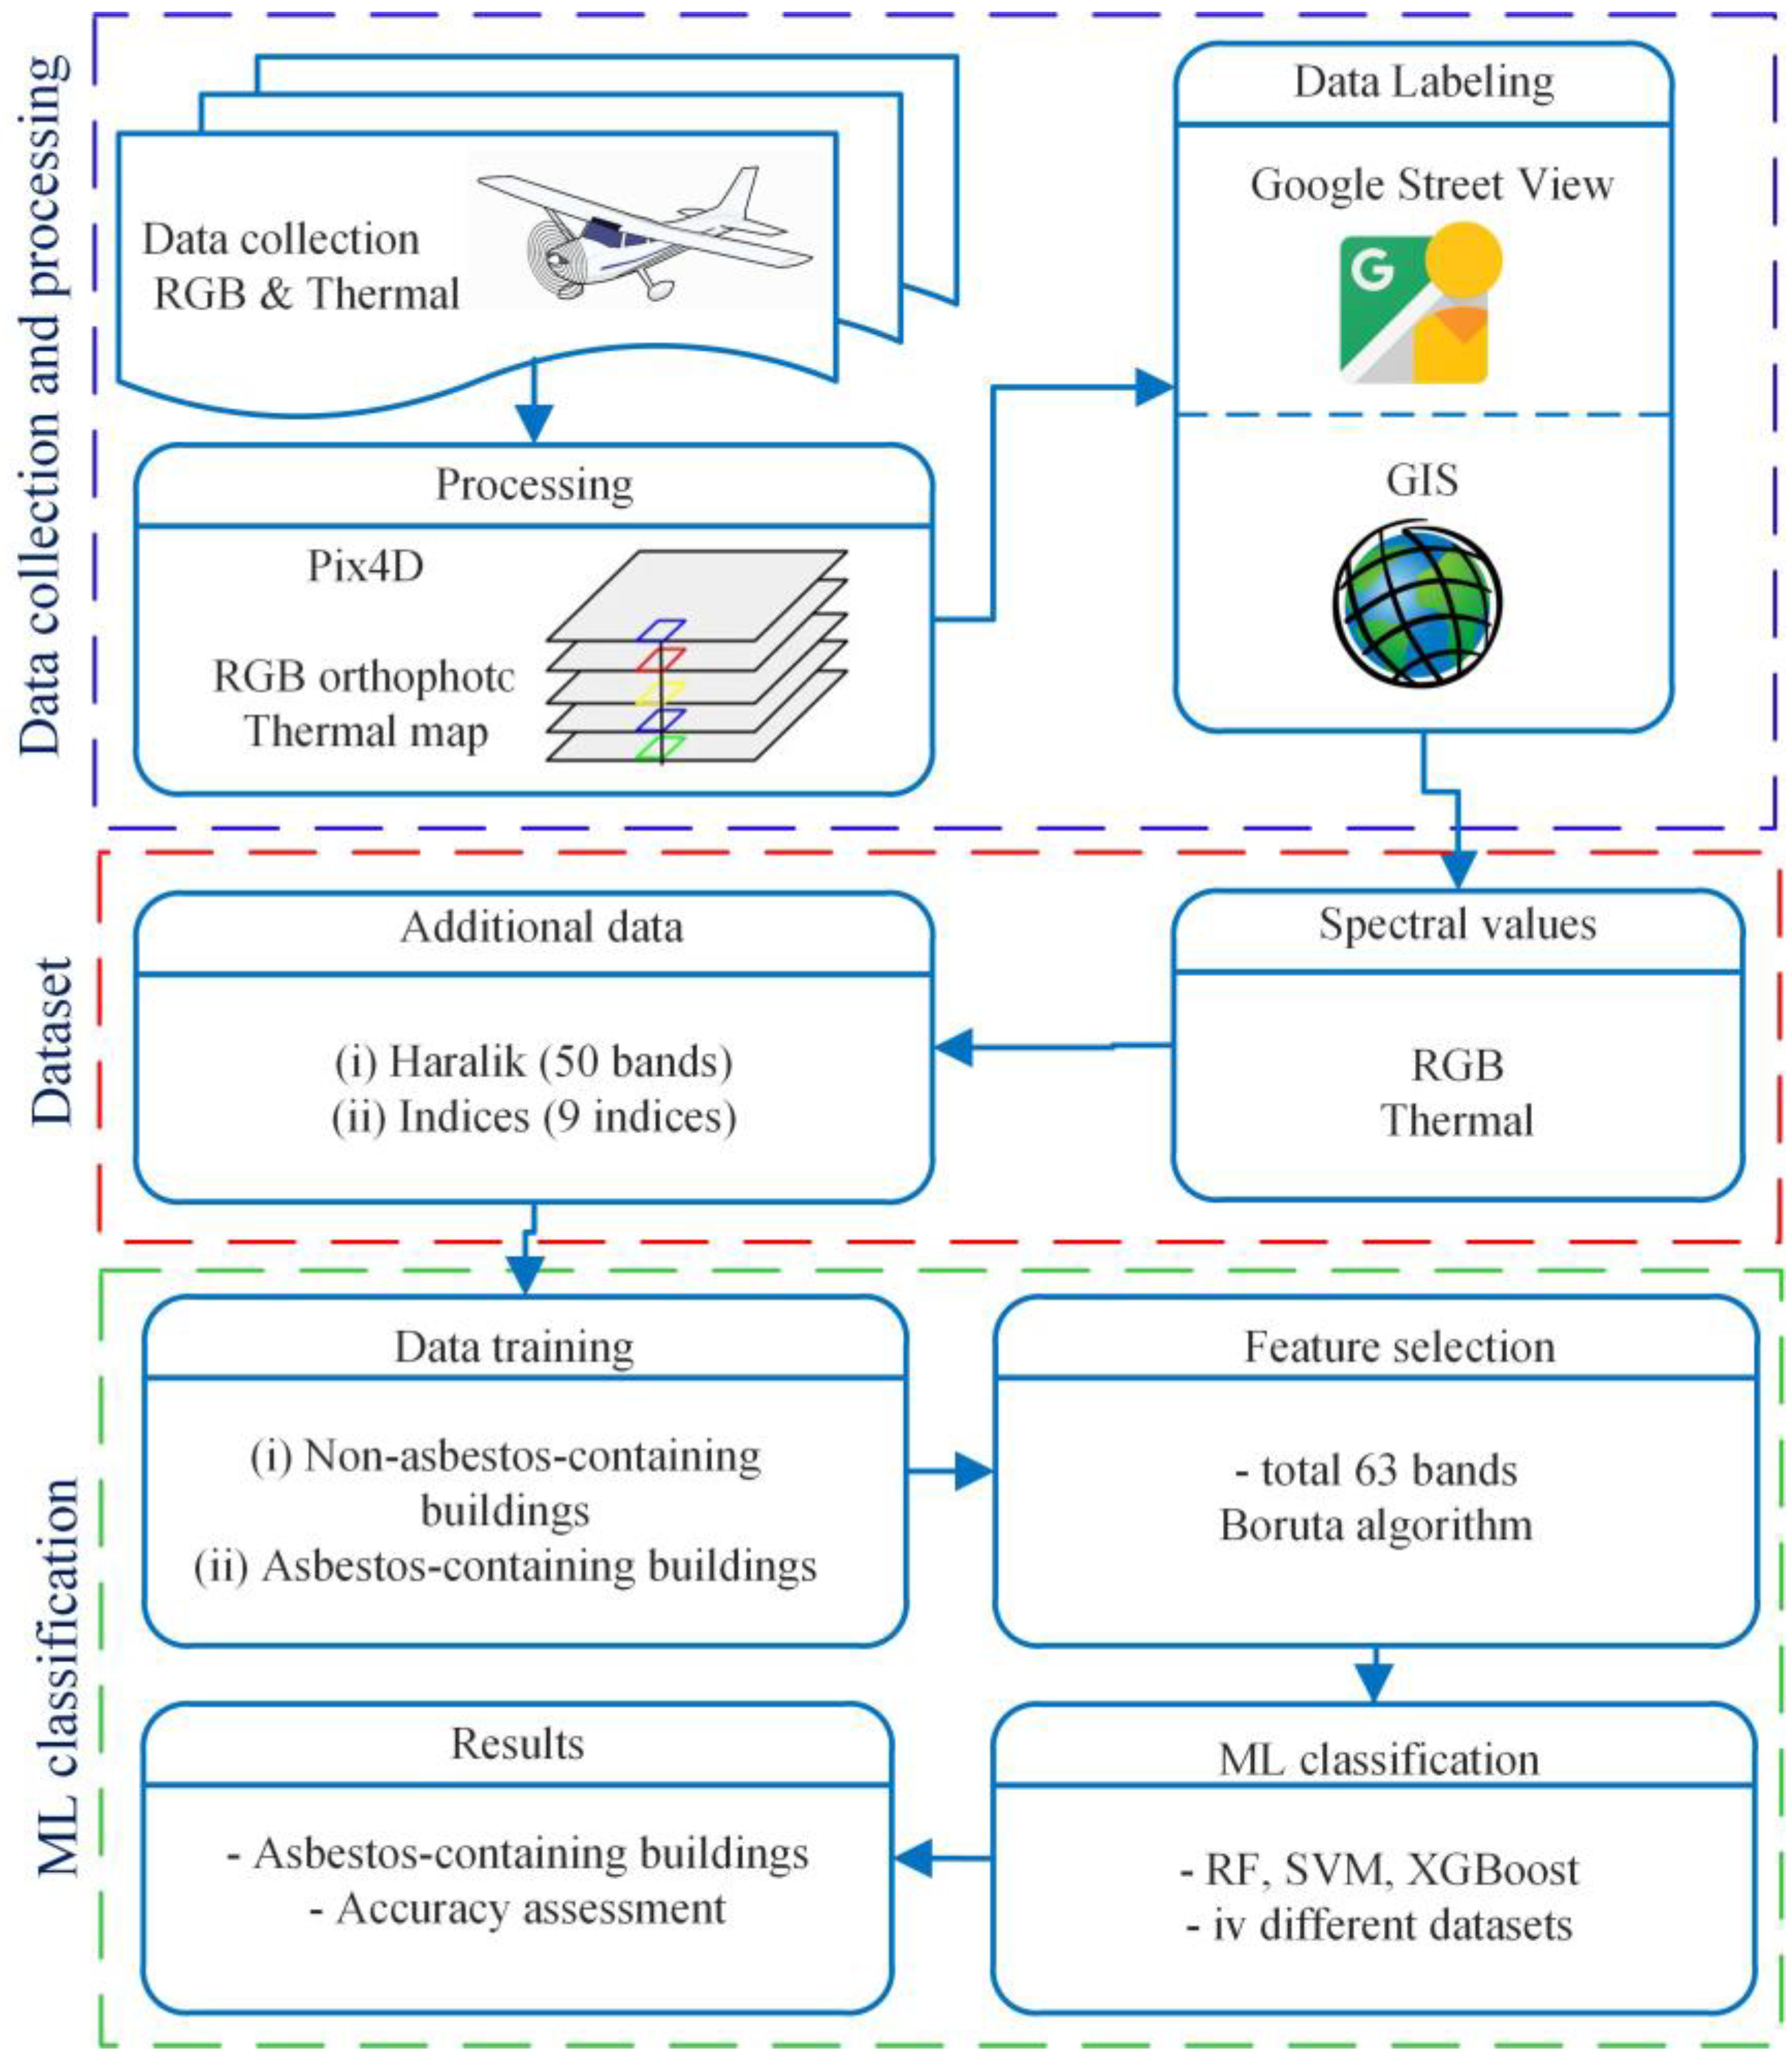
2. Materials and Methods

2.1. Study Area and Data

As a study area, the Butel municipality in the City of Skopje, North Macedonia, has been selected (Figure 1). Butel is one of the municipalities constructed after the devastating earthquake of 6.9 degrees Richter in Skopje in 1963. More than 1000 people lost their lives and more than 43,000 homes were destroyed. Today, Butel is one of Skopje’s most populated and urbanized municipalities. Butel is also one of the municipalities where asbestos-containing roofs are still being used. Most of the buildings that have asbestos-containing roofs were constructed after the 1963 earthquake within the scope of recovery actions implemented by the government and social organizations [41]. Several temporary dwelling units were constructed quickly to provide shelter to the victims of the earthquake. These units were not earthquake-resistant buildings that received engineering design service and were supposed to be replaced by new earthquake-resistant buildings in a certain time span. However, some of these temporary units are still in use [42].
For the purposes of the study, airborne data collected with an Cessna 172 aircraft have been used. The data were collected in the afternoon on 24 August 2018. The air temperatures at the time of the data collection varied from 29 to 32.5 °C between 11:00 and 16:00. The data collection were collected using two different cameras: RGB and a thermal Flir Pro Vue camera. The collected images were pre-processed in Pix4D, a suite of software products for transforming photogrammetric images into maps and 3D models. The image processing was performed on a CPU: Intel (R) Xeon (R) CPU E5-2643 v3 @3.40 GHz, RAM: 128 GB, GPU: NVIDIA Quadro K4200.
The average ground sampling distance of the RGB images is 52.51 cm. The geo-position of every image was determined using the Global Navigation Satellite System (GNSS). The average ground sampling distance of the thermal images was 1.50 m. As the images from the thermal camera had no geo-position information, the thermal data were processed in a local coordinate system; using approximately 100 Ground Control Points (GCP) over the RGB orthophoto, the thermal map was then georeferenced.
For the purpose of the study, we have used Google Street View and checked every available building in Butel municipality; we then labelled the building in a GIS environment into two classes: asbestos-containing and non-asbestos-containing buildings. Buildings that were not fully available on Google Street View or the type of roof of which we found hard to evaluate were not included in the dataset. Overall, 1250 buildings have been labeled as non-asbestos-containing and 593 as asbestos-containing buildings, making a total dataset of 1843 buildings. Examples of asbestos-containing roofs taken from Google Street View are shown in Figure 2.

2.2. Methods

The methodology followed in this study contains three different steps: (i) data collection and processing; (ii) creation of the datasets; and (iii) machine learning classification of non-asbestos-containing buildings and evaluation of the results. A detailed view of the methodology used is given in the flowchart in Figure 3.

2.2.1. Features

The first step was partly explained in the 2.2 Study area and data section, where details about the image collection, image processing and data labelling through Google Street View have been explained. After the first step, the spectral values of every labelled building were extracted and filtered, with outlier and unclear data being removed from the dataset. The statistical spectral values were thn evaluated. For providing ML classification and mapping asbestos-containing roofs, three raster bands (R—red, G—green and B—blue) of airborne imagery and one thermal image were used in dataset I (in total, four bands). Raster algebra was used to create nine spectral indices (Table 1).
Furthermore, GLCM textures were calculated as additional raster inputs for the classification. We calculated ten GLCM textures and used them in classification (angular second moment, contrast, dissimilarity, energy, entropy, GLCM correlation, GLCM mean, GLCM variance, homogeneity, maximum value) [51]. GLCM calculations were performed on five different bands: R, G, B, averaged RGB, and thermal band. In total, 50 GLCM bands, nine spectral indices and four source bands were used in dataset II (in total 63 bands) for classification.

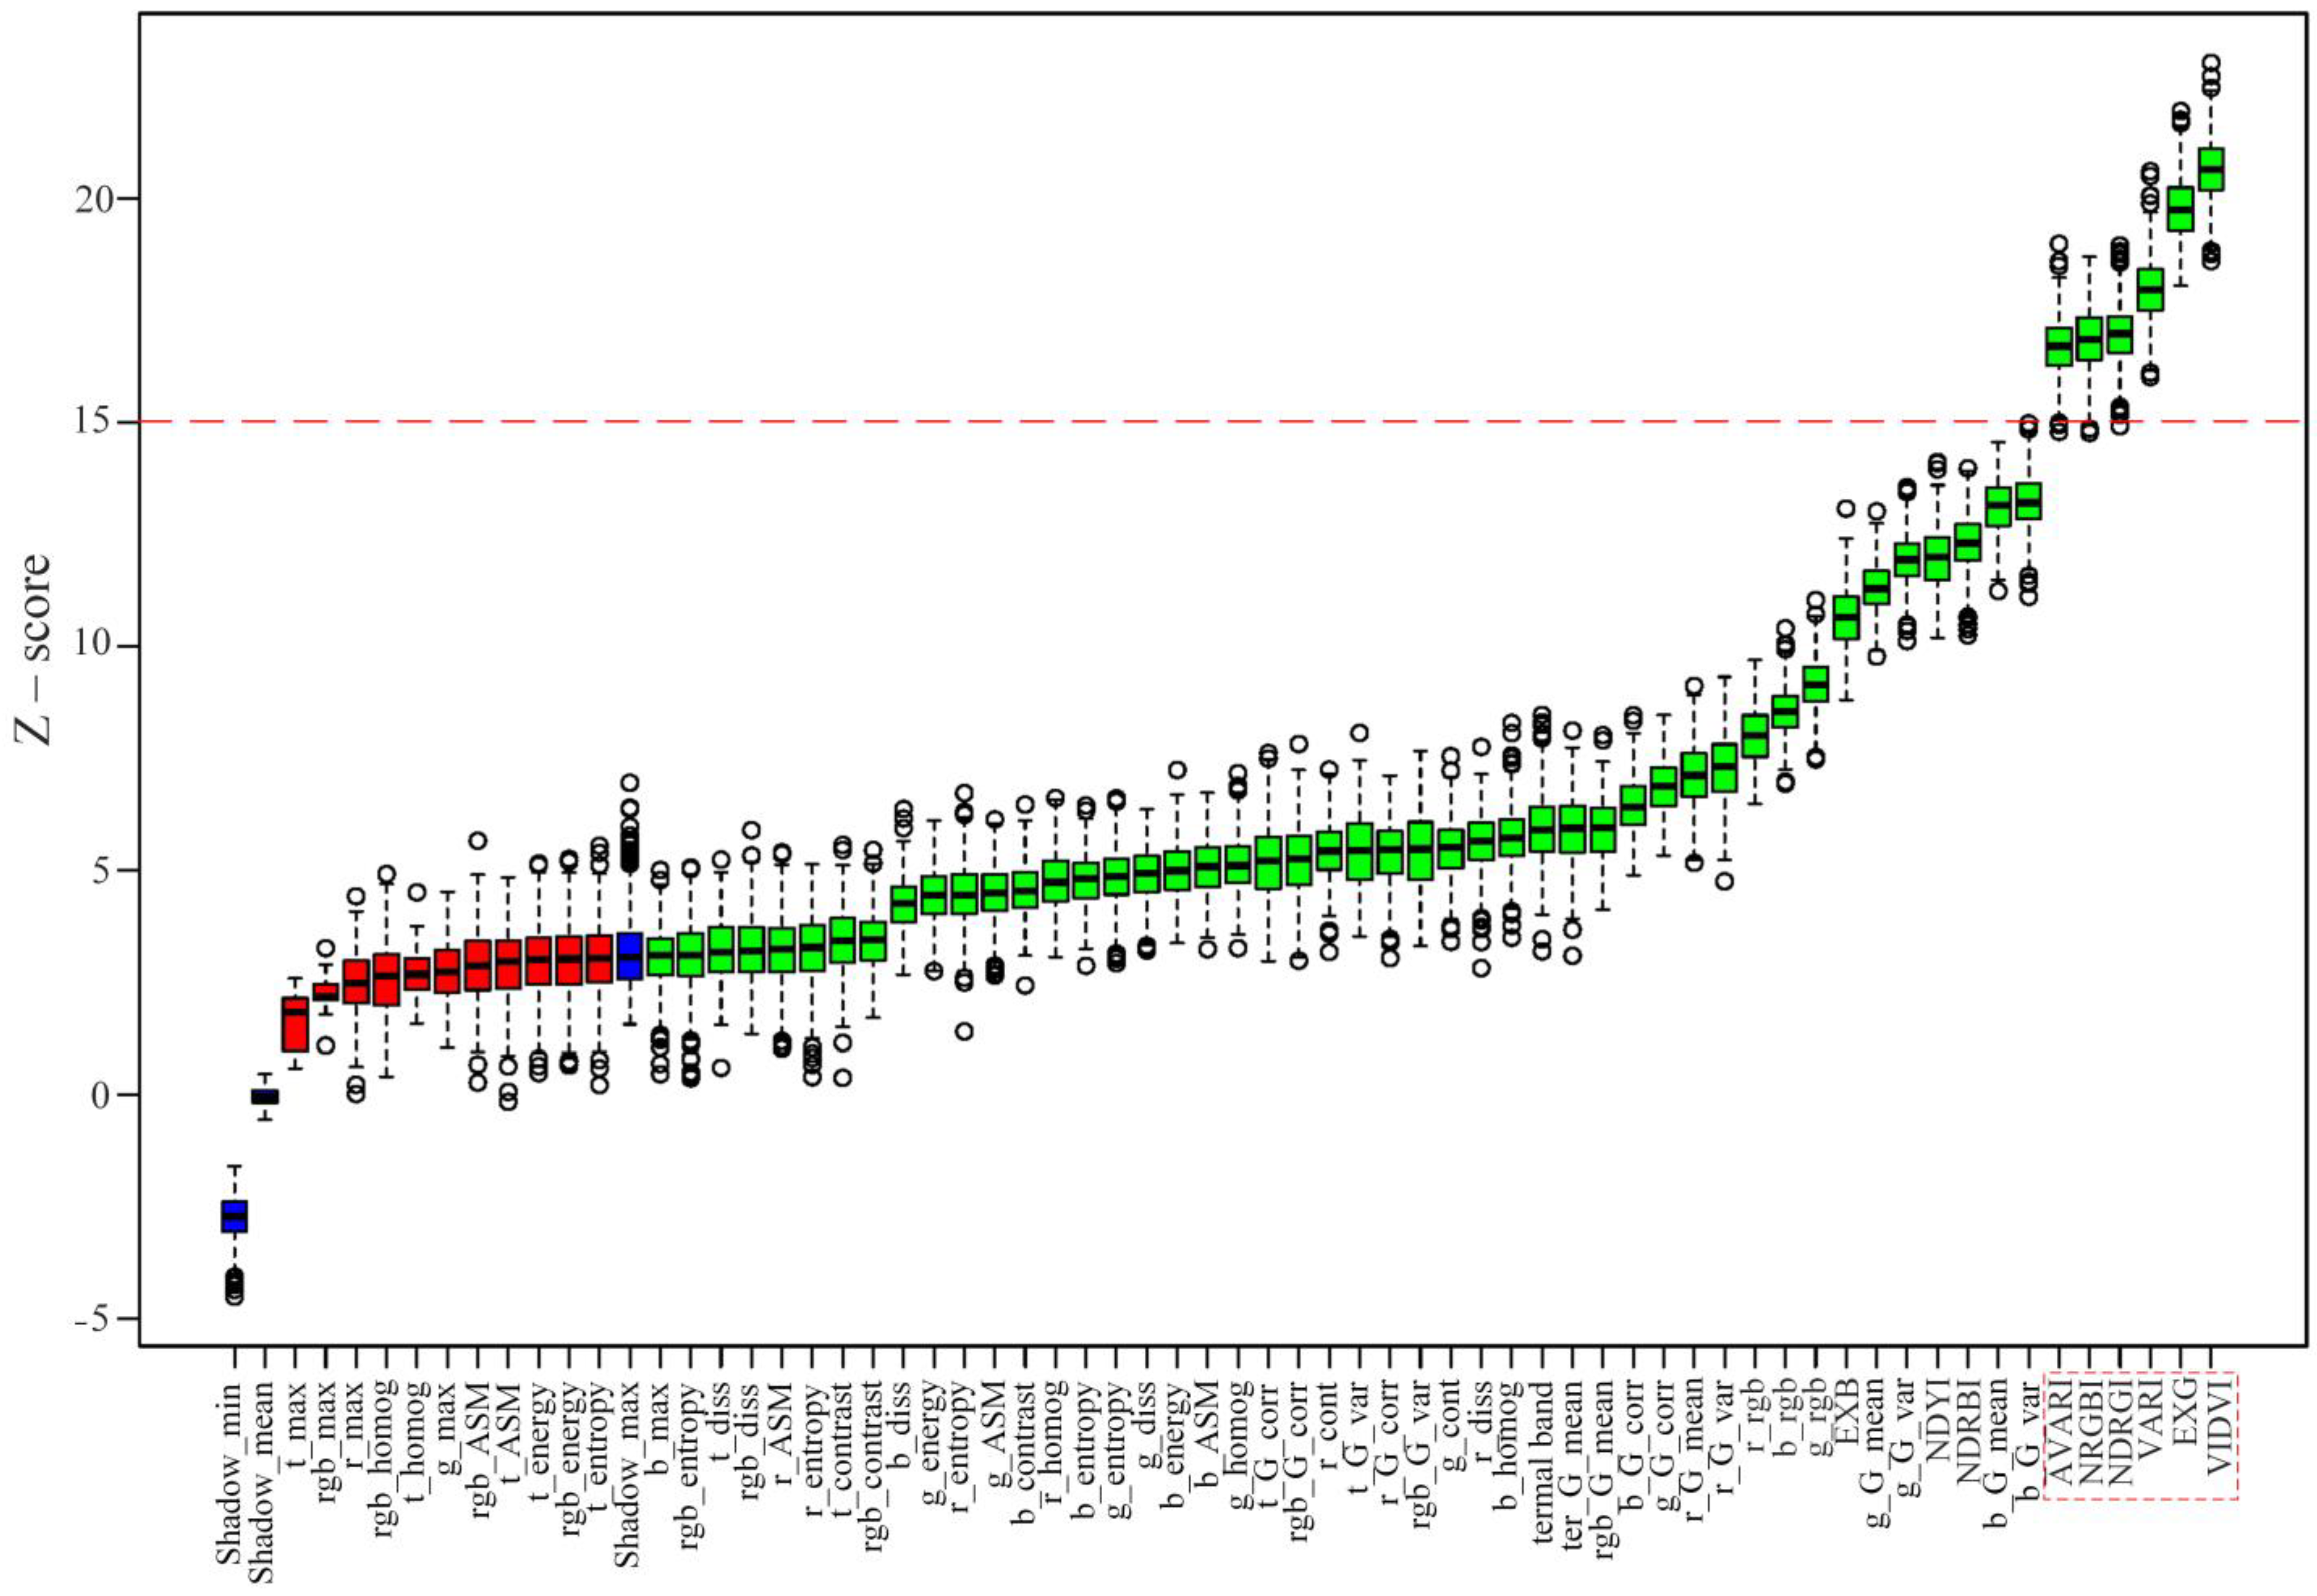
2.2.2. Feature Selection

For the feature selection, the Boruta algorithm was used (available at https://CRAN.R-project.org/package=Boruta accessed on 5 November 2022). Boruta is an innovative feature selection method that finds all relevant variables. The technique is built around a RF classification algorithm. It repeatedly eliminates variables that are statistically proven to be less meaningful than random probes [52]. The Boruta technique has been used in different research fields and for surface soil moisture mapping features using remote sensing data [53], such as the spatial distribution of soil organic carbon [54], vegetation mapping [55], etc. Thus, all of the covariates were evaluated with the Boruta algorithm to identify the meaningful features for Asbestos-containing roof classification using remote sensing data. Along with datasets I and II, we created dataset III from all of the confirmed features and dataset IV from the most importing features.

2.2.3. Machine Learning Classification

After the preparation of the datasets was completed, the statistical analysis and classifications were made in R, where three state-of-the-art machine learning algorithms were. Here we used RF [56], SVM [57], and eXtreme Gradient Boosting (XGBoost) [58] classifiers to obtain the results. The training of the datasets was performed in two classes: asbestos-containing and non-asbestos-containing buildings. We also evaluated the influence of every band in the classification using the Boruta algorithm [52]. The modelling was performed using 70% of the samples, while the remaining 30% were separated for testing the models. The RF classifier delivered reliable classifications by leveraging predictions generated by an ensemble of decision trees [59]. Thus, RF classifier was an ensemble classifier that made predictions using a set of Classification and Regression Trees (CARTs). The trees were generated by replacing a subset of training samples (a bagging approach). This meant that the same sample could be chosen multiple times, while others may not have been chosen at all. Naturally, using a higher number of features would increase the classification accuracy.
On the other hand, SVM attempted to solve the classification problem by forming a hyperplane that maximized the margin by categorizing the data. The margin was the closest distance from the hyperplane to the point of each class [60]. XGBoost is an upgraded technique based on the gradient-enhanced decision tree that can efficiently generate enhanced trees and perform parallel computation [58,61]. XGBoost enhanced the method by making it more scalable, efficient, and less prone to overfitting. It strengthened the model by introducing a regularization term that penalized model complexity. This technique has shown a lot of success in recent years in the remote sensing field [62].

2.2.4. Accuracy Assessment
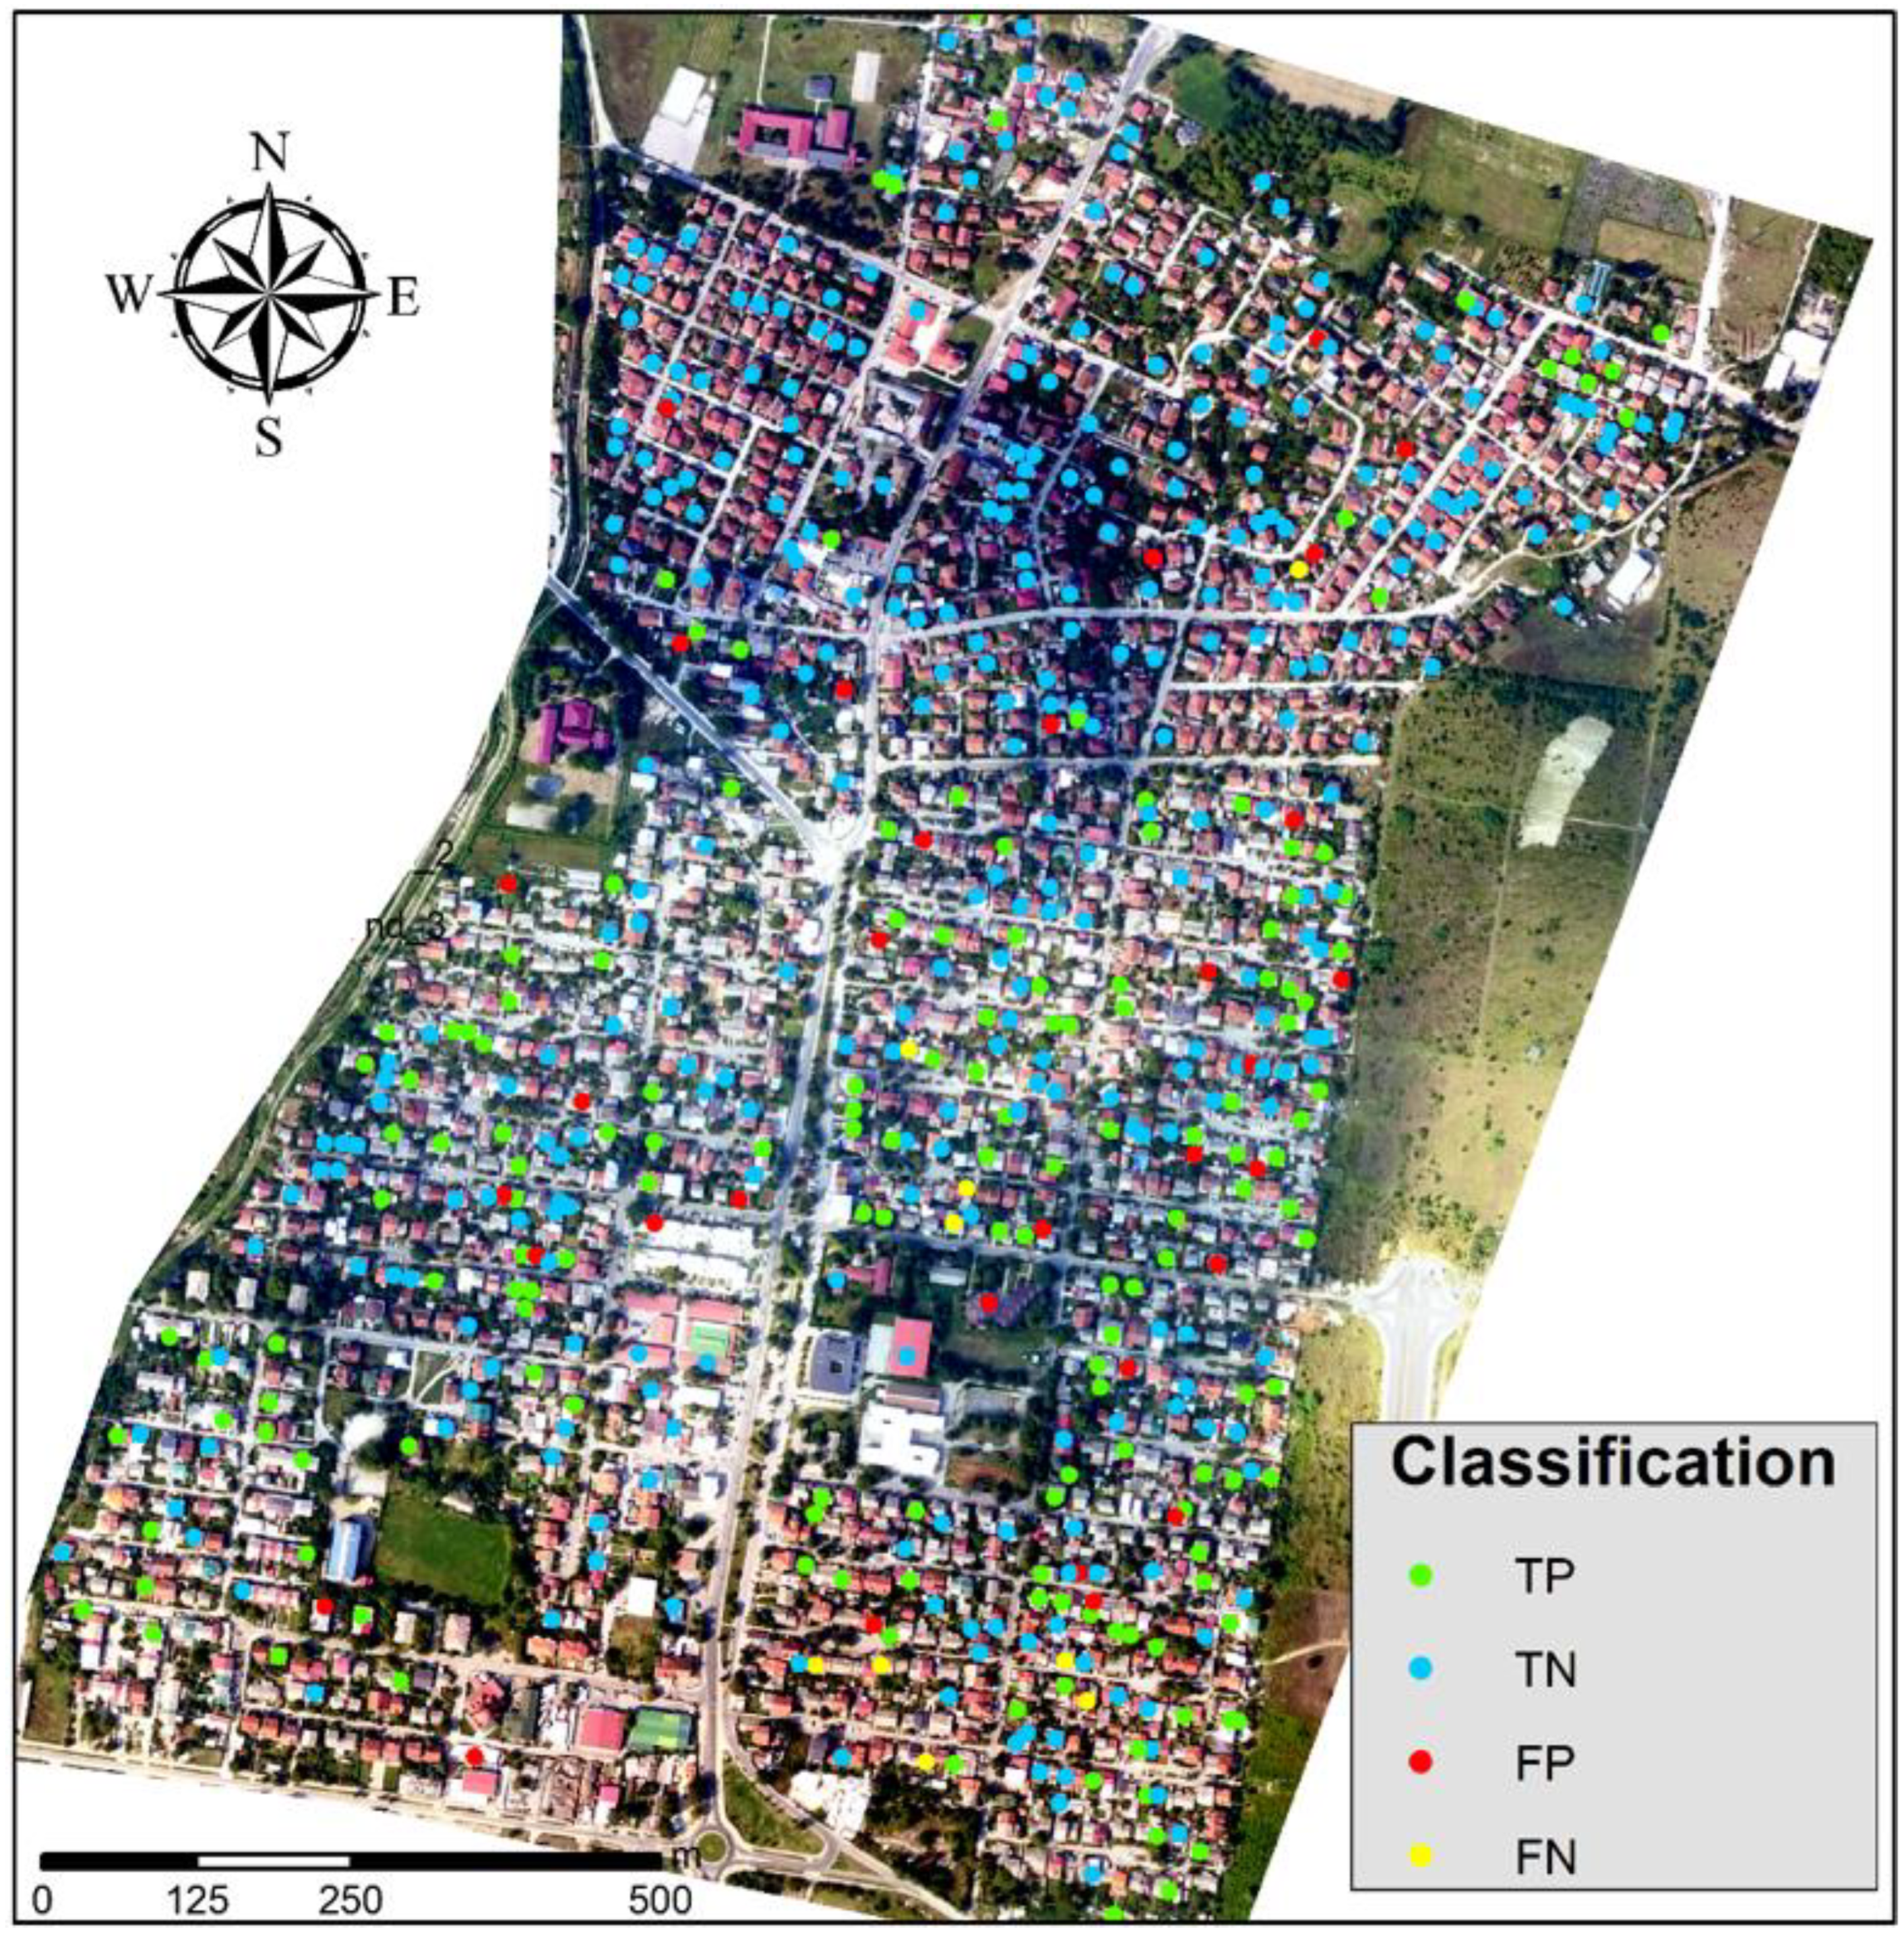
A total of 1843 buildings were used in the classification: 70% were used for training and 30% for testing the models. The accuracy was evaluated using independent buildings that were not part of the training sets. The models were tested using several accuracy evaluation metrics most commonly used in the literature for binary classification. Thus, along with kappa, we adopted sensitivity, specificity, positive predictive value (PPV), negative predictive value (NPV), and balanced accuracy. Sensitivity (i.e., recall), as shown in Equation (1), was calculated from true positives (TP—an asbestos-containing roof correctly classified) and false negatives (FN—an asbestos-containing roof missed); it described the asbestos-containing roof detection rate and how effectively the algorithm dealt with FN. The negative class accuracy (non-asbestos-containing roof in this case) was measured by specificity and negative predictive value (NPV), as shown in Equations (2) and (3), respectively; TN stood for true negative, and FP for false positive—an asbestos-containing roof incorrectly classified. The PPV (i.e., precision), described the correctness of detected buildings and how well the algorithm dealt with FP values, as shown in Equation (4). Finally, the balanced accuracy was calculated as a mean value from the Sensitivity and the Specificity of the models [63].
Sensitivity = TP/(TP + FN)
Specificity = TN/(TN + FP)
NPV = TN/(TN + FN)
PPV = TP/(TP + FP)

3. Results

3.1. Feature Selection Results

Along with the four bands from the study area (RGB and thermal), 50 variables were retrieved with the Haralick technique and nine spectral indices were considered for the investigated classification. Boruta performed 400 random forest runs. Using the Boruta technique for feature selection, the results showed that 52 features were confirmed as important for the classification, while nine features were rejected—the thermal band’s energy, entropy, ASM, homogeneity, MAX values, RGB band’s energy, ASM, homogeneity and MAX values, and the MAX value from red and green band were rejected by Boruta as unimportant features. In the other 52 confirmed values, there were features that were more important than the others. The results are shown in Figure 4. From the results, it can be seen that the most important features were the spectral indices. In fact, all nine indices were among the 15 most important features. The VIDVI had the highest Z-score, followed by EXG, VARI, NDRGI, NRGBI, and AVARI. All of the mentioned indices had Z-scores higher than 15; thus, they were selected for the dataset IV. All of the confirmed values were part of the dataset III. The Haralick-produced bands show that the GLCM features were more important than the others, especially the ones produced from the blue band. The original rbg bands have a mean Z-score of 8.5 and, out of 63 values, were ranked in 14–16 places. On the other hand, the original band had a mean Z-score of 6, placed as 22 features.

3.2. Machine Learning Classification Results

Three different machine learning classifiers were used to classify the dataset into the NAC and AC building classes: RF, SVM, and XGBoost. We evaluated different datasets to investigate which dataset gave the best results for the aim of the study. Dataset I is formed of four bands plus single RGB and thermal bands. Dataset II contains all of the data explained in Section 2.1. and a total of 63 bands. Dataset III is produced from the bands confirmed by the Boruta technique used for the feature selection and contains 53 bands. To explore the performance of the investigated machine learning algorithms with a small number of features, we have selected the features with Z-scores higher than 15; dataset IV was constructed from six spectral indices produced from the RGB bands (VIDVI, EXG, VARI, NDRGI, NRGBI, and AVARI).
The results from the classifications are shown in Table 2. The results show that overall, SVM performed best within dataset I followed by XGBoost, and RF. In this dataset, the accuracy of the negative class (non-asbestos-containing roofs) was better predicted with XGBoost followed by RF. The balanced accuracy was higher for SVM (0.92) followed by XGBoost (0.90) and RF (0.89).
Dataset II contains many more bands than dataset I. While dataset I c only the original four bands (rgb + thermal), dataset II contains all of the investigated features (63). While the SVM results were similar for dataset I and dataset II, the results for RF and XGBoost showed significant improvement. Thus, the kappa was improved from 0.78 to 0.82 and from 0.79 to 0.82 for RF and XGBoost, respectively,. Moreover, the sensitivity noticeably improved from 0.86 to 0.93 and from 0.86 to 0.91 for RF and XGBoost, respectively. RF showed best results within dataset for all values except specificity and PPV, where XGBoost slightly outperformed RF. Taking out the values rejected by Boruta (dataset III) slightly improved some of the results obtained, with RF achieving the highest kappa in all datasets (0.83).
Even though dataset IV was constructed of only six features, it showed some of the highest accuracy values (Figure 5). SVM classifier achieved the highest sensitivity (0.95), NPV (0.973), and Balanced Accuracy (0.93) among all datasets and classifiers. XGBoost followed the SVM classifier in all accuracy parameters except specificity and PPV, where RF showed the best results.

4. Discussion

The environmental exposure caused by the presence of asbestos roofs is critical from various points of view. As a result, determining the number of asbestos-containing roofs still in use is essential. Detecting the asbestos-containing roofs might lead to a more accurate estimate of asbestos removal expenses and create a foundation for determining the extent to which residents are exposed to airborne asbestos fibers. Furthermore, the prospective risk of acquiring asbestos-related disorders may be evaluated. Recently, the identification and mapping of asbestos-containing roofs has been completed using remote sensing data [12,26].
This paper’s main goal was to investigate different remote sensing data and remote sensing delivered dataset features. In addition, one of the main goals was to compare three state-of-the-art machine learning algorithms for asbestos-containing roofs. Most of the instigations in the literature are made with multispectral or hyperspectral satellite or airborne remote sensing data [12,22,23]. It should be noted that thermal data and RGB-derived spectral indices have not been used in the literature for asbestos-containing roof mapping and/or detection. In this study, we aimed to investigate airborne RGB along with thermal data. In addition to the four bands, we investigated different features to extract optimal benefit from the original data. As there were many different features, we have also used the Boruta technique for feature selection. In fact, we have evaluated four variations of the dataset according to the feature selection results. The Boruta technique showed that out of the 63 investigated features, 53 were confirmed as important. In general, the Haralick-produced bands from the thermal and mean RGB bands were rejected, along with the maximum values of the red and green bands. As a feature, the thermal band was not among the most important features and ranked 23rd. The most important features were six of the nine used spectral indices. This was an expected output as spectral indices are often used to improve classification accuracy due to the combination of different spectral bands [31,32]. However, this is the first study to use remote sensing spectral indices for asbestos-containing roof classification.
The machine learning classification results showed that adding different features derived with the Haralick technique did not significantly boost the results. Although there was a slight difference in dataset I and dataset II results, the results from the other dataset were very similar. As expected, the RF classifier performed best with dataset II and III, as RF performs well on large datasets [59]. On the other hand, SVMs handle small training datasets more effectively and often produce higher classification accuracy than the other methods [64]. Thus, SVM outperformed RF and XGBoost in the model’s sensitivity with the highest value from dataset IV (0.95), showing the rate of asbestos-containing roof detection and how the algorithm dealt with missed values. However, RF outperformed both SVM and XGBoost within dataset IV for the specificity and PPVs; therefore, RF more effectively dealt with the negative class accuracy and the detection of the non-asbestos-containing roofs. This was the case for the XGBoost classifier within dataset II. Overall, the highest balanced accuracy was achieved within dataset IV with the SVM (0.93) classifier, followed by XGBoost (0.92) and RF (0.91). The results show that dataset IV, constructed from six spectral indices derived only from the RGB bands, gave the best results. It should be noted that all of the classifiers showed more accurate results in the classification of the negative class.
A visual inspection of the results showed that the falsely predicted results stemmed from unclear roof visibility, such as roofs surrounded by taller buildings, trees, or very small buildings. On the other hand, the wrongly predicted results from the negative class stem from the very light color of the roof. As the asbestos-containing roofs are not equally distributed in the study area, for visualization we selected a part of the study area with dense asbestos-containing roofs, as shown in Figure 6.
A recent review noted that SVM outperformed other classifiers, such as SAM, ML and RF. However, in their review Abbasi et al. did not report the use of RGB and thermal data and the XGBoost classifier in other studies. In comparison with other studies, Pinho et al. [65] achieved poor accuracy (kappa 0.53) with four-band QuickBird imagery. With 8 multispectral imagery, Gibril et al. [66] achieved high accuracy (over 90%) with RF. With hyperspectral data and SVM classifier, Szabo et al. also achieved high accuracy. Overall, most of the studies showed good results with, in most cases, the overall accuracy of the classification varying from 85–95% [25]. The comparison of the results shows that even though we are using only RGB data, we achieved as accurate results as the other studies using multispectral or hyperspectral remote sensing data. This is also due to the use of different spectral indices in this study. In terms of spatial resolution, other studies generally used high-spatial resolution imagery (0.25–5 m); for example, Krówczynska et al. [25] used 0.25 m and achieved accuracy of 89%.
While Krówczynska et al. pointed out that low spectral resolution (RGB and near infrared band) only allowed a rough classification of roof martials [67], the results of this study showed the opposite. On the other hand, the results showed that the enhanced spectral data with the Haralick algorithm and the use of thermal data did not positively affect the classification accuracy. Instead, a few very simple spectral bands indices from the RGB range were enough to achieve accuracy as high as the other studies that used remote sensing data with multi- or hyper-spectral resolution. Using such datasets allows for extra confirmation of results by photo interpretation, which is extremely difficult on photos with lower spatial resolution. The use of publicly accessible and inexpensive orthophotos increases the approach’s dependability. It makes the provided method simple to execute as most countries’ cadastral agencies carry out imaging campaigns every few years and have orthophotos already available with no additional data needing to be acquired. On the other hand, hyperspectral data, the data widely used in the literature, are challenging for processing and often have a high cost. Furthermore, the national circular aero photogrammetry survey is standard for acquiring spatial information at the national scale for most countries. Additionally, with the rapid development of remote sensing technologies, high-resolution satellite imagery is becoming increasingly available and can be used for the purpose of the study. Another highlight of this study is the use of Google Street View to collect and validate the training and test data. This can be a great time-saver as the data collection and validation are often available on-site. It should be noted that a very small number of the building were unavailable in Google Street View within the study area. It should also be mentioned that in some parts of the world, Google Street View is not available; thus, in situ campaigns must also be completed. However, with the rapid development of remote sensing and image processing, we imagine that this challenge will be resolved in the near future. There are some impediments in the approach used, e.g., shadows near buildings or salt and paper effect on some locations. These are very common remote sensing problems in high-resolution aerial or satellite imagery.
The results are beneficial from several points of view. Besides the already discussed benefits in the literature, the findings in this study can be applied worldwide for mapping or detecting asbestos roofs or similar objects. Moreover, applicability and novel indices and modelling approaches can be used in similar remote sensing research to improve image classification. From our point of view, the results can be also used for approximately determining the buildings’ year of construction. Notably, asbestos-containing products have been forbidden in the study region since 2006 [68] and the roofs date from the 1960s. As a result, based on some assumptions, the recognized buildings can also be time-tagged. Because the construction year is one of the most important characteristics for assessing seismic building risk, the acquired data will be of significant interest to earthquake engineering experts. Buildings with asbestos-containing roofs in the study region are often old and have not received competent engineering services. As a result, their identification is critical in terms of seismic safety. The identification of asbestos-containing buildings is essential in areas affectec by natural disasters, such as earthquakes, floods, erosions etc., as asbestos materials need to be treated separately.
From this perspective, for future studies, the acquisition of the crucial seismic risk assessment building variables, such as construction year, building height, and building area, can be investigated using different remote sensing data and techniques. Future studies on asbestos-containing buildings can take a direction towards localizing dense buildings and give instant information about the roof materials.

5. Conclusions

This study compared three state-of-art machine learning techniques for asbestos-containing roof classification, such as RF, SVM, and XGBoost. For this purpose, high-resolution RGB airborne data has been used along with thermal data. To investigate the full potential of the data, we used different image data derivations, such as Haralick techniques and simple spectral indices. From the produced data, we investigated four different datasets: one only with the original bands, one with all the features, one with the features confirmed by the Boruta technique and one with the most important features.
The results showed that the Haralik-produced bands and the thermal band did not improve the classification accuracy. On the other hand, the spectral indices significantly improved the classification of the asbestos-containing roofs. The spectral indices that significantly improved the results were calculated only from the RGB bands and, to our knowledge, they were used for the first time in the literature for the purpose of this study. In terms of the algorithm used, as expected, RF showed good results with more features, while the SVM showed the smallest number of features. Our results showed that RGB bands could produce results as accurate as the multispectral and hyperspectral data with the addition of simple spectral indices. The use of Google Street View was of great importance to this study as conventional data collection and validation methods could be expensive and time-consuming.

Author Contributions

Conceptualization, G.K., O.K. and V.A.; methodology, G.K. and M.G.; software, G.K. and R.C.; validation, G.K. and R.C.; formal analysis, G.K. and R.C.; investigation, G.K.; data curation, G.K. and M.A.M.; writing—original draft preparation, G.K., O.K. and V.A.; writing—review and editing, G.K., O.K. and M.G.; supervision, M.G. and O.K.; funding acquisition, G.K., M.G. and O.K. All authors have read and agreed to the published version of the manuscript.

Funding

This research received no external funding.

Institutional Review Board Statement

Not applicable.

Informed Consent Statement

Not applicable.

Data Availability Statement

Dataset and orthophoto available at reasonable request.

Acknowledgments

This article is based on COST Action CA19123—Protection, Resilience, Rehabilitation of damaged environment, supported by COST (European Cooperation in Science and Technology) https://www.cost-phoenix.eu/ (accessed on 6 December 2022).

Conflicts of Interest

The authors declare no conflict of interest.

References

  1. Ross, M.; Langer, A.M.; Nord, G.L.; Nolan, R.P.; Lee, R.J.; Van Orden, D.; Addison, J. The mineral nature of asbestos. Regul. Toxicol. Pharmacol. 2008, 52, S26–S30. [Google Scholar] [CrossRef] [PubMed]
  2. IARC Working Group on the Evaluation of Carcinogenic Risks to Humans. Arsenic and arsenic compounds. In Arsenic, Metals, Fibres and Dusts; International Agency for Research on Cancer: Lyon, France, 2012. [Google Scholar]
  3. Bassani, C.; Cavalli, R.M.; Cavalcante, F.; Cuomo, V.; Palombo, A.; Pascucci, S.; Pignatti, S. Deterioration status of asbestos-cement roofing sheets assessed by analyzing hyperspectral data. Remote Sens. Environ. 2007, 109, 361–378. [Google Scholar] [CrossRef]
  4. Campopiano, A.; Ramires, D.; Zakrzewska, A.M.; Ferri, R.; D’annibale, A.; Pizzutelli, G. Risk Assessment of the Decay of Asbestos Cement Roofs. Ann. Occup. Hyg. 2009, 53, 627–638. [Google Scholar] [CrossRef] [PubMed]
  5. Bartrip, P.W. History of asbestos related disease. Postgrad. Med. J. 2004, 80, 72–76. [Google Scholar] [CrossRef] [PubMed] [Green Version]
  6. Currie, G.P.; Watt, S.J.; Maskell, N.A. An overview of how asbestos exposure affects the lung. BMJ 2009, 339, b3209. [Google Scholar] [CrossRef] [Green Version]
  7. Jamrozik, E.; de Klerk, N.; Musk, A.W. Asbestos-related disease. Int. Med. J. 2011, 41, 372–380. [Google Scholar] [CrossRef]
  8. Reid, A.; de Klerk, N.H.; Magnani, C.; Ferrante, D.; Berry, G.; Musk, A.W.; Merler, E. Mesothelioma risk after 40 years since first exposure to asbestos: A pooled analysis. Thorax 2014, 69, 843. [Google Scholar] [CrossRef] [PubMed] [Green Version]
  9. Nielsen, L.S.; Baelum, J.; Rasmussen, J.; Dahl, S.; Olsen, K.E.; Albin, M.; Hansen, N.C.; Sherson, D. Occupational asbestos exposure and lung cancer—A systematic review of the literature. Arch. Environ. Occup. Health 2014, 69, 191–206. [Google Scholar] [CrossRef] [PubMed]
  10. Doll, R.; Peto, J. Effects on Health of Exposure to Asbestos; Health & Safety Commission: London, UK, 1985. [Google Scholar]
  11. Roggli, V.L.; Vollmer, R.T. Twenty-five years of fiber analysis: What have we learned? Hum. Pathol. 2008, 39, 307–315. [Google Scholar] [CrossRef] [PubMed]
  12. Cilia, C.; Panigada, C.; Rossini, M.; Candiani, G.; Pepe, M.; Colombo, R. Mapping of Asbestos Cement Roofs and Their Weathering Status Using Hyperspectral Aerial Images. ISPRS Int. J. Geo-Inf. 2015, 4, 928–941. [Google Scholar] [CrossRef] [Green Version]
  13. Brown, B.; Hollins, I.; Pickin, J.; Donovan, S. Asbestos Stocks and Flows Legacy in Australia. Sustainability 2023, 15, 2282. [Google Scholar] [CrossRef]
  14. Wilk, E.; Krówczyńska, M.; Pabjanek, P.; Mędrzycki, P. Estimation of the amount of asbestos-cement roofing in Poland. Waste Manag. Res. 2017, 35, 491–499. [Google Scholar] [CrossRef] [PubMed]
  15. Folić, R.; Laban, M.; Milanko, V. Reliability and sustainability analysis of large panel residential buildings in Sofia, Skopje and Novi Sad. Facta Univ.-Ser. Archit. Civ. Eng. 2011, 9, 161–176. [Google Scholar] [CrossRef]
  16. Obmiński, A. Asbestos cement products and their impact on soil contamination in relation to various sources of anthropogenic and natural asbestos pollution. Sci. Total Environ. 2022, 848, 157275. [Google Scholar] [CrossRef] [PubMed]
  17. Abriha, D.; Kovács, Z.; Ninsawat, S.; Bertalan, L.; Bertalan-Balazs, B.; Szabo, S. Identification of roofing materials with Discriminant Function Analysis and Random Forest classifiers on pan-sharpened WorldView-2 imagery—A comparison. Hung. Geogr. Bull. 2018, 67, 375–392. [Google Scholar] [CrossRef] [Green Version]
  18. de Pinho, C.M.D.; Fonseca, L.M.G.; Korting, T.S.; de Almeida, C.M.; Kux, H.J.H. Land-cover classification of an intra-urban environment using high-resolution images and object-based image analysis. Int. J. Remote Sens. 2012, 33, 5973–5995. [Google Scholar] [CrossRef]
  19. Fiumi, L.; Congedo, L.; Meoni, C. Developing expeditious methodology for mapping asbestos-cement roof coverings over the territory of Lazio Region. Appl. Geomat. 2014, 6, 37–48. [Google Scholar] [CrossRef]
  20. Manolakis, D.; Shaw, G. Detection algorithms for hyperspectral imaging applications. IEEE Signal Process. Mag. 2002, 19, 29–43. [Google Scholar] [CrossRef]
  21. Trevisiol, F.; Lambertini, A.; Franci, F.; Mandanici, E. An Object-Oriented Approach to the Classification of Roofing Materials Using Very High-Resolution Satellite Stereo-Pairs. Remote Sens. 2022, 14, 849. [Google Scholar] [CrossRef]
  22. Bioucas-Dias, J.M.; Plaza, A.; Camps-Valls, G.; Scheunders, P.; Nasrabadi, N.; Chanussot, J. Hyperspectral Remote Sensing Data Analysis and Future Challenges. IEEE Geosci. Remote Sens. Mag. 2013, 1, 6–36. [Google Scholar] [CrossRef] [Green Version]
  23. Frassy, F.; Candiani, G.; Rusmini, M.; Maianti, P.; Marchesi, A.; Rota Nodari, F.; Dalla Via, G.; Albonico, C.; Gianinetto, M. Mapping Asbestos-Cement Roofing with Hyperspectral Remote Sensing over a Large Mountain Region of the Italian Western Alps. Sensors 2014, 14, 15900–15913. [Google Scholar] [CrossRef] [Green Version]
  24. Szabo, S.; Burai, P.; Kovács, Z.; Szabó, G.; Kerényi, A.; Fazekas, I.; Paládi, M.; Buday, T.; Szabo, G. Testing algorithms for the identification of asbestos roofing based on hyperspectral data. Environ. Eng. Manag. J. 2014, 13. [Google Scholar] [CrossRef]
  25. Krówczyńska, M.; Raczko, E.; Staniszewska, N.; Wilk, E. Asbestos–Cement Roofing Identification Using Remote Sensing and Convolutional Neural Networks (CNNs). Remote Sens. 2020, 12, 408. [Google Scholar] [CrossRef] [Green Version]
  26. Tommasini, M.; Bacciottini, A.; Gherardelli, M. A QGIS Tool for Automatically Identifying Asbestos Roofing. ISPRS Int. J. Geo-Inf. 2019, 8, 131. [Google Scholar] [CrossRef] [Green Version]
  27. Osińska-Skotak, K.; Ostrowski, W. Use of satellite and ALS data for classification of roofing materials on the example of asbestos roof tile identification. Tech. Sci. 2015, 18, 283–298. [Google Scholar]
  28. Wang, P.; Zhang, L.; Zhang, G.; Bi, H.; Dalla Mura, M.; Chanussot, J. Superresolution land cover mapping based on pixel-, subpixel-, and superpixel-scale spatial dependence with pansharpening technique. IEEE J. Sel. Top. Appl. Earth Obs. Remote Sens. 2019, 12, 4082–4098. [Google Scholar] [CrossRef]
  29. Gašparović, M.; Jogun, T. The effect of fusing Sentinel-2 bands on land-cover classification. Int. J. Remote Sens. 2018, 39, 822–841. [Google Scholar] [CrossRef]
  30. Kaplan, G. Assessing the effectiveness of PlanetScope synthesized panchromatic bands for spatial enhancement of Sentinel-2 data. J. Appl. Remote Sens. 2020, 14, 036504. [Google Scholar] [CrossRef]
  31. Viana, C.M.; Oliveira, S.; Oliveira, S.C.; Rocha, J. Land use/land cover change detection and urban sprawl analysis. In Spatial Modeling in GIS and R for Earth and Environmental Sciences; Elsevier: Amsterdam, The Netherlands, 2019; pp. 621–651. [Google Scholar]
  32. Talukdar, S.; Singha, P.; Mahato, S.; Pal, S.; Liou, Y.-A.; Rahman, A. Land-use land-cover classification by machine learning classifiers for satellite observations—A review. Remote Sens. 2020, 12, 1135. [Google Scholar] [CrossRef] [Green Version]
  33. Gašparović, M.; Dobrinić, D. Green Infrastructure Mapping in Urban Areas Using Sentinel-1 Imagery. Croat. J. For. Eng. J. Theory Appl. For. Eng. 2021, 42, 337–353. [Google Scholar] [CrossRef]
  34. Haralick, R.M. Statistical and structural approaches to texture. Proc. IEEE 1979, 67, 786–804. [Google Scholar] [CrossRef]
  35. Salah, M.; Trinder, J.; Shaker, A. Evaluation of the self-organizing map classifier for building detection from lidar data and multispectral aerial images. J. Spat. Sci. 2009, 54, 15–34. [Google Scholar] [CrossRef]
  36. Akhmadiya, A.; Nabiyev, N.; Moldamurat, K.; Kismanova, A.; Prmantayeva, B.; Brimzhanova, S. Application of GLCM Textural Based Method With Sentinel-1 Radar Remote Sensing Data for Building Damage Assessment. In Proceedings of the 2022 International Conference on Smart Information Systems and Technologies (SIST), Nur-Sultan, Kazakhstan, 28–30 April 2022; pp. 1–5. [Google Scholar]
  37. Rajendran, G.B.; Kumarasamy, U.M.; Zarro, C.; Divakarachari, P.B.; Ullo, S.L. Land-use and land-cover classification using a human group-based particle swarm optimization algorithm with an LSTM Classifier on hybrid pre-processing remote-sensing images. Remote Sens. 2020, 12, 4135. [Google Scholar] [CrossRef]
  38. Park, Y.; Guldmann, J.-M. Measuring continuous landscape patterns with Gray-Level Co-Occurrence Matrix (GLCM) indices: An alternative to patch metrics? Ecol. Indic. 2020, 109, 105802. [Google Scholar] [CrossRef]
  39. Huang, X.; Li, S.; Li, J.; Jia, X.; Li, J.; Zhu, X.X.; Benediktsson, J.A. A multispectral and multiangle 3-D convolutional neural network for the classification of ZY-3 satellite images over urban areas. IEEE Trans. Geosci. Remote Sens. 2020, 59, 10266–10285. [Google Scholar] [CrossRef]
  40. Abbasi, M.; Mostafa, S.; Vieira, A.S.; Patorniti, N.; Stewart, R.A. Mapping Roofing with Asbestos-Containing Material by Using Remote Sensing Imagery and Machine Learning-Based Image Classification: A State-of-the-Art Review. Sustainability 2022, 14, 8068. [Google Scholar] [CrossRef]
  41. Apostolska, R.; Shendova, V.; Necevska-Cvetanovska, G. The need of integrated renovation of the existing building stock in North Macedonia. Eur. J. Environ. Civ. Eng. 2022, 26, 3387–3397. [Google Scholar] [CrossRef]
  42. Sinadinovski, C.; McCue, K. 50 years since the Skopje 1963 Earthquake: Implications for Australian building standards. In Proceedings of the Australian Earthquake Engineering Society AEES Conference, Victoria, Australia, 24–25 November 2022; pp. 15–17. [Google Scholar]
  43. Netto, A.F.A.; Martins, R.N.; de Souza, G.S.A.; de Moura Araújo, G.; de Almeida, S.L.H.; Capelini, V.A. Segmentation of RGB images using different vegetation indices and thresholding methods. Nativa 2018, 6, 389–394. [Google Scholar] [CrossRef]
  44. Han, G.D.; Jang, G.; Kim, J.; Kim, D.-W.; Rodrogues, R.; Kim, S.-H.; Kim, H.-J.; Chung, Y.S. RGB images-based vegetative index for phenotyping kenaf (Hibiscus cannabinus L.). PLoS ONE 2021, 16, e0256978. [Google Scholar]
  45. Sulik, J.J.; Long, D.S. Spectral considerations for modeling yield of canola. Remote Sens. Environ. 2016, 184, 161–174. [Google Scholar] [CrossRef] [Green Version]
  46. Tian, H.; Wang, Y.; Chen, T.; Zhang, L.; Qin, Y. Early-Season Mapping of Winter Crops Using Sentinel-2 Optical Imagery. Remote Sens. 2021, 13, 3822. [Google Scholar] [CrossRef]
  47. Yang, Z.; Willis, P.; Mueller, R. Impact of band-ratio enhanced AWIFS image to crop classification accuracy. In Proceedings of the Pecora 17—The Future of Land Imaging…Going Operational, Denver, CO, USA, 18–20 November 2008; pp. 1–11. [Google Scholar]
  48. Barbosa, B.; Ferraz, G.; Gonçalves, L.; Marin, D.; Maciel, D.; Ferraz, P.; Rossi, G. RGB vegetation indices applied to grass monitoring: A qualitative analysis. Agron. Res. 2019, 17, 349–357. [Google Scholar]
  49. Lussem, U.; Bolten, A.; Gnyp, M.; Jasper, J.; Bareth, G. Evaluation of RGB-based vegetation indices from UAV imagery to estimate forage yield in grassland. Int. Arch. Photogramm. Remote Sens. Spat. Inf. Sci. 2018, 42, 1215. [Google Scholar] [CrossRef] [Green Version]
  50. Han, J.; Zhang, Z.; Luo, Y.; Cao, J.; Zhang, L.; Zhang, J.; Li, Z. The RapeseedMap10 database: Annual maps of rapeseed at a spatial resolution of 10 m based on multi-source data. Earth Syst. Sci. Data 2021, 13, 2857–2874. [Google Scholar] [CrossRef]
  51. Deur, M.; Gašparović, M.; Balenović, I. Tree species classification in mixed deciduous forests using very high spatial resolution satellite imagery and machine learning methods. Remote Sens. 2020, 12, 3926. [Google Scholar] [CrossRef]
  52. Kursa, M.B.; Rudnicki, W.R. Feature selection with the Boruta package. J. Stat. Softw. 2010, 36, 1–13. [Google Scholar] [CrossRef] [Green Version]
  53. Das, B.; Rathore, P.; Roy, D.; Chakraborty, D.; Jatav, R.S.; Sethi, D.; Kumar, P. Comparison of bagging, boosting and stacking algorithms for surface soil moisture mapping using optical-thermal-microwave remote sensing synergies. Catena 2022, 217, 106485. [Google Scholar] [CrossRef]
  54. Taghizadeh-Mehrjardi, R.; Schmidt, K.; Amirian-Chakan, A.; Rentschler, T.; Zeraatpisheh, M.; Sarmadian, F.; Valavi, R.; Davatgar, N.; Behrens, T.; Scholten, T. Improving the spatial prediction of soil organic carbon content in two contrasting climatic regions by stacking machine learning models and rescanning covariate space. Remote Sens. 2020, 12, 1095. [Google Scholar] [CrossRef] [Green Version]
  55. Räsänen, A.; Virtanen, T. Data and resolution requirements in mapping vegetation in spatially heterogeneous landscapes. Remote Sens. Environ. 2019, 230, 111207. [Google Scholar] [CrossRef]
  56. Pal, M. Random forest classifier for remote sensing classification. Int. J. Remote Sens. 2005, 26, 217–222. [Google Scholar] [CrossRef]
  57. Pal, M.; Mather, P.M. Support vector machines for classification in remote sensing. Int. J. Remote Sens. 2005, 26, 1007–1011. [Google Scholar] [CrossRef]
  58. Chen, T.; Guestrin, C. Xgboost: A scalable tree boosting system. In Proceedings of the 22nd Acm Sigkdd International Conference on Knowledge Discovery and Data Mining, San Francisco, CA, USA, 13–17 August 2016; pp. 785–794. [Google Scholar]
  59. Belgiu, M.; Drăguţ, L. Random forest in remote sensing: A review of applications and future directions. ISPRS J. Photogramm. Remote Sens. 2016, 114, 24–31. [Google Scholar] [CrossRef]
  60. Mountrakis, G.; Im, J.; Ogole, C. Support vector machines in remote sensing: A review. ISPRS J. Photogramm. Remote Sens. 2011, 66, 247–259. [Google Scholar] [CrossRef]
  61. Jia, Y.; Jin, S.; Savi, P.; Gao, Y.; Tang, J.; Chen, Y.; Li, W. GNSS-R soil moisture retrieval based on a XGboost machine learning aided method: Performance and validation. Remote Sens. 2019, 11, 1655. [Google Scholar] [CrossRef] [Green Version]
  62. Bhagwat, R.U.; Shankar, B.U. A novel multilabel classification of remote sensing images using XGBoost. In Proceedings of the 2019 IEEE 5th International Conference for Convergence in Technology (I2CT), Bombay, India, 29–31 March 2019; pp. 1–5. [Google Scholar]
  63. Maxwell, A.E.; Warner, T.A.; Guillén, L.A. Accuracy assessment in convolutional neural network-based deep learning remote sensing studies—Part 1: Literature review. Remote Sens. 2021, 13, 2450. [Google Scholar] [CrossRef]
  64. Mantero, P.; Moser, G.; Serpico, S.B. Partially supervised classification of remote sensing images through SVM-based probability density estimation. IEEE Trans. Geosci. Remote Sens. 2005, 43, 559–570. [Google Scholar] [CrossRef]
  65. Pinho, C.M.D.d.; Silva, F.; Fonseca, L.; Monteiro, A. Intra-urban land cover classification from high-resolution images using the C4. 5 algorithm. In Proceedings of the ISPRS Congress, Beijing, China, 3–11 July 2008. [Google Scholar]
  66. Gibril, M.B.A.; Shafri, H.Z.; Hamedianfar, A. New semi-automated mapping of asbestos cement roofs using rule-based object-based image analysis and Taguchi optimization technique from WorldView-2 images. Int. J. Remote Sens. 2017, 38, 467–491. [Google Scholar] [CrossRef]
  67. González-Audícana, M.; Otazu, X.; Fors, O.; Alvarez-Mozos, J. A low computational-cost method to fuse IKONOS images using the spectral response function of its sensors. IEEE Trans. Geosci. Remote Sens. 2006, 44, 1683–1691. [Google Scholar] [CrossRef]
  68. Minov, J.; Karadzinska-Bislimovska, J.; Ristovska, G. Health risks related to asbestos exposure in the environment-literature review and present status in Republic of Macedonia. Arch. Public Health 2015, 7, 5–12. [Google Scholar]
Figure 1. Study area and data; (A) geographic location of the study area; (B) thermal imagery; (C) RGB imagery with labeled data.
Sustainability 15 06067 g001
Figure 2. Google Street View examples used for the labeling of the data.
Sustainability 15 06067 g002
Figure 3. Flowchart of the used methodology.
Sustainability 15 06067 g003
Figure 4. Feature selection results by Boruta technique.
Sustainability 15 06067 g004
Figure 5. Classification results using dataset IV, SVM classifier; (TP—true positive; TN—true negative; FP—false positive; FN—false negative).
Sustainability 15 06067 g005
Figure 6. Detail of the classification results (TP—true positive; TN—true negative; FP—false positive; FN—false negative).
Sustainability 15 06067 g006
Table 1. Spectral indices used in this study.
IndexAbbreviationFormulaReference
Excess greenEXG2g − r − b[43,44]
Excess blueEXBg − r − 2bThis study
Normalized difference yellowness indexNDYI(g − b)/(g + b) [45,46]
Normalized difference red-blue indexNDRBI(r − b)/(r + b)This study
Normalized difference red-green indexNDRGI(r − g)/(r + g)[47]
Visible-band difference vegetation indexVIDVI(2g − b − r)/(2g + b + r)[48]
Visible-band difference vegetation indexVARI(g − r)/(g + r − b)[49]
Additional VARIAVARI(g − r)/(g + r + b)This study
Normalized red-green-blue indexNRGBINDRBI − NDYI [45,50]
Table 2. Classification results.
DatasetMethodKappaSensitivitySpecificityPPVNPVBalanced
RF0.7800.8550.9270.8450.9320.891
I SVM0.8130.9400.9000.8210.9700.922
XGBoost0.7930.8610.9330.8560.9350.897
RF0.8240.9280.9180.8410.9650.923
II SVM0.8150.9160.9180.8400.9600.917
XGBoost0.8220.9100.9270.8530.9560.918
RF0.8270.9220.9240.8500.9620.923
IIISVM0.8190.9220.9180.8410.9620.920
XGBoost0.8190.9160.9210.8440.9590.918
RF0.8130.8980.9270.8510.9510.912
IVSVM0.8250.9500.9100.8310.9730.930
XGBoost0.8230.9210.9210.8450.9620.922
Features in; dataset I (RGB, thermal); dataset II (all 63 bands); dataset III (53 bands confirmed by Boruta); dataset IV (best 6 features). Bold indicates highest values.
Disclaimer/Publisher’s Note: The statements, opinions and data contained in all publications are solely those of the individual author(s) and contributor(s) and not of MDPI and/or the editor(s). MDPI and/or the editor(s) disclaim responsibility for any injury to people or property resulting from any ideas, methods, instructions or products referred to in the content.

